AS INDICATOR OF KETOSIS A KETOGENIC DIET
125
BREATH ACETONE AS AN INDICATOR OF KETOSIS WHILE CONSUMING A KETOGENIC DIET Kathy Musa A thesis submitted in conforrnity with the requirements for the degree of Master of Science Graduate Department of Nutritional Science University of Toronto O Copyright by Kathy Musa (1999)
Transcript of AS INDICATOR OF KETOSIS A KETOGENIC DIET

BREATH ACETONE AS AN INDICATOR OF KETOSIS WHILE CONSUMING A KETOGENIC DIET
Kathy Musa
A thesis submitted in conforrnity with the requirements for the degree of Master of Science
Graduate Department of Nutritional Science University of Toronto
O Copyright by Kathy Musa (1999)
National Library Bibliothèque nationale du Canada
Acquisitions and Acquisitions et Bibiiographic Services services bibliographiques 395 Wellington Sweet 395. nie Wsllhgtm Ottawa ON K1A ON4 OmwaOlY K 1 A W Canada cand8
The author has granted a non- exclusive licence dowing the National Library of Canada to reproduce, loan, distnite or seii copies of this thesis in microfonn, paper or electronic formats.
The author retains ownership of the copyright in this thesis. Neither the thesis nor substantial extracts fkom it may be printed or othenvise reproduced without the author's permission.
L'auteur a accordé une licence non exclusive permettant à la Bibliothèque nationale du Canada de reproduire, prêter, distribuer ou vendre des copies de cette thèse sous la forme de microfiche/nlm, de reproduction su. papier ou sur format électronique.
L'auteur conserve la propriété du droit d'auteur qui protège cette thèse. Ni la thèse ni des extraits substantiels de celle-ci ne doivent être imprimés ou autrement reproduits sans son autorisation.
Breath Acetoae as an Indicator of Ketosis While Consuming a Ketogenic Diet Master of Science, 1999
Kathy Musa Department of Nutritional Sciences, Faculty of Medicine
University of Toronto
The ketogenic diet is a high fat, low carbohydrate diet used to treat chidren with
intractable epilepsy. The maintenance of blood B-hydroxybutyrate above 2 mM and
acetoacetate above 0.6 mM is important to the diet's effectiveness. The objectives of this
tliesis were to determine whether the Ketostiu urinary test for ketosis reflects plasma ketones
and whether breath acetone is a better measure of plasma ketones than the urinary ketone test.
it was hypothesised that breath acetone would be a more reliable indicator of the plasma
ketones than the minary ketone test. in adults in acute ketosis, urinary acetoacetate was
s i ~ c a n t l y correlated with plasma acetoacetate (r2 = 0.72, p = 0.0003) and plasma B-
hydroqbutyrate (r2 = 0.52, p = 0.0057). Breath acetone was siCgnificantly correlated with
plasma acetoacetate (r' = 0.88' p -= 0.000 1) and plasma &hydro'rybutyrate (r2 = 0.66, p c
0.000 1). in rats in chronic ketosis, breath acetone was signilicantly correlated witli plasma P-
hydroxybutyrate (8 = 0.73, p < 0.0001). Breath acetone and Ketoniv urinaiy acetoacetate are
both siCdcantly correlated with the plasma ketones.

Bloorview MacMillan Centre, Dairy Farmers of Cuiada, National Sciences and
Engineering Research Couacil of Canada, Stanley Thomas Johnson Foundation, Md
University of Toronto Open Fcllowships are thanked for supporting this study. Ar well 1
would like to express my sincere gratitude to the following people:
M y supervisor, Dr. Stephen Cunnane, for his guidance and patience;
My cornmittee members, Dr. David Jenkins and Dr. McIntyre Bumham, for their input
and wnstructtirl criticism;
Sergei Likhodii, for providing outstanding assistance during the rat -dies;
Mary Ann Ryan, for providing excellent technical support;
Cynthia Dell and Paaladinesh Thavendiranathan, for their contributions dunng our O
weekly lab meetings;
Andrew Mente and Ed Vidgen, for sharing their statistical expertise;
My study subjects, for tolerating an excruciatingly long study day;
My parents, John and Sally Musa, for their unconditional support and love.
.m.
Ill
LIST OF PUBLICATIONS
Likhodii, S. S., Musa, K., Dell, C., Bumham, W. M-, & Cunnane, S. C. The Ketogenic Diet: Dietary fat, ketosis, and seizure protection (submitted for publication).
Thavendiranathan, P., Mendonca, A, Dell, C., Likhodii, S. S,, Musa, K., Iracleous, C., Cunnane, S. C., & Bumham, W. U The MCT Kctogaiic Dia: Effects on animai s e d e modeIs (in press).
ABSTRACT AND POSTER PRESENTATION
Musa, K, Dell, C., Likhodii, S., Mendonca, A, Ryan, M. A, niavendiranathan, D., Burnham, M-, & Cunnane, S. C. Flaxseed Oil and the Ketogenic Diet: Seizure protection and tissue lipids in an animal model. Southern Ontario Neuroscience Association Prognm in Neurodence, University of Toronto, May 1999.
TABLE OF CONTENTS
. . Abstract . . . . . . . . . . . . . . . . . . . . .. - . - - - -. . . . . - . -. . . . . . . . . . . . . . . . . . . . . . . . . . . . . . . . - - . . ,. . . . . . . . . . . . . . . u
Achowledgements . .... .. . .. . . . . . . . . . . ..... . . . . ... . . ... . .. . . . . .. ... . .. . .. . . . .. . . .. . . . . .. -. . . .-. . . . ... Ü i
List of Publications . , . , , , . . . . . . - . . . . . . . . . .. . . - . . . - *. . . . . . . . . . . . . . . . . . . . . . . . . . - . - . - . . . . . . . - - . . . - iv
Table of Contents .. . -. , . . . . . . -. . . . . . - .. .... . . . . - --. . .. . . . . .. . . . . . . . . +. . . - -. . . . . -. . . -. . . . . . . -. .- -. .. . -. v
List of Tables . . . . , . , , . . . . , . -. . . . . . -. . . . . -. .. . - , . . . . . . . . . . . . . . . . .. . . . . . . . - - -. . . . . . -. -. - - .- - -. -. -. -. - - - - - ix
List of Figures . . . . . . . . . . . . . .. . . . . . . . . . . . . . . . - . . .. . . - . . . . . . . . . . . . . . . -. . . . - . . - . . . . . -. . . -. . . . . - -. - -. - - - .-a x
List of Appendices . ... . .. . ... . . ...... .... .. .. . . .. ... ...... . .. . .. . .. . .. . .. . .. . .. . .. ... . .-. .-. -.-.-. ..-. xii ... Abbreviations . . . , . , . . . . . . . . . . . . . . . . . . . . . . . . . . . . . . - . - . . . . . . . . . . . . . , . . . . . .. . . . . . . - . . . . - -. -. . . . . -. - - -. . -. - xu
1. Introduction .......... ...... ... . . . . . . . . . . . . . . . . . . . . . . . . . . . . . . . . . ............ . . . i
2.1 General ..,.. . . ... . .. . ... -. . ..... - .. ... . ...- ..-.. .. ..-...- .- ... . - - .-. ---. - . . . . .- . . 4
b
2.2 History of the Ketogenic Diet . . . . . . . . . . . . . . . . . . . . . . . . . . . . . . . . . . . . . . . . . . . - - . . . . . . - . -. . . 4
2.3 How the Ketogenic Diet Mimics Starva tion . . . . . . . . . . . . . . . . . . . . . . . . . . . . . . . . . . . . . . . . 5
2.4 Ketone Body Metabolism . . . . . . . . . . . . . . . . . . . . . . . . . . . . . . . . . . . . . . . . . . . . . . . . . . . . . . . . . . - .- 7
2.4.1 General Information on Ketone Bodies . . . . . . . . . . . . . . . . . . . . . . . . . . . . . . . . -. 7
2.4.2 Causes of Ketosis . . . . . . . . . . . . . . . . . . . . . . . . . . . . . . . . . . . . . . . . . . . . . . . . . . . . . . . . . . . -9
2.4.3 Ketone Body Production . . . . . . . . . . . . . . . . . . . . . . . . . . . . . . - - -. . . . . . . . . . . . . . . . . . 10
2.4.4 Uptake and Utilization of Ketone Bodies . . . . . . . . . . . . . . . . . . . . . . - . . . . . - . .. 12
2.5 Types of Ketogenic Diets . . . . . . . . .. . .. . .. . . . . . . . . . . . . . . . . . . . . . . . . . .. -. . . -. . . . . - -. . . . -.- 14
2.6 Efficacy of the Ketogenic Diet in Treating Intractable Epilepsy . . . . . . . . . . . . . . ... 15
2.7 Mechanisms of the Ketogenic Diet . . . . . . . . . . . . . . . . . . . . . . . . . . . . . . . . . . . . . . . . . . . . . . . . . . . 17
2.8 Animal Studies involving the Ketogenic Diet . . . . . . . . . . . . . . . . . . . . . . . . . . . . - . . . -. - .-- 17
2.9 Current Methods for Monitoring Ketone Levels . . . . . . . . . . . . . . . . . . . . . . . . . . . . - . . . . .. 19

2.10 Breath Acetone as an Indicator of KetosW ........................................ 19
3 . Objectives ............................................................. .. .......................... 23
3.1 ûverall Objective ...................................................... .. ............... 23
3.2 Specific Objecîives ..................................................................... 23
............................................................................................ 5 . Methods 25
............................................................. 5.1 Overview of Experiments 25
...................................................................................... 5.2 Diets 25
........................................ 5.2.1 Rats .................... .... .. .. 25
...................................... 5.2.2 Humans in an Acute State of Ketosis 29
5.3 Blood Collection Techniques ......................................................... 32
5.3.1 R& ......................................................................... 32
........................................ 5.3.2 Humans ......................... ... 32
5.4 Breath Collection Techniques ........................................................ -33
............................................................................... 5.4.1 Rats 33
........................................................................... 5 .4.2 Humans 35
..................................................................... 5.5 Analytical Methods 37
............................................................... 5.5.1 Bfood Glucose 37
5.5.2 Plasma P-HBA ............................................................... 37
................................................................. 5.5.3 Plasma AcAc 38
................................................................ 5.5.4 Urinary AcAc 43
5.5.5 Breath Acetone ........................................................... ....43
......................................................... 5.5 -6 Statistical Analyses 44
6 . Results .............................................................................................. 46
6.1 Expairnent 1: The Relatiocuhip Bctwcen Breath Acetone a d Pluma f3-HBA inaRatModcloftheKD ............................................................ 46
................................................. 6.1.1 Ovenhew of Experiment 1 47
.................................................... 6.1 -2 Results of Experiment 1 46
............................................... 6.1.3 Discussion of Experirnent 1 - 5 5
6.2 tcperiment 4: KetosU in H d t h y Adults Foîiowing the Ingestion of ......................................................................... Ketogenic Meals 57
6.2.1 Overview ofExperiment 2 ................................................. 57
.................................................... 6.2.2 Results of Experiment 2 58
............................................... 6.2.3 Discussion of Expenment 2 -77
Discussion ......................................................................................... 79
Changes in Metabolites ......................... .... .............................~. 79
7.1.1 Rats ............................................................................ 79
....................................................................... 7.1.2 Humans 80
Breath Acetone and Urinary AcAc as Predictors of Plasma Ketones ........... 80
Implications ............................................................................. 83
........................................................... Achievement of Objectives 84
Future Studies ........................................................................... 85
..................... Potential Clinical Applications of Breath Acetone Analysis 86
References ......................................................................................... 88
Appendices ........................................................................................ 91
....................................................................... 9.1 Table of Contents 91
9.2 List ofTables ............................................................................ 92
vii

viii
LIST OF TABLES
Table 2.1 : Composition of the Classical, MCT. and Modifiai MCT Diets .................. 16
Table 2.2. Breath Acetone Concentrations of Healthy Humans .............................. 21
Table 5.1 : An Oveniew of Expenments that have been Conducted ......................... 26
Table 5.2: Percent Macronutrient Composition of Control and Ketogenic Rodent Diets . 27
Table 5.3 : Composition of Comrol and Ketogelsc Rodent D i a .............................. 28
Table 5.4: Steps Used in Calculating Total Enagy Requirements of Experimental ................................................................................... Subjects 30
Table 5.5: Percent Macronutrient Composition of the Ketogenic Diet Used in the ............................................................................ Hurnan Study 31
Table 5.6. Acetoacetate Solutions Used to Construct a Standard Curve ..................... 41
Table 6.1 : Mean Food Intakes of Control and Ketotic Rats Measured at Various Time .................................................................. Points .......,....... .... 50
Table 6.2. Profiles of Subjects Involveci in Experiment 2 ...................................... 59
Table 6.3 : Results of Linear Regression Analyses ............................................... 78

LIST OF FIGURES
Figure 2.1 : Physiological Events Ofaimng as a Renilt of Fasting or Fat-fding ......... 6
Figure 2.2. Structure of the Ketone Bodies ...................................................... - 8
............... Figure 2.3. Fatty Acid Catabolism and Ketone Body Formation in the Liver 11
........... Figure 2.4. Ketone Body Utilization in the Brain .... ................................. 13
Figure 5.1 : Standard Curve for Acetoacetate ..................................................... 42
Figure 6.1 : Weights of Control and Ketotic Rats ................................................ 48
Figure 6.2. Weight Gain of Control and Ketotic Rats .......................................... -49
Figure 6.3 : Blood Glucose in Control and Ketotic Rats ......................................... 51
Figure 6.4. Plasma 0-HBA in Control and Ketotic Rats ........................................ 52
Figure 6.5. Breath Acetone in Control and Ketotic Rats ....................................... -53 b
Figure 6.6: Breath Acetone as a Predictor of Plasma P-HBAin a Rat Mode1 of the Ketogenic Diet ...................................................................... -54
Figure 6.7 A: Blood Glucose as a Function of Time ........................................... 60 Figure 6.7 B: Changes in Blood Glucose Over Time .......................................... 60
Figure 6.8 A: Plasma B-HBA as a Function of Time .......................................... 61 Figure 6.8 B: Changes in Plasma f3-HBA Over Time ........ .. ................................ 61
Figure 6.9 A: Plasma AcAc as a Function of Time .............................................. 62 Figure 6.9 B: Changes in Plasma AcAc Over Time .............................................. 62
Figure 6 . !O A: Breath Acetone as a Function of Time ......................................... -64 Figure 6.10 B: Changes in Breath Acetone Over Time ...........................-.............. 64
Figure 6.1 1 A: Urinary AcAc as Determined by Ketostix Dipsticks .......................... 6 5 ................................... Figure 6.1 1 B: Unnary AcAc as Detennined Enzymatidly 65
Figure 6.12: The Relationship Between Urinary AcAc Measured with Ketostix Dipsticks and Urinary AcAc Measured Enzymatically for Each Subject .... - 6 7
Figure 6.13: The Relationship Between Urinary AcAc Detennined Enzymatically and ................................................................ Ketostix Urinary AcAc 68
Figure 6.14: The Relationship Between Piasma AcAc and B d Acetone for Each Subjccî . . . . . . . . . . . . . . . . . . . .. . . . . . . . . . . . . . . . . . . . . . . . . . . . .. . . . . . . . . . . . . . . . . . . -. - - .. - -. -. . 69
Figure 6.15: The Rclationship Bctwccn Plasma B-HBA and Bteath Acctone for Each Subject . . . . . . . . . . . - . . . . -. . . . . -. . . . - -. . -. - .. . - - . - - - . . . . . . . . . . . . . - . . . . . - - - - - . . - . . . 70
Figure 6.16: The Relationship Between Plasma AcAc and Corrected Ketostix Urinary AcAc for Each SubjectSubject . . - . . . -. . . . . . . . . . . . ... . . . . . . . . . . , . ., . . . ... . . . . . . . . - . . . .. 7 1
Figure 6.17: The Relationship Between Plasma P-HBA and Correcteci Ketostix Urinary AcAc for Each Subject . .. . . . . . . . . . . . . . . . . . . . . .. . -. -. . . . . . . . . . . . . . . . . . . . . . . . . . . . . . . . . . 72
Figure 6.18: The Relationship Between Plasma AcAc and Breath Acetone . - . . - . . - - . - - - - - .. 73
Figure 6.19: The Relationship Between Plasma B-HBA and Breath Acetone . . . .. . .. . . . . .. -74
Figure 6.20: The Relationship Between Plasma AcAc and Conected Ketostix Urinary AcAc . _. . , . . - -, , -.,. . . . . . . . . . . . , , . - . . . . , . . . . , , . . . . . . . . . . . . . . . . . . . . . - . . . . . - . - - . . - . . . . - - - -.- 75
Figure 6.21 : The Relationship Between Plasma B-HBA and Comected Ketostix Urinary Ac Ac . . . . . . . . . - . . . . - . . . , . . . . . . . . . . . . . . . . . . . . - . . . . . . . . . . . . . . . , , , . . . , . . . . . . - . . - . -. - - -. . - - - . 76
LIST OF APPENDICES
Appendk A Experiment 3: The Effect of a Flaxseed Oil Ketogenic Diet on Seizure Protection in
a Rat Model of Ketosis . . . . - - . . . . . . . . . - . . . . . . . - . . . - . . . . . . . - . . . . . . - . - . . . . . . . . . . . . . . . A-i
Appendix B Evperiment 4: Pentyienetetrazol (PTZ) Dose-Response Study ........ - -.,..,. .... - -.-. ...-... B-i
Appendix C Experïment 5: The Effect of Fat Source on Plasma Ketones, Breath Acetone, and
Seizure Protection m a Rat Model of the Ketogenic Diet . . . . . -. . -. . . . . . . . ... C-i
Appendix D Consent Form for Participation in the Ketogenic Diet Study . . .. . ... . . . -. - -. -. . - -. -. . - - - -. . . ... D-i
AcAc
MW)
AIN
AMP
P-HBA
f3-HBDH
BAf'lI
CHWs)
W s )
HMG-COA
ElMS
KD
LCF A(s)
MCF A(s)
MCT(s)
MJ(s)
PTZ
REE
S CF A(s)
TCA
Acetoacetate
Anti-epileptic h g ( s )
American Institute of Nutrition
Adenosine monophosphate
Q-hydroxybutyraîe
Q-hydroxybutyrate dehydrogemse
Body Mas Index
Cafbohydrate(s)
Fatty acid(s)
3-hydroxy-3-mahylglutaryl CoA
Hexose monophosphate shunt
Ketogenic Diet
Long-chain fatty acid(s)
Medium-chain fatty acid(s)
Medium chain t ngl yceride(s)
Myoclonic jerks
Penty lenetetratol
Resting energy expendituie
Short-chah fatty acid(s)
Tricarboxyiic acid
xii i

CHAPTER 1. INTRODUCTION
The ketogenic diet @CD) is a vay high fat, vay low carbohydrate (CHO) dia that is uocd
clinically to twat epilepsy in children who are either umsponsive to anti-epileptic drugs
(AEDs) o r experience intolerable side effects fiom them and are not candidates for surgical
treatment (Wheless, 1995). The diet is "ketogenic" because it causes the patient to remain in
a constant state of ketosis (Prasad et al., 1996). While in a state of ketosis, the body primarily
oxidizes fat for energy rather than glucose because glycogen stores are depleted (Prasad et
al., 1996). Two intermediates in fatty acid oxidation that the body can fùrther oxidize to meet
its energy needs are the ketones, khydroxybutyrate (B-HBA) and acetoacetate (AcAc).
While ketogenesis occurs mainly within the mitochondria of liver cells, ketone body
rnetabolism can occur in the brain, and to a lesser extent, in the heart, kidney cortex, and O
skeletal muscle et al., 1995).
Aithough the anticonvulsant effects of the KD are recognized clinically, the precise
mechanism of this effect is still obscure (Freeman et al., 1996; Nordli et al., 1997; Prasad et
al., 1996; Swink et al., 1997). Regardless of the mechanism of the KD, its anticonvulsant
effect in humans seems to be dependent upon the maintenance o f blood P-HBA above 2 m M
and of AcAc above 0.6 mM (Huttenlocher, 1976). A reliable measurehdicator of either
plasma P-HBA or AcAc is important in monitoring the enicacy of the diet but is not in
routine clinical use at present.
A third ketone body which is often overlooked in the literature is acetone. Acetone is
generated by the spontaneous decarboxylation of AcAc and is responsible for the sweet odor
of the breath of individuals in ketosis (Mitchell et al., 1995). Unlike 0-HBA and AcAc,
acetone is not an awrgy-rich compound (Mitchell et ai., 1995); nevertheles, its
concentration in the brcath may be a usefil, non-invasive indicator of ketosis.
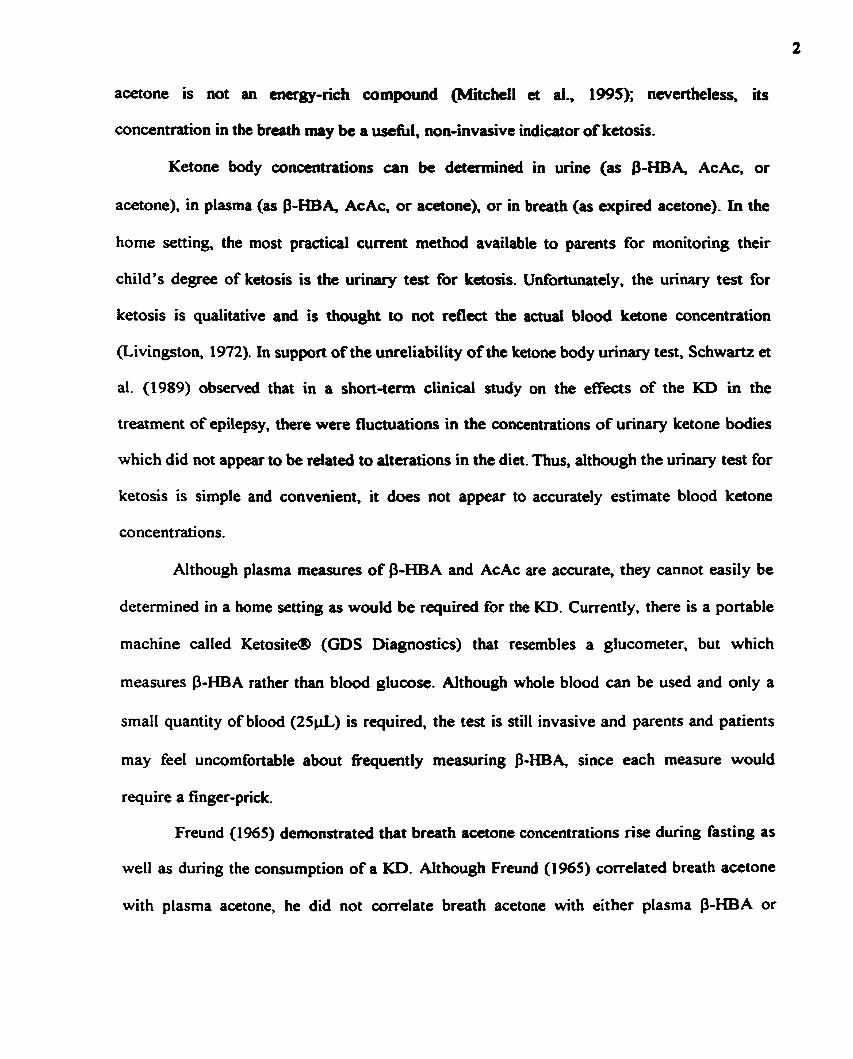
Ketone body concentrations can be determined in urine (as B-HBA, AcAc, or
acetone), in plasma (as P-HBA, AcAc, or acetone), or in breath (as expired acetone). In the
home setting, the mon practicai cunent method available to parents for monitoring their
child's degree of ketosis is the urinary test for ketosis. Unfomuiately, the urinary test for
ketosis is quaiitative and is thought to not reflect the actuaï blaod ketone concentration
(Livingston, 1972). In support of the unreliability of the ketone body urinary test, Schwartz a
al. (1989) observed that in a short-term clinical snidy on the effects of the KD in the
treatment of epilepsy, there were fluctuations in the concentrations of unnary ketone bodies
which did not appear to be related to aiterations in the diet. Thus, although the urinary test for
ketosis is simple and convenient, it does not appear to accuraîely estimate blood ketone
concentrations.
Although plasma meanires of p-HBA and AcAc are accurate, they cannot easily be
determined in a home setting as would be required for the KD. Currently, there is a portable
machine called Ketos i ta (GDS Diagnostics) that resembles a glucorneter, but which
masures P-HBA rather than blood glucose. Although whole blood can be used and only a
small quantity of blood (25&) is required, the test is ail1 invasive and parents and patients
may feel uncornfortable about fiequently measuring B-HBA since each rneasure would
require a finger-prick.
Freund (1 965) demonstrated that breath acetone concentrations rise during fasting as
well as dunng the consumption of a KD. Although Freund (1 965) correlated breath acetone
with plasma acetone, he did not correlate breath acetone with either plasma P-HBA or
plasma AcAc. If a comhtion kiween brcath acetoue .ad pluma P-mA or AcAc does
exist, then in the fiinire, a ponible brath -one anaiyza wuld be connnicted that w ~ l d
enable parents to monitor their child's state of ketosis safély, non-invasively. and as
frequently as needed. Thus, the primary purpor of the experiments deskbed in this thesis
was to determine whether a signifiant. positive correlation exists between breath acetone
and plasma P-HBA and AcAc. This relationship was investigated in a rat mode1 of the I(D,
followed by investigations in adult human volunteers. Aiso. in collaboration with Dr.
Burnharn's group (Department of Pharmaculogy. University of Toronto), seizure proteaion
in this rat modei of the KD was assesseci (set Appendices A, B, and C for experiments
involving seizure testing).
Epilepsy is a chronic condition characterized by a predisposition to recurrent,
spontaneous seizures (Gubaman and BNN, 1997). Epilepsy is as wmmon a disorder as
juvenile-omet diabetes mellitus; its prevalence is approximately 1% and those affected are
often children (Gubeman and Bruni, 1997). Most epileptic children obtain complete or
partial control of their seizures with anti-epileptic drugs (AEDs); however, 2û%-30./. of dl
children with epilepsy m o t rely on AEDs because either their seizures are
intractablelrefhctory (unresponsive to anticonvulsant drugs) or the medications presa-ibed
cause intolerable side effects (Wheless, 1995).
2.2 HISTORY OF THE KETOGENIC DlET
Throughout history, the value of fasting in wntrolling epileptic seizures has been
recognized. For instance, in the 5' century B.C., Hippocrates documented an epileptic man
*ho became completety seizure-fiee upon abstaining fiom food and drink (Prasad et al.,
1996). A h , in biblical tima, Jesus is reported to have cured rveral epileptic children by
asking them to pray and fast (Prasad et ai., 1996). Although the benetits of fasting in
controlling epileptic seizures were recognized anecdotally, so too were the dangers inherent

in completely abstaining fkom food. mus, in 1921, in an attanpt to mimic the physiological
effects of fasting, Wilder developed the KD (Schwartz a ai., 1989).
2.3 EOW THE KETOGENIC DIET M I M I C S STARVATION
The KD is a very high fat, very low CHO diet. Although not immediately apparent,
there are many physiologiul similarities between futing and the wnsumption of a KD
(Nordli et al., 1997; Figure 2.1). In both cases, the body must rely on the oxidation of fatty
acids @As) in order to meet its energy needs (Swink et al., 1997). While fasting, these FAs
are derived fiom the body's fat stores (Swink et al,, 1997); however, during the consumption b
of a W, these FAs are derived mainly nom dietary fats. In either case, the acetyl CoA that is
produced via P-oxidation of the FAs either enters the tricarboxylic acid (TCA) cycle where it
is completely oxidized or it is used in the 3-hydroxy-3-methylglutaryl-CoA (HMG-CoA)
pathway for the production of ketones (Swink et al., 1997). The body then enters a state of
ketosis because the hepatic production of the ketones P-HBA, AcAc, and acetone is
substantiall y increased (Mitchell et al., 1995). Although the precise mechanism is poorly
understood, the ketosis that develops is assumed to be important in seizure control.
Because ketone bodies are derived fkom fat, dietary fats are potentially ketogenic. On
the other hand, because CHOs and, to a lesser extent, proteins are the sources of glucose,
they are antiketogenic. Wilder calculated that by weight, the ratio of ketogenic foods to
antiketogenic foods must be 1.5 or greater to produce ketonemia and ketonuria, and 3 or
greater to optimize seizure control Brasad et al., 1996).

1 Production of acetyl CoA 1
J
Fasting
1
Entrance into the vicarboxylic acid cycle
Consumption of a ketogcnic diet
i
ketone bodies
v w Glucose shortage
B-oxidation of fatty acids i
Production of cl Figure 2.1 Physiological Evcnts Occurring as a Rclult of Fasting or Fat-f~ding
During a fast or the consumption of a ketogenic diet, fatty acids are metabolized to acetyl CoA- Acetyl CoA is then used as a substrate for ketone body production in the 3-hydroxy-3- methylglutaryl-CoA pathway or for ATP production in the tricuboxylic acid cycle. In either case, the body enten a state of ketosis as the production of ketones is incread.
2.4 KETONE BODY METABOLISM
2.4.1 Central Information on Ketone Bodiq
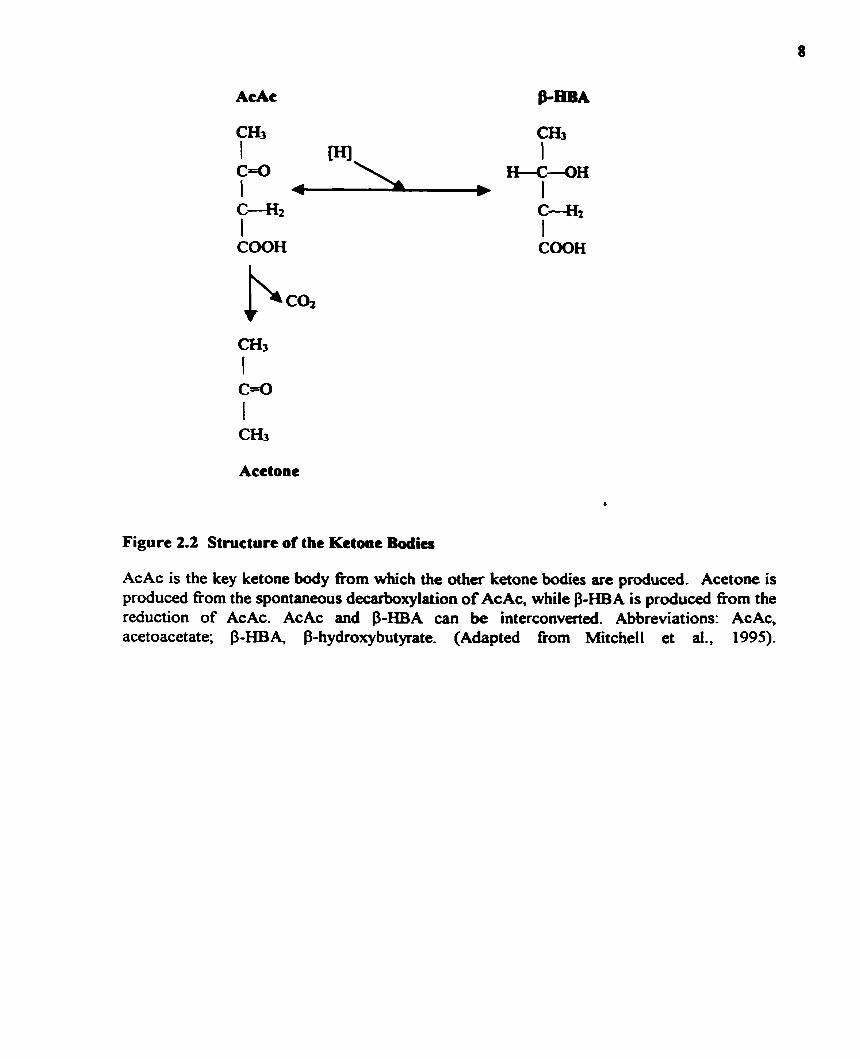
AcAc and acetone are, by definition, ketones since they each contain one ketone
group (Mitchell et al., 1995). P-HBA is not technically a ketone since it does not contain a
ketone p u p (Mitchell et ai.. 1995). The threc moleailes are prescnted in Figure 2.2.
AcAc is the key moleaile h m which the other two ketone bodies, P-HBA and
acetone, an denved (Mitchell et al., 1995). Acetone is produceci by the spontaneous
decarboxylation of AcAc and is responsible for the sweet odor of the breath of ketotic
individuals Nitchel1 et al., 1995). AcAc and $-HBA can be interconverted in the presence of
the enzyme P-hydroxybutyrate dehydrogenase (P-HBDH; Mitchell et al., 1995)- Al1 -these
ketones can be found in blood and urine; however, in breath, only acetone can be detected.
P-HBA and AcAc are energy-rich wmpounds that can replace glucose as the pnmary
energy substrates in the brain, and to a lesser extent, in the heart, kidney cortex, and skeletal
muscle (Mitchell et al., 1995). Although P-HBA is considered to be an energy-rich
compound, it is really a "dead-end" metabolite in that its only known metabolic role is
interconversion with AcAc (Mitchell et al., 1995). Thus, the concentration of AcAc is
extremely important since it is the substrate that is used for energy production as well as
lipogenesis (Mitchell et al., 1995).
Norrnally, in the postprandial state, the blood concentration of P-HBA + AcAc is less
than 0.2 mM (Mitchell et al.. 1995). Hyperketonemia exists when the blood concentration of
AcAc &HBA
Acetone
Figure 2.2 Structure of the Ketone Bodies
AcAc is the key ketone body fkom which the other ketone bodies are produced. Acetone is produced nom the spontaneous decarboxylation of AcAc, while P-HBA is produced fkom the reduction of AcAc. AcAc and P-HBA can be interconverted. Abbreviations: AcAc, acetoacetate; P-HBA, P-hydroxybutynte. (Adapted from Mitchell et ai., 1995)-
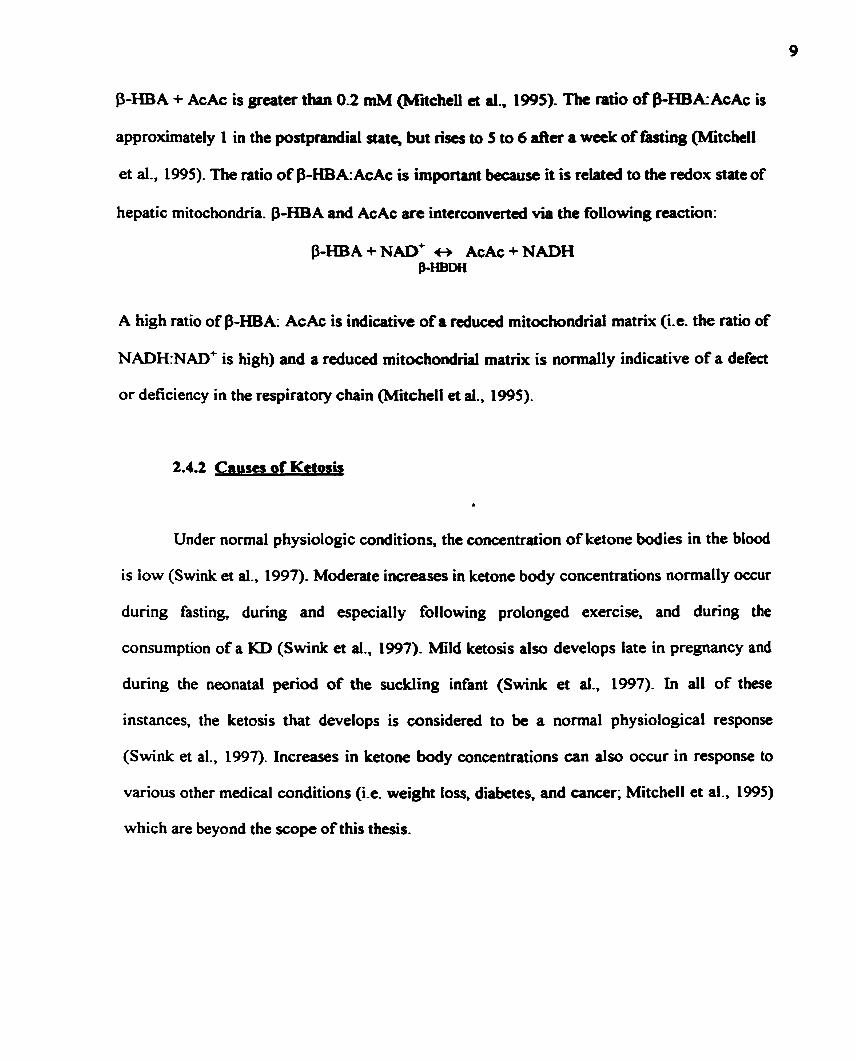
f3-HBA + AcAc is p a t e r than 0.2 mM (MitcheU et aî., 1995). The of P - m k A c A c is
approximately 1 in the postprandial rut+ but rises to 5 to 6 iAa a week of fming @ditchel1
et al., 1995). The ratio of p-HBA:AcAc is important because it is related to the redox state of
hepatic mitochondria. P-HBA and AcAc are intermnverted via the following reaction:
&HBA +NAD' o AcAc + NADH PHBDH
A high ratio of P-HBA: AcAc is indicative o f a reduced mitochondrial matrix (i-e. the ratio of
NADH:NAD' is high) and a reûuced mitochondrid matrix is n o d l y indicative of a d e f a
or deficiency in the respiratory chain (Mitchell et al., 1995).
2.4.2 Causes of Ketosis
4
Under normal physiologic conditions, the concentration of ketone bodies in the blood
is low (Swink et al., 1997). Moderate increases in ketone body concentrations normal1 y ~ c a i r
during fasting, dunng and especially following prolonged exercise, and during the
consumption of a KD (Swink et al., 1997). Mild ketosis also develops late in pregnancy and
dunng the neonatal period of the suckling infant (Swink et al., 1997). In al1 of these
instances, the ketosis that develops is considerd to be a normal physiological responx
(Swink et al., 1997). Increases in ketone body concentrations can also occur in response to
various other medical conditions (Le. weight l o q diabetes, and cancer; Mitchell et al., 1995)
which are beyond the scope of this thesis.
2.4.3 Ketone Bodv Production
Ketogenesis occurs mainly within the mitochondria of liver cells (Mitchell et el.,
1995). Unless medium-chah fatty acids (MCFAs; 6 - 12 carbons) or short-chain fatty acids
(SCFAs; 1 - 4 carbons) are present, long-chain fatty acids (LCFAs; 14 + carbons) are the
primary precursors of ketone bodies (Swink et al., 1997). When there is a decrease in blood
glucose and a concomitant dccrcase in pluma inrulin (ix. during stawation, fat-feeding. or
prolonged, strenuous exercise), fia LCFAs are released fiom adipose tissue triacylglyeerol
stores. These LCFAs are transporteci as fiee FAs in plasma bound to albumin. They cross the
cell membrane of the liver as free LCFAs by binding to cytoplasmic FA binding proteins; the
amount that is extracted by the liver is dependent upon the plasma concentration. In the liver,
LCFAs undergo one of two events: Either they are re-esterified to fonn phospholipids and
triacylglycerol o r they enter hepatic mitochondria via the camitine acyltransferase system to
undergo P-fatty acid oxidation. The acetyl CoA that results can either enter the TCA cycle
and undergo complete oxidation or c m be converteci to AcAc via the HMG-CoA pathway. p-
HBDH then catalyzes the production of P-HBA corn AcAc (Figure 2.3).
Although LCFAs serve as the primsry precursors for ketone body production,
MCFAs and SCFAs are also potentially important precurson for ketogenesis (Swink et al.,
1997). MCFAs and SCFAs are found in relatively high concentrations in matemal miik and
medium chain triglyceride N T ) oil (Swink a al., 1997). Unlike LCFAs, MCFAS and
SCFAs are readily absorbed fiom the stomach into the portal venous system and cross
directly into hepatic mitochondria independently of the camitine acyltransferase system
Blood N o ~ l o n g ~ f a t t Y P a d c r-
AïP+CaA Glycuol-3pborpbr0 (1) G AMP
Cytosol
& Phospbolipids
lnner mitochondrial membrane
Mitochoadrial ; (6) Matrix
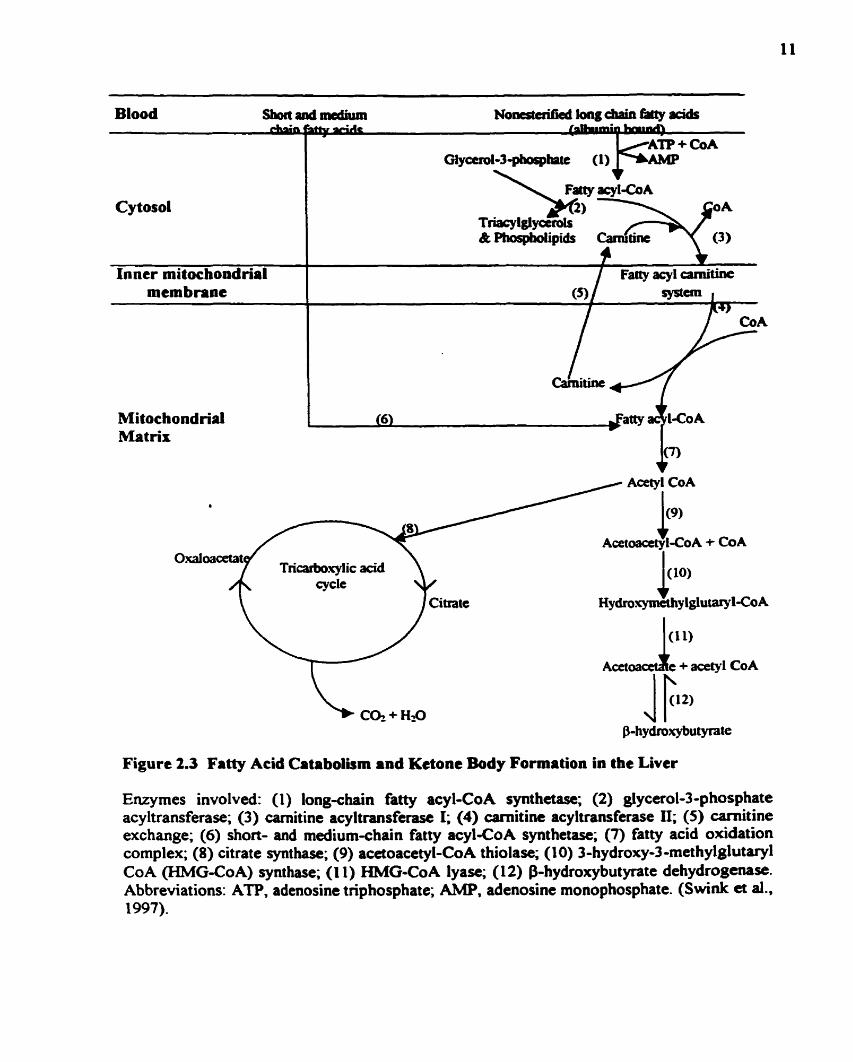
Figure 2.3 Fatty Acid Catabolism and Kctone Body Formation in the Liver
Enzymes involved: (1) long-chain fatty acy 1-Co A synthetase; (2) glycerol-3 -p hosphate acy ltransferase; (3) carnitine acyltransferase 1; (4) carnit ine acy ltransferase II; (5) camitine exchange; (6) short- and medium-chain fatty acyl-CoA synthetase; (7) fatty acid oxidation complex; (8) citrate synthase; (9) acetoacetyl-CoA thiolase; (10) 3-hydroxy-3-methylglut~l CoA (HMG-CoA) synthase; (1 1) HMG-CoA lyase; (12) bhydroxybutyrate dehydrogem~. Abbreviations: ATP. adenosine triphosphate; A M . . adenosine monophosphate. (Swink et al.. 1997).
(Swink et al., 1997). Like LCFAs, M C F h d SCFAs are thea convertecl to acetyl CoA via
Poxidation and are eitha complctely oxidiitd in the TCA cycle or are converted to kctone
bodies via the HMG-CoA pathway (Figure 2.3).
2.4.4 Untakt and Utilization of Kdonc Bodiq
At times of glucose shortrge, kctone M i e s provide the brain with an alteteniive
source of energy (Figure 2.4). The brain is so enicient at utilizing ketone bodies for energy
that dunng prolonged futing, up to twethirds of the brain's energy needs un be supplied by
ketone bodies (Mitchell et al., 1995). Other tissues which are capable of utilizing ketones for
energy include the heart, lcidney cortex, and skeletal muscle.
In generai, tissue uptake of ketone bodies is via specific monOcacbOxylic acid
transporters and is dependent on plasma ketones (Swink et al., 1997). The brains of newborns
utilize ketone bodies for energy at rates 4 - 5 times those of adult brains (Swink et al.. 1997).
In the brain, ketones are important precursors not only for energy metabolism, but
also for Iipogenesis (Figure 2.4). Ketones are important substrates for the synthesis of
cholesterol fatty acids, and other cornplex lipids in the brain that are required for brain
growth and myelination.
Note that whenever the tenn "ketones" or "ketone bodies" is used in reference to
energy metabolism or lipogenesis, it is important to understand that only AcAc participates
directly in these pathways (Mitchell et al., 1995). Although f3-HBA c m be t*en up by the
brain and other organs, it mua first be wnverted to &Ac before it can be used for energy
metabolism and/or lipogenesis (Mitchell et al., 1995).
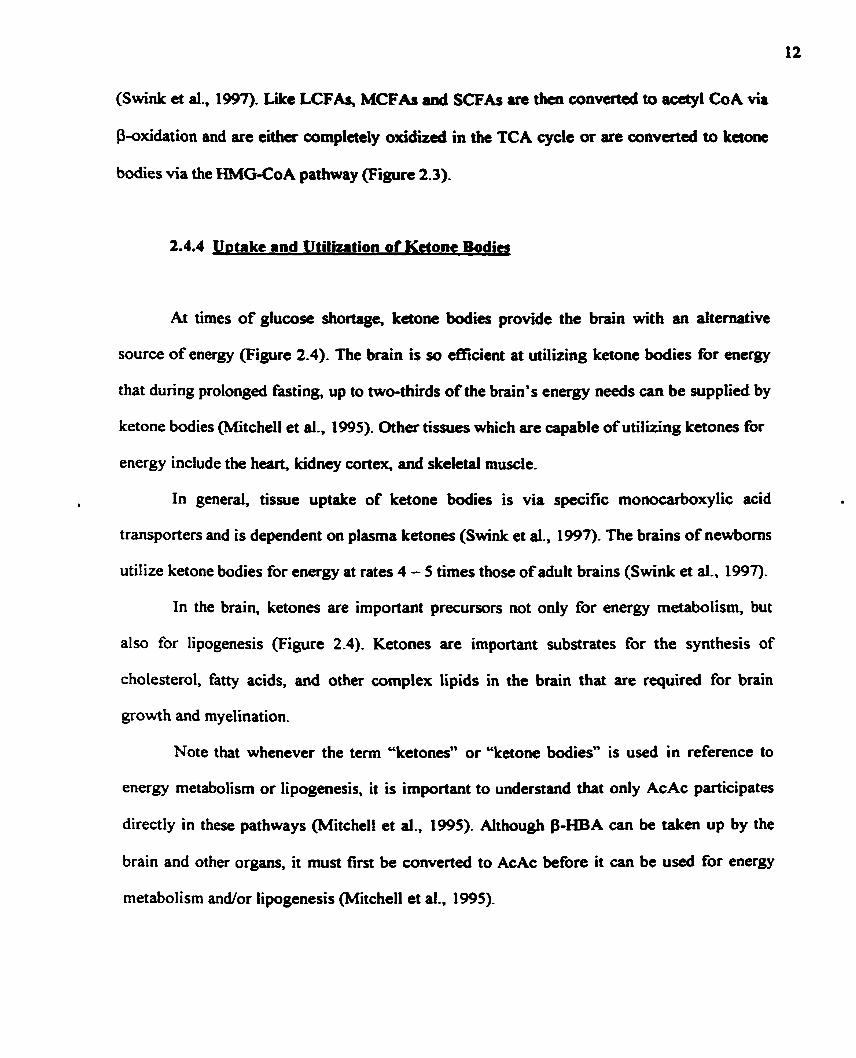
C
L Fatty acids
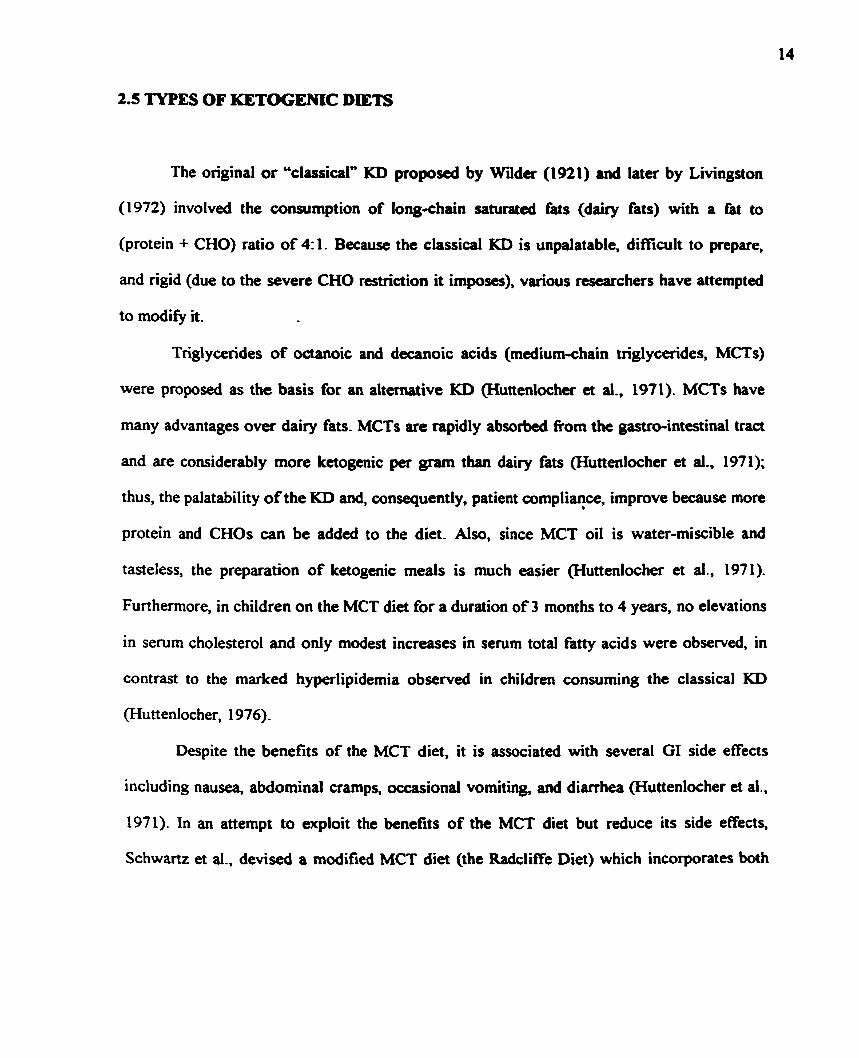
2.5 TYPES OF KETOGENIC DETS
The original or "classicai" KD proposed by Wilder (1921) and later by Livingston
(1972) involved the consumption of long-chain sahinieci fits (dairy fats) with a fat to
(protein + CHO) ratio of 4: 1. Because the classical KD is unpalatable, dificult to prepare,
and rigid (due to the severe CHO restriction it imposes), various researchers have attempted
to modifL it.
Triglycerides of octanoic and decanoic acids (medium-chain triglycerides, MCTs)
were proposed as the basis for an altemative KD (Huttenlocher et al., 1971). MCTs have
many advantages over dairy fats. MCTs are rapidly abwrbed nom the gastro-intestinal tract
and are considerably more ketogenic per gram than dairy fats (Huttenlocher et al., 1971);
thus, the palatability of the KD and, consequently, patient cornpliance, improve because more
protein and CHOs c m be added to the diet. A h , since MCT oil is water-miscible and
tasteless, the preparation of ketogenic meals is much easier (Huttenlocher et al., 1971)-
Furthermore, in children on the MCT diet for a duration of 3 months to 4 years, no elevations
in serurn cholesterol and only modest increases in serum total fatty acids were observed, in
contrast to the marked hyperlipidemia observed in children consuming the classical KD
(Huttenlocher, 1976).
Despite the benefits of the MCT diet, it is associated with several GI side effects
including nausea, abdominal cramps occasionai vomiting, and diarrhea (Huttenlocher et al.,
1971). In an attempi to exploit the benefits of the MC? diet but reduce its side effects,
Schwartz et al., devised a modified MCT diet (the Radcliffe Diet) which incorporates both
long and medium-chah fatty acids (1989). The compositions of the c las id , MCT, and
modified MCT diets are shown in Table 2.1 (Schwutz a ai., 1989).
2.6 EFFKACY OF THE KETOGENIC DIET IN TREATING 1NTRAC"rABLE
EPILEPSY
As long as the appropriate levels of kctosis are achievcd (>2 m M $-HBA in blood,
Xl.6 mM AcAc in blood), the anticonvulsant effects of the KD appear to be independent of
the dietary fat used (Schwartz et al., 1989). In general, when children with intractable
epilepsy are placed on a KD, 300/. to 40.h have a greater than 90% decrease in seizure
frequency, 30% to 40./. have a greater than 50% decrease in seizure frequency, and 2% to
300/0 expenence little or no difference in seimre control (Swink et al., 1997). Although
younger children seem to respond best to the KD and may have better brain uptake of
ketones (Livingston, 1972; Freeman et al., 1996; and Swink et al., 1997), a lack of dietary
cornpliance in older children and adults may explain why results in these populations have
not been as favourable (Prasad et al., 1996). Males and females respond equally well to the
KD. Although the diet is particularly effective in controlling myoclonic, absence, and atonic
(drop) seizures, it has been aiccessfil in children with virtuaiiy any type of xizure (Freernan
et al., 1996).
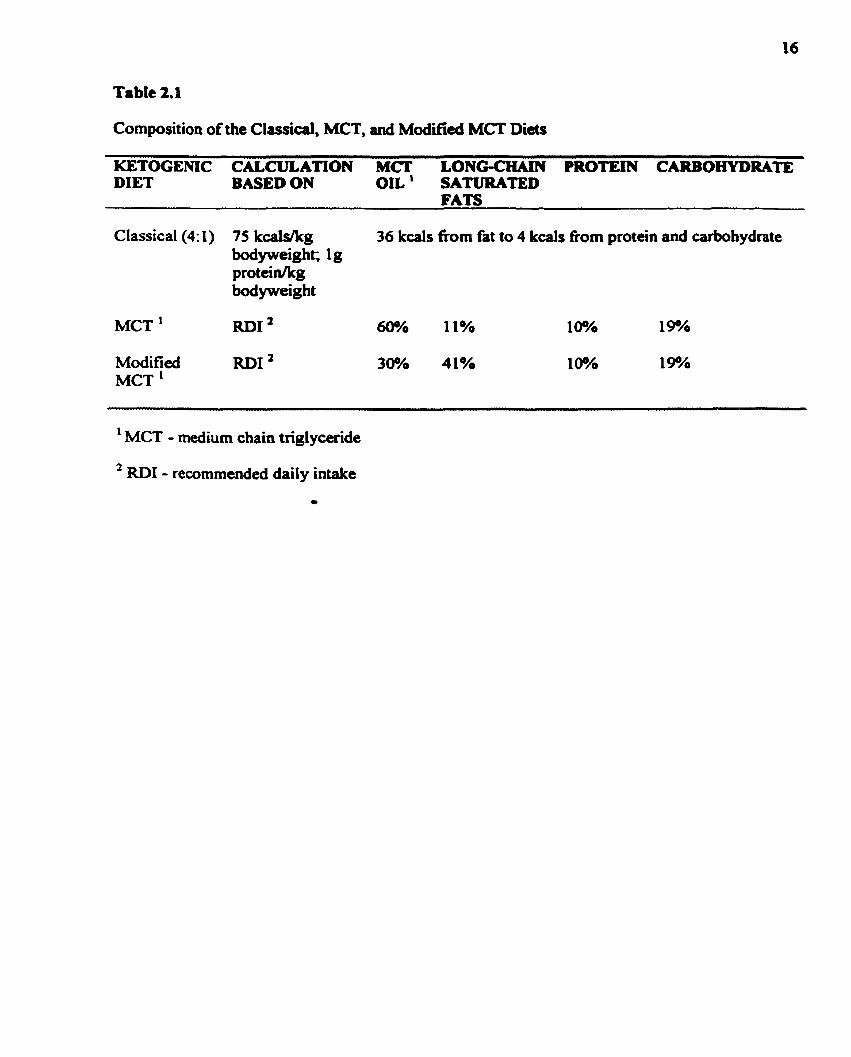
Composition of the Classical, MCT, and Modified MCT Diets
KETOGEMC CALCULATION MCï LONC-CHMN PROTEIN CARBOHYDRATE DIET BASED ON On' SATURATED
FATS
Classical (4: 1) 75 kcalslkg 36 kcals from fat to 4 kcals from protein and csrbohydrate bodyweight; 1g proteinlkg bodyweight
MCT ' RD1 600h 11% 10?4 19%
Modified RD1 30% 41% IO'!% 19?! MCT '
1 MCT - medium chain triglyceride
' RD1 - recommended daily intake
Several theorics cxist regarding the mechanism(s) by which the KD ameliontes
seizures. Hypedipidemia, dehydration, alterations in electrolytes, and acidosis have al1 k e n
implicated in the anticonvulsant effeas of the KD (Nordli and DeVivo, 1997). Another
mechanism of the KD involves its effects on ccrebrai metabolism with a change fiom
dependence on glucose as a primuy enagy aibstrate to the diuect utilization of the ketones
P-HBA and AcAc (Huttenlocher, 1976). Although definitive evidence rcgarding the precise
mechanism(s) of the KD is eumntly lacking, an alteration in cerebral metabolism is plausible
because in chi ldren wit h defective glucose transport across the blood-b rain barrier, the
seizure control attained upon consumption of the KD is most likely due to the ability of the
brain to take up and metabolize ketones instead of glucose (Devivo et al.. 1991). Whether
the W has ant iconwlmt properties due to mechanisms other than alterations in cerebral
metabolism needs to be detemined. Interestingly, there is cumntly no hidy that compares
the KD to a standard AED as the primary treatment (Prasad et al., 1996). Since the KD is
prescribed as a 1st resort (i.e. only afker AEDs have failed to elicit seizure control), it is very
likely that the mechanism(s) of the KD idare not comparable to the mechanisms of current
AEDs.
2.8 ANIMAL STUDIES IEiVOLWNG TEE KETOGENIC DIET
In an attempt to elucidate the mechanism(s) of the KD, r e m c h e r s have tried to
demonstrate seizure protection in various animal models of the KD. Uhlemann and Neirns
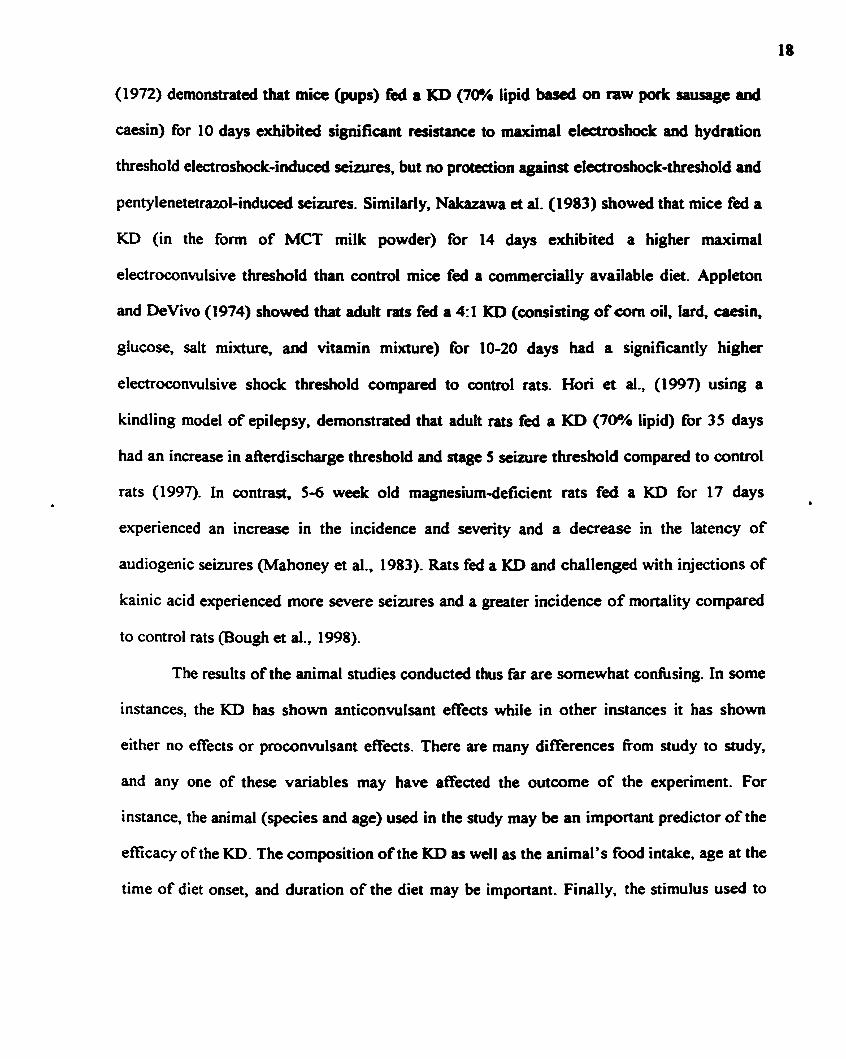
(1972) demonstrated that m i a (pups) fcd a I(D (7û% lipid bued 0x1 RW podc sausage ud
caesin) for 10 days exhibited significant rcsistance to maximai electroshock and hydration
threshold electroshock-induced seinires, but no protection against e1ectroshock-threshold and
pentylenetetrazol-induced seizures. Similarly, Nakazawa et al. (1983) showed that mice fed a
KD (in the f o m of MCT milk powder) for 14 days exhibited a higher maximal
electroconvulsive thres hold than control mice fed a commercial1 y available diet. Appleton
and DeVivo (1974) showed that adult ras fed a 4:I KD (consining o f corn oïl, lard, -in,
glucose, salt mixture, and vitamin mixture) for 10-20 days had a significantly higher
electroconvulsive shock threshold compared to comrol rats. Hori et al., (1997) using a
kindling mode1 of epilepsy, demonstrated that adult rats fd a KD (70% lipid) for 35 days
had an increase in afterdischarge threshold and stage 5 ~eizure threshold compared to control
rats (1997). In contrast, 5-6 week old magnesium-deficient rats fed a KD for 17 days
experienced an increase in the incidence and severity and a decrease in the latency of
audiogenic seizures (Mahoney et al., 1983). Rats fed a KD and challenged with injections of
kainic acid experienced more severe ~ i z u r e s and a greater incidence of mortality compared
to control rats (Bough et ai., 1998).
The results of the animal studies conducted thus fat are somewhat contiising. In some
instances, the KD has shown anticonvulsant effects while in other instances it has shown
either no effects or proconvulsant effkcts. There are many differences from study to study,
and any one of these variables may have affected the outcorne of the experiment. For
instance, the animal (species and age) usai in the study may be an important predictor of the
efficacy of the KD. The composition of the KD as well as the animal's food intake, age at the
tirne of diet onset, and duration of the diet may be important. Finally, the stimulus used to
induce the seizures may aot appropriately challenge the anticonvulunt effccts of the KD (Le.
the convulsant may not k presented at the mon optimal time during the f d i n g pcriod. may
surpass the threshold of the I(D, or may operate via a mcchanism entircly diffaent from that
of the KD). Until the confusion surrounding the baies outlincd above is resolved, there will
continue to be a lack ofuniformity in fUture animal studies of the KD.
2.9 CURRENT METHODS FOR MOrYITORING KETONE LEVELS
Despite a lack of understanding regarding the mechanism(s) of the IED, its d i n i d
effectiveness in controlling seizures seems to be dependent upon the maintenance of blood p-
HBA above 2 m . and of AcAc above 0.6 mM (Huttenlocher, 1976). Thus, a reliable
measurehdicator of plasma $-HBA and AcAc might be useful in monitoring th9 efficacy of
the KD, both in clinical and home settings. Although plasma masures of 8-HBA and ACAC
are accurate, one must remember that blood sampling fiom children is partisulady invasive -
especially when fiequent monitoring of ketones is desired. The urinary dipstick test for
ketosis is non-invasive and convenient; however, it is qualitative and impractical becaux it
appears not to reflect actual blood ketone concentrations (Livingston, 1972; Scwartz et al.,
1989). Thus, there is n d for a reliable, noninvasive rneasure of plasma ketones.
2.10 BREATH ACETONE AS AN INDICATOR OF KETOSIS
An indicator of ketosis that has been largely overlooked in the literature is the acetone
in expired, alveolar air. Acetone, which is produced spontaneously fiom the decarboxylation
of AcAc, is a normal breath constituent and its concentration varies Born individual to
individual (Table 2.2).
Although there is some information in the literature regarding breath acetone in
humans, there is very little regarding changes in breath acetone in response to prolonged
fasting or the consumption of a KD. In fa* to my knowledge, only Freund (1965) and
Freund and Weinsier (1 966) have examined changes in breath acetone in response to these
dietary manipulations.
Freund (1965) demonstrated that levels o f breath acetone rise while fasting and
consuming a KD, but drop immediately upon the consumption of a CHO-rich meal. In a
~ b s e q u e n t study (1966). Freund and Weinseir showed that:
i.) After an over-night fast and the ingestion of 25 ml of MCT oil, breath acetone r i r s
rapidly, reaches a maximum 6 h after ingestion, and cetums to base-line values 18 h
afier ingestion;
ii.) Ingestion of increasing amounts of MCT results in increased acetone;
iii.) The acetone response is suppressed by the ingestion of sucrose; and
iv.) Maximal acetone increaxs with prolongation of fming before ingestion of MCT.
Although Freund (1965) and Freund and Weinseir (1966) demonstrated that breath
acetone increases and decreases in response to dietary manipulations, they did not examine
correlations between breath acetone and plasma f3-HBA and AcAc. If a correlation between
breath acetone and plasma P-HBA and AcAc does exist, then parents may be able to rely on
breath acetone meanrrements to quickly and non-invasively monitor their child's degree of
ketosis. Breath acetone cwld potentialty become the safest and most reliable measure of
ketosis for parents and clinicians who have had to othenvise rely on unreliable (urine) or
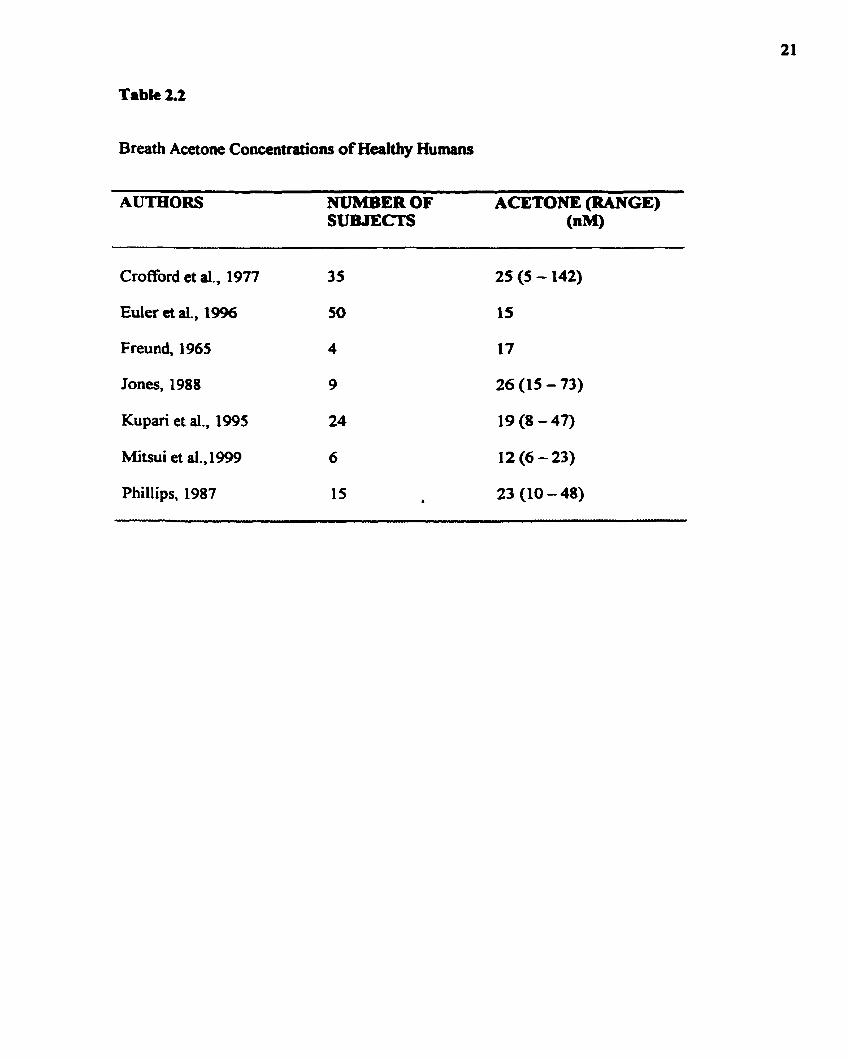
Table 2.2
Breath Acetone Concentrations of Healthy Humans
-ER OF ACETONE (RANGE) SUBJECTS (nM)
Crofford et al., 1977 35 25 (5 - 142)
Euler et al., 1996 50 15
Freund, 1965 4 17
Jones, 1988 9 26 (15 - 73)
Kupari et al., 1995 24 19 (8 - 47)
Mitsui et al., 1999 6 12 (6 - 23)
Phillips, 1987 15 b 23 (10 - 48)
invasive (blooâ) tests-
ConeIations bctwœn brea!h -one a d pluma PHBA and AcAc wae examincd h
a rat mode1 of the KD as wcll as in adult human volunteers in =te kaosis. The relationship
between urinary AcAc and the plasma ketones wu dm aunined in d u l t human volunteers
in acute ketosis. In collaboration wifh Dr. Bumhards group (Department of Pharmacology,
University of Toronto), seizure protection in rais consuming a KD was assessed (see
Appendices A, B, and C for a<paiments involviag -e testing).

CHAPTER 3. OBJECTIVES
3.1 OVERALL OBJECTIVE
To determine whether breath acetone reliably predicts plasma kctone levels in an animal and a human mode1 of ketosis.
Develop a sydem for breath acetone collection and anafysis in a rat model of the KD.
Examine wneIations between b r a th acetone and plasma AcAc and B-HBA in a rat model of the K..
Develop a system of breath acetone collection and analysis for humans.
Examine correlations between breath acetone and plasma AcAc and P-HBA in adult Golunteers in acutdshort-term ketosis.
Examine correlations between urinary AcAc and plasma AcAc and p-HBA in adult volunteers in acutelshort-tenn ketosis.
CHAPTER 4. HYPOTHESES
In rats and humaas wasuming a KD, a significant, positive correlation will be obwved between breath acetonc and the plasma kaones, AcAc and 8-HBA
a Breath acetone will be a better indicator of plasma AcAc and $-HBA than the urinary test for ketosis.
CHAPTER S. METHODS
5.1 OVERWEW OF EXPERIMENTS
An overview of the experiments that have k e n conducted is presented in Table 5.1
5-2 DIETS
5.2.1 Ras
The diets used to feed the control and ketotic rats of experiment 1 were purchased
from Dyets Inc. (Bethlehem, Pennsylvania). The AIN 93G diet that was fed to control rats
did not require any modification; however, the 3 - 5 3 (fat: protein + CHO) KD was prepared
by adding some CHO (in the fonn of maltose dauin) and more fat to a mqdified AIN 93G
diet. The fat source added was flaxseed oil (purchased from a local health food store). The
percent composition @y weight) of the control diet and the flaxseed oil KD is shown in Table
5.2.
The modified AIN 93G diet was developed so that when the appropriate amount of
fat (tlaxseed oil) was added to it, it would contain exactly the urne concentration of
ingredients (protein, vitamins, minenls, cellulose, salt, and soybean oil) in glkg diet as the
AIN 93G diet. When flaxseed oil was added to the modified AIN 93G diet, the diet twk on a
very runny consistency and the oil separated fiom the rest of the diet. To overcome this
dilemma, more cellulose was d d e d to the KD. In addition, sucary1 was added to enhance the
taste and texture of the KD. Due to the addition of cellulose and sucaryl to the KD, the
nutnents of this diet were diluted compared to the control diet (Table 5.3).
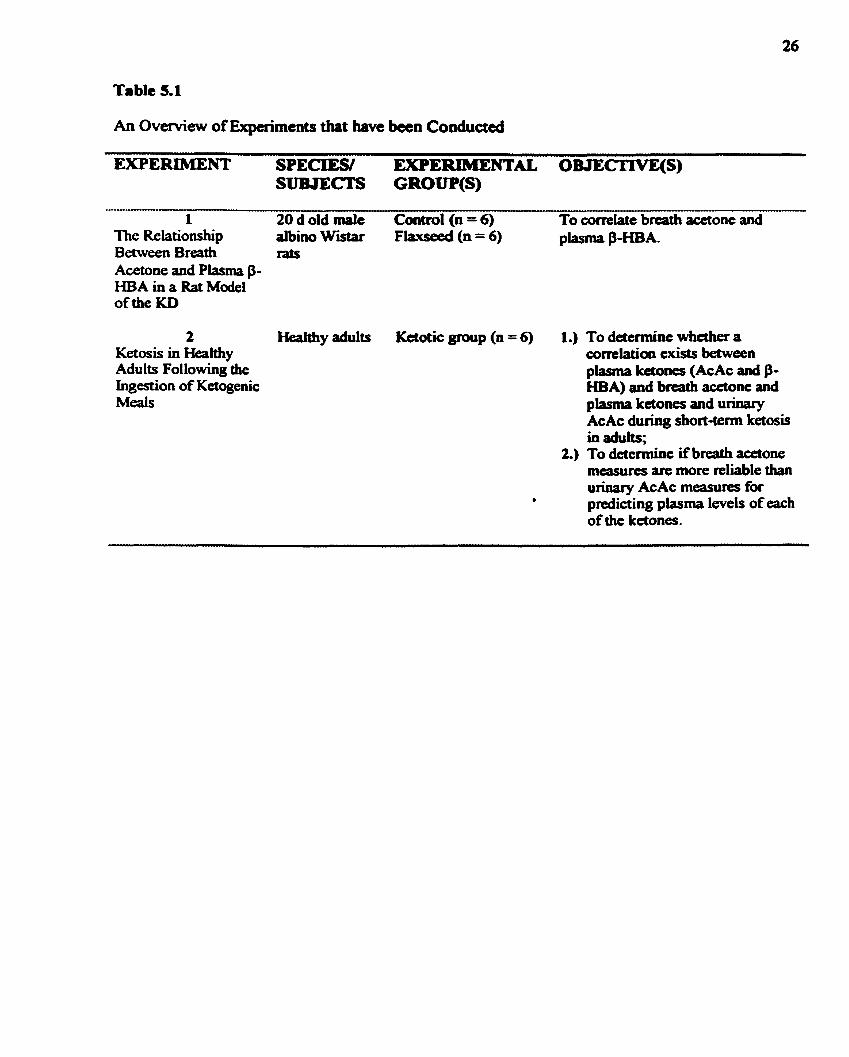
An Overview of Expaiments that have k e n Conduaed
1 20 d d d malt Cmtrol (n = 6) To correlate brcath acetone and The Relationship albino Wlstar Fhxseed (n = 6) piasma P-HBA- Between Breath rats Acetone and Plasma P- HBA in a Rat Mode1 of the KD
2 Healthy adults Ketotic group (n = 6) 1.) To determine whether a Ketosis in Healthy correlation cxists between Adults Following the plasma ketones (AcAc and P- Ingestion of Ketogenic HBA) and breath acetone and Meals plasma ketones and urinary
AcAc during shoct-tenn ketosis in adults;
2.) To determine if breath acetone measures are more reliable than urinary AcAc measures for
a predicting plasma levels of each of the ketones-
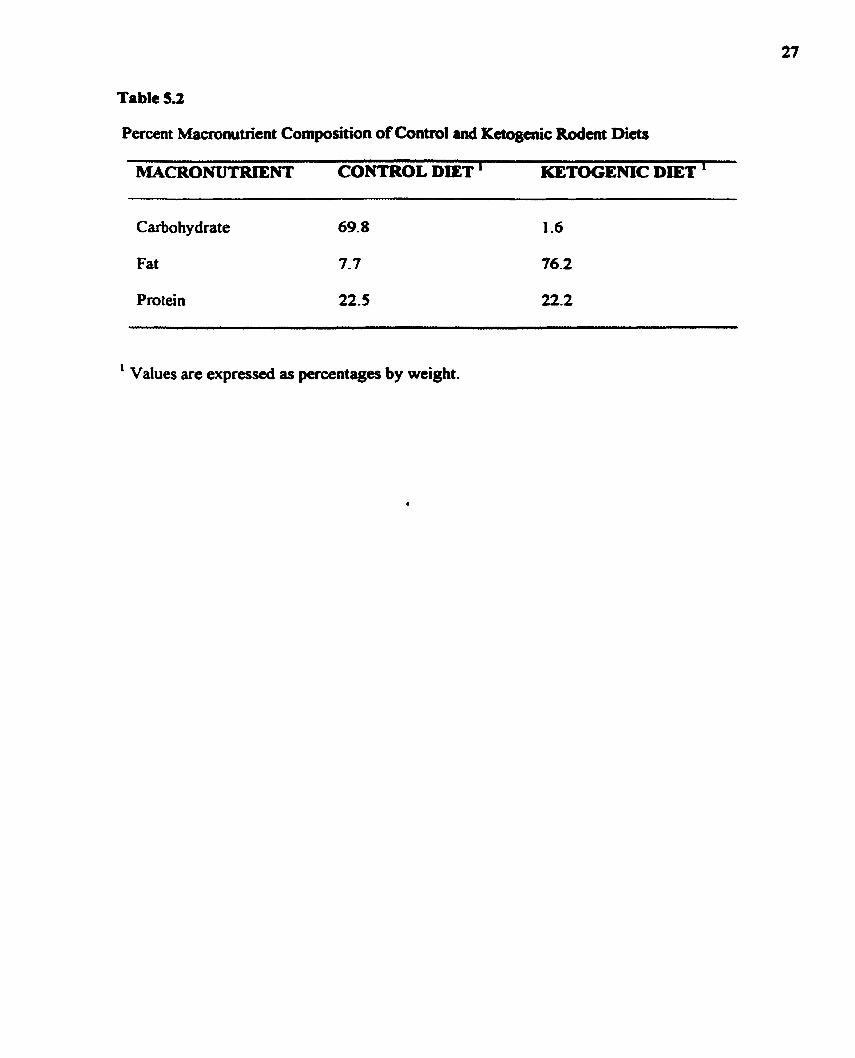
Table 5.2
Percent Maaonutrîent Composition of Contml and Keîogeriic Rodent D i a
MACRONUTRIENT CONTROL DIET ' KETOGENIC DiET '
Carbohydrate
Fat
Protein
1 Values are expressed as percentages by weight.

Table 5.3
Composition of Contml and Ketogenic Rodait Di&
INGREDIENT CONTROL DIET ' KETOGENKC DIET KETOCENlC DIET WITHOUTTHE HrITH'rHE ADDITION OF ADDITION OF CELLULOSE AND CELLULOSE AND SUCARYL ' SUC- '
Casein
Cornstarch
Dextrose
Sucrose
Cellulose
Soybean Oil a
t-Buty lhydroquinone
Salt Mix
Vitamin Mix
L-cystine
Choline Bitartrate
Sucaryl
Flaxseed Oil
' All values are expressed as percentage of diet, by weight.
Salt and vitamin mixes were mgar-fkec in both the control and ketogenic diets.
another four days (age 24 d - 27 d). At 28 d of age, tht rats wae fcd the final 3 5 1 flaxseed
oil KD until the tenninatioa of the experiment. Conv~l and expcrimental rats were allowed
to consume food ad lib. In order to acclimitize the rats to the KD, the rats were fed a 1: 1
flaxseed oil KD for four days after being weaned (age 20 d - 23 d) and then were fed a 2:1
fiaxseed oil KD for
52.2 Aumans in an Acutt State of Ketasiq
Total energy needs for each subject were detemined using various calculations
(Table 5.4). Fust, using the subject's weight, height, age, and gender, the subject's resting
energy expenditure (REE; kcallday) was estimated using a Harris-Benedict equation. Then,
the REE was multiplied by a physical activity factor. Finally, the thermic efféct of food was
calculated by taking 1% of the sum of the REE and physical activity calories. Each subject's
total energy requirements were calculated as the sum of the REE, physical activity energy
needs, and themic effect of food energy needs. Clinically the KD is calorie-restncted
(Freeman et al., 1996); thus, only 75% of the subject's total energy needs were provided.
The ketogenic meals that were fed to the subjects had a fat:(CHO + protein) ratio of
3.8:L The KD was made up of only two ingredients: Beatnce 35% whipping cream
(purchased from a local grocery store) and ProMd Protein Suppkment (purchased from the
Specialty Food Store, the Toronto Hospital for Sick Children). The diet compositions are
shown in Table 5.5. Instead of giving one large meal to each subject, each subject received
four small meals, one meal every three hours. Each of the four muils w u identical in
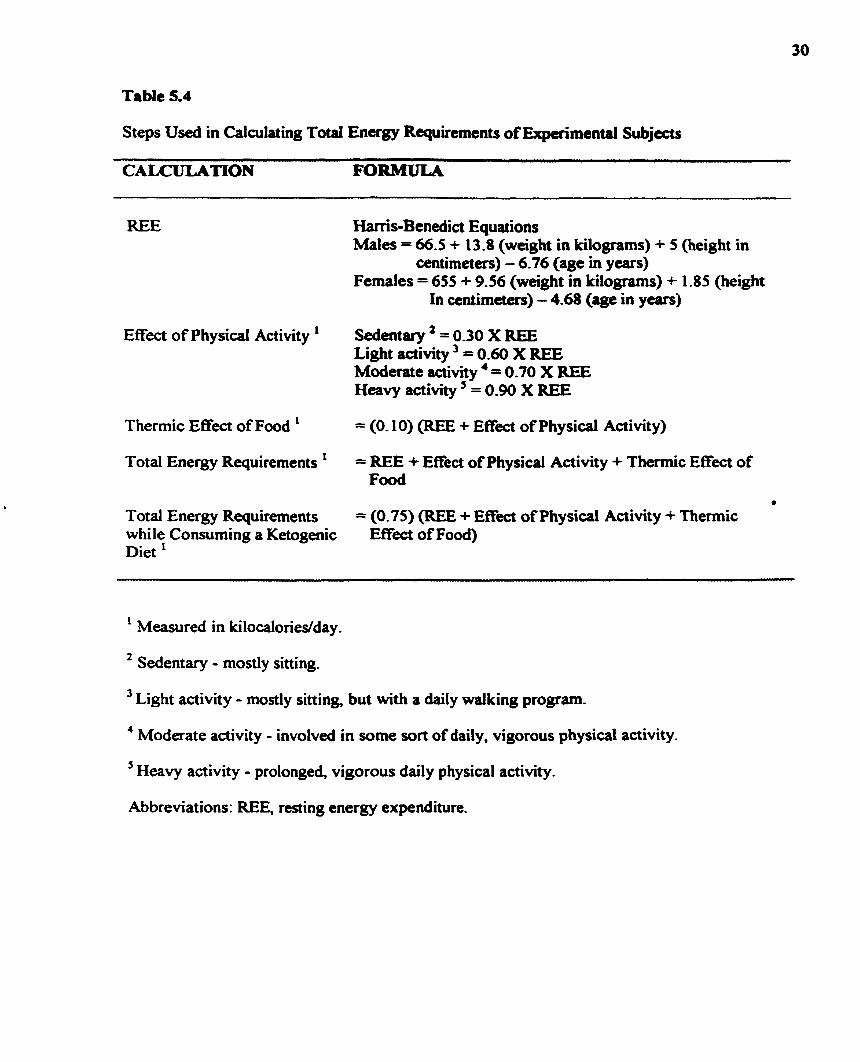
Table 5.4
Steps Used in Caiculating Total Energy Requirements of Expcrimentd Subjects
CALCULATlON FORMULA
REE Harris-Benedict Equations Males = 66.5 + 13.8 (wcight in kilogrirms) + 5 (height in
centimeters) - 6.76 (age in years) Females = 655 + 9.56 (weight in kilognms) + 1.85 (height
In centimeters) - 4.68 (age in years)
Efféct of Physical Activity ' Sedentary ' = 0.30 X REE Light activity = 0.60 X REE Moderate activity ' = 0.70 X REE Heavy activity = 0.90 X REE
Therrnic Effect of Food ' = (0.10) (REE + E f f i of Physical Activity)
Total Energy Requirements = REE + Effect of Physical Activity + Thennic Effect of Food
Total Energy Requirements = (0.75) (REE + Efféct of Physical Activity + Thennic while Consuming a Ketogenic E f h t of Food) Diet '
' Measured in kilocalories/day .
2 Sedentary - mostly sitting.
Light activity - mostly sitting, but with a daily walking program.
4 Moderate activity - involved in some son of daily, ngorous physical activity.
5 Heavy activity - prolonged, vigorous daily physical activity.
Abbreviat ions: REE, resting energy expendinire.
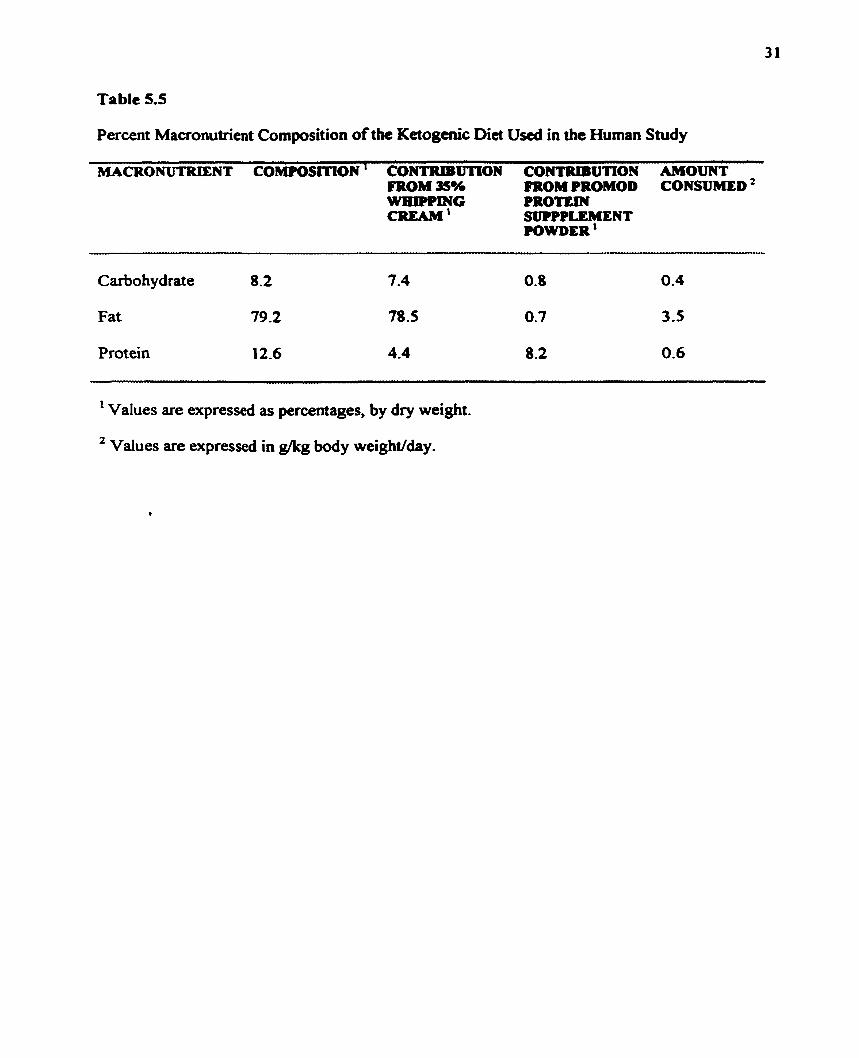
Table 5.5
Percent Macronutrient Composition of the Ketogcnic Diet Uscd in the Human Study
MACRONUTRIENT COMPOSlTtON ' CONTRIBUTION CONTRIBUTION AMOUNT FROM 36% FROM PROMOD CONSUMED WHIPPPlG PROTEM CREAM' SUPPPLEMENT
POWDER '
Carbo hydrate 8.2
Fat 79.2
Protein 12.6
~ - - ~ ~ ~ - ~
' Values are expressed as percentages, by dry weight.
Values are expressed in gkg body weight/day.
32
mmposition and caloric density, and altogether, the four m a l s provide6 the abject with
75% of hidher caloric requirements.
5.3 BLOOD COLLXCITON TECHNIQUES
5.3.1 Rats
On each sampling day, approximately 200 wl of venous blood w e n collected from
each rat. Blood was collected by inserting a 23 G 1 needle (Becton Dickinson Company;
Franklin Lakes, New Jersey) into one of the veins of the tail and 75 mm heparinized capillary
tubes were used to collect the blood and keep it flowing continuously. The needle that was
inserted was e s t nit (using pliers) to a length of about 2 cm and was lefi in the tail while 1
blood was being collected. Blood samples were then dispensed into 2.5 ml heparinized
microfige tubes and kept on ice until centrifugation. During cenuifùgation, blood sarnples
were spun at 2500 rpm for 9 min in order to separate the plasma fiom the other blood
components. Plasma samples were then dispensed into 500 pl Ependorftubes and stored at
-20°C until analysis.
5.3.2 Humrns
Human blood was collected fiom fingertips d e r pricking a fingertip with a
Glucorneter Elite lancet pen (Bayer, Etobicoke, Ontario). 75 mm heparinized capillary tubes
were used to c o l l e 375 pl of blood. Blood sunplcs wae then dispensed into 2.5 ml
heparinized microfbge tubes and kept on ice until centrifbgation. During centrifbgation,
blood simples were spun at 2500 rpm for 9 min in order to separate the plasma fiom the
other blood components. Plasma sarnples were thcn analyzcd immediatcly for AcAc and f3-
HBA.
5.4 BREATE COLLECTION TECHNIQUES
5.4.1 Rats
Ten 4 L pickling jars were purchased fiom a
supplies. The exact volume of each jar was measured
could hold- Results indicated that the volume of O
approximately 4.2 L.
retail store specializing in restaurant
by weighing the mass of water that it
each of the ten pickling jars was
The lid of each jar was made of maal and when screwed ont0 the jar, an airtight
system for rat breath collection was created. Since it was necessary to draw breath samples
f?om each jar via a syringe, a septum had to be installed in each of the jar lids. First, a 2 mm
hole was drilled into the centre of each lid. Then, a septum was secured ont0 the outside of
the lid by attaching a triangular piece of metal ( a h with a 2 mm hole drilled into its centre)
over each septum. In tum, the triangular piece of metal was secured to the outside of the lid
by three screws.
A system of rat breath collection and analysis had to be developed. Several issues had
to be addresseci. The amount of time that the rats should be left in the air-tight pickling jars
was uncertain. If the rats were not left in the pickling jars for a sufficient amount of time,

breath acetone would not accumulate to detectable levels; howcver, if the rats were left in the
pickling jars for too long, too much moisture would develop within the jar, and acetone
would be lost in this moisture; as well, there was some concern over the levels of C a that
might be accumulating in the gas-tight jars. The type of acetone standard that should be used
(liquid vs. gaseous), as well as the accuracy of the acetone standard (especially over time)
were also issues that had to be addressed.
In order to cullect breath samplcs fiom the rats, each rat was left in an airtight
pickling jar. In the beginning of the experiment when the rats were quite small, the rats were
lefi in the jars for a total of 20 min. As the rats gained weight towards the end of the
experiment, the rats were Ieft in the pickling jars for 10 min- Breath acetone concentrations
were expressed in nhUkg/min because the concentration of acetone increased linearly with
time (Le. the acetone concentration detected atter 10 min was roughly half of the acetone *
concentration detected after 20 min).
For breath acetone analysis, a 1 ml breath sample was taken trom the jar and injected
into the gas chromatograph. Meanires were taken to ensure that CO2 within the jars was not
accumulating to dangerous levels. A 450 g male albino Wistar rat was kept in one of the jars
for 20 min. Breath samples were drawn and stored in vacutainers every 2 min and were later
analyzed for CO2 by isotope ratio mass spectroscopy. Results showed that f i e r 20 min, CO2
levels rose to 5000 ppm, which is the upper acceptable limit (www.vaisala-corn). It is
important to note that the 450 g rat used in this CO2 experiment was approximately 100 g
heavier than the heaviest rat that was breath sampled in the actual experiment. Thus the
possibility of CO2 building up within the jars and afkting the respiratory rata of smaller
rats was ruled out.
The acetone standard used to quanti@ the acetone peaks on the chiomatograms was a
gaseous standard. A gaseous (as opposecl to a liquid) acetone standard was used because the
gaseous standard more closely mimicked the acperimentai situation. fhe acetone standard
was created by injecting a known volume of acetone into one of the pickling jars. The
acetone standard had to be prepared on each day of breath acetone andysis because, over
time, the acetone concentration dccreaseà, probably due to its adsorption into the glas walls
andor the metal Iid of the pickling jar.
5.4.2 Humans
As with the rats, a system of breath acetone collection and analysis had to be
developed for humans. Human subjects were asked to exhaIe into a gas collection bag w
(purchased fiom Quintron Instrument Company, Milwaukee, Wisconsin). The bag has two
0.5 cm diameter holes in it. Initially, the alveolar p o ~ i o n of the breath samples was collected
by inserting a 1 mm glass, gas-tight syringe into one of these holes. Immediately afier the
breath sample was collected, it was injected into the gas chromatograph for acetone analysis.
Unfortunately, using this method, too much moisture was collected in the sample, and a
water peak interfered with the acetone peak obtained on the chromatogram. The fiow rate
and temperature settings were manipulated in an attempt to separate the water and acetone
peaks; however, the attempts were unsuccessfiil.
The gas collection bags were still used to collect breath samples; however, instead of
collecting the breath sample d ù e d y fiom the bag into the syringe, the breath sample was
collecteci fiom the bag into an evaaiated 11.5 mm g l u s hik via a vacutainer needle
quipped on the gas collection bag. Collecting the breath sample into a g l u s tube eliminated

the problem of having ta , much moimre in the breath sample; however. a new problem
arose. Breath samples could not be stored in the glass tubes for longer than 6 min without
losing a significant iunount of the acetone. W e hypothesized that this was probably because
as the temperature of the breath sample dropped in the g l a s tube, the acetone became
adsorbed on the g las walls. Several attempts were made to release the acetone fiom the g l a s
walls. Since the boiling point of acetone is 56.5 OC (Handbook of Chemistry and Physks,
were incubated in an incubator (6J°C), were blow-dried with a hair-dryer, and were kept
under 65°C water, but the full acetone concentration was never retrieved, and what was
retrieved was not consistent. Thus, breath samples were follected in evacuated g l a s tubes
and were analyzed immediately for acetone.
The acetone standard used to quanti@ the acetone pealu obtained on the v
chromatograms was a liquid (rather than a m u s ) standard. A gaseous acetone standard
prepared in an 11 -5 mm evacuated tube would have been ideal; however, there was too much
error inherent in preparing this gaseous acetone standard (i-e. too many senal dilutions would
have been necessary and acetone cannot be stored in these glass tubes). Thus a liquid
acetone standard was p r e p a d by diluting a known volume of acetone in a known volume of
water. Again, the standard was prepared on each day of breath analysis because, over time,
the concentration of the acetone standard decreaseâ.

5.5 AnalyticcrI Methods
5.5.1 Blood Glucosg
Blood glucose measurements were mide using the Glucometer Elite glucorneta and
Glucometer Elite test strïps (Bayer, Et obicoke, Ontario).
5.5.2 Plasma B-HBA
Plasma f3-HBA was determined using an enzymatic assay kit (Sigma, St. Louis,
Missouri). The enzymatic reaction involved in the assay is as follows:
In the presence of the enzyme, P-hydroxybutyrate dehydrogenase (8-HBDH), P-HB A
is oxidized to AcAc. During this oxidation, an equimolar amount of NAD' is reduced to
NADH. Since NADH absorbs light at 340 nm, the increase in absorbante at 340 nm is
directly proportional to the P-HBA concentration in the sample.
The materials provided within the p-HBA enzyrnstic assay kit include:
i.) P-HBA Reagent (lyophilized preparation containing NAD, 4.6mM oxamic acid and
buffer, pH 7.6);
ii.) B-HBDH (50 units/ml, with buffh and stabilizers, pH 7.6); and
iii.) B-HBA Calibrator Solution (50 mgldl, with presewatives).

38
To analyze the $-HBA in each of the plasma samples, 3.0 ml of B-HBA Reagent and
50 pl of plasma were pipette. into 4.5 ml acrylic cuvettes. As well, calibrators were prepared
by pipetting 50 pl of the PHBA Calibrator Solution and 3.0 ml of f3-HBA Rugent into 4.5
ml acrylic cuvette. A blank was prepared by pipctting 50 J o f d e i o n i d wata and 3.0 ml of
of P-HBA Reagent into a 4.5 ml acrylic cuvette. Initial absocbance r d i n g s wert measured
at a wavelength of 340 nm, using water as a reference. 50 J of &HBDH were then added to
each of the cuvettes (except the reference) and 1 5 min later, final absorbance readings were
measured, again at a wavelength of 340 nrn.
To determine B-HBA concentrations, the following calculations were made:
i .)
ü. )
iii.)
[B-HBA] (mM) = (M sarnple - A A blank) X 104 X 0.096
[P-HBA] (mM) = @A sample - AA blank) X 50 0.096 (AA calibrator - AA blank)
Final [P-HBA] (mM) = Average of i.) and ii.)
5.5.3 Plasma AcAc
The enzymatic assay for plasma AcAc was developed by Harano et al (1985). The
enzymatic reaction involved in the assay is as follows:
4-
P-HBA + NAD' + AcAc + NADH $-HBDH
Normally, in the presence of P-HBDH, P-HBA is oxidized to AcAc with a
concomitant, equimolar reduction of NAD' to NADH. Although the fonrad reaction is
thermodynamically favored, the reaction un be forced in the opposite direction by increasing
the pH and the concentration of NADH. Due to Le Chatelier's principle, an increax in the
pH and the concentration of NADH would result in the oxidation of NADH to NAD' with a
concomitant, equimolar rduction of AcAc to PHBk As long as the conanvation of
NADH far exceeds that of AcAc, AcAc would be the limiting rcactant in the reaction. Since
NADH absorbs light at a wavelength of 340 nm, the decreasc in absorbante at 340 nm would
be directly proportional to the AcAc concentration in the plasma sample.
The reagents required for the AcAc enzymatic assay include:
i.) 0.25 M Triethanolamine Buffer (pH 7)
ii.) NADH
iii.) Oxamic acid
iv.) B-HBDH (55.6 unitdml)
Al1 of the above reagents were purchased from Sigma Diagnostics except the enzyme
which was purchased fiom Toyobo Company Ltd., Tokyo Japan. The following calculations
illustrate how the reagents with the required concentrations were prepared:
i.) A 0.5 g/dl solution of oxamic acid was prepared by disiolving 0.05 g of oxamic acid
in 10 ml of deionized water.
ü.) A 3.0 m M solution of NADH was prepared by dissolving 0.0106 g of NADH in 5 ml
of deionized water.
iii.) A 2.8 M solution of ammonium sulfate was prepared by dissolving 3.7 g of
ammonium sulfate in 10.0 mi of deionized water.
iv.) A 55.6 unitdm1 enzyme solution was prepared by dissolving 500 units of P-HBDH in
9.0 ml of 2.8 M ammonium sulfate solution.
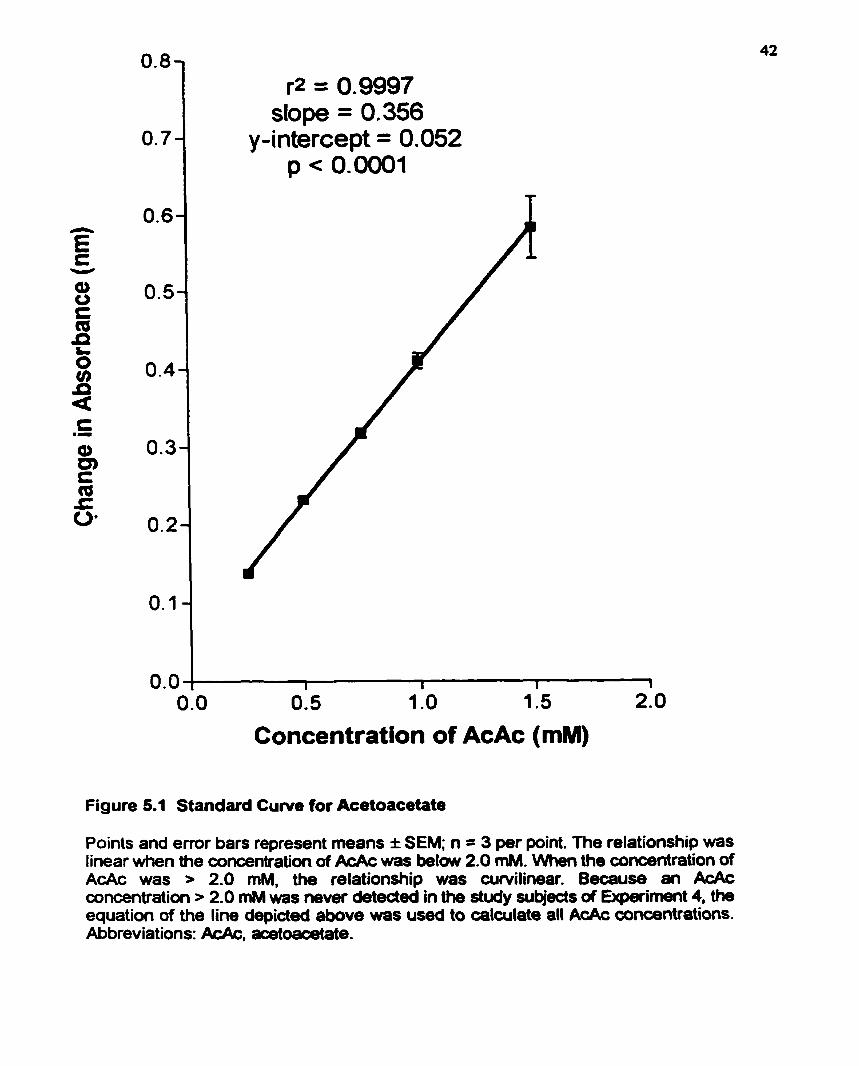
Pnor to analyring the AcAc content in each of the plasma samples. a standard am
showing the relationship b e e n AcAc and change in absorbance a! 340 nm had to be
constructed. Thus, the Ac Ac concentrations shown in Table 5.6 were prepared using lithium
acetoacetate and deionized water.
To analyze the AcAc in each of the solutions shown in Table 5.6, 386 pl of
triethanolamine buffer, 200 pl of oxamic acid, 100 fl of NADH, and 50 pl of each of the
LiAcAc standard solutions were pipeted into 1.5 jd acrylic cuvettes. Each LiAcAc solution
was anaiyzed three times (Le. 50 pi of each LiAcAc solution were dispensed into three
different cuvettes). A blank was prepared by replacing the 50 pi of LiAcAc with 50 of
deionized water. Iriitial absorbance readings were measund at a wavelength of 340 nm, using
the blank as a reference. 20 pl of B-HBDH were then added to each of the cuvettes (except
the blank), and 15 min later, final absorbance readings were measured, again at a wavelength
of 340 nm. The changes in absorbance were plotted againa the actual h c ~ c wncentrations,
and a smooth curve (described by a pdynomial, fourth order equation) was generated. (Note:
The plasma samples were analyzeâ in exactly the same way as the LiAcAc sarnples were
analyzed, only the 50 pl of LiAcAc were replaceci with 50 pi of plasma.) The AcAc standard
curve was constructeci on several occasions using freshly prepared LiAcAc solutions and
reagents. Each time, a polynomial fourth order equation best described the relationship
between AcAc concentration and change in absorbance. Although the relationship was
reproducible, the generation of a slightly curvelinear relationship as opposed to a linear one
is unclear. Nevertheless, the relationship was linear for the range of AcAc (O mM - l .S mM)
that was expected (Figure 5.1).

Table 5.6
Acetoacetaîe Solutions Used to Constntct a Standard Curve
CONENTRATION VOLUME OF VOLUME OF OF AcAc ' STOCK DEIOlNUED
SOLUTION ' WATER '
' Measured in mmoYL.
* Stock solution had a concentration of 25 mM-
' Measured in pL.
r2 = 0.9997 dope = 0.356
y-intercept = 0.052 p < 0.0001
Concentration of AcAc (mM)
Figure 5.1 Standard Cuwe for Acetoacetate
Points and emr bars represent rneans I SEM; n = 3 per point. The relationship was Iinear when the concentration of &Ac was below 2.0 rnM. \Nhen the concentration of AcAc was > 2.0 mM, the relationship was curvilinear. Because an AcAc concentration > 2.0 mM was never deteded in the study subjects of Expriment 4, the equation of the Iine depicted above was used to calculate al1 AcAc concentrations. Abbreviat ions: AcAc, acetoacetate.

An unfortunate discovery made aAer Experiment 1 had been complettd was that
plasma samples that were spiked with AcAc. fiozen, and analyzed later lost apploximately
92% of their AcAc. It seems thu the enzymatic assay for AcAc described in this section is
only good for fiesh plasma samples; that is, plasma sunples had t o k uulyzed immediately
in order to asses their AcAc content because AcAc is a very volatile compound. Hence,
reliable plasma AcAc values are available only for the subjects of Expriment 2.
Urinary AcAc was rneasured using the methods described for plasma AcAc, only 50
pl of urine replaced the 50 pl of plasma Again, the enzymatic rssay for urinary AcAc was
used only on fresh (not fiozen) urine samples. A h , urinary AcAc was measured
qualitatively using Ketostix dipsticks (Bayer, Etobicoke, Ontario). The principle behind the
Ketostix dipstick urinary test is that if AcAc is present in the urine, it will react with
nitroprusside, resulting in the development of coloun ranging from buff'pink to rnaroon. The
d o u r that develops is then matched (as best as possible) to a colour found on a colour chart
and a corresponding AcAc concentration (fiom an exponential scale) is then allotted-
5.5.5 Breath Acctong
Breath acetone in rat and human breath samples wu analyzed using a Hewlett
Packard gas chromatograph (mode1 5890) equipped with a calumn purchased fkom Supelco,
Pennsylvania. The glass column. 6 R in length with an intemal diameter of 4 mm, w u
packed 6 t h 80/100 carbopack- C/O.l% S V - 1000.
i .)
ii.)
iii.)
iv. )
v-)
vi.)
vii.)
The following parameters were set on the gas chromatograph:
Helium pressure: 55 1bhn2
Air pressure: 40-50 Win2
Hydrogen pressure: 20 lb/in2
Flow rate: 20 mVmin
Oven temperature: 75-100°C
Injection temperature: 1 SO°C
Detection temperature: 20°C
The acetone peaks obtained fiom the breath samples were calibrated against either a
gaseous acetone standard (Experimedt 1) or a liquid acetone standard (Experiment 2)- In
either case, the acetone standard was prepand on uch day of breath analysis because, over
time, the acetone concentration decreased, probably due to its adsorption into the glass walls
of the vessel.
5.5.6 Statisticrl Analvses
To compare group means in Experiment 1 a repeated measures two-way analysis of
variance (ANOVA) was conducted. A repeated measures one-way ANOVA was conducted
to compare group means in Experiment 2. The software used to conduct the ANOVA tests
was SPSS. When the ANOVA test indiutcd that p u p means wae signifiantly different, a
post-F (Tukey's Honcstly Significant Dinetence) test was conducted using the sohare,
Statistica, to daennine where these significant diffaences existed. For correlation analyses,
linear and nonlinear regnssion analyses were conducted using the software, Pnsm.

CHAPTER 6. RESULTS
6.1 EXPERIMENT 1: THE RELATIONSHIP BETWEEN BREATH ACETONE AND
PLASMA PHBA IN A RAT MODEL OF THE KD
Twelve 17 d old male albino Wistar pups atfived at the facility with their dam. The rats
were given thee days to acclimatize to their new environment and at 20 d of age, the rats were
weaned and randomly divided into either a wntrol or ketogenic diet group. Rats were housed
individually in plastic cages with wood chip bedding and were placed on a 12 h lightll2 h dark
cycle (lights were turned on at 7:ûû AM). At 20 d old, the control rats were given the AIN 93G *
diet and consurnad it ad lib. In o r d a to assist them in adjusting to the 3 -91 (fat: protein + CHO)
KD, rats in the ketogenic d i a p o u p were gradually weaned ont0 the diet; that is, at 20 d of age,
these rats were given unlimited access to a 1:l KD, and then at 24 d of age, they were given
unlimited access to a 2: 1 KD. Ad lia feeding of the 3.5: 1 KD did not ocair until the rats were 28
d old. The added fat source in the, 1: 1,2: I , and 3.5: 1 KDs was flaxseed oil.
The rats were weighed at 20 d of age and approximately every four days thereafter until
the rats were 53 d old. Blood glucose, piasma P-HBA, and breath acetone were measured
approximately every four days, bcginning when the rats were 28 d old and ending when the rats
were 49 d old. Food intakes were measured at various time points throughout the expenment. At
53 d of age, the rats undement a PT2 s e k e test. For details on this seizure test, refer to
Appendix A.
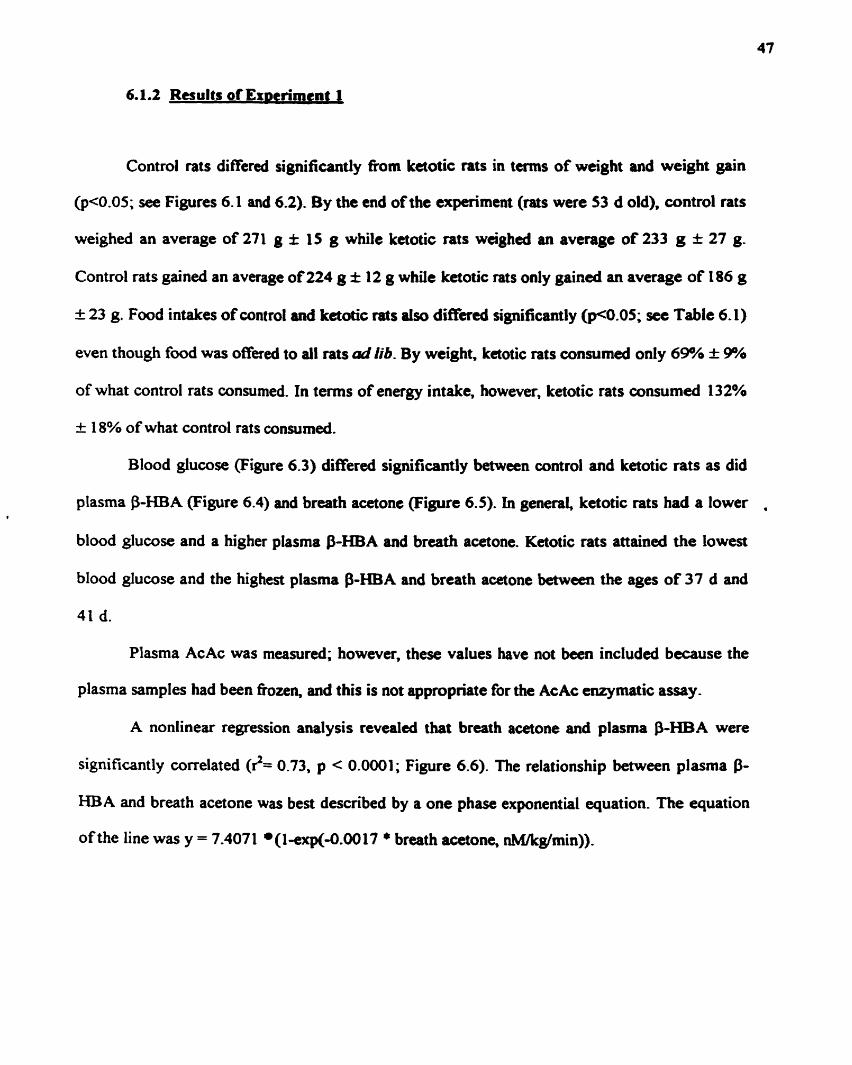
Control rats differed significantly from ketotic rats in tems of weight and weight gain
(p<O.OS; see Figures 6.1 and 6.2). By the end ofthe experiment (nts were 53 d old), wntrol rats
weighed an average of 271 g * 15 g whilc ketotic rats weighed an average of 233 g * 27 g.
Control rats gained an average of 224 g f 12 g while ketotic rats only gained an average of 186 g
+ 23 g. Food intakes of control and ketotic rats ai= d i f f i significantly QHI.05; sec Table 6.1)
even though food was offered to al1 rats od lib. By weight. ketotic rats consumed only 69% I 9%
of what control rats consumed. In terrns of energy intake, however. ketotic rats consumeci 132%
+ 18% of what control rats consumed.
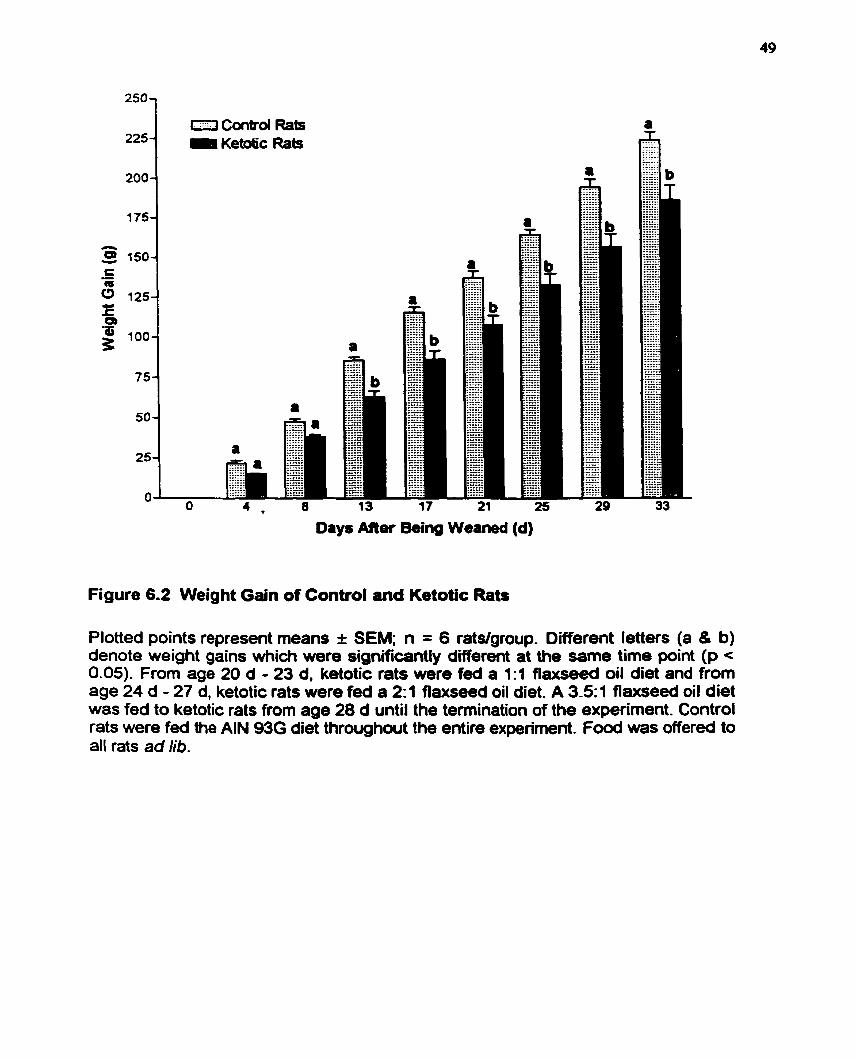
Blood glucose (Figure 6.3) differed significantly between control and ketotic rats as did
plasma P-HBA (Figure 6.4) and breath acetone (Figure 6.5). In general, ketotic rats had a lower
blood glucose and a higher plasma P-HBA and breath acetone. Ketotic raïs attained the lowest
blood glucose and the highest plasma P-HBA and breath acetone between the ages of 37 d and
41 d.
Plasma AcAc was measured; however, these values have not been included because the
plasma amples had been fiozen, and this is not appropriate for the AcAc enzymatic a-y-
A nonlinear regression analysis revealed that breath acetone and plasma P-HBA were
significantly correlated (?= 0.73, p < 0.0001; Figure 6.6). The relationship between plasma P-
HBA and breath acetone was best described by a one phase exponential equation. The equation
of the line was y = 7.4071 (1-exp(9.00 17 + breath acetone. nM&g/min)).
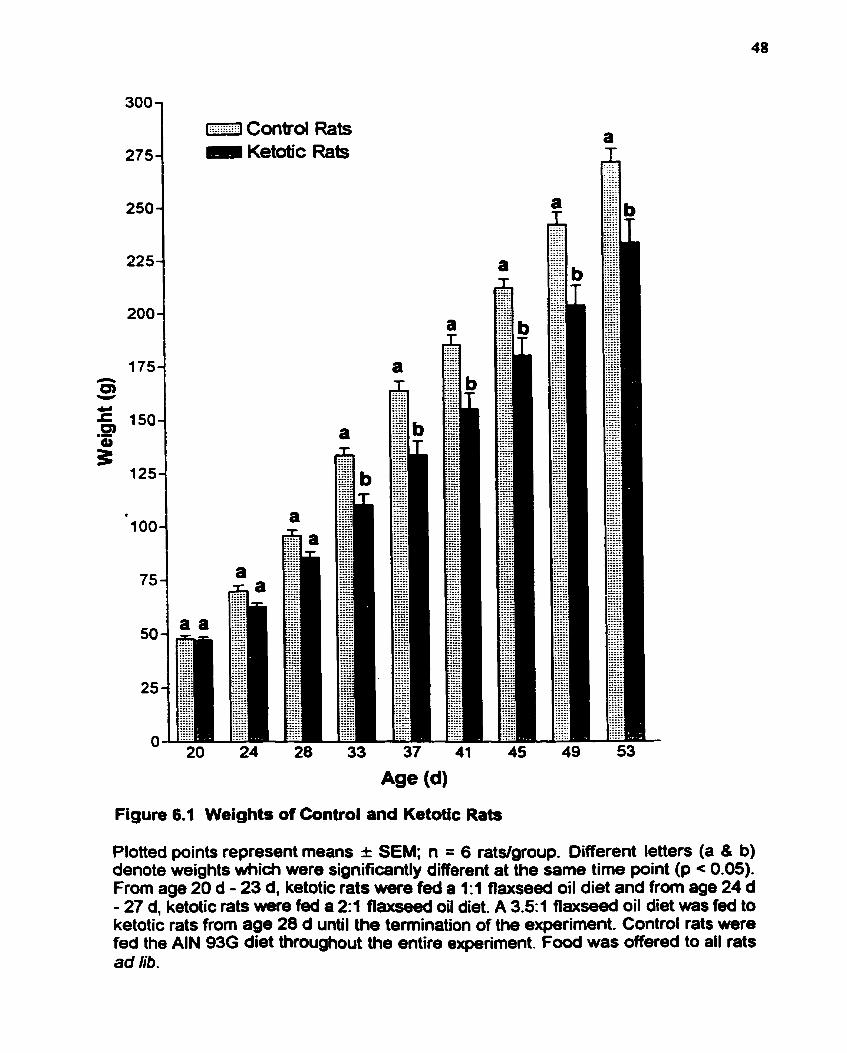
Figure 6.1 Weights of Control and Ketotic Rats
Plotted points represent means I SEM; n = 6 ratdgroup. Oifferent letters (a 8 b) denote weights which were significantly different at the same time point (p < 0.05). From age 20 d - 23 d. ketotic rats were feâ a 1:l flaxseed oil diet and from age 24 d - 27 d, ketotic rats wiere fed a 2:l fiaxseed oil diet. A 3.51 flaxseed oil diet ws fed to ketotic rats from age 28 d until the temination of the expariment. Control rats were fed the AIN 93G diet throughout the entire experiment. Food was offered to al1 rats ad lib.
Days Mer Being Weaned (d)
Figure 6.2 Weight Gain of Control and Ketotic Rats
Plotted points represent means I SEM; n = 6 ratslgroup. Different letters (a 8 b) denote weight gains which were significantly different at the same time point (p c 0.05). From aga 20 d - 23 d. ketotic rats were fed a 1:l fiaxseed oil diet and from age 24 d - 27 d, ketotic rats were fed a 2 1 flaxseed oil diet. A 3.5~1 flaxseed oil diet was fed to ketotic rats from age 28 d until the termination of the experiment. Control rats were fed the AIN 936 diet throughwt the entire experiment. Food was offered to all rats ad lib.

Table 6.1
Mean Food Intakes of Control and Ketotic Rats Measurod a! Various Time Points
AGE (d) ' CONTROL KETOTIC ./. WIGHT ./. ENERGY CROUP * CROUP INTAKE OF INTAKE OF
CONTROL CONTROL
1 During these muisurements, ketotic rats were wnsuming the 3.5: 1 ketogenic diet.
Food intakes were rneasured in g.
3 The AIN 93G control diet had a caloric density of 3.87 kcaUg while the 3 -5: 1 flaxseed oil ketogenic diet had a caloric density of7.48 kcaVg.

0 Control Rats 0 Ketotic Rats
Figure 6.3 Blood Glucose in Conttol and Ketotic Rats
Points and error bars represent means I SEM; n = 6 ratslgroup. Different letters (a & b) denote blood glucose concentrations which were significantly different at the same time point (p < 0.05). From age 20 d - 23 d, ketotic rats were fed a 1 : 1 flaxseed oil diet and from age 24 d - 27 d. ketotic rats were fed a 23 flaxseed oil diet. A 3.51 fiaxseed oil diet was fed to ketotic rats from age 28 d until the termination of the experiment. ConW rats were fed the AIN 93G diet throughout the entire expefirnent. Food was offered to al1 rats ad lib.
con&ol Rats O Ketatic Rats
Figure 6.4 Plasma BHBA in Control and Ketotic Rats
Points and error bars represent means f SEM; n = 6 ratslgroup. Different lettefs (a 8 b) denote plasma p-HBA concentrations whidi were significantly different at the same time point (p c 0.05). From age 20 d - 23 d, ketotic rats were fed a 1:1 flaxseed oil diet and from age 24 d - 27 d, ketotic rats were fed a 2:l flaxseed ail diet. A 33.1 flaxseed oil diet was fed to ketotic rats from age 28 d until the termination of the expsiment Control rats were fed the AIN 936 diet throughout the entire experiment. Food was offered to ail rats ad lib . Abkeviations: P -HBA p -h ydroxybutyrate.
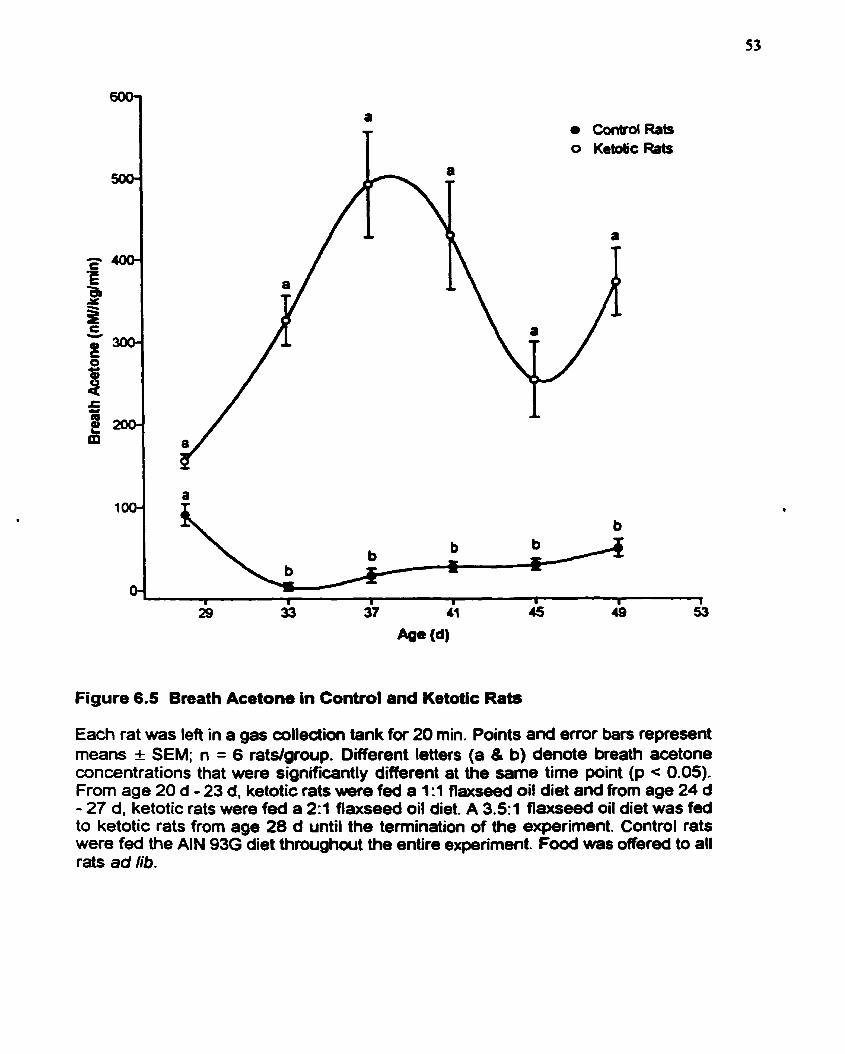
a ContrdRafs O Ketdc Rats
Figure 6.5 Breath Acetone in Control and Ketotic Rats
Each rat was left in a gas colledion tank for 20 min. Points and error bars represent means I SEM; n = 6 rats/group. Different letters (a 8 b) denote breath acetone concentrations that were significantly different at the same time point (p < 0.05). From age 20 d - 23 d, ketotic rats w r e fed a 1:1 flaxseed oil diet and from age 24 d - 27 d, ketotic rats were fed a 2:l flaxseed oil diet. A 3-51 flaxseed oil diet was fed to ketotic rats from age 28 d until the termination of the e-riment. Control rats were fed the AIN 93G diet throughout the entire experiment. Food was offered to al1 rats ad lib.
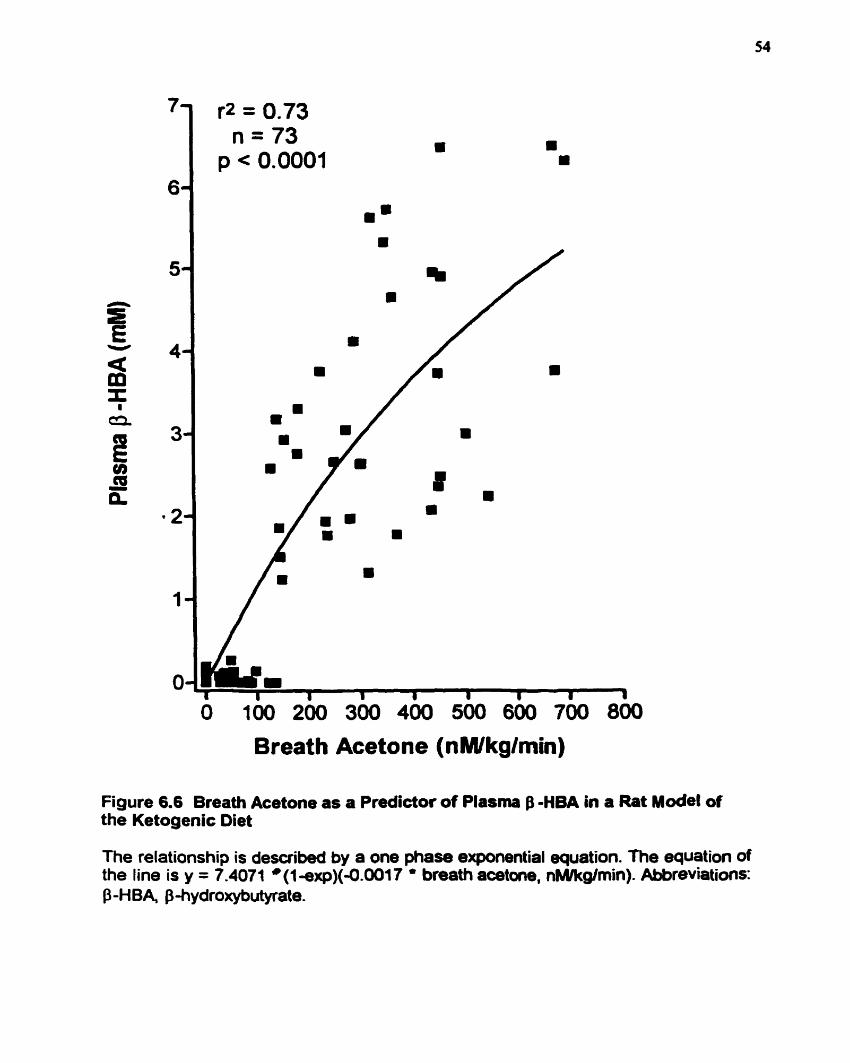
O 100 200 300 400 500 600 700 800
Breath Acetone (nMlkglmin)
Figure 6.6 Breath Acetone as a Predictor of Plasma B - H M in a Rat ~ o d e l of the Ketogenic Diet
The relationship is described by a one phase exponential equation. The equation of the line is y = 7.4071 *(1-exp)(-0.0017 ' breath aœtone, nMlkgîmin). Abbreviation~: p -H BA, p hydroxybutyrate.
6.1.3 Discussion of Exneriment 1
Although ketotic rats consumeci significantly more kilodories cornparcd to control rats
(Table 6.1). they weighed less (Figure 6.1) and gainai significantly less weight (Figure 6.2) than
control rats. The vitamin, mineral, and protein contents of the conad and ketogenic diets were
approximately balanced by weight. Although ketotic rats had a higher energy intake, they
consumed significantly less food (in tenns ofweight) wmpareâ to control rats. Thus, ketotic rats
consumed significantly lower amounts of protein, vitamins, and minerals. Because the rats were
gowing, the difference in the amount of protein, Mtarnin, and mineral consumption may explain
why ketotic rats did not gain as much weight as conad rats.
Ketotic rats had significantly lower blood glucose (Figure 6.3) and significantly higher
plasma P-HBA (Figure 6.4) and breath acetone (Figure 6.5) cornpueci to control rats. The lowest
blood glucose and the highest plasma P-HBA and breath acetone were reached baween 37 - 41
d of age; afterwards, blood glucose increased and plasma P-HBA and breath acetone decreased
until plateaus were reached. The age range between 37 - 41 d corresponds to the tirne that rats
undergo puberty. Pre-pubescent rats are capable of attaining higher ketone levels (Swink et el.,
1997); thus, this may explain why &one levels in pst-pubescent rats decreased. However, an
unpublished study (Likhodii et al., 1999) that examined changes in ketone levels in adult rats
ako observed similar trends (Le. the initial increase in ketones and decrease in blwd glucos
upon initiation of the W followed by a reduction in ketones and increase in blood glucose
shortly after). Thus, plasma ketona may decline not because of puberty but due to a more
efficient uptake and utilization of them, especially by the bnin. There may be some adaptation
period in which there is an increase in the transcription and translation of the appropnate proteins
and enzymes neccssuy for Letone body uptikt d utilhtioa Thw, pluma ketones miy appeu
high when upuLe anci utiiization rre ~OW, .ad p h keto= ni.y rppcv low wbcn upîake ud
utilization bewme more efficient-
Breath acetone ancl plasma B-HBA wae significuitly correiated (Figure 6.6). The
relationship between breath .cetone and plasma $-HBA was best d d b e d by a one phase
exponential equat ion
63 EXPERIMENT 2: KETOSlS IN EiWLTEY ADULTS FOLLOWING THE
INGESTION OF KETOGENIC MEALS
Six individuals participateci in this study. The abjects utch gave their informed consent
pnor to participating in the study (see Appendix D). Each study subject was rquired to undergo
a 12-h ovemight fasf and upon arrivd to the Iaboratory, fisting blood, breath, and samples
were taken. The fa~ting time point was considerd to be tirne = O h. Each subject was given a
ketogenic meal immediateiy following the collection of the fasting samples and every three
hours thereafker until a total of four ketogenic meals were consumeci; that is. a ketogenic meai
was consumed shortly after O h, 3 h, 6 h, and 9 h. Blood, breath, and urine samples were
wlleaed hourly. Each of the ketogenic meals that were a~oumed by the subject was identical in
both composition and caloric value. Al1 together, the ketogenic meals provideci the nibject with
75% of hisher daily caloric requirements. For details on the composition of the ketogenic meals
and the calculation of daily d o n c requirements, refer to Tables 5.5 and 5.4, respectively.
Subjects were also asked to consume 125 ml of water every hour in order to be able to give an
hourly urine sample.
Several physiological rneasures were made every hour during this experiment. Blood
glucose was meawired on fresh, whole blood, and after the blood samples were centnfiiged. the
plasma was immediately d y z d for P-HBA and AcAc. Urinary AcAc was meanired both
enrymatically and qualitatively using Ketostix dipsticks (Bayer. Etobiwke, Ontario). Bruth
samples were immediately analyzed for acetone.
Six subjects participated in this study. Their profiles are depictd in Table 6.2.
Blood glucose at each time point ud changes in blood gîuawe over time arc depicted in
Figure 6.7. As the figure shows, cach time 8 ketogcnic m d wu ingestecl, blood gfucose wu
driven slightly lower. The fsoting b l d glucor of the six subjects was 5.4 rnM I 0.4 mM. By
the end of the study dry, blood glucose fell significantly to 4.6 mM f 0.3 m M @ < 0.001).
Because blood glucose cannot drop indefinitely, there must be a point at which blood glucose
becornes constant. Unfortunately, the 12-h dietary period assessed was not long enough to
determine, with certainty, the approxirnate time point and concentration at which blood glucose
levels oE
Figure 6.8 depicts plasma B-HBA at each time point and changes in plasma B-HBA over
tirne. The fiisting plasma p-HBA was 0.23 rnM f 0.15 m . By the end of the study, plasma &
HB A increased significantly to 0.59 m M f 0.26 m . @ c 0.01). With the ingestion of each
ketogenic meal, plasma P-HBA became transiently elevated. The elevations in plasma P-HBA
were not described by a smooth line but by a jagged one compriscd of several peaks and valleys-
In general, the peaks appeared to correspond to the hour following the consumption of a
ketogenic meal while the valleys seemed to correspond to the second or third hour following the
consumption of a ketogenic meal.
Plasma AcAc at each tirne point and changes in plasma AcAc over time are depiaed in
Figure 6.9. Similar to plasma P-HBA, plasma AcAc incraseci with the consumption of each
ketogenic meal. The fsting plasma AcAc of the six subjccts w a ~ O. 12 mM f O. 1 1 mM- BY the
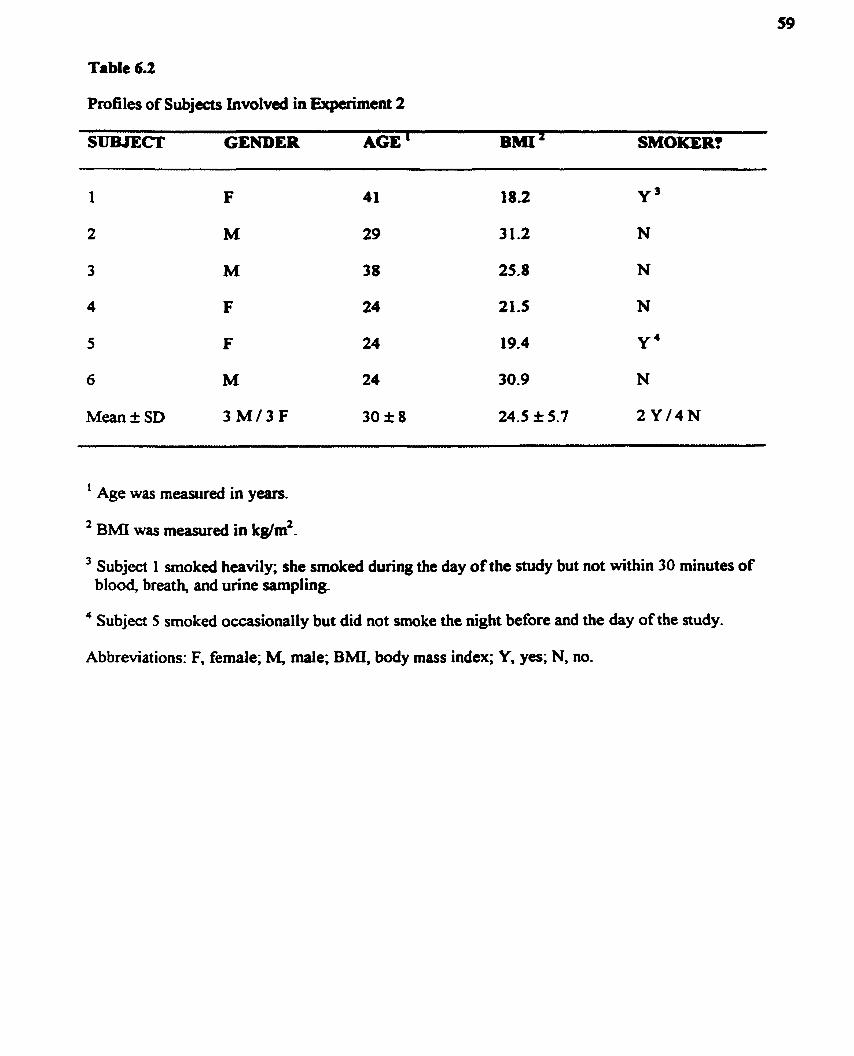
Table 6.2
Profiles of Subjects Involveci in Expairnent 2
SUBJECI' GENDER AGE ' BMI' SMOKER?
' Age was measured in years.
3 Subject 1 smoked heavily; she smoked dunng the day of the study but not within 30 minutes of blood, breath, and urine sampling.
4 Subject 5 smoked ocwionally but did not smoke the night before and the day of the study.
Abbreviations: F, femde; M, male; BMI, body mass index; Y, yes; N, no.
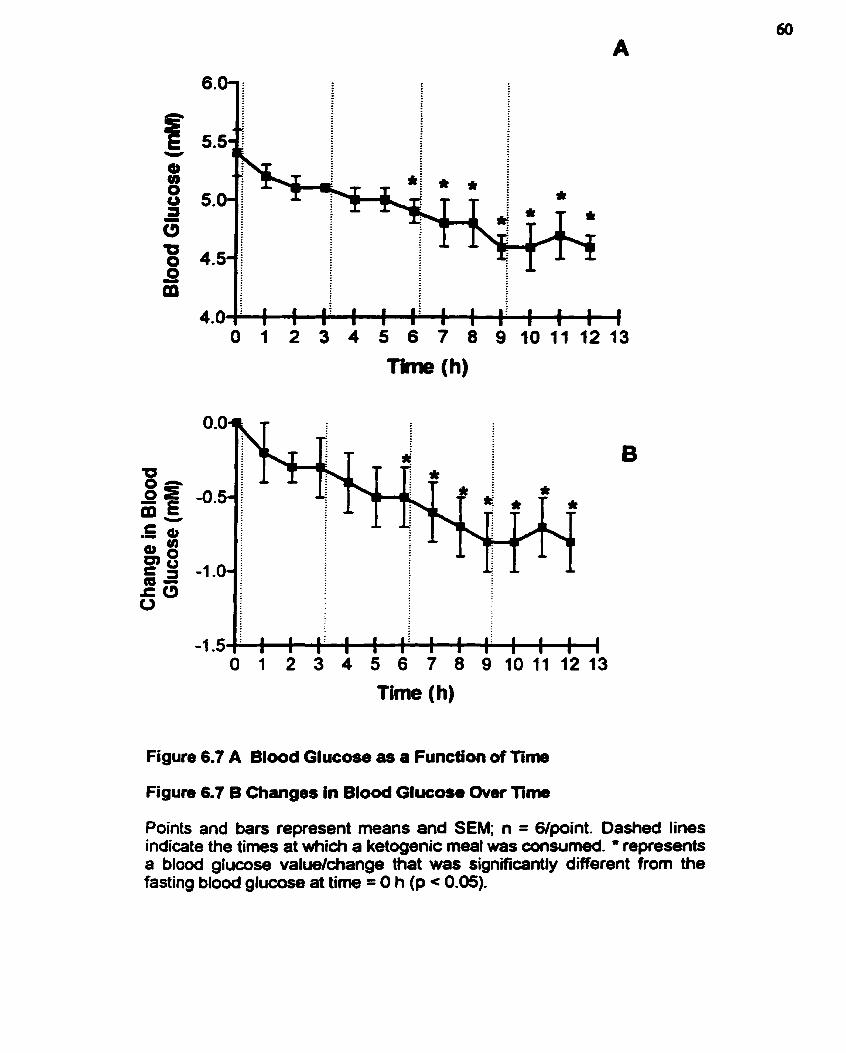
Time (h)
Figure 6.7 A Blood Glucose as a Funcb'on of Time
Figure 6.7 6 Changes in Bfood Glucose Over Time
Points and bars represent means and SEM; n = G/point. Dashed Iines indicate the tirnes at which a ketogenic meal was consumed. * represents a blood glucose valuekhange that was significantly different frorn the fasting blood glucose at time = O h (p c 0.05).

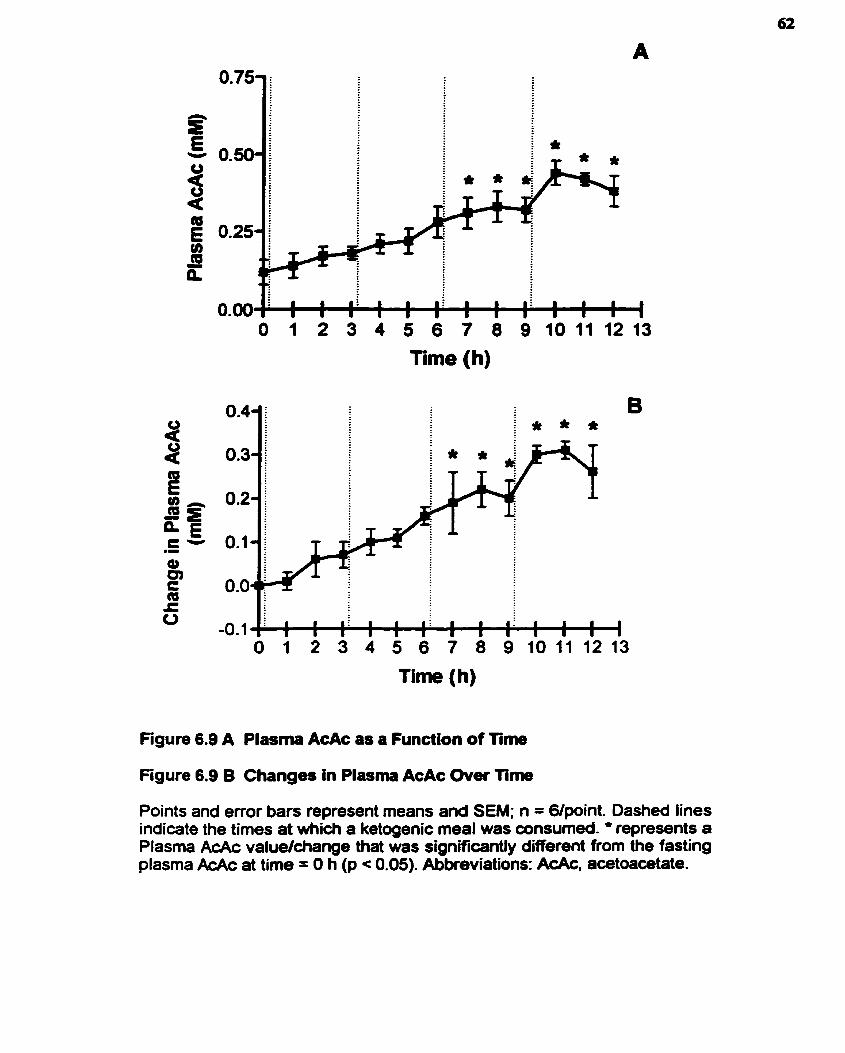
Tirne (h)
O 1 2 3 4 5 6 7 8 9 1 0 1 1 1 2 1 3
Time (h)
Figure 6.9 A Plasma AcAc as a Function of Time
Figure 6.9 B Chang- in Plasma AcAc Over Time
Points and error ban represent means and SEM; n = 6/point. Dashed lines indicate the times at which a ketogenic meal was wnsumed. * represents a Plasma AcAc valuelchange that was significantly different from the fasting plasma AcAc at time = O h (p < 0.05). Abkeviations: AcAc, acetoacetate.
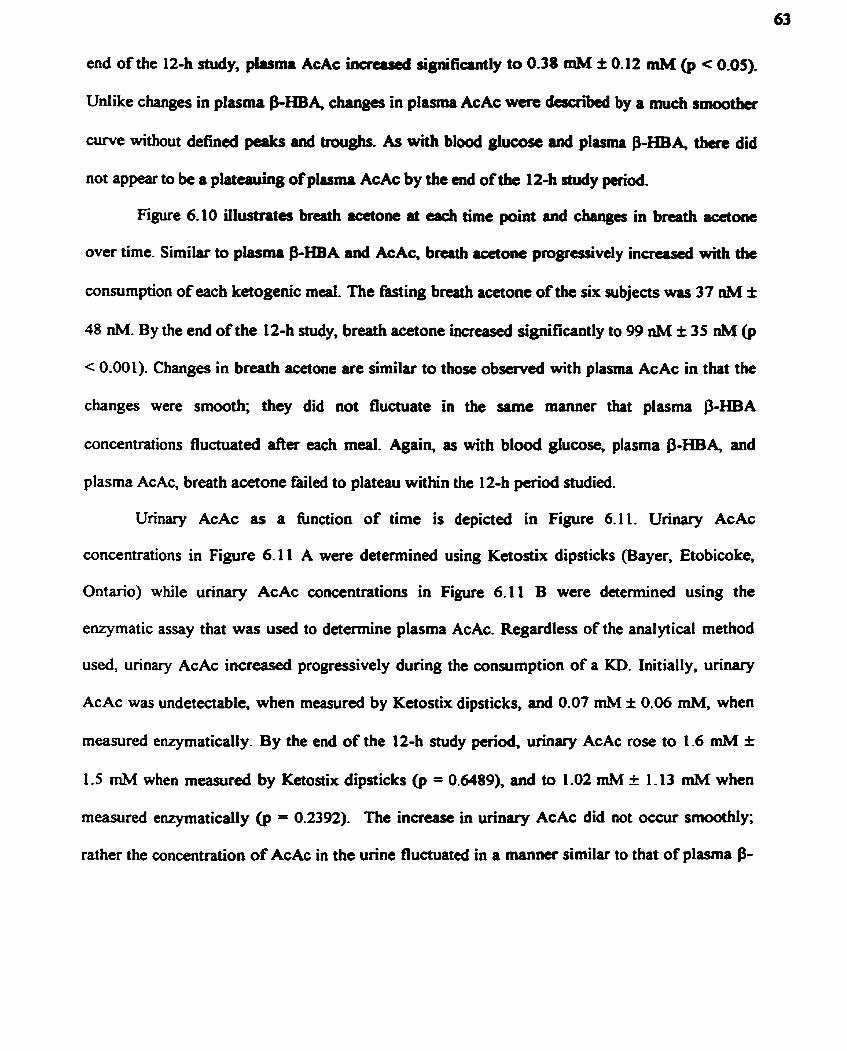
end of the 12-h study, p b m a AcAc incrcasai significantly to 0.38 m M f 0.12 mM @ < 0.05).
Uniilce changes in plasma PHBA, chan8es in plasma AcAc wac d d b e d by a much smootber
m e without defined perh and troughs- As with blood gluco~ .ad plasma B-HBA, thae did
not appear to k a platcauing of pluma AcAc by the end of the 12-h study paiod.
Figure 6.10 illustrates brerth acetone at each time point and changes in breath -one
over time. Similar to piasma 8-HBA and AcAc, brea!h acctone pmgressively i n c r d with the
mnsumption of each ketogenic meal. The fasting breath acetone of the six subjects was 37 n M f
48 n . . By the end of the 12-h study, breath acetone increased significantly to 99 n M f 35 n M (p
< 0.001). Changes in breath acetone are similar to those obsewed with plasma AcAc in that the
changes were smooth; they did not fluctuate in the wme manner that plasma P-HBA
concentrations fluctuated a f k each meal. Again, as with blood glucose, plasma f3-HBA, and
plasma AcAc, breath acetone failed to plateau within the 12-h period studied.
Urinary AcAc as a fbnction of time is depicted in Figure 6.1 1. Urinary AcAc
concentrations in Figure 6.1 1 A were determined using Ketostix dipsticks (Bayer, Etobicoke,
Ontario) while u n n q AcAc concentrations in Figure 6.1 1 B were determined using the
enzymatic assay that was used to determine plasma AcAc. Regardless of the analytical method
used, urinary AcAc increased progressively during the consumption of a KD. Initially, urinary
AcAc was undetectable, when meanired by Ketostix dipsticks, and 0.07 m M f 0.06 mM, when
measured enzymatically. By the end of the 12-h study period, urinary AcAc rose to 1.6 rnM f
1.5 m . when measured by Ketostix dipsticks (p = 0.6489), and to 1.02 mM + 1.13 m . when
meanireci enzymatically @ = 0.2392). The i n c n v e in urinaty AcAc did not ocair smoothly;
rather the concentration of AcAc in the unne fluctuatcd in a manner similar to that of plasma P-
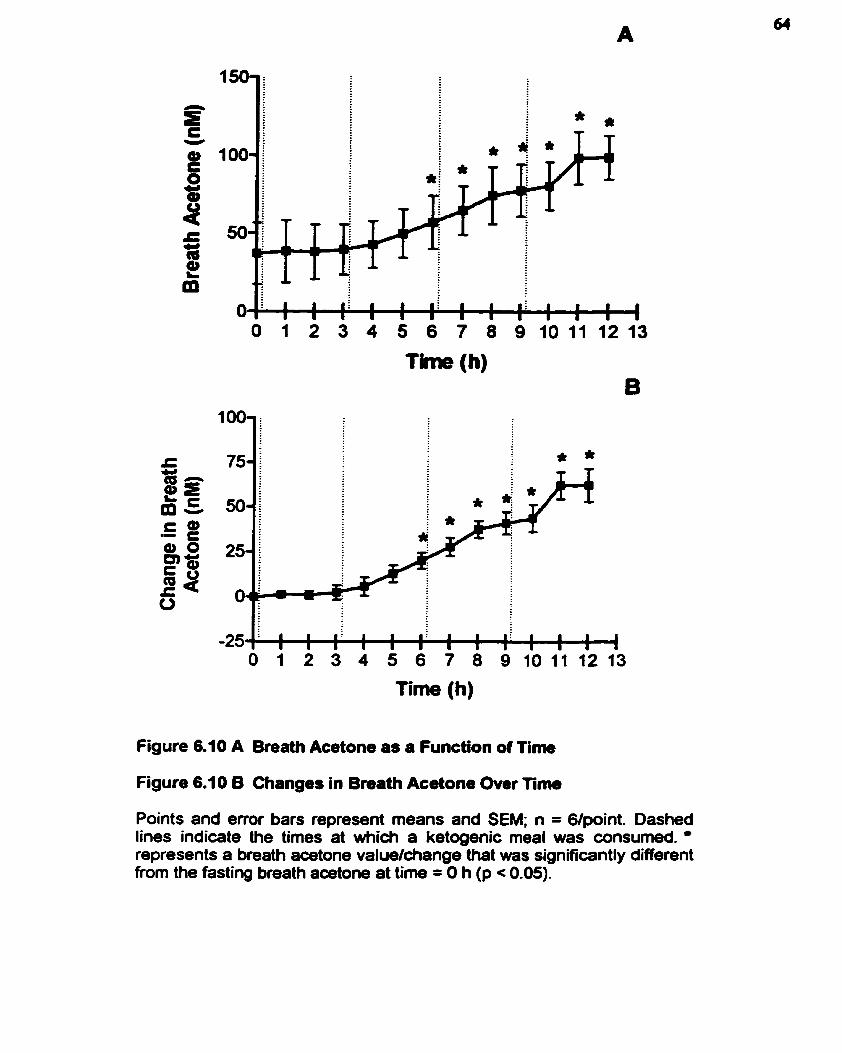
Time (h)
Figure 6.10 A Breath Acetone as a Function of Time
Figure 6.10 6 Changes in Bmath Acetone Over T i m
Points and error bars represent means and SEM; n = 6/point. Dashed liner indicate the times at which a ketogenic meal was consumed. represents a breath acetone valudchange that was significantly different from the fasting breath aœtone at time = O h (p c 0.05).
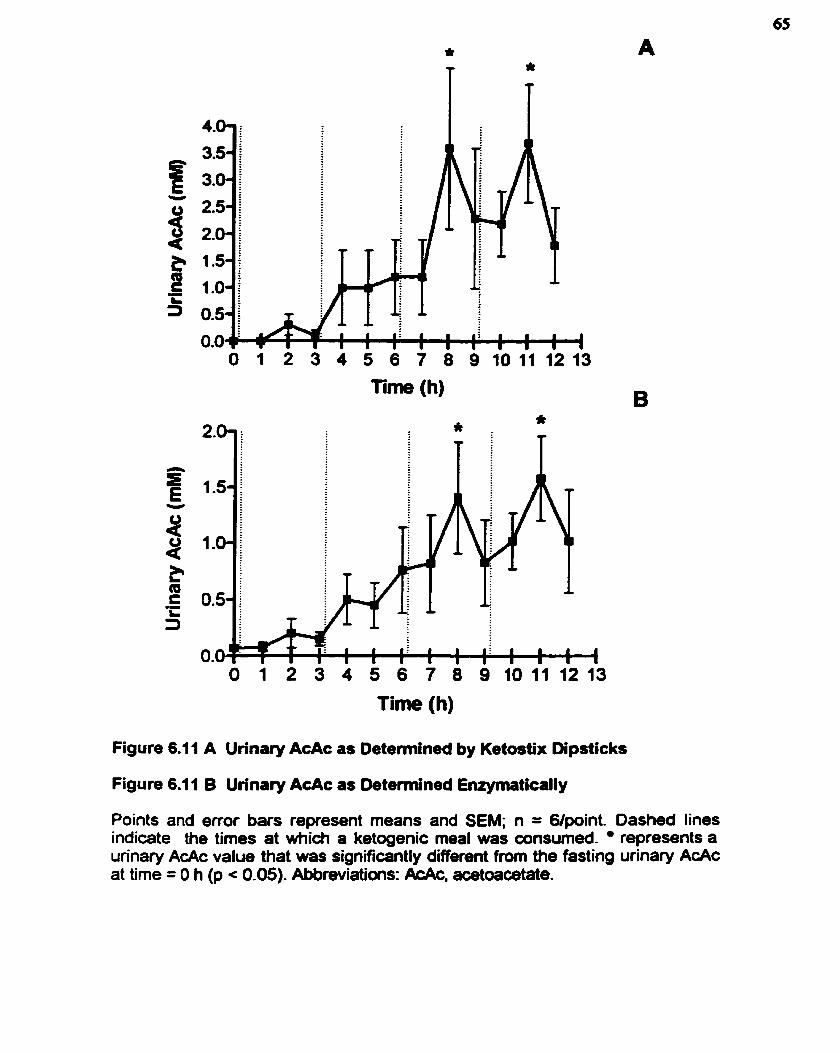
Time (h)
O 1 2 3 4 5 6 7 8 9 1 0 1 1 1 2 1 3
Tirne (h)
Figure 6.1 1 A Urinary AcAc as Detennined by Ketostix Dipsticks
Figure 6.1 1 B Urinary AcAc as Detemined Enrymatically
Points and ertor ban represent means and SEM; n = G/point. Dashed Iines indicate the times at which a ketogenic meal was consumed. represents a urinary AcAc value that was significantly different from the fasting urinary AcAc at time = O h (p c 0.05). Abbreviations: &Ac, acetoaœtate.
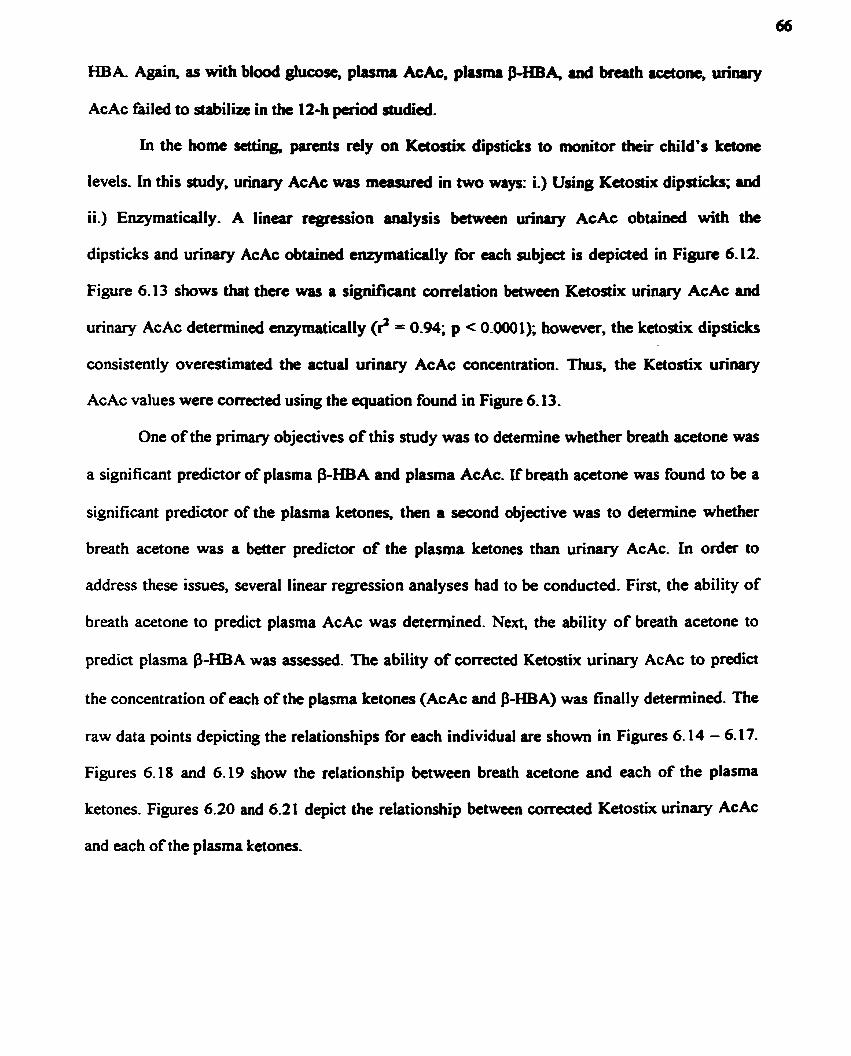
HBA Again, as with b l d glucose, plasma AcAc. pluma PHBA, a d brcath rcetont, urinuy
AcAc failed to staôilize in the 12-h p e n d studied.
In the home setting, parents rely on KetosEix dipsticks to monitor theu child's k a n e
Ievels. In this study, un- AcAc wu m a n i r d in two ways: i.) Using Ketosîix dipsticks; and
ii.) Enzymatidly. A linear rcgrtssion d y s i s between urinary AcAc obtained with tbe
dipsticks and urinary AcAc obtained enqrmaticaily for each subject is depicted in Figure 6-12.
Figure 6.13 shows that there was a significant correlation betwecn Ketostix urinary AcAc and
urinary AcAc determined enzymatically (8 = 0.94; p c 0.0001); however, the ketostix dipsticks
consistently overestimated the actual urinary AcAc concentration. Thus, the Ketostix urinary
AcAc values were corrected using the equation found in Figure 6- 13.
One of the primary objectives of this study was to detennine whether breath acetone was
a significant predictor of plasma p-HBA and plasma AcAc. If breath acetone was found to be a
significant predictor of the plasma ketones, then a second objective was to detennine whether
breath acetone was a better predictor of the plasma Letones than unnary AcAc. In order to
address these issues, several linear regression analyses had to be wnducted. First, the ability of
breath acetone to predict plasma AcAc was detennined. Next, the ability of breath acetone to
predict plasma P-HBA was assesseci. The ability of com*ed Ketostix urinary AcAc to predict
the concentration of each of the plasma ketones (AcAc and B-HBA) was finally detennined. The
raw data points depicting the relationships for each individual are shown in Figures 6.14 - 6-17.
Figures 6.18 and 6.19 show the relationship between breath acetone and each of the plasma
ketones. Figures 6.20 and 6.21 depict the relationship between corrected Ketostix unnary AcAc
and each of the plasma ketones.
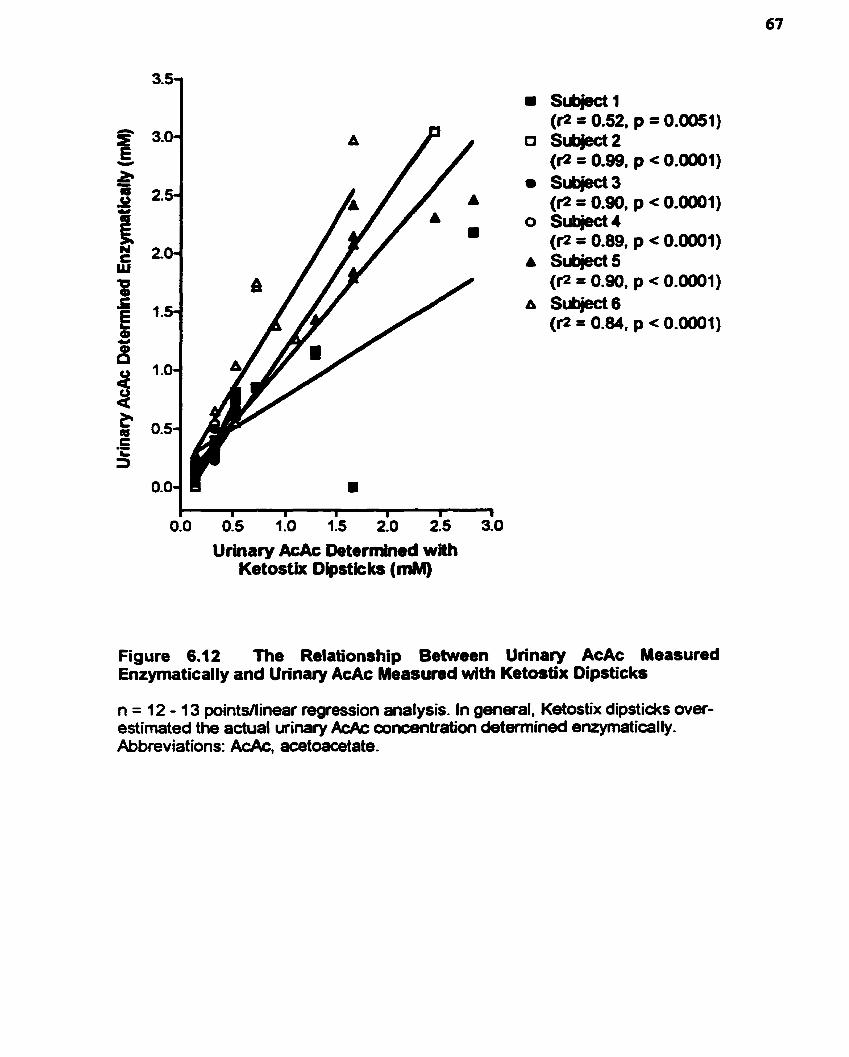
Urhary AcAc Determîned with Ketostix Dipstkks (mM)
Figure 6.1 2 The Relationship Between Urinary AcAc Measured Enzymatically and Urinary AcAc Measured with Ketostix Dipsticks
n = 12 - 13 pointsllinear regression analysis. In general, Ketostix dipstickt over- estimated the actual u r i ~ r y AcAc concentration detemiined emymatically. Abbreviat ions: AcAc, acetoacetate-
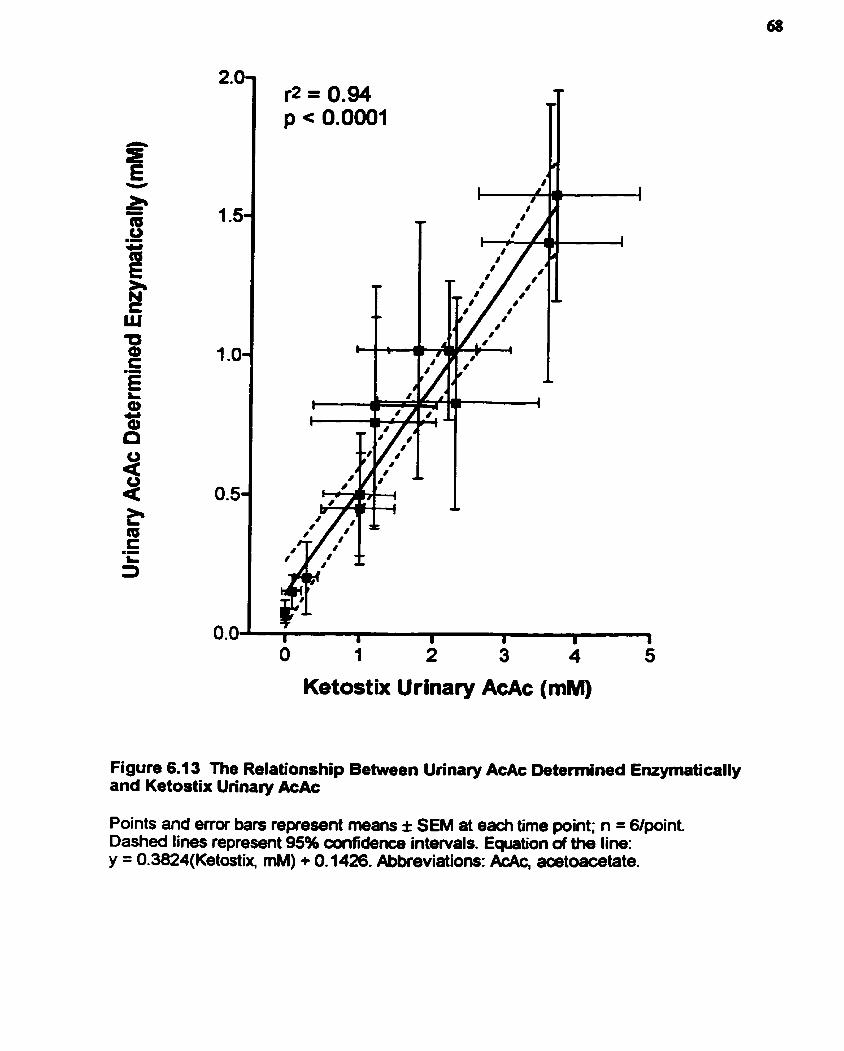
Ketostix Urinary AcAc (mM)
Figure 6.1 3 The Relationship Between Urinary AcAc Determined Enzymatically and Ketostix Urinary AcAc
Points and error bars represent means f SEM at each time point; n = Glpoint. Dashed lines represent 95% confidence intervals. Equation d the line: y = 0.3824(Ketastix, mM) + 0.1426. Abbreviations: AcAc, aœtoacetate.
Breath Acetone (nM)
Subject 1 (r2 = 0.62, S u b m 2 (r2 = 0.70, Sub@ct 3 (r2 = 0.85, Subject 4 (r2 = 0.66, Subject 5 (r2 = 0.81, Subject 6 (r2 = 0.59,
Figure 6.14 The Relationship Between Plasma AcAc and Breath Acetone For Each Subject
n = 1 1 - 1 3 pointdlinear regression analysis. Abkeviations: AcAc, acetoacetate.
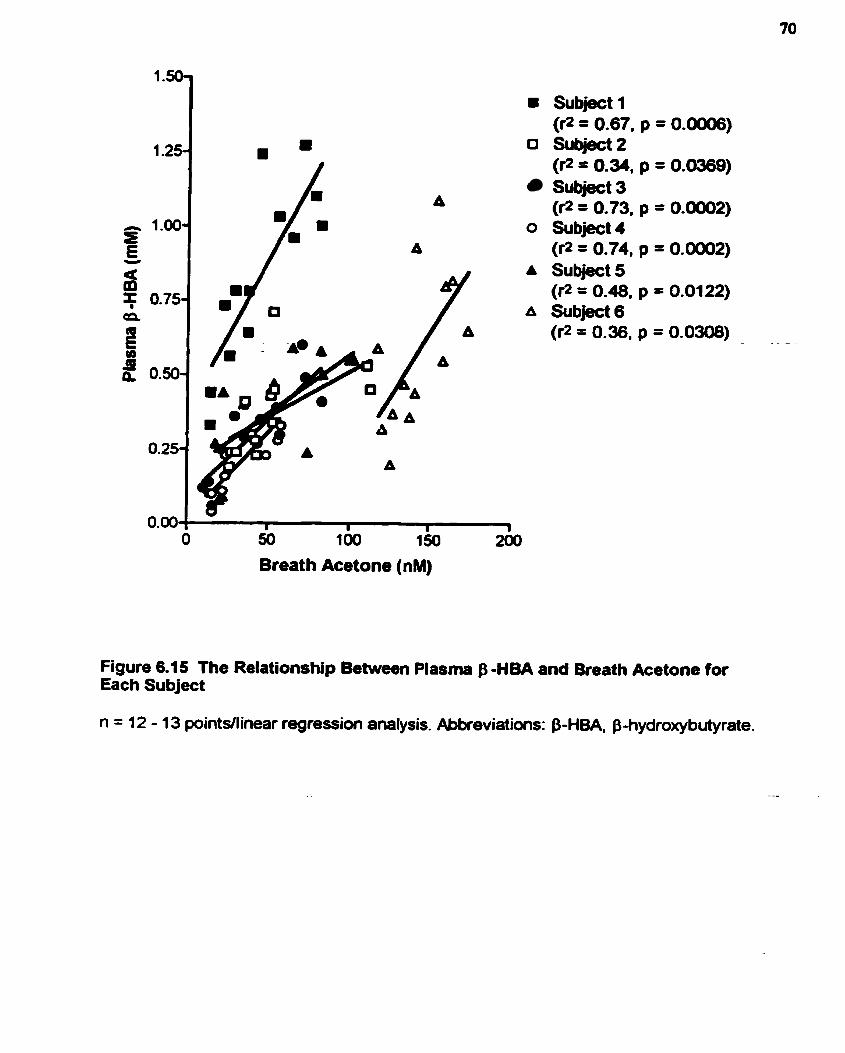
Subject 1 (r2 = 0.67, p = 0.0W6)
D I 0 subj0ct2 (P = 0.34. p = 0.0369) subjed 3 (P = 0.73. p = 0.0002)
O Subject4 (fl= 0.74, p = 0.0002)
A Subject5 (r;! = 0.48, p = 0.0122)
A Subject 6 (r2 = 0.36, p = 0.0308)
0 50 100 1so 260
Breath Acetone (nM)
Figure 6.15 The Relationship Between Plasma f3 -HBA and Breath Acetone for Each Subject
n = 12 - 1 3 pointsilinear regression analysis. Abkeviatioru: P-HBA, P-hydroxybutyrate.

Corrected Ketostix Urinary AcAc (mM)
Figure 6.16 The Relationship Between Plasma AcAc and Corrected Ketostix Urinary AcAc For Each Subject
n = 1 1 - 13 pointdlinear regression analysis. Ketostix urinary AcAc values were cwreded using the equation y = (0.3284)(Ketostix, mM) + 0.1 426. Abkeviations: AcAc, acetoacetate.
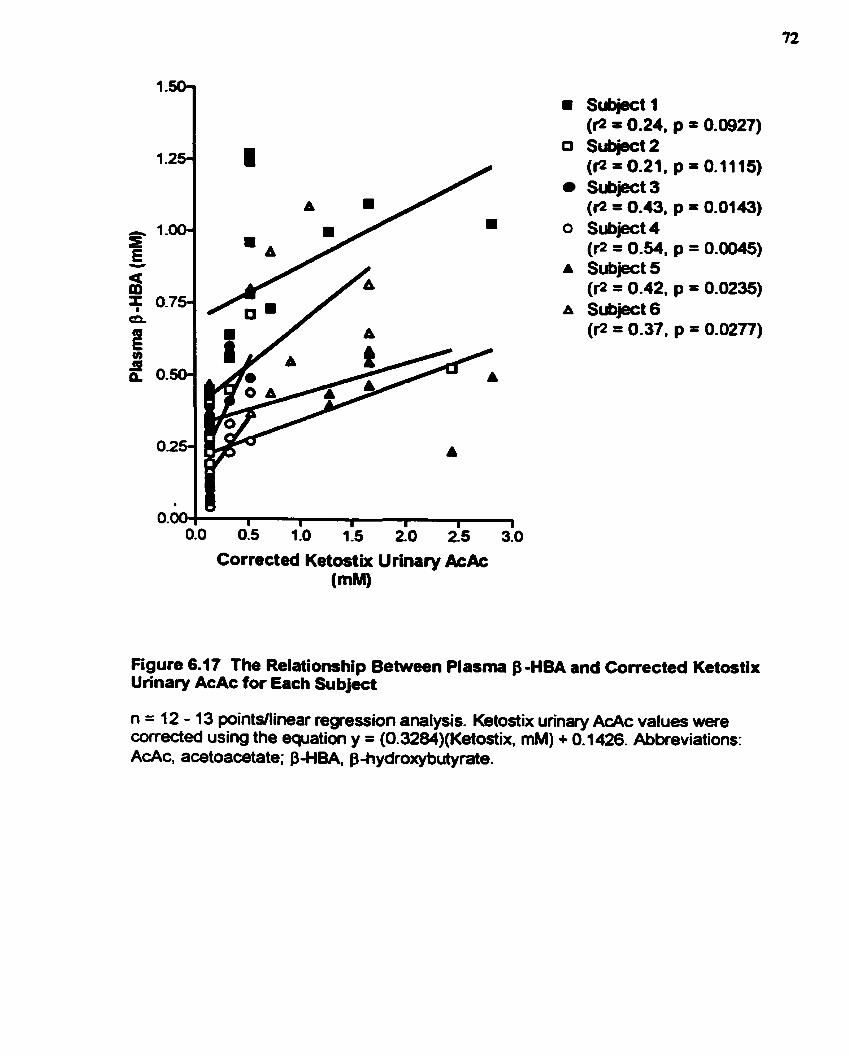
Subject 1 (I = 0.24. p = 0.0927)
0 Subject2 (fl= 0.21. p = 0.1115) Subject3 (@ = 0.43, p = 0.0143)
O Subject4 (rz = 0.54. p = 0.0045)
A Subject 5 (fl= 0.42. p = 0.0235)
A Subject 6 (1-2 = 0.37, p = 0.0217)
010 0.5 1i0 115 2 0 i5 310
Corrected Ketostix Urinary &Ac (mM)
Figure 6.17 The Relationship Betwwn Plasma B -HBA and Comcted Ketostix Urinary AcAc for Each Subject
n = 1 2 - 1 3 pointsllinear regression analysis. Ketostix urinary AcAc values were wrected using the equation y = (0.3284)(Ketostix, mM) + 0.1 426. Abkeviations: AcAc, acetoacetate; p-HBA, phydroxybutyrate.
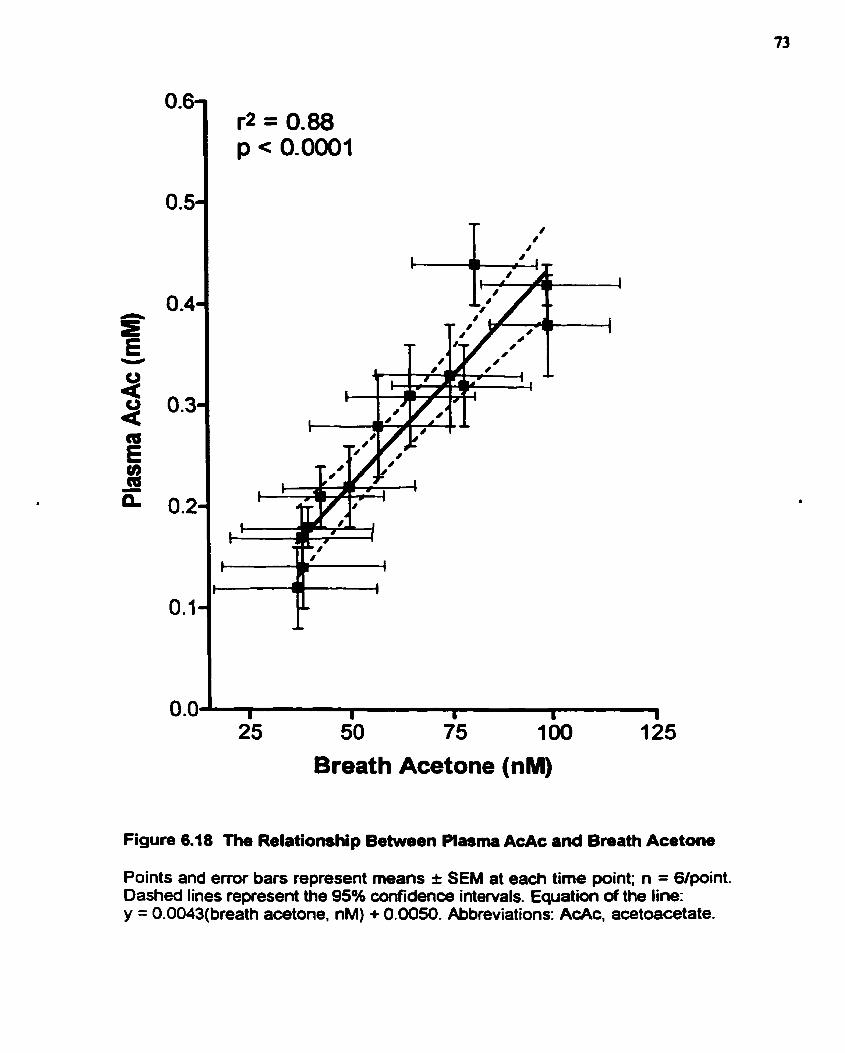
Breath Acetone (nM)
Figure 6.18 The Relationship Betwen Plasma AcAc and Breath Acetone
Points and ermr bars represent means r SEM at each time point; n = 6Ipoint. Dashed lines represent the 9S0h confidenœ intervals. Equation of the line: y = 0-0043(breath acetone, nM) + 0.0050. Abbreviations: AcAc, acetoacetate.

Breath Acetone (nM)
Figure 6.19 The Relationship Between Plasma B H B A and Breath Acetone
Points and errar bars represent rneans î SEM at each time point; n = Glpoint. Dashed lines represent the 95% confidence intervals. Equation of the line: y = (0.0062)(breath acetone, nM) + 0.0709. Abbreviations: P-HBA, B-hydroxybutyrate.
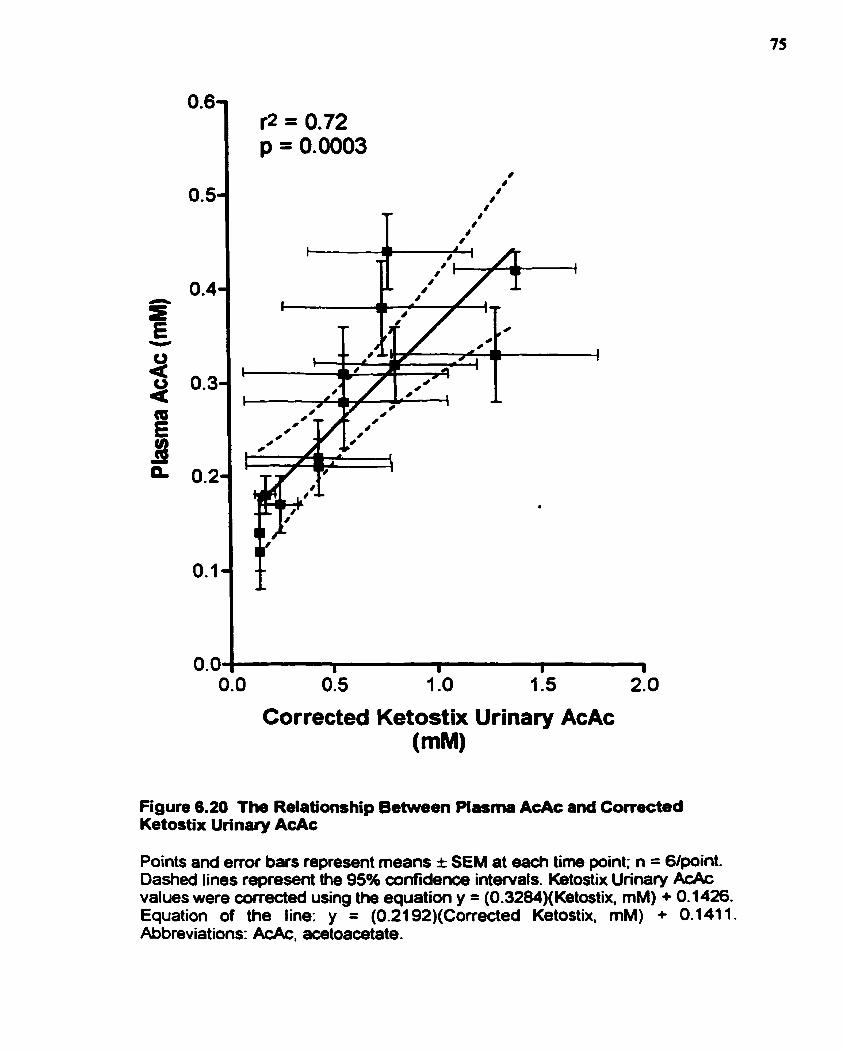
Corrected Ketostix Urinary AcAc (mM)
Figure 6.20 The Relationship Between Plasma AcAc and Convcted Ketostix Un'nary AcAc
Points and emr bars represent means I SEM at each time point; n = 6lpoint. Dasheâ lines represent the 95% confidence intervals. Ketostix Urinary AcAc values were cortected using the equation y = (0.3284)(Ketostix, mM) + 0.1426. Equation of the line: y = (0.2192)(Corrected Ketostix. mM) + 0.1411. Abbreviations: AcAc, acetoacetate.
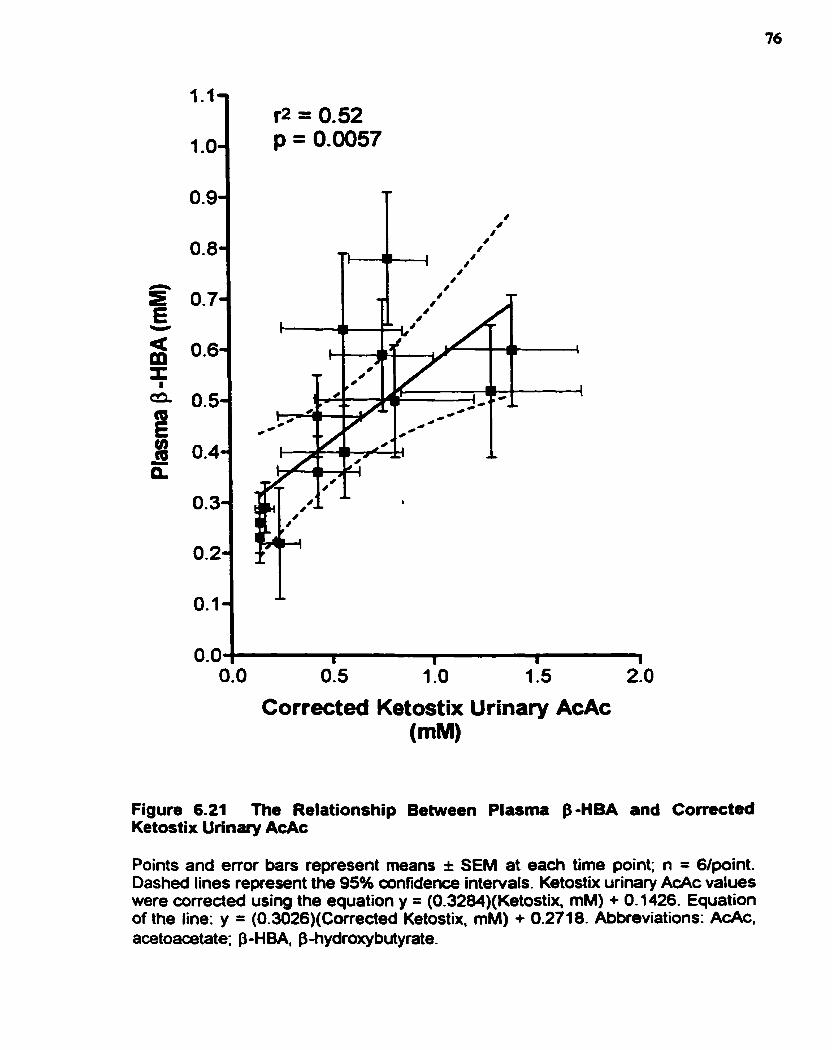
Corrected Ketostix Urinary AcAc (mM)
Figure 6.21 The Relationship Between Plasma p-HBA and Corrected Ketostix Urinary AcAc
Points and error bars represent means î SEM at each time point; n = 6lpaint. Dashed lines represent the 95% confidence intervals. Ketostix urinary AcAc values were coneded using the equation y = (0.3284)(Ketostix. mM) + 0.1 426. Equation of the line: y = (0.3026)(Corrected Ketostix, mM) + 0.271 8. Abbreviations: AcAc, acetoaœtate; P-HBA, fbhydroxybutyrate.
Bmath .cetone was a siwcant p d c t o r of bah pluma Ac& (? = 0.88; p < 0.0001;
Figure 6.18) a d plasma $-HBA (? = 0.66; p < 0.0001; Figure 6.19). Corrected Ketortix wînuy
AcAc was dso a significant prcdidor of piasmi AcAc (? = 0.72; p = 0.0003; Fi- 6.20). d
of plasma 8-HBA (? = 0.52; p = 0.0057; Figure 6.21). For a summary of the cquatioru of each of
the lines of best fit as well as other staîistical results, refer to Table 6.3.
6.2.3 Discussion OC ExDeriment 2
During the consumption of a KD, breath -one and plasma AcAc changed more
smoothly than blood ghicose, plasma j3-HBA, and urinary AcAc (Figures 6.7 - 6.1 1). Uri-
AcAc determined with Ketodix dipsticks was signiticantly correlated with u- ACAC
determined enzymatically (Figure 6.13); however, the Ketostix dipsticks generally overestimated
the actual urinary AcAc concentration and a correction factor had to be applied to Ketostix
urinaty AcAc values (Figure 6.13). Breath acetone was significantly correlated with both plasma
AcAc (Figure 6.18) and plasma j3-HBA (Figure 6.19). As well, conected Ketostix urinary ACAC
was significantly correlated with both plasma AcAc (Figure 6.20) and plasma P-HBA (Figure
6.2 1).
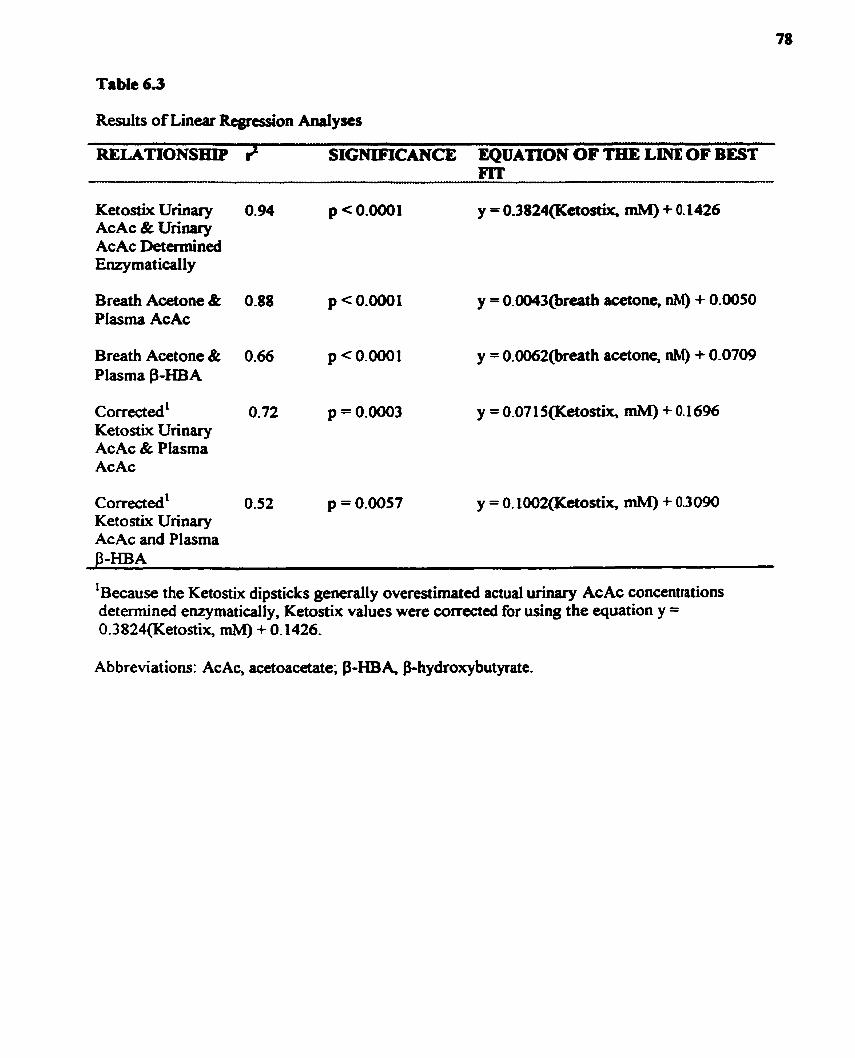
Table 6.3
Results of Linear Rtgrcssion Analyses
RELATlONSrrrP # SIGNIFICANCE EQUATiON OF TELE LINE OF BEST FIT
KetostixUrinary 0.94 p < 0.0001 y = 0.3824(Ketostix, mM) + 0.1426 AcAc & Urinary AcAc Determined EnzymaticaIl y
Breath Acetone & 0.88 p <0.0001 y = O.ûû43@reath acetone, nM) + 0.0050 Plasma AcAc
Breath Acetone & 0.66 p < 0.0001 y = 0.0062(breath acetone, nM) + 0.0709 Plasma $-HBA
comected' O. 72 p = 0.0003 y = 0.071 5(Ketostix, mM) + 0.1696 Ketostix Urinary AcAc & Plasma AcAc
corrected' 0.52 p = 0.0057 y = O. 1002(Ketostix, mM) + 0.3090 Ketostix Urinary AcAc and Plasma
1 Because the Ketostix dipsticks generally overestirnated actual urinary AcAc concentrations determined enzymatically, Ketostix values were corrected for using the equation y = 0.3824(Ketostix, mM) + 0.1426.
Ab breviat ions: Ac Ac, acetoacetate; $-HB A, &hydroxybutyrate-

CHAPTER 7.0 DISCUSSION
7.1 CHANGES IN M E T A B O m S
In Experiment 1, when rats in chronic ketosis wue studial, it wss obsemd that, in
general, between 37 d - 4 1 d of age, plasma P-HBA (Figure 6.4) and breath acetone (Figure
6.5) reached a maximum, while blood glucose reached a minimum (Figure 6.3). M e r this
age range, blood glucose, plasma B-HBA and breath acetone began to plateau, but were still
significantly different 6om convol values @ < 0.05). Interestingly, rats reach puberty in this
age range and since pre-pubescent rats are capable of atîaining higher ketone levels (Swink et
al., 1997), this may explain why the ketones began to decline and blood glucose began to
increase. However, in an unpublished mdy (Likhodii et al., 1999). the same trends in blood
glucose and plasma J3-HBA were observeci in adult rats. Thus, puberty may not be the reason
why ketone levels suddenly decrease. An alternative explanation may be that at the molecular
level, there is an increase in the transcription and translation of key proteins and enzymes
necessary for the uptake and utilization of ketones (Likhodii et al., 1999). Thus an increased
uptake/utilization of ketones by certain organs (Le. brain, h m , ske1etal muscle, kidney
cortex) could result in reduced plasma ketones.
When acute lcetosis in the adult voluntan was studied, it was observed thaî, in
gened, plasma B-HB& plasma AcAc, ud brenh acttonc inaeased while blood glucose
decreased over time. The increasc in plasma AcAc (Figwe 6.9) rud brcath a m o n e (Figun
6-10), however, seaned much more consistent and f'ar less sensitive to the achul
consumption of a ketogenic meal comparai to piasma $-HBA (Figure 6.8). which rppeared
to increase in a series of s e p s rather than smoothly. During acute ketosis, plasma p-HBA
fluctuatecl in a manner similar to that of blood glucose in that the time of lasi meal
consumption had a significant effect. Upon the coiwmption of a ketogenic m d , b l d
glucose would sharply decrease (Figure 6.7) while plasma P-HBA would sharply increase
(Figure 6.8). Breath acetone and plasma AcAc were not so sensitive to the consumption of a
ketogenic meal. This needs further study and may have clinical implications. If plasma P
HBA is the ketone being measureà, then when it is measured in relation to the connimption
of a ketogenic meal needs consideration. Furthemore, perhaps plasma P-HBA is not the
ketone (or at least not the only ketone) that should be monitored-
7.2 BREATH ACETONE AND URINARY AcAc AS PREDICTORS OF PLASMA
KETONES
Although the mechanism of the KD is unknown, its en iucy seems to be dependent
upon the maintenance of blood levels of P-HBA above 2 m M and of AcAc above 0.6 mM
(Huttenlocher, 1976). The KD is initiatd in a hospital setting where blood P-HBA is ofkn
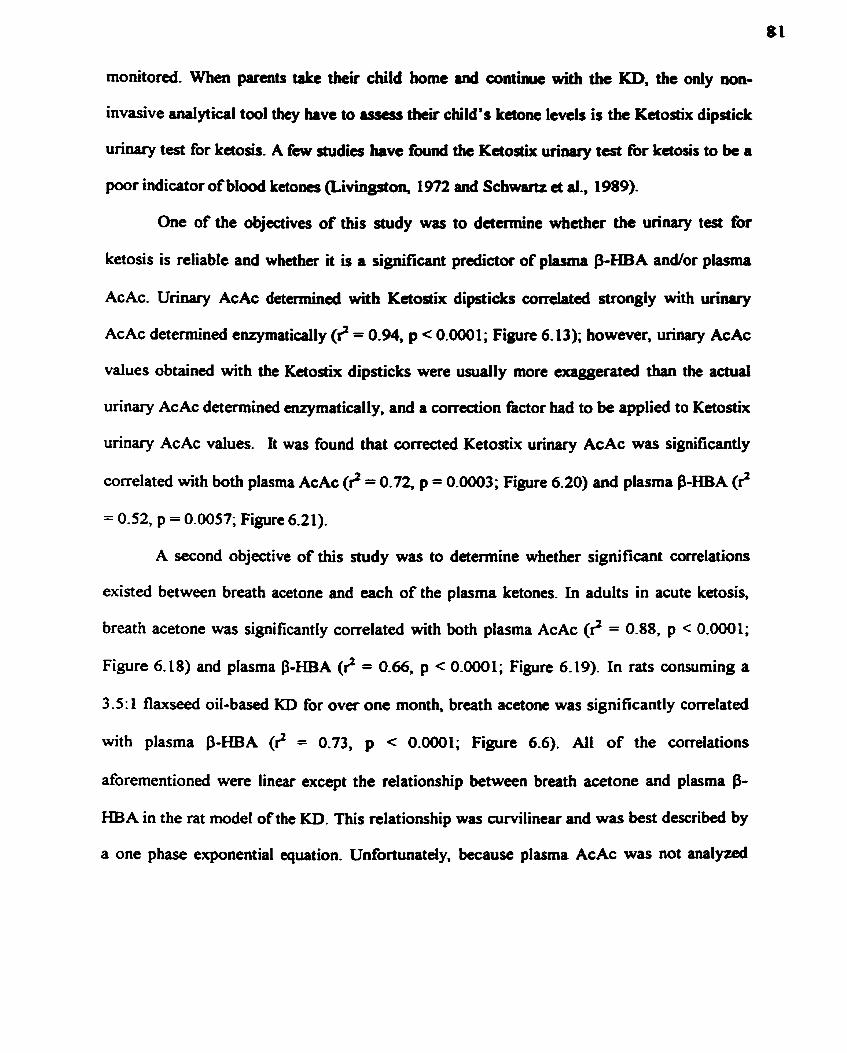
monitored. When parents take th«t child borne and continue with the KD, the ody wn-
invasive oarlytical t d they have to assess theu child's ketone levels is the Ketostix dipstick
winary test for ketosis. A fw midies have f d the Kctostix urinary test for ketosis to k a
poor indicator of blood Letones (Livingston, 1972 anci Schwartz et ai., 1989).
One of the objectives of this study was to determine whether the u r i q test for
ketosis is reliable and w h a k it is a significant predïctor of plasma j3-HBA andlor plasma
AcAc. Urinary AcAc determined with Ketosiix dipsticks correlated strongly Mth
AcAc detennined enry matically (? = 0.94, p < 0.000 1; Figure 6.13); however, urinary AcAc
values obtained with the Ketortix dipsticb were usudly more exaggerated than the actual
urinary AcAc determined enzymatically, and a correction factor had to be applied to Ketostix
urinary AcAc values. It was found that correcteci Ketostix unnary AcAc was significantiy
correlated with both plasma AcAc (8 = 0.72, p = 0.0003; Figure 6.20) and plasma P-HBA (8
= 0.52, p = 0.0057; Figure 6.21).
A second objective of this study was to determine whether signifiant correlations
existed between breath acetone and each of the plasma ketones. In adults in acute ketosis,
breath acetone was significantly correlated with both plasma AcAc (? = 0.88, p < 0.0001;
Figure 6.18) and plasma P-HBA (2 = 0.66, p < 0.0001; Figure 6.19). In rats consuming a
3 -5 : 1 flaxseed oil-based KD for over one month, breath acetone was significantly correlated
with plasma P-HBA (8 = 0.73, p < 0.0001; Figure 6.6). Al1 of the comlations
aforementioned were linear except the relationship between breath acetone and plasma
HBA in the rat mode1 of the KD. This relationship was curvilinear and was best described by
a one phase exponential equation. Unfortunately, because plasma AcAc was net m l w
immediately, plasma AcAc d u c s w a c not obtaincd and cornluions between br& -one
and plasma AcAc could not be examined in our rat mode1 of the KD.
It wu hypothesized that in rats and humans consuming a KD, a significant, positive
wmlat ion would be observed h e m breath -one and pluma AcAc and p-HBA, and
that breath acetone would be a more signiticant indic- of these plasma ketones than the
unnary test for keiosis. As was predicted, a significant, positive correlation was o b s w d
between breath acetouc and each of the plasma Letones- Results of the co~ t l a t ion d y s a
revealed that both breath acetone and urinary AcAc were significantly correlateci with u c h
of the plasma ketones; however, the correlations involving breath acetone had higher ?
values. It is premature to state with absolute certainty that breath acetone is a more reliable
indicator of the plo~ma ketones compared to the unnary ketone dipstick test because the
studies conducted thus far have limitations. Although chronic ketosis was examined in the nit
study, neither plasma nor urinary AcAc were meanireci; thus, correlations dealing with these
parameters could not be assessed. In the human study, the sample size studied was srnail (n =
6) and the dietary study period assessed was relatively short (Le. urinary AcAc may be a very
reliable indicator of plasma ketones in subjects in chronic, as opposed to acute, ketosis).
When chronic ketosis in a larger sample size is examined, a multiple linear regression
analysis that controls for inter-uibject variability (Le. gender, body mass index, smoking
statu, age, etc.) can be conduded and mathematical models can be generated that actually
predict a plasma ketone concentration tiom a breath acetone/urinary AcAc concentration-
The generation of such mathematical models at this stage is premature.
Overall, the preliminary results of Experiments 1 and 2 are encouraging and ~uggest
that although both breath acetone and Ketostix urinaty AcAc are significantly correlateci with
the pluma ketones, brcath acctone wy, in fact, k a bcttcr indiutor of plasam Letones than
the urinary dipstick ketone test,
7.3 IMPLICATIONS
AcAc is the only ketone that is acbully involved in energy production and
Lipogenesis (Mitchell et ai., 1995). p-HBA is important only in the sense that t has the
potential to be conveited to AcAc via the enzyme, p-HBDH; otherwise, it is considered a
"dead-end metabolite" (Mitchell et al., 1995). While it bas b a n observed that a minimum
blood concentration of about 2 rnM of f3-HBA is necessary for the KD to be effective
(Huttenlocher, 1976). it may be that plasma B-HBA concentrations in great excess of 2 m M
are unnecessary and perhaps even potentially hannful (Mitchell a al., 1995). As stated in the
literature review, a high ratio of plasma P-HBAlplaoma AcAc is indicative of a reduced
mitochondrial matrix (Le. the ratio of NADWNAD' is high). In the mitochondria, many
reactions occur which require the transfer of electrons. NADH and NAD' are involved in
most of these reactions since they are capable of donating and accepting electrons,
respectively. When there is more NADH than NAD' in the mitochondria, the reactions
requiring electrons Rom NADH (such as the production of ATP in the electron transport
chah) are favored over those that require NAD'^^ accept electrons. It has been hypothesized
that the efficacy of the KD is dependent on a reduced rnitochondrial matrix in which the
synthesis of AT' is more efficient (Kashiwaya et d., 1997). However, if the ratio of NADH:
NAD' is too high (Le. the ratio of plasma P-HBA:plasma AcAc is too high), a case of
"overkill" can aise with respect to the reducing environment of the mitochondno, since
insufficient amounts of AC& w ~ d d k availabie to the TCA cycle for energy production
(Kaohiwaya et ai., 1997).
Whether the mechanism of the KD ir more dependent on plasnu AcAc or on the ratio
of plasma B-HBkplasma AcAc, the importance of plasma AcAc should not be ncglccted.
Plasma AcAc is diffiath to matsure because AcAc is a volaîile wmpound and must be
analyzed immediately (Mitchell et al., 1995). Breath acetone is produceci dkct ly fkom the
spontaneous decarboxylation of AcAc, and it is significantly comlated with plasma AcAc, as
observed in this thesis. Furthemore, breath acetone is also significantly wrrelated Mth
plasma P-HBA Because breath satone anaiysis is non-invasive and because it bc
performed as fiequently as necessary (unlike urinary AcAc anaiysis), it has the potentid to
become an important tool for parents with a child on the KD.
Several objectives were outlined in Chapter 3. The following is a review of these
objectives as well as a Y (for yes) or N (for no) indicating whether or not each objective was
achieved - Develop a system for breath acetone collection d a n a i y s i s in a rat mode/ of the KD. Y - Eum>ine correIations between breath acetone anà p h a AcAc and S H B A in a rat
madel of the KD. Y/N
Because AcAc is a volatile wmpound it mua be analyzed immediately. Since the rat
plasma samples were eozen pior to AcAc analysis, al1 of the AcAc within the plasma
samples was lost and reliable AcAc data could not be obtained. Thus, correlations

between breath -one and plasma AcAc could not be uamined in the rat mode1 of
ketosis.
DewIbp a sysiem of breath acetm coIIectim mdan&sis f i humaDts. YIN
Although a system of breath acetone cdlection and d y s i s for humans w u developed,
this system had limitaîions. Breath samples could not be stored in tubes for longer than 6
min without losing a significant amount of the acetone. Thus, abjects had to be present
in the laboratory during breath collection so that breath samples could be injected direct-
ly into the gas chromatognph. This is not very convcnient, tspecially if the subjects WC
wish to work with in the finire are hospitalued epileptic patients k i n g initiated on the
K.. Thus the system of breath collection and analysh for humans must be rnodified in
order to accommodate firture ofhite studies,
Examine comlations between breath acetone and plasma AcAc and P-HBA in adult
volunteers in acutdshort-term ketosis. Y - Examine correlations between urinary AcAc and plasma AcAc and P-HBA in adult
volunteers in acute/short-term ketosis. Y
7.5 FUTURE STUDIES
These findings regarding the reliability of breath acetone as an indicator of ketosis are
promising; however, more research needs to be conducteci. Rats in a state of long-term
ketosis have been studied, but adults in such a state have not. Furthermore, the relationship
between breath acetone and each of the plasma ketones n a d s to be examined in childrcn
both in an acute and long-tem state of ketosis. In o r d a to address these issues, several
methodological problems must k addressed. As the situation stands, bmth -one slmpler
cannot be stored in ewmated g l u s tubes for longer than 6 minutes (sec section 5-4-2). Thus,
either a method of breaîh sample stomge must be developed or a portable breath acetone
analyzer mua be created. Alsq chüdren with epilepsy are ofkn dcvelopmentally Md
mentally delayed and getting a breath simple fiom thern xnay k quite challenging. Thus, the
method of breath collection must be modified. When these issues are resolved, it will be
more practical to study children on the KD in cliniuVhome settings.
7.6 POTENTLAL CLINICAL APPLICATIONS OF BREATH ACETONE ANALYSIS
Although this thesis has focused on the therapeutic effects of the KD in treating
intractable epilepsy, breath acetone analysis is not limited to this a r a Other populations may
benefit fiom breath acetone analysis. Breath acetone has already been found to correlate with
metabolic States (ie. weight loss, weight gain, diabetes meIlitus) both in newbom babies and
in children (Nelson et al., 1998). Diabetics, for whom ketoacidosis and diabetic coma are
life-threatening, can benefit greatly corn breath acetone analysis.
The KD is being used to treat conditions other than intractable epilepsy. The W has
been used for weight loss purposes (Ross a al.. 1991; Saunders et al., 1993). and breath
acetone analysis may be an important tool for monitoring progress in KD-based weight los
programs. A h , the KD is being ~tudied for its therapeutic use in the treatment of certain
cancers. Associated with cancer is cancer cachexia, a catabolic state in which there is
accelerated weight loss (Beck et al., 1989). The weight loss arises primarily fiom the
increased energy needs of tumor tells. Tumor cells are known to have a high rate of glucose
maabolism and to be susceptible to cubohydnte deprivation (Feuon et al., 1988).
Furthemore, many tumon are obligatc glucose m c u b o h since tbey lack catain k y
mitochondrial cnqmcs necgsary for fktkctone body metabolhm (Fearon a ai., 1988). This,
a rationaie for implcmenting th KD in artUn cancer patients is that the hunor might k
deprived of energy while an adquate cnetgy supply would k maintUncd to the ho* (Fearon
et al., 1988). An MCT-basd KD has already b e n shown to induce signifiant weight gain in
severely cachectic patienîs (Fcaron et ai., 1988) and to prcvcnt waght ioss and r&fe tbe
tumor burden in a mouse mode1 of cachexia, (Tisdaie et al., 1987; Beck et al., 1989). in the
future, breath acetone anaiysis may becorne an important, non-invasive indicator of ketosis
for cancer patients consuming a KD.
CHAPTER 8.0 REFERENCES
Appleton, D. B. and De Vivo, D. C. An animal mode1 for the ketogenic diet. EpiIepsia 1974; 15: 21 1-227.
Beck, S. A, and Tisdaie, M J. Effect of insulin on weight l o s snd tumor growth in cachexia rnodel. British J m m I of Cprrrr 1989; 59(5): 67768 1.
Bough, K. J. A ketogcnic diet increaser resistance to p e n t y I e n e t ~ I e - i n d u c e d sehures in the rat. Qiiepsià 1999; 4q2): 1 38-43.
Crofford, O. B., Mallard, R E., Winton, R E., et al. Acetone in breath and blood. Tram Am Ciin Climatol Assoc 1977; 88: 128-139.
De Vivo, D. C., Trifilai, R R, Jacobsen, R 1.. et al. D e f M v e glucose transport across the blood-brain bamier as a cause of persistent hypoglycorrhachia, riaires, and developmental delay. New EjlglandJmrmi of Medicine 199 1 ; 325: 703-709.
Euler D. E., Da&, S. J., and Guo, H. Effect of cigarette smoking on pentane excretion in alveolar breath- Chin Chem 1996; 42: 303-308.
Fearon, K., Borland, W., Preston, T., Tisdale, M. J., Shenkin, A, and Cdman, K. C. Cancer Cachexia: Influence of systemic ketosis on substrate levels and nitrogen metabolism. Amencan Jmmaf of C i in id Nutrition 1988; 47: 42-48.
Freeman, J. M., Kelly, M T., and Freeman, J. B. ?he Epilepsy Diet Treatment: An ~nhoduction to the Ketogenic Diet (p ~dilon)). New York: Demos Vennande, 1996.
Freund, G. and Weinsier, R L. Standardized ketosis in man following medium chah tnglyceride ingestion. Metabolism 1966; ls(l1): 980-99 1.
Freund, G. The calorie deficiency hypothesis of ketogenesis tested in man. Metabolism 1965; 14(9): 985-990,
Grecksch, G., Becker, A, and R a u q C. Effect of age on pentylenetetnizol-kindling and kindling-induced impairments of leaming performance. Pharmacollogv B i o c k m i w and Behwior 1997; 5q4) 595-60 1.
Guberman, A H and Bruni, J. Ciinimi Handbook of Epiiepsy. Ontario: Meducom International Inc., 1997.
Hall, S. E. H., Wastney, M. E., Bolton, T. M., Braaten, J., T., and Berman, M. Ketone Body Kinetics in Humans: The effeas of insulin-dependent diabetes, obesity, and starvation. J m ~ f ofLipid Resemch 1984; 25 : 1 1 84- 1 1 94.

Harano, Y-, Ohtsuki, M. Ida, M. Kojima, H.. Hamda, M. Okadshi, T., Kashiwagi, A, Ochi, Y.. Um, S., d Shig- Y. Dirrct auîomated assay method for semm or urine levels of ketone bodies. C h i a Chimica Ac& 1985; 1 5 1 : 177- 1 83 -
Hori, A, Tandon, P., Holmcs, O. L., and Stafsttom, C. E. Kctogmic diet: Effects on expression of kindled sciaires and behavior in dult rats. eilepsra 1997; 38(7): 750- 758.
Huttenlocher, P. R Ketonernia and seizures: Metabolic and anticonvulsant effects of two ketogenic dias in childhood epilepsy. Pediaîrïc Reseurch 1976; 10: 536540.
Huttenlocher, P. R and Wilboum, A J., Signore, J. M. Mediurnehain triglycerides as a therapy for intradabk childhood epilepsy. Nerrrofogy 1971; 2 1 : 1097-1 103.
Jones, A W. Breath acetone concentrations in fisting male volunteers: Further shidies and effect of alcohol administration. J i 1 ofrlm&ticaf Tox~cofogy 1988; 12: 75-79.
Kashiwaya, Y., King, M. T., and Veech, R L. Substrate Signaling by Insulin: A ketone bodies ratio mimics insulin action ifi heart. The Americon Jrnm~I of Cordiofogy 1997; 80(3A): SOAd4A).
Kupari, M, Lommi, i., Ventila, M., and walainen, U. Breath acetone in congestive heart failure. The Amerkm Jmmaf of Cordiofogy 1995; 76: 1076-1 078.
Livingston, S . Comprelrnnnnve management of epilepsy in infmcy. chifcilhood, and adolescence. Illinois: Thomas Books, 1972.
Mahoney, A W., Hendricks, D. G., Bernhard, N., and Sisson, D. V. Fasting and ketogenic diet effects on audiogenic seizure susceptibility of magnesium deticient rats. Pharmacology Biuchentisfry and Behuvior 1983; 18: 683687.
Mitchell, G. A, Kassovska-Bratinova, S., Boukaftane, Y., Robert, M-F., Wang, S. P., Ashmarina, L., Lambert, M., Lapierre, P., and Potier, E. Medical aspects of ketone body metabolism. Clinid ad lnvestigative Medicine 1995; 18(3): 193-2 16.
Mitsui, T., Yuza, N., Kato, N., and Kondo, T. 1s acetone a normal breath constituent in Japanese? CIinica Chimica Acta 1999; 280: 205-208.
Nakazawa, M., Kodama, S., and Matsuo. T. Effects of ketogenic diet on electroconvulsive threshold and brain contents of adenosine nucleotides. Brain rmdDevelopmenr 1983; 5(4): 375-380.
Nelson, N., Lagessan, V., Nosratabadi, A R, Ludvigsson, J., and Tagesson, C. Exhaled isoprene and acetone in newborn infants and in children with diabetes meIlitus. Pediohic Reseatch 1998; 44(3): 363-367.
Nordli, D. R and De D. C. The kaogenic diet revisittd: Ba& to the fiinire. QiLecpa 1997; 38(7): 743-749.
Phillips, M. Detection of endogenous acetonc in normal human b d . J-l of Chromatogrqphy 1987; 422: 235-238.
Pfa~ad, A N., Stafkorn, C. F., Holmes, O. L. Altermtive epilepry tharpies: The ketogaiic diet, immunoglobulins, ud steroids. Qifeprta 19%; 37(Suppl. 1): S8 1-S95.
Ross, R, Leger, L., Madisr. E. B., Morris, D. V., ancl Gougson, R Adipose tissue distribution changes during npid weight los in obese adults. Intemtionai J- of Obesity 1991; 15: 733-739.
Saunders, N. H, Al-Zeibak, S., Ryde, S. J. S., and Birks, J- L. The composition of weight loss in dieting obese fernales by electrical methods. Intemutiomf J i f of Obesiq md Rehed MetaboIic Diswders 1 993; 1 ï(6): 3 1 7-3 22.
Schwartz, R H., Eaton, J., Bower, B. D., and Aynsley-Green, A Ketogenic diets in the treatment of epilepsy : S hort-term clinical effects. Dewelopmenrol Medicine and Child Neuroiogy 1989; 31: 145-151.
Swink, T. D., Vining. E. P. G., and Frezman, J. M. Chapter 9 -The ketogenic diet: 1997. Advances in Pediaîrics 1 997; 44: 297-329.
The Handbook of Chemistry and Physics. Florida, Boca Raton: CRC Press hc., 1986.
Tisdale, M. J., Breman, R A, and Fearon, K C. H Reduction of weight loss and tumor size in a cachexia model by a high fat diet. British J m m l of Cmrcer 1987; 56: 39-45.
Uhlemann, E. R and Neims, A H- Anticonvulsant properties of the ketogenic diet in mice. The Jmmaf of Phutnacology and Experirnental ï7terapatic.s 1972; 1 80: 23 1-23 8.
Wheless, J.W. The Ketogenic diet: fact or fiction. Jmmaf of ChiIdNeurology 1995; lO(6): 4 19-423,
Wilder, R M. The effect of ketonemia on the course of epilepsy. Mqyo Chic Bulletin 1921; 2: 307.
Yehuda, S., Caruso, R L., and Mostofsky. D. 1. Essential fatty acid preparation raises the seisun threshold in rats. Eunpean Jourmil of Phonnaco fogy 1994; 245 : 1 93 - 198.
9.1 TABLE OF CONTENTS
Appendix A
Expenment 3: The E f f i of a Flaxseed Oil Kctogenic Diet on Seinire Protection .................................................... In a Rat Mode1 of the Kctogenic Did A-i
............................................................................ Objective A4
Materials and Methods ....................................................... A-i
............................................................................... Results A 4
-. ........................................................................... Discussion A-11
Appendix B
..................... Expenment 4: Pentylenetetrazol (PTZ) Dose Response Study B-i
............................................................................ Objective B-i
.......................................................................... Hypothesis B-i
.......................................................... Materials and Methods B-i
.............................................................................. Results B-ii
.......................................................................... Discussion B-iv
Appendix C
Expenment 5: The Effect of Fat Source on Plasma Ketones, Breath Acetone, and ............................. Seinire Protection in a Rat Mode1 of the Ketogenic Diet C-i
.......................................................................... Objectives C-i
......................................................................... Hypotheses C-i
........................................................... Materials and Methods C-i
...................................... Results ...................................... ,. C-ii
Discussion ..............................................-...--..-.....-.-......-.... C-x
Appendix D
Consent Fonn for Participation in the Ketogenic Diet Study ......-................. D i
9.2 LIST OF TABLES
Table A-1 : Results of Seiaire Test ..................................................... A-iii
Table B-1 : Results of Pentylenetetrazol (PTZ) Dose Response Study .............. B-iii
Table C-1: Final Blood Glucose and Plasma j3-HBA Concentrations of Control And Ketotic Rats.. ............................................................ C-viii
Table C-2: Results of Seizure Test ........................~......~...................... C-ix
9.3 LIST OF FIGURES
Figure C- 1 : Weights of Control and Ketotic Rats ...................................... C-iv
Figure C-2: Weight Gain of Control and Ketotic Rats ................................ C-v
Figure C-3 : Blood Glucose in Control and Ketotic Rats ................... .. ........ C-vi
Figure C-4: Plasma P-HBA in Control and Ketotic Rats ............................. C-vii
EXPERIMENT 3: THE EFFECT OF A FLAXSEED OIL KETOGENIC DIET ON SEIZURE PROTECTION IN A RAT MODEL OF KETOSIS
Objective
a To determine the effenr of a f l a x d oil KD on KUure protection in a rat mode1 of
ketosis.
HypothesW
Rats wnsuming a flaxseed oil KD will exhibit seizure protection when srimulated by a
convulsant.
Materials and Methods
The control and ketotic rats that were seizure tested were the sarne rats used in
Experiment 1. For an ovewiew of the expenment (Le. when the rats were weaned, length of
time on the diet, etc.), refer to section 6.1.1. For differences in blood glucose, plasma P-
HBA, breath acetone, and food intake between control and ketotic rats, refer to section 6.1.2.
A PTZ seizure test was conducted when the rats of Experiment 1 were 53 d old, using
a dosage of 80 mg/kg, injected i-p. (This particular dosage and route of administration were
used becaux in a study by Yehuda et al. (1994). rats comparable in age and strain to the rats
of this experiment and receiving an essential fatty acid preparation, were challengeci with 100
m f l g of PTZ, i.p) The seinire test was videotaped and several parameters were measured
including incidence of generaiized tonic-clonic seizures, latency of seinire onset, uid
incidence of mortality. The timeframe assesseci was the fifieen minutes post injection.
Results
Neithet contrai nor ketotic rats exhibiteci seiave protection during the PTZ s c b e
test (sec Table A-1).
Discussion
Although seiaire protection in the kctotic rats wu not obsaved, it is very Wrely that
the dosage of PT2 uscd to induce the seizures was too m n g and way above the threshold of
the KD.
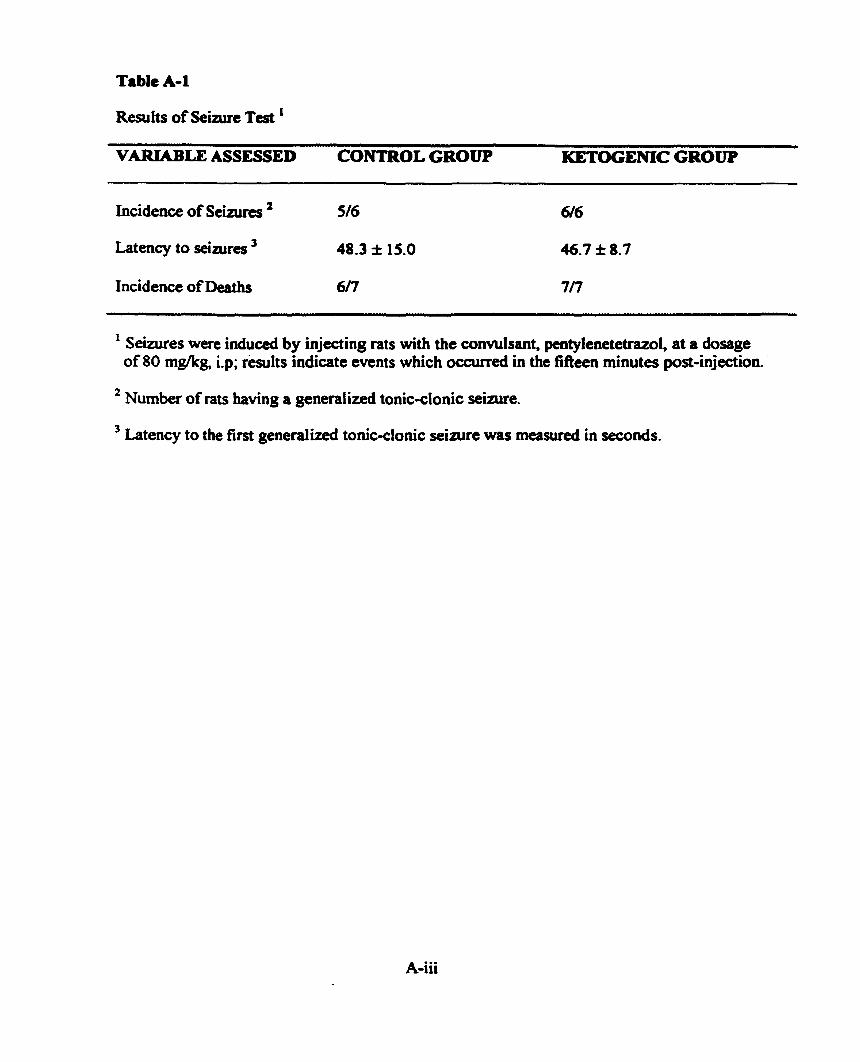
Table A-1
Resufts of S e w e Test ' VARIABLE ASSESSED CONTROL GROUP KETOCENIC GROUP
Incidence of Seizurcs 516
Latnicy to seiwes ' 48-3 * 15.0
Incidence of Deaîhs 6ff
Seiaires were induced by injecting rats with the convulsant, pentylenetetrazol at a dosage of 80 mgkg, i.p; r i l t s indicate events which ocairred in the fifieen minutes port-injection.
Number of rats having a generalized tonic-clonic sebue.
Latency to the fim generalized tonic-clonic seizure was measwed in seconds.
EXPERIMENT 4: PENTYLENETETRAZOL (PTZ) DOSE RESPONSE STUDY
Objective
To determine the dose of PTZ rcquird to elicit sub-maximal seizures (generalked toaic-
clonic, without hind limb extension) in the rats of Expaiment 5 (see Appendix C).
Hypotbuis
The dose of PT2 required to elicit sub-maximal seizures in the rats of Experiment 5 is
leu than 80 mWkg and should be injected S.C. rather than i.p.
Materiais and Methods
The rats in Expairnent 5 (see Appendix C) varied greatly in their body weights (Le.
MCT rats weighed approximately half as much as control rats); thus, it was necessary to
decide whether to conduct the PTZ dose-response study on rats that were sirnilar in weight to
the heavier (control) rats or the lighter (MCT) rats. A study conduaed by Grecksch et al.,
(1997) indicated that younger (lighter) rats have a higher seinire threshold comparecl to older
rats. Thus, rats sirnilar in weight to the control rats of Experiment 5 were used for the PT2
dose-response study.
Forty-eight male albino Wistar rats weighing berneen 25 1 g and 275 g were ordered
for this study. Upon arriva!, the rats were given four days to acclimitize to the environment
and were allowed unlimiteci access to the AIN 93G dict (for details on this diet, refer to
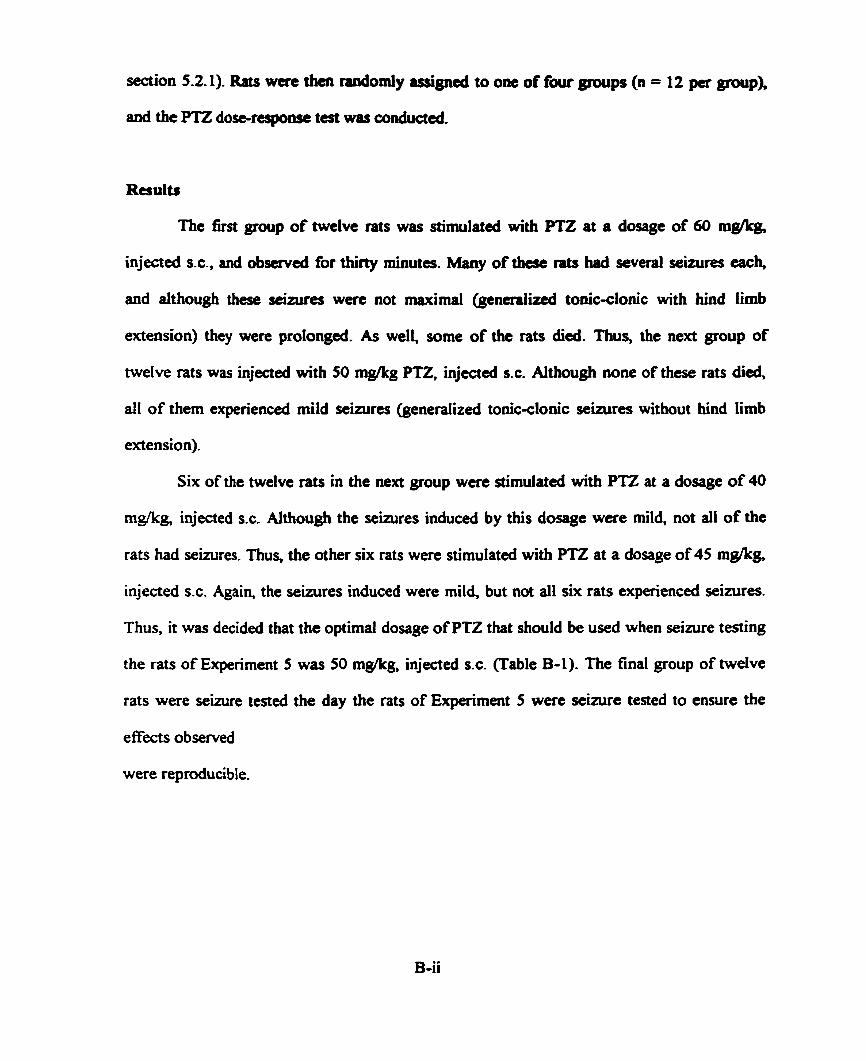
m i o n 5.2.1). RAB were then randomly assignai to oae of fau p u p s (n = 12 pcr (goup),
and the PTZ dore-responre test wu conduad
Results
The &si group of twelve rats was stimulateci with PT2 at a dosage of 60 m@g,
injected s-c., and obsefved for thirty minutes. Msny of thae rats had several seinires each,
and aithough these rimes were not maximal (gencraiizcd tonic-clonic with hind Limb
extension) they were prolongeci. As weli, some of the rats died. Thus the next group of
twelve rats was injected with 50 m@g PTZ, injected S.C. Although none of these rats di&
dl of them experienced mild seinires (genemlized tonic-clonic s e h r e s witbout hind limb
extension).
Six of the twelve rats in the nen group were stimulated with PTZ at a dosage of 40
mgficg injected S.C. Although the seinires indu& by this dosage were mi14 not d l of the
rats had seizures. Thus the other six rats were stimulated with PTZ at a dosage of 45 m f i g
injected S.C. Again, the seinires induced were mi14 but not al1 six rats experienced seizures.
Thus it was decided that the optimal dosage of PT2 that should be used when seizure testing
the rats of Expenment 5 was 50 mgkg, injected S.C. (Table B-1). The final group of twelve
rats were seiaire tested the day the rats of Experiment 5 were seizure tested to ensure the
e ffects observai
were reproducible.
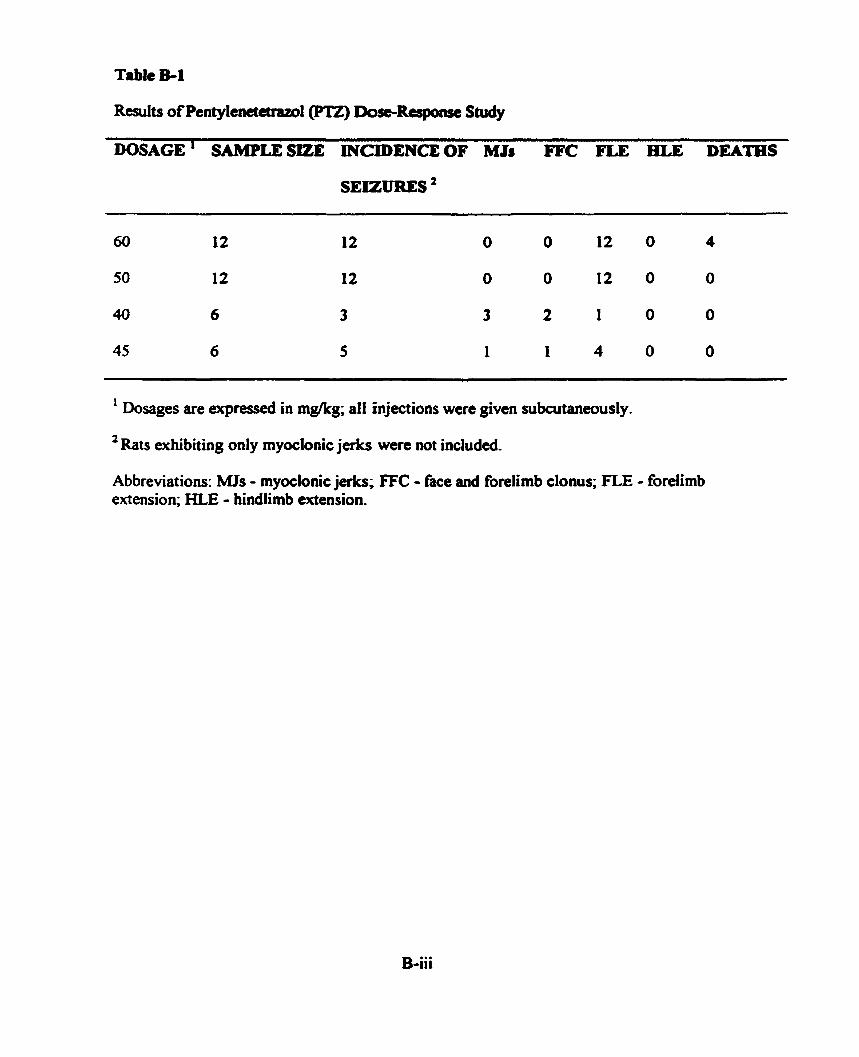
Table El
ResuIts of Pentylenetetraml(P'I2) Dose-Response Study
DOSAGE ' SAMPLESIZE PlCIDENCEOF MJs FFC FLE HLE DEATES
SEIZURES '
1 Dosages are expressed in mgkg; al1 injections were given subcutaneously.
' Rats exhibiting only myoclonic jerks were not included.
Abbreviations: MJs - myoclonic jerks; FFC - face and forelimb clonus; FLE - forelimb extension; HLE - hindlimb extension,
Discussion
The dosage of PTZ that was fowd to dicit 1000A incidence of Mld seizures
heneraiized tonicclonic s e h e s without hind limb extauion) in rats comparable in weight
to the conîrol rats of Experiment 5 was 50 mgkg s.c. (Tabk B-1).
EXPERSMENT 5: THE EFFECT OF FAT SOüRCE ON PLASMA KETONES, BREATH ACETONE, AND SEIZURE PROTECTION IN A
RAT MODEL OF THE KETOGENIC DIET
Objectives
To detennine th effbct of fat source on plasma p-HBA levels, breath acetone levels, and
seiaire protection in a rat modei of the KD,
To detennine the effect of fat source on the correlation between breath acetone and
plasma B-HBA
Hypotheses
As long as rats attain a plasma B-HBA concentration of at least 2 mM at the time of
seizure-testing, there will be no effect of fat source on seizure protection.
Rats in the MCT oil KD group will attain the highest breath acetone and plasma f5-HBA
Materials and Mtthods
Six litters of 17 d old male albino Wistar rats (ten rats per litter) arrivecl at the facility
with their dams. The pups were given three days to acclimatize to their new environment and
at 20 d of age, the rats were weaned and randomly divided into one of five groups: control
butter-based KD, flaxseed oii-based K., MCT oil-based KD, or fat mixture (consisting of
equal proportions of butter, flaxseed oil, and MCT oil) KD. (ReTer to d o n 5.1.1 for details
on control and ketoge~c diet compositions; the information prcscnted on the flaxseed oil KD
in section 5.1.1 is applicable to the other KDs as well.) Rats were housed in plastic cages
with wood chip M i n g and wae placed on a 12 h lightIl2 h dulr cycle (lia& wae tunvd
on at 7:00 AM). For the f h t eight days aAer k i n g weaned, the Ru were boured two to a
cage in order to minimire the stresses associated with king weansd. From 28 d of a p until
the end of the atpcriment (68 d of age) rats were houscd individwlly.
At 20 d of age, control rats w m given the AIN 93 G dia cd lib. In order to assist the
rats in the ketogenic diet groups to adjust to the 3.5: 1 KDs, they were graduaily weaned ont0
the di&; that is, at 20 d of age, these rats were given unlimited access to a 1: 1 KD, and then
at 24 d of age, they were given unlimited access to a 2: 1 KD. A d lib feeding of the 3-53 KD
did not occur until the rats were 28 d old. The added fat source in the 1: 1,2: 1, and 3.5:1 K D s
was consistent (Le. the butter-based KD group received a 1 : 1 butter-based KD for four days,
a 2: 1 butter-baseci KD for the next four days, and then the a d 3 -5: 1 butter-based KD from
28 d of age until the remainder of the experiment). All rats were weighed at 20 d of age and
approximately every four days thereafter until the rats were 68 days of age. All the rats fiom
each group undenvent penodic blood and breath sampling. Also, these sarne rats undement
seinire testing when they were 68 d old, using the convulsant, PTZ.
The dosage of PTZ that would elicit only mild s e i w e s in the experimental rats was
determined in Experiment 4 (see Appendix B). The appropriate dosage was found to be 50
mgkg of PTZ, injected S.C.
Results
Several unexpected problems with acetone analysis were enwuntered dunng the
course of this expriment. The gas chromatopph began to malfunction early in the
experiment; thus, breath acetone analyses could not be performed until later on in the

experirnent (rats wcre 59 d old). Although brcath -one wu anaîyzcd whea the gas
chromatognph wu rrprirrd, the m ~ m t n t s were vcry inaccurate because the gas-tight
syringe that was being used to inject the brcath s ~ p l c r into the gas chromatograph had lost
its seal. Thus, chan~es in brcath acetone over time as well as wrrelaîions deaiing with breath
acetone couid not k analyzed. Changes in weight, weight gain, blood glucose, and plasma
HBA were monitored throughout the experiment. Because groups of nts were blood sampled
on dinerent days, across-group cornparisons of final ~oncenttstions of blood glucose a d
plasma P-HBA were dificult to make. In order to estirnate these differences, the averages of
the last two meaJures of blood glucose and plasma 8-HBA were calculateci for each rat and
these figures were used to detennine differences between the five d i a groups.
By the end of the expenment, rats in the control, butter, flaxseed, and mixture p u p s
did not differ significantly in weight or weight gain; however, rats in the MCT group
weighed significantly l e u and gained significantly less weight than ail the other rats @ <
0.05; see Figures C-1 and Figure C-2).
Changes in blood glucose and plasma fi-HBA over time are depicted in Figures C-3
and C-4, respectively. Final blood glucose and plasma P-HBA concentrations are presented
in Table C- 1. By the end of the experiment, control rats had the highest blood gluwse and
the lowest plasma P-HBA while MCT rats had the lowen blood glucose and the highest
plasma P-HBA Rats in the butter, flaxseed, and mixture diet groups had a very similar blood
glucose and plasma 0-HBA For significant differences between the groups, refer to Table C-
l.
Results of the PT2 r i z u r e test (Table C-2) indiatecl there were no signifiant
differences in the latency of riaires, severity of &aires, and incidence of mortality amss
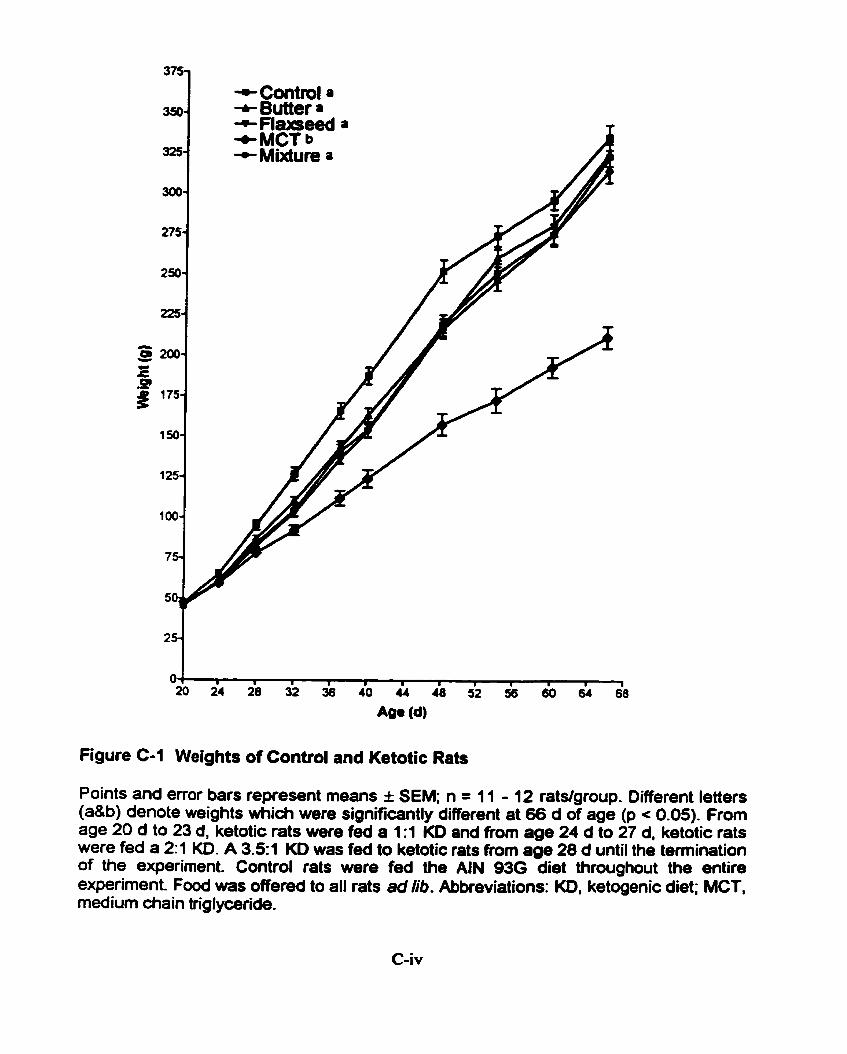
+Control a + Butter a
Figure C-1 Weights of Control and Ketotic Rats
Points and error bars represent means i SEM; n = 11 - 12 rats/group. Different letters (a&b) denote weights which were significantly different at 66 d of age (p c 0.05). Frorn age 20 d to 23 d, ketotic rats were fed a 1:l KD and from age 24 d to 27 d, ketotic rats were fed a 2:1 KD. A 3.51 KD was fed to ketotic rats fmm age 28 d until the temination of the experiment. Control rats were fed the AIN 93G diet throughout the entire experiment. Food was offered to al1 rats ad lib. Abbreviations: KD. ketogenic diet; MCT, medium diain triglyœride.
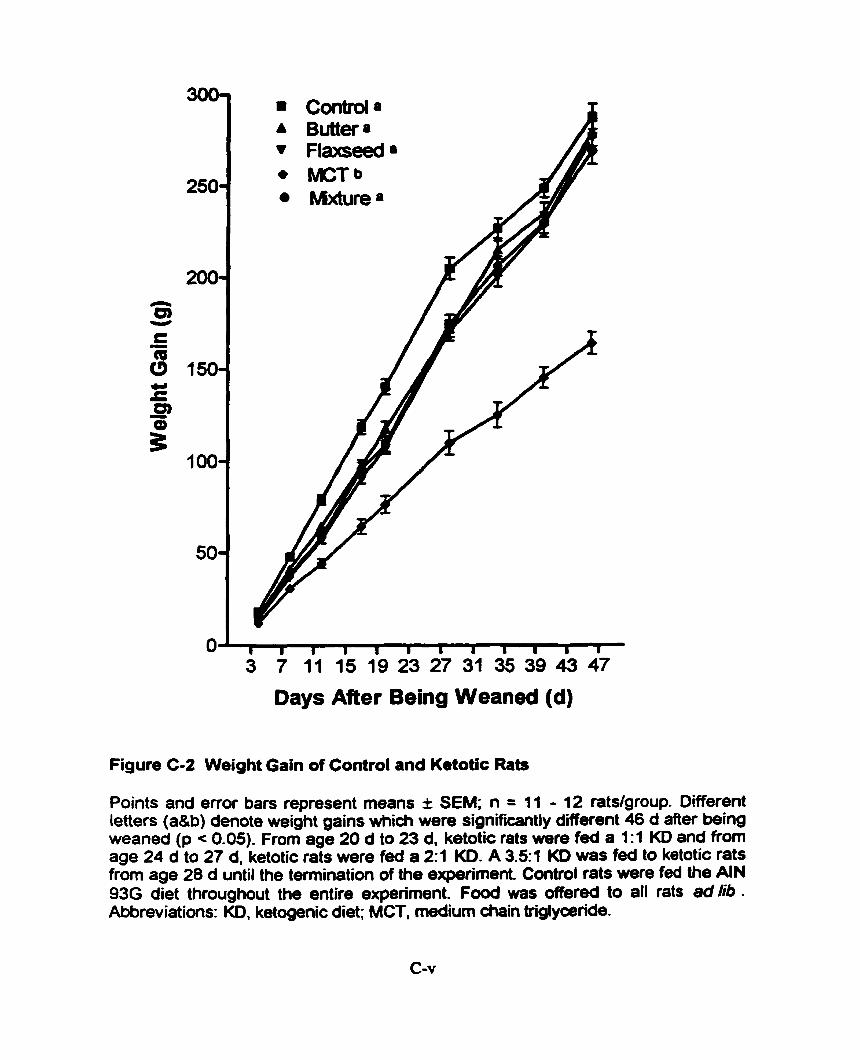
I I I I I I I a a a I I
3 7 11 15 19 23 27 31 35 39 43 47
Days After Being Weaned (d)
Figure C-2 Weight Gain of Control and Ketotic Rats
Points and error bars represent means I SEM; n = 11 - 12 ratdgroup. Different letters (a&b) denote weight gains midi were significantly different 46 d Mer being weaned (p c 0.05). From age 20 d to 23 d. ketotic rats were fed a 1:1 KD and from aga 24 d to 27 d, ketotic rats were fed a 2:l KD. A 3.5:l KD was fed to ketotic rats from age 28 d until the temination of the expriment. Control rats were fed the AIN 93G diet throughout the entire expriment. Food was offered to al1 rats ad lib . Abbreviatims: KD, ketogenic diet; MCT, medium chah triglyaride.

+ Butter +Fbmeed -c K T + Mixture + Control
Figure C-3 Blood Glucose in Control and Ketotic Rats
Points and error bars represent means f SEM; n = 11 - 12 ratdgroup. From aga 20 d to 23 d, ketotic rats were fed a 1:1 KD and from age 24 d to 27 d. ketotic rats were fed a 2:1 KD. A 3-51 KD was fed to ketotic rats from age 28 d until the temination of the experiment Control rats were fed the AIN 93G diet throughout the entire experiment. Food was offered to al1 rats ad lib . Abbreviations: KD, ketogenic diet; MCT, medium chah Mglyœride.
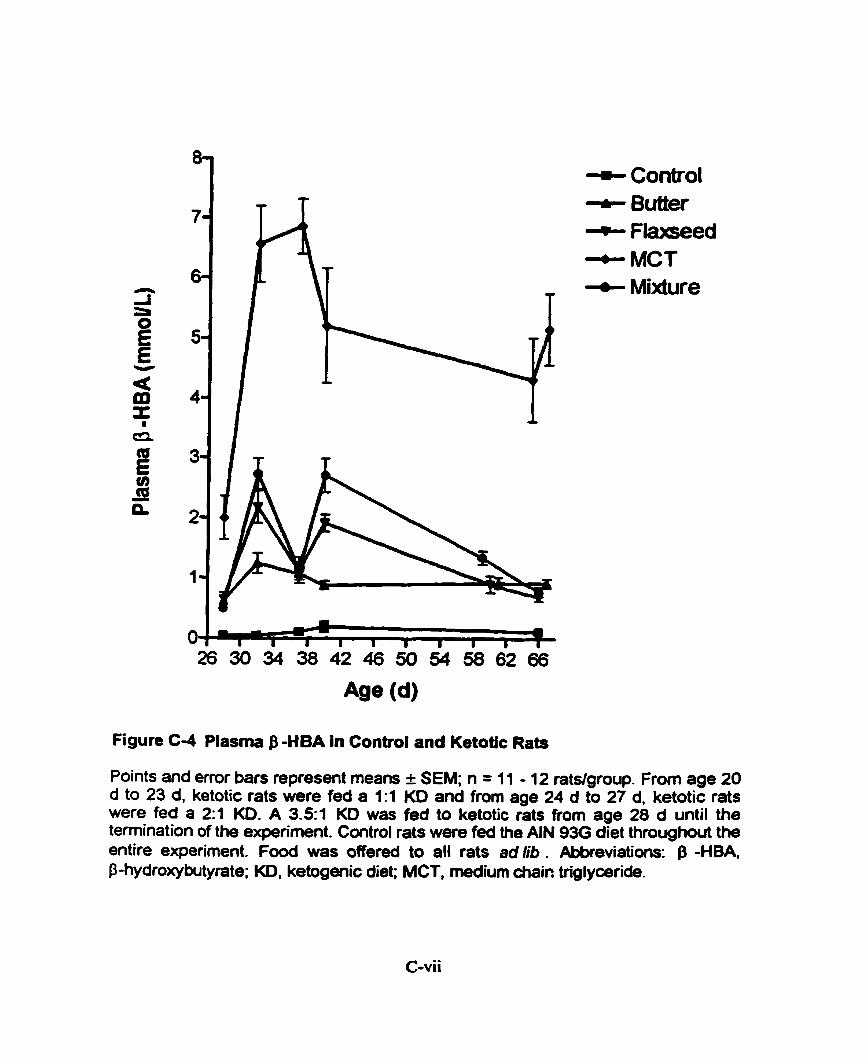
+ Control + Butter + Flaseed + MCT + Mixture
Figure C 4 Plasma $ -HBA in Control and Ketotic Rats
Points and error bars represent rneans I SEM; n = 11 - 12 ratslgroup. Frorn age 20 d to 23 d, ketotic rats were fed a 1:1 KD and from age 24 d to 27 d, ketotic rats were fed a 2:1 KD. A 3-51 KD was fed to ketotic rats from age 28 d until the temination of the expriment. Contml rats were fed the AIN 930 diet throughout the entire experirnent. Food was offered to al1 rats ad lib . Abbreviatians: -HBA P-hydroxybutyrate; KD, ketogenic diet; MCT, medium chair: triglymride.

Final Blood Glucose .ad Plasma &HBA Concentrations of Contd and K d c Rats ' EXPERIMENTAL BLOOD GLUCOSE PLASMA &HBA CROUP
Control
Butter
FI axseexi
Mixture
MCT
Final blood glucose and plasma P-HBA concentrations (in Mm) are averages ofthe last two measures taken for each rat.
A pair of letters that are the same within columns denote results which were not significantly different (p > 0.05). (Le. For blood glucose, because butter and flaxseed share a "b", the blood glucose values were not signi ficantiy difEerent .)
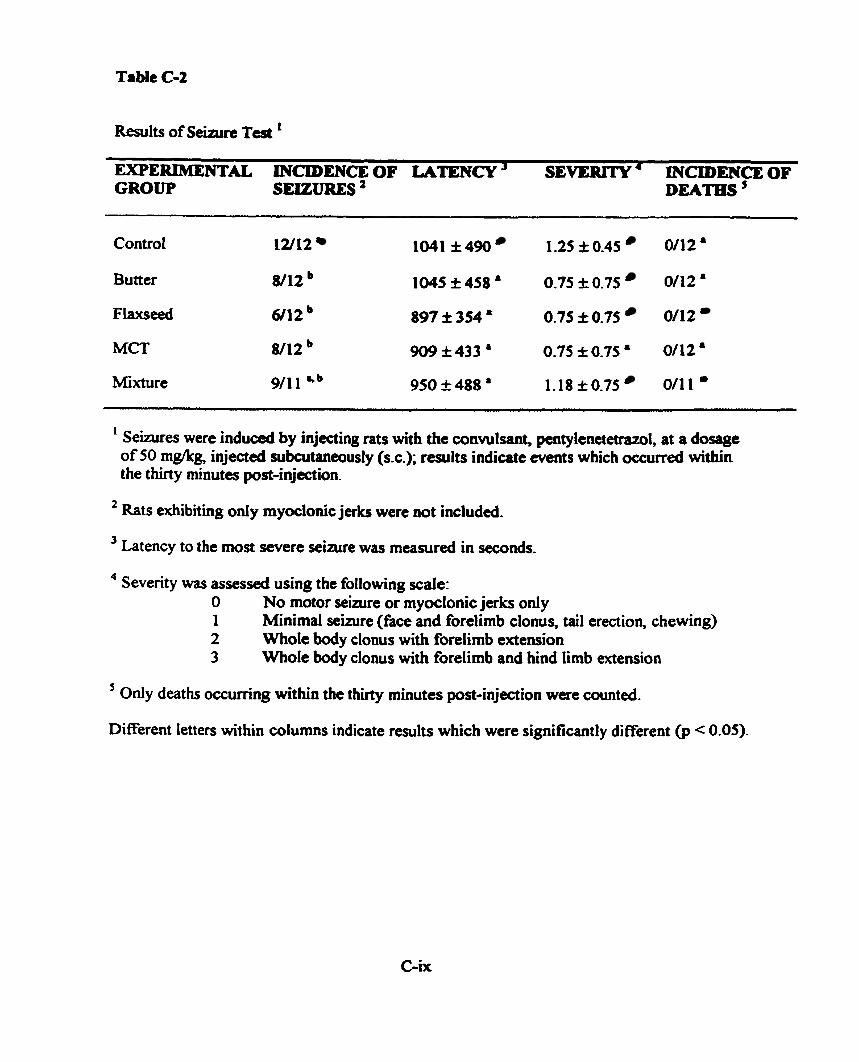
h l t s of Seinin Test ' EXPERIMENTAL INCIDENCE OF LATENCY ' SEVERITY ' INCIDENCE OF CROUP SEIZURES ' DEATHS '
- - -- -
Control 12/12 1041 f 490 1-25 f 0.45 0112 '
Butter 8/12 1045 I 4 5 8 ' 0.75 f 0.75 0112 '
Flaxseed 6/12 897 f 354 ' 0.75 f 0.75 0112
MCT 8/12 909k433 a 0.75f0.7S8 0/12&
Mixture 9/11 a.b 950 f 488 ' 1.18 f 0.75 011 1 '
1 Seizures were induced by injecting rats with the convulsant, pentylenetetrazol, at a dosage of 50 m@g, injecteci subnitaneously (s.c.); results indiate events which ocairred within the thirty minutes pst-injection.
Rats exhibiting only myoclonic jerks were not included.
Latency to the most seven seizure was meanireci in seconds.
4 Severity was assesseci using the following scale: O No motor sewre or myoclonic jerks only 1 Minimal seizure (face and forelimb clonus, tail erection, chewing) 2 Whole body clonus with forelimb extension 3 Whole body clonus with forelimb and hind limb extension
' 0nly deaths occumng within the thirty minutes pst-injection were counted.
Different letters within columns indicate results which were significantly different @ c 0.05)-
the five diet groups; however, ovedi, mts in the Baxseed, butta, and MCT diet groups hd
significantly lower incidences of seizures cornpueci to rats in the control and mixture diet
groups (p < 0.05).
D Wcussion
Although thae were no significant difierences in weight (Figure Col) and weight
gain (Figure C-2) between control, butter, flaxseed, and mixture rats, there were signifiunt
differences in weight and weight gain between MCT rats and al1 the other rats. MCT rats
weighed significantly l e s and gained significantly leos weight cornpueci to al1 the 0th- rats.
Although food intakes were not measured, it was obvious fiom the food that remained in the
food dishes that MCT rats were not eaîing as much as the other rats, in ternis of both amount
of food and energy intake. It is very likely that due to the high amount of MCT oil in the d i a
and the gastrointestinal side effects that are associateci with MCT ail the diet was
unpalatable. The MCT rats were probably unintentionally semi-stanred, and this may explain
their significantly lower blood glucose (Table C-1) and significantly higher plasma P-HBA
(Table C-1) compared to al1 the other rats. Blood glucose and plasma P-HBA were not
significantly different in the butter, flaxseed, and mixture rats, but their blood glucose was
generally lower than control rats and higher than MCT rats while their plasma P-HBA was
generally higher than control rats and lower than MCT rats (Table C-1). When examining
changes in blood glucose and plasma P-HBA over time, the same trends as those observed in
Experiment 1 can be seen (see S e d o n 6.1.3 and Figures C-3 and C-4).
Seizure t e r results indicated that flaxseed, butter, and MCT rats had a signifiuntly
lower incidence of seizures compared to control rats but that mixture rats were net
signifcantly diffacin nitha ficm the c o n û ~ l mr the otha ketotic nts (Table C-2). Why the
mixture rots âid not exhibit -e protection is unclear. Int«cstin@y, the mVdurr rats wae
the last group to be seizure teste& and they wae sciain tedêd eariy in the leanoon as
opposed to during the moming. Thus, a change in circadian rhythm may have had
something t o do with the effects observed.
It was hypothesizcd that cornparrd to control rats, rats consuming a KD would exhibit
seinire proteaion when stimulated with a convulsant so long as plasma p-HBA was ü leut
2 mM. Although the MCT gmup hnd the highest pluma &HBA (4.59 mM f 2.01 mM) .t
the time of the seizure test, they were not aEordeâ the greatest r i a i r e proteaion; nther, the
flaxseed oil group (whose plasma P-HBA was ody 0.77 mM t 0.28 mM), show& the
greatest degree of seizure protection. Interestingly, Bough (1999) also found no signifiant
correlation between B-HBA and seizure protection in his rat mode1 of the KD.
It was also hypothesized that the MCT group would atiain the highest plasma P-HBA,
and this was the case. Because MCFAÎ can be readily absorbed from the stornach into the
portal venous system and cross directly into hepatic mitochondria independently of the
carnitiae acyltransferase system, they are more ketogenic (Swink et al., 1997). Thus it was
expected that the MCT KD group would attain the highest plasma p-HBA.
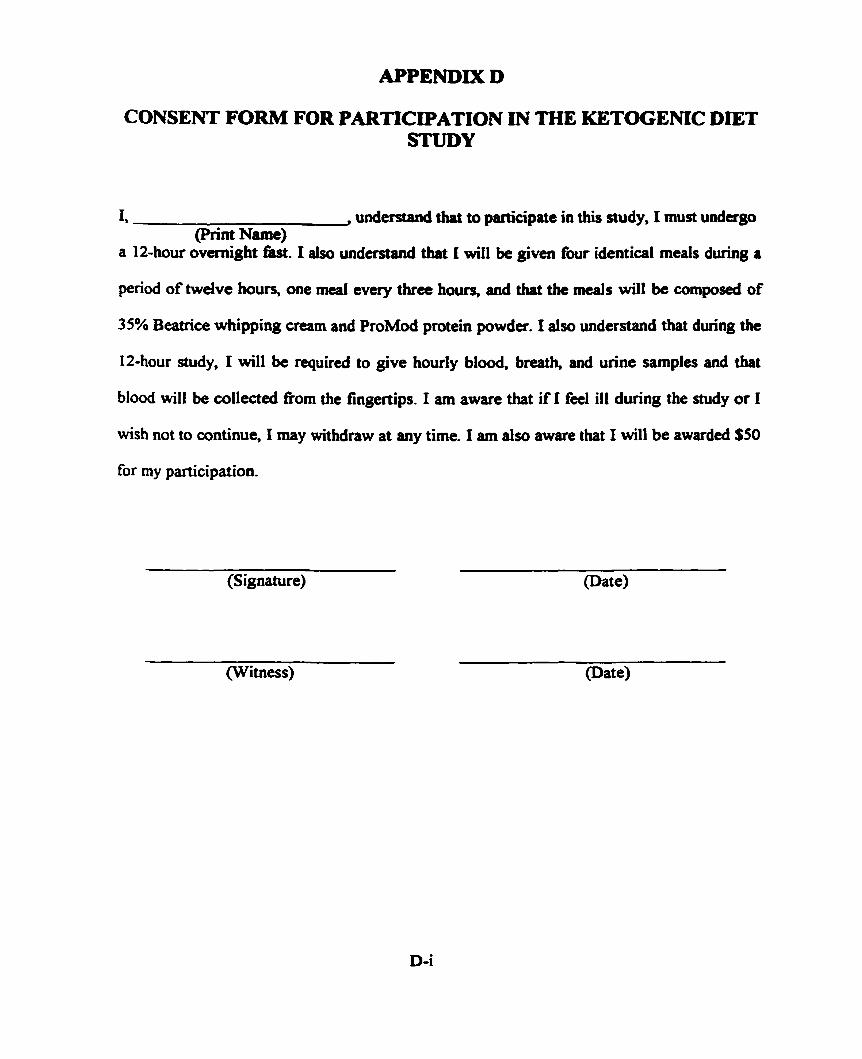
APPENDIX D
CONSENT FORM FOR PARTICIPATION IN THE K E T m E m DIET STUDY
I, , understand thaî to participate in this study, 1 must undago (PM~ Name)
a 12-hour ovemight fast. 1 dso understand that 1 will be given four identical meah during a
period of twelve hotus, one meal evecy thra houn, and that the meais will be composed of
35% Beatrïce whipping cream and ProMod protein powder. 1 dso understand that duruig the
12-hour study, 1 will k required to give hourly blooti, breath, and wïne samples and that
blood will be collected fiom the fingertips. 1 am aware that if 1 fa1 il1 during the study or I
wish not to continue, 1 may withdraw at any time. 1 am also aware that I will be awarded $50
for rny participation.
-- -.
(Signature)