as an example for bioactivity-based detection – A new ... · Zweckverband Landeswasserversorgung...
43
Zweckverband Landeswasserversorgung HPTLC/AMD with Vibrio fischeri as an example for bioactivity-based detection – A new dimension in analytics Wolfgang Schulz, Wolfram Seitz , and Walter H. Weber Zweckverband Landeswasserversorgung, Langenau, Germany International Symposium for HPTLC 11. – 13. June 2008, Helsinki International Symposium for HPTLC 11. – 13. June 2008, Helsinki
Transcript of as an example for bioactivity-based detection – A new ... · Zweckverband Landeswasserversorgung...

ZweckverbandLandeswasserversorgung
HPTLC/AMD with Vibrio fischerias an example for bioactivity-based detection –
A new dimension in analytics
Wolfgang Schulz, Wolfram Seitz, and Walter H. Weber
Zweckverband Landeswasserversorgung, Langenau, Germany
International Symposium for HPTLC11. – 13. June 2008, HelsinkiInternational Symposium for HPTLC11. – 13. June 2008, Helsinki

ZweckverbandLandeswasserversorgungStructureStructure
Advanced data evaluation
Introduction
Vibrio fischeri HPTLC test / Calculation of inhibition profiles
Conclusions
Aspects of the luminescence inhibition test / Application examples

ZweckverbandLandeswasserversorgung
Landeswasserversorgung is situatedin South GermanyLandeswasserversorgung is situatedin South Germany
www.wikipedia.de
Helsinki
Langenau

ZweckverbandLandeswasserversorgung
Distribution area inSouth West Germany
3 Million customerswithin distribution area
Long-distance waterfraction approx. 50%
Distributionarea of LW
Pipelinesof LW N
HessenBayern
Rheinland-Pfalz
Frankreich
SchweizÖsterreich
Heidel-berg
Tauber-bischofsheim
Bad Mergentheim
CrailsheimSchwäb.
HallKarlsruheHeilbronn
Pforzheim
StuttgartTübingen
Baden-Baden
Freuden-stadt
Aalen
UlmReutlingen
Offen-burg
Rottweil
FreiburgTuttlingen
Biberach
Ravensburg
FriedrichshafenSingen
Lörrach
Konstanz
Bayern
SBH OsterbuchSBH Aufhausen
Egau-Wasserwerk
VPW BurgbergVPWNiederstotzingenWW Langenau
RWP Leipheim
SBH Amstetten
WW Blaubeuren
SBH Heuberg
BH Schönbühl
Distribution area of LW in South West GermanyDistribution area of LW in South West Germany
Langenau Waterworks

ZweckverbandLandeswasserversorgung
4,0
Surface water(Danube)
Ground waterBlaubeurenGround waterBurgberg
Spring waterEgau waterworks
Ground waterDanube Reed
Other
90
80
70
60
50
40
30
20
10
020021993 1994 1995 1996 1997 1998 1999 2000 2001
2,0 5,9 7,3 6,5 6,44,7 4,04,0
30,1
32,5 34,028,6
27,123,7
28,031,2
28,0
18,8
20,0 20,5
16,816,2
15,0
18,718,5
16,1
10,4
9,6 8,9
9,8 9,912,1
10,0
10,98,8
3,1 2,8
2,9 3,3 2,73,0
21,3
19,315,9 24,0 26,5
31,6 28,0 26,2 31,3
82,6
90,488,0 88,3 89,6
91,8 92,0 92,9 93,4100
3,0 3,1
4,0
30,3
16,7
10,8
29,394,0
3,0
2003
5,9
11,3
102,3
Use of different resources for drinking water productionUse of different resources for drinking water production
32,5
17,3
4,0
32,9

ZweckverbandLandeswasserversorgungRiver Danube in South Germany (Leipheim)River Danube in South Germany (Leipheim)
Pump Station
Danube

ZweckverbandLandeswasserversorgung
Direct abstraction of river water (near Leipheim)Direct abstraction of river water (near Leipheim)

ZweckverbandLandeswasserversorgung
Concept of „Multidimensional Screening“for water contaminantsConcept of „Multidimensional Screening“for water contaminants
Gro
und
wat
erSu
rfac
e w
ater
DetectionSeparationEnrichment
Solid phaseextraction
Light phasePerforation
UV/VIS
Bioactivity
MS, MS/MS
ECD, FID, PND
Liquid liquidExtraction
SEC
TLC
CC
TLC
GC
HPLC
TLC
GC
HPLC
Clean-up

ZweckverbandLandeswasserversorgungStructureStructure
Advanced data evaluation
Introduction
Vibrio fischeri HPTLC test / Calculation of inhibition profiles
Conclusions
Aspects of the luminescence inhibition test / Application examples

ZweckverbandLandeswasserversorgungSelected bioactivity-based tests for HPTLCSelected bioactivity-based tests for HPTLC
Neurotoxicity testAcetylcholinesterase(enzyme)
Cytotoxicity test for fungicidesRhodoturula rubra(yeast)
Cytotoxicity test for antibiotic or cytostaticsubstances
Bacillus subtilis(bacterium)
Screening test for bioactivityVibrio fischeri(luminescent bacterium)
PurposeTest
Reference: C. Weins (2006), Dissertation, University of Basel, Switzerland

ZweckverbandLandeswasserversorgungLuminescent bacteria Vibrio fischeriLuminescent bacteria Vibrio fischeri
• Marine bacterium
• Lives in symbiosis with marine life forms
• Continuous bioluminescence
• Bioluminescence is coupled to
energy metabolism
Inhibition of electron transportIsolation
Narcoticeffects
Suspension of Vibrio fischeriin water
Reference: Reinecke, N. (2003), Dissertation, Universität Hamburg

ZweckverbandLandeswasserversorgungVibrio fischeri in water analysisVibrio fischeri in water analysis
• Classic application: Cuvette test (DIN 11348)
Detection of combination effects of toxic compounds(synergistic effects)
(1) LUMIStox 300(2) LUMIStherm

ZweckverbandLandeswasserversorgung
Reference:Weisemann, C., Kreiss, W., Rast, H-G., Eberz. G.;“Analytical Method for Investigating Mixtures for Toxic Components.” European Patent No: EP 0 588 139 B1.
Test Kit:BioluminexTM, ChromaDex, CA
Development ImmersionApplication(TLC Sampler)
Sample(extract)
Luminescence inhibition test on TLC platesLuminescence inhibition test on TLC plates

ZweckverbandLandeswasserversorgung
TLC plateafter immersioninto bacteria suspension
CCD cameraCamag Bioluminizer(typical detection time 40 sec)
Detection of luminescenceDetection of luminescence

ZweckverbandLandeswasserversorgung
Data evaluation –Calculation of inhibition profilesData evaluation –Calculation of inhibition profiles
ReferenceSample volume [µL] 10 20 30 40 50 60 70 80 90 100

ZweckverbandLandeswasserversorgung
233 159,35 153,31 154,55 156,95 2,32234 153,15 144,92 146,45 149,80 3,26235 144,05 137,28 139,55 141,80 3,19236 137,75 132,97 134,9 136,33 2,46237 136,45 133,89 133,35 134,90 0,75238 139,35 137,83 136,95 138,15 0,23239 146,4 146,19 146,1 146,25 0,04240 154,75 154,36 155,8 155,28 0,59241 162,5 162,92 163,8 163,15 0,14242 169,95 170,97 171,55 170,75 -0,13
Rn
SnP
n ii1I −=
I = Inhibitioni = Light intensityS = SampleR = Referencen = Number of pixel
Calculation of inhibition profilesCalculation of inhibition profiles
Nr. UGl Track6 UGr MW UG Inhibition [%]1 192,87 191,72 187,5 190,19 -0,812 193,1 191,97 188,35 190,73 -0,653 192,05 191,72 188,65 190,35 -0,724 195,05 192,47 190,75 192,90 0,225 196,15 192,69 192,1 194,13 0,746 197,8 189,25 193,7 195,75 3,327 197,05 184,14 193,65 195,35 5,748 198,2 177,42 193,7 195,95 9,469 199,4 171,47 195,35 197,38 13,12
10 199 168,53 195,95 197,48 14,6611 199,25 167,58 196,65 197,95 15,3412 200,25 166,64 197,6 198,93 16,2313 201,75 168,14 199,35 200,55 16,16

ZweckverbandLandeswasserversorgung
Inhibition chromatogramInhibition chromatogram
Track 6
-10,00
0,00
10,00
20,00
30,00
40,00
50,00
60,00
70,00
80,00
90,00
100,00
0 50 100 150 200 250Number of pixel
Inhi
bitio
n [%
]

ZweckverbandLandeswasserversorgungStructureStructure
Advanced data evaluation
Introduction
Vibrio fischeri HPTLC test / Calculation of inhibition profiles
Conclusions
Aspects of the luminescence inhibition test / Application examples

ZweckverbandLandeswasserversorgung
)ln(11
DosisbaeccR ⋅−+
−+=
bba ceEC /1/50 )21( ⋅−⋅=
R: Response (inhibition) c: Controla: Location parameterb: Slope parameter
Comparison of sensitivity of cuvette test and HPTLC testComparison of sensitivity of cuvette test and HPTLC test
0
10
20
30
40
50
60
70
80
90
100
0 1 10 100 1000
Concentration in ng/µl
Inhi
bitio
n in
%
(1) LUMIStox300(2) LUMIStherm
Dose-effect relationshipof Bromoxynil– Cuvette test –
(1)(2)
(1)(2)
EC50 = 15 ng/µl

ZweckverbandLandeswasserversorgung
Br
Br
OH CN0
10
20
30
40
50
60
70
80
90
100
1 10 100 1000
Area concentration in ng/cm²
Inhi
bitio
n in
%
Dose-effect relationshipof Bromoxynil–HPTLC plate test –
1,32 cm²
0,56 cm²
0,16 cm²
1,32 cm²
0,56 cm²
0,16 cm²
EC50 = 77 ng/cm²
∑
∑−=
2
1
2
11 n
n
Rn
n
n
Sn
S
i
iI
∑
∑−=
2
1
2
11 n
n
Rn
n
n
Sn
S
i
iI
ISRin
InhibitionSampleReferenceIntensityPixel number
= ====

ZweckverbandLandeswasserversorgung
010
2030405060
708090
100
1 10 100 1000Area concentration in ng/cm²
Inhi
bitio
n in
%
1,32 cm²
0,56 cm²
0,16 cm²
1,32 cm²
0,56 cm²
0,16 cm²
0
10
20
30
40
50
60
70
80
90
100
0 1 10 100 1000
Concentration in ng/µl
Inhi
bitio
n in
%
(1) LUMIStox 300(2) LUMIStherm
Dose-effect relationshipof Bromoxynil– Cuvette test –
(1)(2)
(1)(2)
EC50 = 15 ng/µl
Calculation of the iso-inhibition value curveCalculation of the iso-inhibition value curve
Dose-effect relationshipof Bromoxynil–HPTLC plate test –

ZweckverbandLandeswasserversorgung
y = 0.346x - 17.459R2 = 0.9976
0
50
100
150
200
250
300
350
0 200 400 600 800 1000
Area concentration in ng/cm² (TLC test)
Con
cent
ratio
n in
ng/
µl (c
uvet
te te
st) A
VmF ⋅=
m: SlopeV: Sample volumeA: TLC application area
F = 1440
V = 500 µLA = 0,12 cm²
Curve of iso-inhibition valuesCurve of iso-inhibition values

ZweckverbandLandeswasserversorgung
ca. 180Ibuprofen
ca. 1650Fenazaquin
ca. 311Ioxynil
ca. 1440Bromoxynil
StructureSensitivity factorSubstance
Sensitivity factor for selected substancesSensitivity factor for selected substances

ZweckverbandLandeswasserversorgung
Chloridazon
Desphenyl-chloridazon
Methyl-desphenyl-chloridazon
1 2 3 4 5 6 7 8 9 10
Effect of incubation time on theinhibition of luminescenceEffect of incubation time on theinhibition of luminescence
Standard incubation time: 10 min

ZweckverbandLandeswasserversorgungChloridazon and metabolitesChloridazon and metabolites
N
N
OCl
H2N
N
NH
OCl
H2N
N
N
OCl
H2N CH3
N
NH
OCl
H2N
N
N
OCl
H2N
N
N
OCl
H2N
Chloridazon
Methyl-desphenyl-chloridazon(Metabolite B1)
Desphenyl-chloridazon(Metabolite B)
Degradation in soil
Transformationin soil
- Herbicide
- Application for sugar beets
- Used since 1964
- In 2005 approved for further 10 years in Germany

ZweckverbandLandeswasserversorgung
001 min
Comparison of different incubation timesComparison of different incubation times

ZweckverbandLandeswasserversorgung
010 min
Comparison of different incubation timesComparison of different incubation times

ZweckverbandLandeswasserversorgung
180 min
Comparison of different incubation timesComparison of different incubation times

ZweckverbandLandeswasserversorgung
300 min
Comparison of different incubation timesComparison of different incubation times
Luminescence inhibition may change to intensification

ZweckverbandLandeswasserversorgung
Same amount of substance(approx. 25 nmol )
-80
-60
-40
-20
0
20
40
60
80
100
0 100 200 300 400 500 600
Incubation time [min]
Inhi
bitio
n [%
]
ChloridazonDesphenyl-ChloridazonMethyl-Desphenyl-Chloridazon
Comparison of different incubation timesComparison of different incubation times
Inhibition
Intensification

ZweckverbandLandeswasserversorgung
Application example: Potential ground water contamination by coatings of sports fieldsApplication example: Potential ground water contamination by coatings of sports fields
500 µl500 µl
Sample preparation:
• 40 g granulate in 80 g H2O 24 h shaking
• Eluate filtered (0,4 µm membrane)
• Liquid-liquid extraction with TBME approx.. 1 ml extract

ZweckverbandLandeswasserversorgung
010 min
pH3 pH8 pH3 pH8
Metoprolol Propranolol
200 µl 200 µl 100 µl 100 µl
References
M P134 ng/µl 10 ng/µl
Application example: Bioactivity test of ozonation by-productsof beta-blocker substances
Application example: Bioactivity test of ozonation by-productsof beta-blocker substances

ZweckverbandLandeswasserversorgung
Application example: Fingerprint of waste water samples (Δt = 6 month)Application example: Fingerprint of waste water samples (Δt = 6 month)
2. Sample series1. Sample series

ZweckverbandLandeswasserversorgungStructureStructure
Advanced data evaluation
Introduction
Vibrio fischeri HPTLC test / Calculation of inhibition profiles
Conclusions
Aspects of the luminescence inhibition test / Application examples

ZweckverbandLandeswasserversorgungAdvanced data evaluationAdvanced data evaluation
• In general, quantitation requires reference standardsWhat a about unknown compounds?
• The semi-quantitative evaluation of the HPTLC chromatograms with bioactivity detection required a new data evaluation procedure:
(1) Linearization of the dose-effect relationship
(2) Calculation of the iso-inhibition volume V(50)
(3) Introduction of the reciprocal iso-inhibition volume 1/V(50)
This enables the comparison of the concentration of the same unknown substance in different samples

ZweckverbandLandeswasserversorgung
(1) Linearization of the dose-effect relationship –Gamma value(1) Linearization of the dose-effect relationship –Gamma value
jijijiji Vba ,,,, lglg ⋅+=Γ
0
10
2030
405060
7080
90100
1 10 100 1000Area concentration in ng/cm²
Inhi
bitio
n in
%
1,32 cm²
0,56 cm²
0,16 cm²
1,32 cm²
0,56 cm²
0,16 cm²
Gamma value
Extract (sample)jSubstance zonei
Gamma valueApplication volume (µl)VInhibition (%)I
ji
=
=
=Γ
=
=
,
II−
=Γ100
Dose-effect relationship
-2,5000
-2,0000
-1,5000
-1,0000
-0,5000
0,0000
0,5000
1,0000
1,5000
-1,2000 -1,0000 -0,8000 -0,6000 -0,4000 -0,2000 0,0000 0,2000 0,4000
lg Area concentration
lgG
amm
a
-2,5000
-2,0000
-1,5000
-1,0000
-0,5000
0,0000
0,5000
1,0000
1,5000
-1,2000 -1,0000 -0,8000 -0,6000 -0,4000 -0,2000 0,0000 0,2000 0,4000
lg Area concentration
lgG
amm
a
Linearised dose-effectrelationship

ZweckverbandLandeswasserversorgung(1) Linearised dose-effect relationship(1) Linearised dose-effect relationship
-2,5000
-2,0000
-1,5000
-1,0000
-0,5000
0,0000
0,5000
1,0000
1,5000
-1,2000 -1,0000 -0,8000 -0,6000 -0,4000 -0,2000 0,0000 0,2000 0,4000
lg Application volume
lgG
amm
a va
lue
Rf = 0,28Rf = 0,42Rf = 0,47Rf = 0,60Rf = 0,72Rf = 0,91

ZweckverbandLandeswasserversorgung
(2) Calculation of the iso-inhibition volume(2) Calculation of the iso-inhibition volume
jijijiji Vba ,,,, lglg ⋅+=Γ
1=Γ
Effect concentration 50
50=I
Gamma value Linearised dose-effectrelationship
Iso-inhibition volume
)50(lg0 ,,, jijiji Vba ⋅+=
iiii VcmI ⋅=≈
jiji bajiV ,, /
, 10)50( −=
Inhibition is proportional to theapplicated sample volume
Extract (sample)jSubstance zonei
Gamma valueApplication volume (µl)VInhibition (%)I
ji
=
=
=Γ
=
=
,
II−
=Γ100

ZweckverbandLandeswasserversorgung
(3) Introduction of the reciprocal iso-inhibition volume(3) Introduction of the reciprocal iso-inhibition volume
)50()50()50()50(
2,2,2,
1,1,1,
iii
iii
VcmVcm⋅=
⋅=)50()50( 2,1, ii mm =
)50()50( 2,2,1,1, iiii VcVc ⋅=⋅Substance zonei
Application volume (µl)VConcentration (ng/µl)c
=
==
)50(1
)50(1
2,
1,
2,
1,
i
i
i
i
V
Vcc
=
Reciprocaliso-inhibition volume
Comparison of substance i in two samples
The same mass for the same substance and the same inhibition

ZweckverbandLandeswasserversorgung
pH 7
K2
pH 2 pH 7
K1
pH 2
Reference
pH 7
Blanc water
pH 2
Methanol/Aceton 90:10
Comparison of different TBME extractsfrom wastewaterComparison of different TBME extractsfrom wastewater

ZweckverbandLandeswasserversorgung
Comparison of two extracts from wastewaterusing reciprocal iso-inhibition volumesComparison of two extracts from wastewaterusing reciprocal iso-inhibition volumes
0.01
0.1
1
10
100
1000
10000
1 6 11 16 21 26 31 36 41 46 51 56 61 66 71 76 81 86 91 96
hRf
1/V(
50) *
100
0 [1
/µL]
Extract K1 (pH 7) Extract K2 (pH 7)
Reciprocal iso-inhibition volume is proportional to thesubstance concentration
F = 500
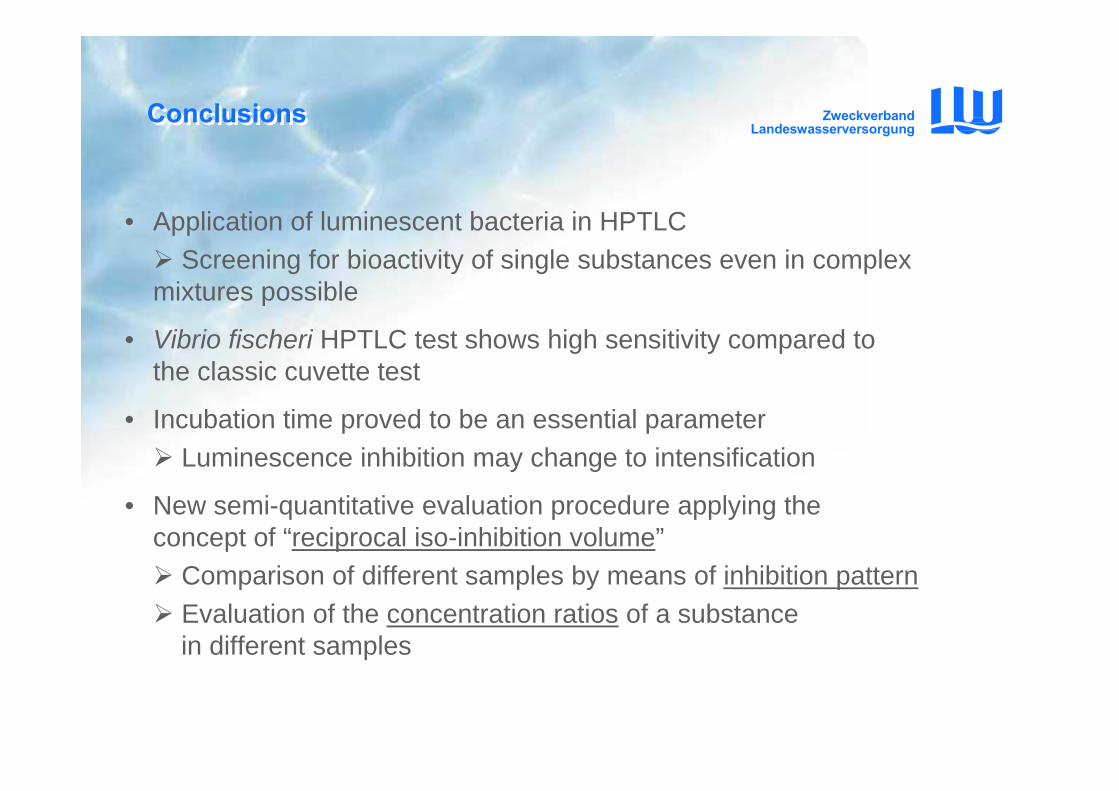
ZweckverbandLandeswasserversorgungConclusionsConclusions
• Application of luminescent bacteria in HPTLCScreening for bioactivity of single substances even in complex
mixtures possible
• Vibrio fischeri HPTLC test shows high sensitivity compared tothe classic cuvette test
• Incubation time proved to be an essential parameterLuminescence inhibition may change to intensification
• New semi-quantitative evaluation procedure applying the concept of “reciprocal iso-inhibition volume”
Comparison of different samples by means of inhibition patternEvaluation of the concentration ratios of a substancein different samples
ZweckverbandLandeswasserversorgungThank you for your attention!Thank you for your attention!
Laboratory for Operation Control and Research