AS 90285 Mathematics 2.2 Draw straightforward non-linear graphs Level 2 3 CreditsEXTERNAL.
88
AS 90285 Mathematics 2.2 Draw straightforward non-linear graphs Level 2 3 Credits EXTERNAL
-
Upload
rudolf-fitzgerald -
Category
Documents
-
view
216 -
download
0
Transcript of AS 90285 Mathematics 2.2 Draw straightforward non-linear graphs Level 2 3 CreditsEXTERNAL.

AS 90285Mathematics 2.2
Draw straightforward non-linear graphs
Level 2 3 Credits EXTERNAL

To Achieve you need to:
Given an equation be able to graph and identify key features of:
•Parabola•Cubic and other polynomial functions•Hyperbolae•Circles•Exponentials•Logarithmic functions

Parabola
•Basic form y=x2
•Vertexalways in the middlemirrors about this line
x-6 -4 -2 2 4 6
y
-2
2
4
6
8
10y = x2
Vertex

Vertical movements
•When we add/subtract a number
•For equations in the form:
y= x2 + a

Identify the parabolas
x-5 5
y
-4
-2
2
4
6
8
y = x2 – 5
y = x2 – 4
y = x2 + 1
y = x2 + 3
A y =Vertex ( , )
B y =Vertex ( , )
C y =Vertex ( , )
D y =Vertex ( , )
A
B
C
D
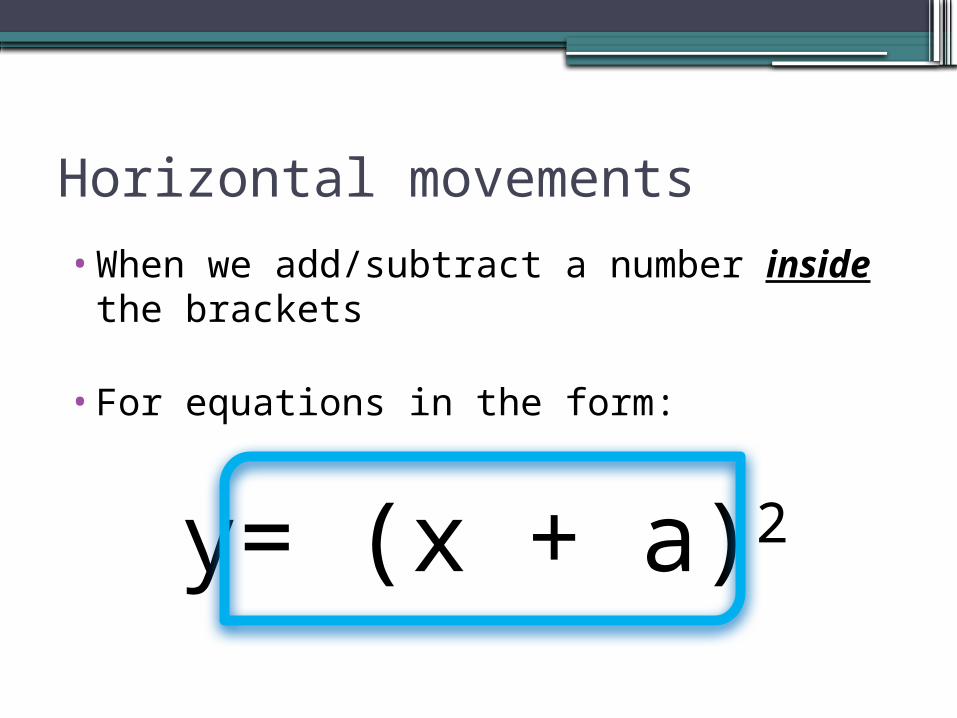
Horizontal movements
•When we add/subtract a number inside the brackets
•For equations in the form:
y= (x + a)2

Identify the parabolas
x-10 -5 5 10
y
-2
2
4
6
8
10
y = (x – 3)2
y = (x – 2)2
y = (x + 3)2
y = (x + 5)2B
AC
D
If we add a number inside the brackets it shifts left (negative direction)If we subtract a number inside the brackets it shifts right( + direction)

Factorised form•DO NOT expand•We can easily locate x-intercepts when in
brackets•For equations in the form:
y=(x+a)(x+b)

Steps to graph factorised form
1. Find x interceptstheses are when y=o
2. Find the vertexthis is always in the middle, so half way between the two x intercepts
3. Plot the vertex, x intercepts and join with a smooth curve following the pattern of the basic parabola

EXAMPLE: y=(x+3)(x-1)1. x intercepts,
set y=00=(x+3)(x-1)
intercepts are at x=-3 and x=1
2. VertexHalf way between x=-3 and x=1 is x=-1sub this into equation to find y valuey =(-1+3)(-1-1)
=(2)(-2)=-4
so the coordinate of vertex is (-1,4)

PlotKey Points:•x-intercepts
•Vertex
•y-interceptwhen x=o
x-6 -4 -2 2 4 6
y
-5
5
10

Now your turn...
y=(x-4)(x+2)
Find1.x-intercepts2.Coordinates of vertex3.y-intercept
EXTRA: y=x(x-6)

x-4 -2 2 4 6
y
-10
-5
5
10
KEY POINTS:
x-interceptsx=-2 and x=4
Vertex(1,-9)
y-intercept(0,-8)

Changing steepness
If there is a number in front of the x2 it will either make the graph steeper or flatter
•For equations in the form:
y= ax2

x-5 5
y
-4
-2
2
4
6
8
10y = x
2
The blue line is y=x2
The other lines are y = ½x2
y = 2x2

Summary• If the number in front is BIGGER than 1
e.g. 3x2 means “3 times the x value squared”
makes the parabola steeper than the basic y=x2
• if the number in front is smaller than 1 e.g. ¼x2 means “one quarter of the x value squared”
makes the parabola flatter than the basic y=x2

You need to know how to:•Graph parabolas of the form:
▫y=x2 + a▫y=(x+a)2
▫y=(x+a)(x+b)▫y= ax2
•Identify the key features▫x-intercepts▫ vertex▫ y-intercepts

The CubicEquations with x3 as their highest power

The basic cubic y=x3
We can plot this by filling in a table to work out values of the graph
x y=x3
-3 -27
-2 -8
-1 -1
0 0
1 1
2 8
3 27
x-4 -2 2 4
y
-10
-5
5
10

Vertical movements
•When we add/subtract a number
•For equations in the form:
y= x3 + a

Examples: y=x3 + 5 y=x3 -3
x-4 -2 2 4
y
-10
-5
5
10

General rule: when we have a cubic in the
form
y=x3 + a
The graph moves up or down by a units

Horizontal movements
•When we add/subtract a number inside the brackets
•For equations in the form:
y= (x + a)3

Examples: y=(x-4)3 y=(x+2)3
x-4 -2 2 4 6
y
-10
-5
5
10

General rule: when we have a cubic in the
form
y=(x+ a)3
The graph moves LEFT or RIGHT by a units

Cubics in factorised form•DO NOT expand• We can easily locate x-intercepts when in brackets
y=(x+a)(x+b)(x+c)NOTE: one or more of the letters could be zero
e.g. y=x(x+2)(x-3)y= (x+7) x2
y=x(x-4)2

How to plot a factorised cubic
#1. Find x-interceptsFound where y=0
#2. Find y-interceptsFound when x=0
#3. Is it negative or positivelook at the signs in front of the x’s

EXAMPLES:

For each of these
find:#1. x-
intercepts#2. y-intercept#3. is the cubic
“+” or “-”
A. y =(x-1)(x+4)(x+3)
B. y = -x2 (x-2)
C. y = (x+6)(x+5)(x+2)
D. y = (x+3)(x-1)2
E. y = (x-1)(2-x)(x-4)

A
x-10 -5 5 10
y
-15
-10
-5
5
y Intercept( 0 , -12 )
y =(x-1)(x+4)(x+3)

B
x-4 -2 2 4
y
-4
-2
2
4
y Intercept( 0 , 0 )
y = -x2 (x-2)

C
x-10 -5 5
y
-10
-5
5
10y Intercept
( 0 , 60)y = (x+6)(x+5)(x+2)

D
x-10 -5 5
y
-4
-2
2
4
6
8
10
y Intercept( 0 , 3 )
y = (x+3)(x-1)2

E
x-2 2 4 6 8 10
y
-4
-2
2
4
6
8
10
y Intercept( 0 , 8 )
y = (x-1)(2-x)(x-4)

Write the equations for:

The CircleThis type of graph is different because:• Every x-value has 2 coordinates • Every y-value has 2 coordinates

Example: this is the graph of a circle with a radius of 5
x-10 -5 5 10
y
-10
-5
5
10
(5,0)
( 4 , -3 )
( 3 , -4 )
( 0 , -5 )( -3 , -4 )
( -4 , -3 )
( -5 , 0 )
( -4 , 3 )
( -3 , 4 ) ( 0 , 5 )
( 3 , 4 )
( 4 , 3 )
x-10 -5 5 10
y
-10
-5
5
10
Each point on the circle is the same distance away from (0,0)

General formula of a circle
For circles centered at (0,0)
x2 + y2 = r2
With r being the radius of the circle

Example: x2 + y2 = 4
1st we need to know the radiusWe find this by finding √4 √4=2Meaning the radius is 2
We can then mark 2 units away from the origin on each of the axis and join the points with a compass…

EXAMPLE: y2 + x2 = 4
x-4 4
y
-4
-2
2
4
-2 2
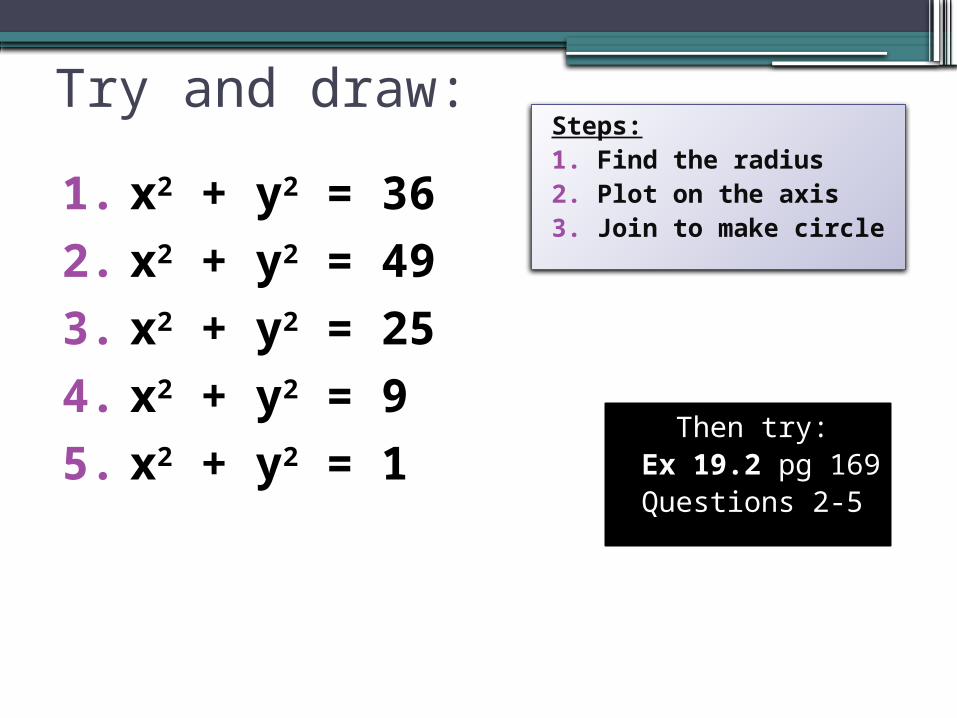
Try and draw:
1. x2 + y2 = 36
2. x2 + y2 = 49
3. x2 + y2 = 25
4. x2 + y2 = 9
5. x2 + y2 = 1Then try:
Ex 19.2 pg 169Questions 2-5
Steps:1. Find the radius2. Plot on the axis3. Join to make circle

Exponential Curves
y=ax
a is the base• this number must always be greater than 0 • a can NEVER be equal to zero (a≠0)
x is called the exponent• This is the variable that changes• When x=0 the graph is at y=1 (because anything to the
power of 0 equals 1)
COPY THIS INTO YOUR NOTES

Lets take a look at y=2x
x y=2x
-2
1
0
1
2
3
4
5
6
What happens to y as x gets bigger?
Copy and complete (substitute values into your calculator)

x-10 -5 5 10
y
-2
2
4
6
8
10
y = 2x

What about for y=0.5x
x y=0.5x
-2
1
0
1
2
3
4
5
6
What happens to y as x gets bigger?
Copy and complete (substitute values into your calculator)

x-10 -5 5 10
y
-2
2
4
6
8
10
y = 0.5x

Summary for exponentials• Are always in the form: y=ax
• The graph always cuts the y axis at y=1
Growth CurveIf a is greater than 1 we get a growth curve
a>1
Decay CurveIf a is less than 1 (i.e. decimal or fraction) we get a decay curve0<a<1
x
y
1
x
y
1
COPY THIS INTO YOUR NOTES

x-10 -5 5 10
y
-2
2
4
6
8
10
y = 2x
Lets see what happens when we change the value of a…

x-10 -5 5 10
y
-2
2
4
6
8
10
y = 2x
y = 3x
Lets see what happens when we change the value of a…

x-10 -5 5 10
y
-2
2
4
6
8
10
y = 2x
y = 3x
y = 5x
Lets see what happens when we change the value of a…
1. What happens as a increases?2. What always happens at x=1?3. Is the graph ever below the x-axis?

y=ax
x
y
1
1
a (1,a)
Because any number to the power of 1 stays the samee.g.21 =251 = 5651 = 65
The graph always cuts through y=1 and goes through the coordinate (1,a)
COPY THIS INTO YOUR NOTES
Note: The graph never goes below the x-axis

Exercise 19.9 pg 187 Q1-5(DON’T worry about doing the asymptote, domain and range, JUST DRAW THEM)
1. If you are stuck read the notes on the previous page2. If you are still having difficulty put your hand up
and ask for help

Movement of exponential curves
• NOTE: This type of graph moves in the same way as the other graphs we have looked at
• When we add/subtract a number to it, the graph stays the same shape but moves up/down
• When we add/subtract inside brackets the graph stays the same shape but it moves left/right

Example 1 y=2x+3
What do we know about y=2x?1. It is exponential so will cut the y axis at y=…
2. 2 is greater than 1 so will be a ……….. Curve (Growth or decay)
3. At x=1 the graph will cut through co-ordinate (…,…)
What do you think will happen if we add 3 to this graph?

x-4 -2 2 4
y
-2
2
4
6
8
10
y=2x +3
y=2x

x-4 -2 2 4
y
-2
2
4
6
8
10
y=2x
y=2x +3

x-4 -2 2 4
y
-2
2
4
6
8
10
( 1 , 2 )
( 2 , 4 )
( 0 , 4 )( 1 , 5 )
( 2 , 7 )
( 0 , 1 )
y=2x
y=2x +3

Summary y=ax + b•By adding b it moved the graph up by b•The shape of the graph stayed the same

Example 2 y=2(x-1)
What do you think will happen this time?
HINT: it moves the same way as the other graphs we have looked at

x-4 -2 2 4
y
-2
2
4
6
8
10y=2x
y=2(x-1)

x-4 -2 2 4
y
-2
2
4
6
8
10
( 1 , 1 )
( 2 , 2 )
( 3 , 4 )
( 4 , 8 )
( 3 , 8 )
( 2 , 4 )
( 1 , 2 )
( 0 , 1 )
y=2x
y=2(x-1)

Summary y=ax+b •By adding b inside the bracket it moved the graph across by b•The shape of the graph stayed the same• NO longer cuts the y-axis at 1, will cut line x=b at 1it is like the y-axis has moved to x=b

Worksheet on exponentials
•Think about what way it should look like before you draw it
•If your not sure put your hand up and ask for help

Worksheet Answers
x-4 -2 2 4
y
-2
2
4
6
8
10
12
x-4 -2 2 4
y
-2
2
4
6
8
10
12

Worksheet Answers
x-4 -2 2 4
y
-2
2
4
6
8
10
12
x-4 -2 2 4
y
-2
2
4
6
8
10
12

Worksheet Answers
x-4 -2 2 4
y
-2
2
4
6
8
10
12
x-4 -2 2 4
y
-2
2
4
6
8
10
12

Summary• What did you notice?

Logarithmic Graphs
y=loga(x)This is the inverse or opposite of the exponential graph
y=ax is equivalent to x=loga(y)
NOTE: the log button on your calculator is log10
*There is a way to work out loga(x), we will learn that later on
COPY THIS INTO YOUR NOTES

y=2x y=log2(x)
To graph log graphs we need to know what the exponential looks like

Comparing the two graphs

Key idea
y=ax means the same as x=loga(y)
So to graph we do the same as for exponentials but flip the axis around
Sounds confusing but lets try one!

Graph: y= log3(x)This will be the opposite graph to y=3x
We can use a table to find points for this (Do this on GC )
X y=3x (x,y)
-2 3^(-2) = 0.11111 (-2,0.11)
-1 3^(-1) = 0.33333
0 3^(0) =
1 3^(1) =
2 3^(2) =
3 3^(3) =

x-6 -4 -2 2 4 6
y
-10
-5
5
10
The graph of y=log 3(x) is the mirror of y=3x
through the green line

So y=log3(x) is the reflection of y=3x
What will these be the reflection of?1. y=log4(x)
2. y=log7(x)
3. y=log2(x)
4. y=log9(x)
5. y=log1.5(x)

On your calculatorThere is a way to work out y=loga(x) on your calculator so you can draw up a table of this type
y=loga(x) put into your calculator [log(x)]÷[log(a)]
Knowing this you can draw up a table straight from the y=loga(x)
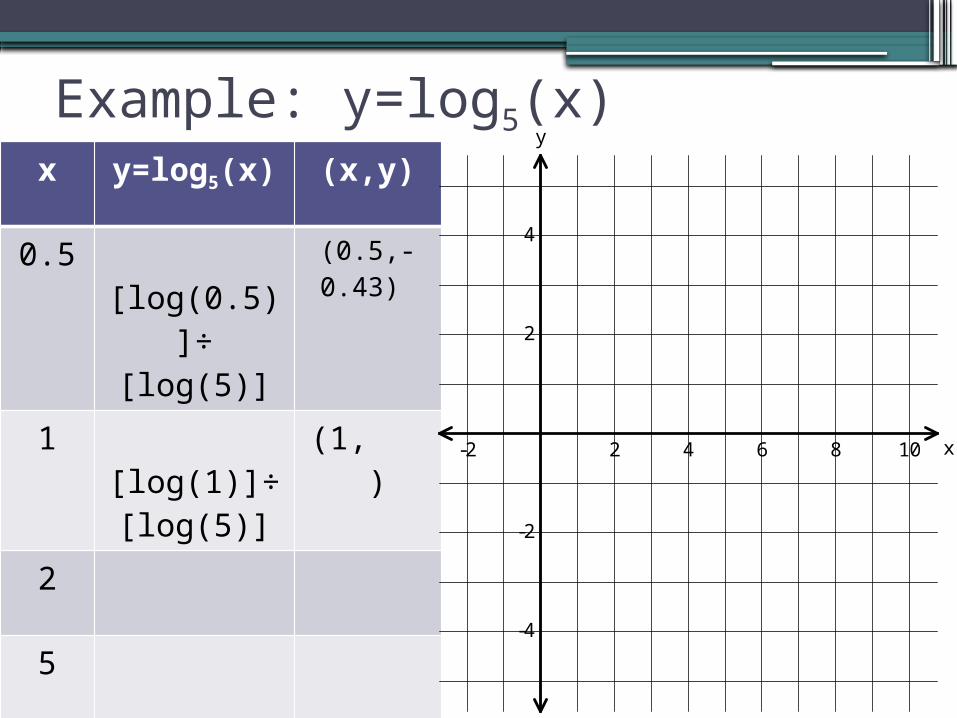
Example: y=log5(x)x y=log5(x) (x,y)
0.5 [log(0.5)]÷ [log(5)]
(0.5,-0.43)
1 [log(1)]÷ [log(5)]
(1, )
2
5
10
x-2 2 4 6 8 10
y
-4
-2
2
4

Graph:
1. y=log4(x)2. y=log7(x)3. y=log2(x)4. y=log9(x)5. y=log1.5(x)
METHOD #1By knowing what the opposite looks like we can just graph the key points on the opposite axis
METHOD #2Draw up a table and find values to plot
METHOD #3 Draw on your GC and copy the key points onto a graph
Then try Theta: Ex 19.10 pg 189

Hyperbola
NOTE: any of the letters a,b,c,d could be 0This graph has two parts which are split by asymptotes
Asymptote: is a line that the graph gets very close to but NEVER touches
COPY THIS INTO YOUR NOTES

x
yExample:Red dotted line = asymptote

How to draw a hyperbola in 4 easy steps:#1. find Vertical asymptote
found when the bottom =0#2. find Horizontal asymptote
find when x is large i.e. substitute x=1000 in and see what it gets close
to
#3. Find x-interceptfound when the top is equal to 0
#4. Find y-interceptfind by substituting x=0 into the
equation

Example:1. Vertical asymptote
find when bottom = 0x-1=0 if x=1 so the line x=1 is our vertical asymptote
2. Horizontal asymptoteFind when x is large, try x=1000on your calculator put in (2x10000+5) ÷ (1000-1) =Round this to the nearest whole numberso y= ……. is our horizontal asymptote

3. X -interceptFound when the top = 02x+5=0
4. Y-interceptFound when x=0Substitute x=0 into the equation on your calculatorType in (2x0+5)÷(0-1)=
Example:

x-5 5
y
-10
-5
5
10
Draw it:

x-5 5
y
-10
-5
5
10

Activities:
1. WorksheetDo the 4 steps then graph
2. Theta 19.4 pg 178

Practice doing asymptotes
1. WorksheetDo the 4 steps then graph
2. Theta 19.4 pg 178

To plot a graph:1. draw up a table of x-values (can do on GC)2. for each x value work out the
corresponding y-value (GC does for you)3. plot each point4. join points with a smooth curve.
Remember: Table → Values → Axes→ Plot → Draw → Label

Tips to successfully sketch a graph:• Key features and the shape of the graph must be
shown. • Remember to draw smooth curves with rounded
turning points. • Key features may be:
→ x and y intercept(s)→ turning points→ axis of symmetry→ horizontal and vertical asymptotes→ centre and radius of circle