
arXiv:astro-ph/0602120v1 6 Feb 2006temperature white dwarf model with a cooler white dwarf at Twd =...
25
arXiv:astro-ph/0602120v1 6 Feb 2006 A Far Ultraviolet Study of the Hot White Dwarf in the Dwarf Nova WW Ceti 1 Patrick Godon 2 Department of Astronomy and Astrophysics Villanova University, Villanova, PA 19085, [email protected] Laura Seward Dept. of Astronomy, Florida Institute of Technology, Melbourne, FL, lseward@fit.edu Edward M. Sion Dept. of Astronomy & Astrophysics, Villanova University, Villanova, PA 19085, [email protected] Paula Szkody Department of Astronomy, University of Washington, Seattle, WA 98195, [email protected] ABSTRACT We present a synthetic spectral analysis of IUE archival and FUSE FUV spectra of the peculiar dwarf nova WW Ceti. During the quiescence of WW Ceti, a white dwarf with T wd ∼ 26, 000K ±1000K can account for the FUV flux and yields the proper distance. However, the best agreement with the observations is provided by a two- temperature white dwarf model with a cooler white dwarf at T wd = 25, 000K providing 75% of the FUV flux and a hotter region (accretion belt or optically thick disk ring) with T = 40, 000K contributing 25% of the flux for the proper distance. We find from the FUSE spectrum that the white dwarf is rotating with V sin i = 600 ± 100km s −1 . Our temperature results provide an additional data point in the distribution of WD T wd versus orbital period above the CV period gap where few WD T wd s are available. Keywords: Stars: white Dwarfs, Stars: dwarf novae (WW Ceti) 1. Introduction Cataclysmic variables (CVs) are short-period, semi-detached binary systems consisting of an accreting white dwarf (WD) primary star and a low-mass main-sequence secondary star as the 1 Based on observations made with the NASA-CNES-CSA Far Ultraviolet Spectroscopic Explorer. FUSE is oper- ated for NASA by the Johns Hopkins University under NASA contract NAS5-32985 2 Visiting at the Space Telescope Science Institute, Baltimore, MD 21218, [email protected]
Transcript of arXiv:astro-ph/0602120v1 6 Feb 2006temperature white dwarf model with a cooler white dwarf at Twd =...
arX
iv:a
stro
-ph/
0602
120v
1 6
Feb
200
6
A Far Ultraviolet Study of the Hot White Dwarf in the Dwarf Nova WW Ceti 1
Patrick Godon2
Department of Astronomy and Astrophysics Villanova University, Villanova, PA 19085,
Laura Seward
Dept. of Astronomy, Florida Institute of Technology, Melbourne, FL, [email protected]
Edward M. Sion
Dept. of Astronomy & Astrophysics, Villanova University, Villanova, PA 19085,
Paula Szkody
Department of Astronomy, University of Washington, Seattle, WA 98195,
ABSTRACT
We present a synthetic spectral analysis of IUE archival and FUSE FUV spectra
of the peculiar dwarf nova WW Ceti. During the quiescence of WW Ceti, a white
dwarf with Twd ∼ 26, 000K ±1000K can account for the FUV flux and yields the proper
distance. However, the best agreement with the observations is provided by a two-
temperature white dwarf model with a cooler white dwarf at Twd = 25, 000K providing
75% of the FUV flux and a hotter region (accretion belt or optically thick disk ring)
with T = 40, 000K contributing 25% of the flux for the proper distance. We find from
the FUSE spectrum that the white dwarf is rotating with V sin i = 600 ± 100km s−1.
Our temperature results provide an additional data point in the distribution of WD Twd
versus orbital period above the CV period gap where few WD Twds are available.
Keywords: Stars: white Dwarfs, Stars: dwarf novae (WW Ceti)
1. Introduction
Cataclysmic variables (CVs) are short-period, semi-detached binary systems consisting of an
accreting white dwarf (WD) primary star and a low-mass main-sequence secondary star as the
1Based on observations made with the NASA-CNES-CSA Far Ultraviolet Spectroscopic Explorer. FUSE is oper-
ated for NASA by the Johns Hopkins University under NASA contract NAS5-32985
2Visiting at the Space Telescope Science Institute, Baltimore, MD 21218, [email protected]

– 2 –
Roche lobe-filling mass donor (Warner 1995). The binary orbital period in these systems ranges
from about ≈ 1h to a few days. However, there is a gap in orbital period between 2 and 3 hours
where almost no systems are found. It is not known whether the systems are evolving from a longer
period to a shorter period (across the gap) or whether the systems above the gap are all together
different from the systems below the gap. Dwarf novae (DN) are a subset of CVs that undergo
regular eruptions called outbursts which last for days to weeks, separated by intervals of quiescence
lasting weeks to months. The now widely accepted interpretation of the quiescence/outburst cycle
is that of the disk instability model (DIM, Cannizzo (1998)). It is assumed that during the
quiescent phase the matter in the disk is cold and neutral and the disk is optically thin because
of its low density, while during outburst, as the mass accretion rate increases, the matter in the
disk is ionized and becomes optically thick. The basic principle of the DIM theory depends heavily
on the unknown viscosity parameter α and on the mass accretion rate during the different phases.
The mass accretion rate is usually taken from Patterson (1984), which is however only a first
order estimate. In the last decade, the mass accretion rate of many systems has been deduced
more accurately at given epochs of outburst or quiescence using spectral fitting techniques. The
accretion rate is usually a function of time (especially during the outburst itself) and consequently
it is difficult to assess its time-averaged value accurately.
Recent advances in theory (Townsley & Bildsten 2004) have shown that the average mass
accretion rate of an accreting WD in DNe can be deduced if one knows the mass of the accreting
WD and its effective surface temperature during quiescence, therefore providing an additional and
independent way to assess M . Consequently, in order to put more constraints on the theories we
need to known the properties (mainly the temperature and mass of the WD) of these systems
above as well as below the period gap. There is, however, a critical shortage in knowledge of
the WD properties (effective temperature Twd, gravity log g, rotational velocity V sin i, chemical
abundances, accretion belts?) in dwarf novae above the period gap. Thus, detailed comparisons of
accreting WDs above and below the gap cannot be made.
For systems below the gap, with orbital periods near the period minimum, the distribution of
temperatures are centered at ∼15,000K with only a narrow range seen at present. This distribution
appears to manifest the effect of long term compressional heating at a time averaged accretion
rate of 2 × 10⁻¹¹M⊙yr−1 (Townsley and Bildsten 2002; Sion et al. 2003). It appears that WD
Twd’s for systems above the gap are higher than WD temperatures in systems below the gap,
due to the systems above the gap having larger disks (with higher mass transfer rates) and more
massive secondaries. Some disks may remain optically thick even during quiescence so that the
WDs are heated to a greater extent than systems below the gap. It is not yet known whether
the WDs in systems above the gap are rotating more slowly than WDs in systems below the gap
where presumably the CVs are older with a longer history of angular momentum transfer via disk
accretion. Thus far the only dwarf novae above the gap whose white dwarfs and disks/boundary
layers have been analyzed with FUSE, IUE and HST have been Z Cam (Hartley et al. 2005), RX
And (Sion et al. 2001; Sepinsky et al. 2002), U Gem (Sion et al. 1998; Long & Gilliland 1999;

– 3 –
Froning et al. 2001), SS Aur (Sion et al. 2004a), EY Cyg (Sion et al. 2004b), and RU Peg (Sion
& Urban 2002; Sion et al. 2004a); a total of 2 Z Cam systems and 4 U Gem systems.
WW Ceti is a system above the gap whose classification is uncertain. Although classified
as a U Geminorum-type system, others suggest a Z Camelopardis classification. Z Cam systems
are characterized by prolonged states of intermediate brightness between quiescence and outburst
called standstills. Others propose that WW Ceti forms a link between Z Cam and VY Sculptoris
nova-like variables (Ringwald et al. 1996; Warner 1987). The latter are systems that drop
unpredictably into very low brightness states but spend most of their time in outburst. Without
conclusive evidence of standstills however, we will tentatively classify WW Ceti as a U Gem-type
DN.
In this paper, we report an analysis of International Ultraviolet Explorer (IUE) archival spectra
and Far Ultraviolet Spectroscopic Explorer (FUSE) spectra of the dwarf nova WW Ceti during
quiescence. Our analysis utilizes newly available accretion disk models, photosphere models, and
models combining white dwarfs and accretion disks and accretion belts. The accretion disk models
are taken from the grid of models of Wade & Hubeny (1998), which were recently updated using the
lastest version of the stellar/accretion disk synthetic spectral codes (see section 3). Our objectives
are to identify the source(s) of the FUV radiation during quiescence, derive the properties of the
WD (if detected) and the quiescent accretion disk, and characterize the hot components in the
system.
1.1. WW Ceti System Parameters
In table 1 we list the system parameters we have adopted: (1) CV subtype, (2) orbital period
in days, (3) orbital inclination in degrees, (4) spectral type of the secondary, (5) mass of the primary
in solar masses, (6) mass of the secondary in solar masses, (7) apparent magnitude in outburst,
and (8) apparent magnitude in quiescence. The references are listed below the table.
The orbital period (4.22 hours) is well above the period gap, where few WD properties are
currently known. Systems above the gap tend to have somewhat earlier-type secondaries, higher
accretion rates, and larger accretion disks. Dwarf novae, unlike other CVs, offer a fairly reliable
estimate of their distances via the absolute magnitude at maximum versus orbital period relation
for dwarf novae found by Warner (1995). This relationship is consistent with theory (Cannizzo
1998). For WW Ceti, this relation yields a distance of 186 pc. This is midrange of 90 − 300 pc
as derived by Young & Schneider (1981) using near-infrared CCD spectra of the cool companion,
slightly higher than the estimate of 130 pc (Patterson 1984) and close to the range of 121 − 171
pc using K magnitudes (Sproats et al. 1996). To remain consistent with the parameters used in
Winter & Sion (2003), we adopted 186 pc as the distance to WW Ceti.

– 4 –
2. The Observations
2.1. The FUSE Observations
FUSE is a low-earth orbit satellite, launched in June 1999. Its optical system consists of four
optical telescopes (mirrors), each separately connected to a different Rowland spectrograph. The
four diffraction gratings of the four Rowland spectrographs produce four independent spectra on
two photon counting area detectors. Two mirrors and two gratings are coated with SiC to provide
wavelength coverage below 1020 A, while the other two mirrors and gratings are coated with Al and
LiF overcoat. The Al+LiF coating provides about twice the reflectivity of SiC at wavelengths >1050
A, and very little reflectivity below 1020 A (hereafter the SiC1, SiC2, LiF1 and LiF2 channels).
A time tag FUSE spectrum (D1450401) of WW Ceti was obtained starting on 2003, July
26, 05:30:03 with a total raw exposure time of 16,291s (9 individual spacecraft orbits) through
the 30”x30” LWRS Large Square Aperture. The spectrum was centered at 1059.73A. From the
AAVSO (American Association of Variable Stars Observers) data, we found that the system was
in optical quiescence (MV ≈ 14.5− 15.0 for at least 10 days) preceding and during the observation,
and 25 days after an outburst (MV ≈ 12.0) and about 15 days after a single data point brightness
peak (MV ≈ 11.0). The data were processed with CalFUSE version 2.4 totaling 14,817s of good
exposure time. In this version, event bursts are automatically taken care of. Event bursts are short
periods during an exposure when high count rates are registered on one of more detectors. The
bursts exhibit a complex pattern on the detector, their cause, however, is yet unknown (it has been
confirmed that they are not detector effects). WW Cet, with a flux of a few 10−14ergs s−1cm−2A−1,
is actually a relatively weak source. We used the same procedure as in our previous FUSE analysis
(e.g. RU Peg & SS Aur, Sion et al. (2004a)) to process the FUSE data.
During, the observations, Fine Error Sensor A, which images the LiF1 aperture was used to
guide the telescope. The spectral regions covered by the spectral channels overlap, and these overlap
regions are then used to renormalize the spectra in the SiC1, LiF2, and SiC2 channels to the flux in
the LiF1 channel. We then produced a final spectrum that covers almost the full FUSE wavelength
range 905− 1182 A. The low sensitivity portions of each channel were discarded. In most channels
there exists a narrow dark stripe of decreased flux in the spectra running in the dispersion direction.
This stripe has been affectionately known as the “worm” and it can attenuates as much as 50%
of the incident light in the affected portions of the spectrum. The “worm” has been observed to
move as much as 2000 pixels during a single orbit in which the target was stationary. The “worm”
appears to be present in every exposure and, at this time, there is no explanation for it. Because of
the temporal changes in the strength and position of the “worm”, CALFUSE cannot correct target
fluxes for its presence. Here we took particular care to discard the portion of the spectrum where
the so-called worm ’crawls’. The LiF1 channel was affected by the worm longward of ≈ 1100 A .
Because of this the 1182 − 1187 A region was lost, as it is covered only by the LiF1 channel. We
combined the individual exposures and channels to create a time-averaged spectrum with a linear,
0.1 A dispersion, weighting the flux in each output datum by the exposure time and sensitivity of

– 5 –
the input exposure and channel of origin.
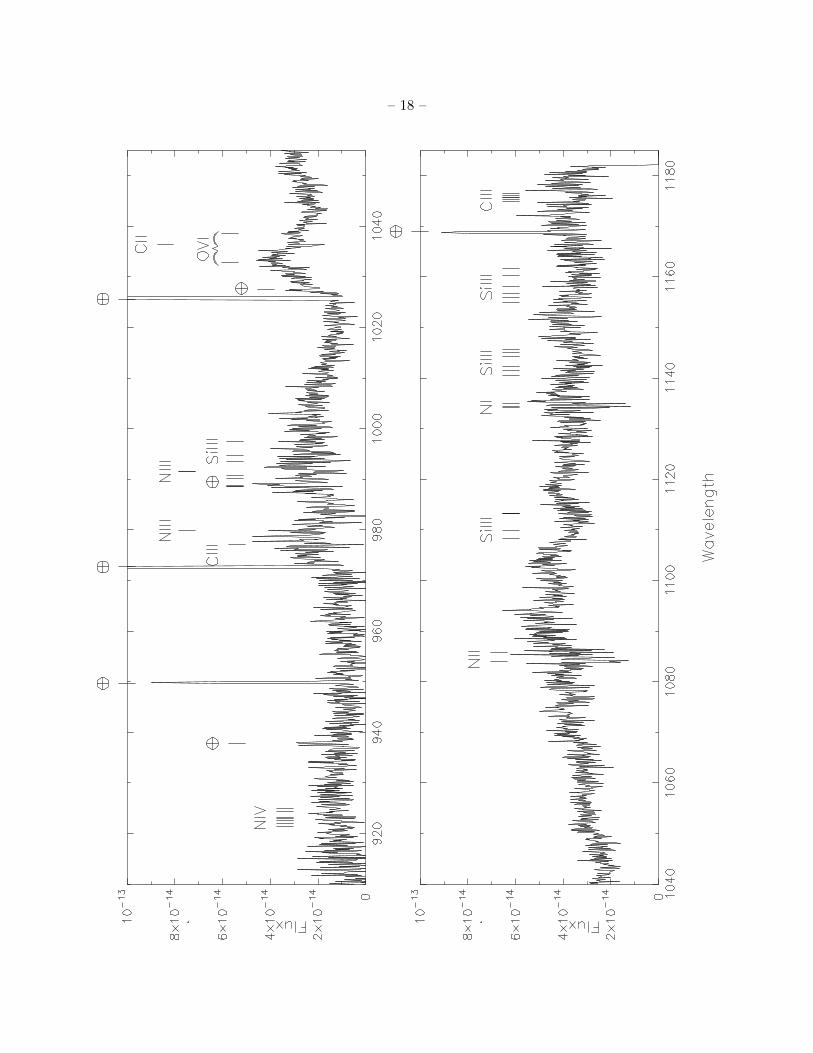
The FUSE spectrum of WW Cet (see Figure 1) in the longer wavelengths (λ > 1050A) is very
similar to the FUSE spectra of DNe in quiescence in which the WD is exposed. Here, that portion
of the spectrum reveals the familiar absorption features of CIII (around 1175A) and SiIII (around
1110A, 1140-1145A, and 1160A). However, at shorter wavelengths (λ < 1050A) there are very broad
emission lines that are usually found in Nova-like systems (e.g. such as AE Aqr, V347 Pup, DW
UMa, see the MAST FUSE archives) and are not usually present in low-inclination DN systems in
quiescence. The most prominent emission feature is the OVI doublet with laboratory wavelengths
1031.9261A & 1037.6167A. The feature is best fitted with a double Gaussian shifted by +1.2A (see
Figure 2, upper panel). A double Gaussian at the rest frame (Figure 2, lower panel) does not fit the
data as well and a single Gaussian disagrees even more with the OVI emission feature. On top of the
OVI doublet is a a CII interstellar absorption at the expected rest-frame wavelength 1036.3A. The
CIII (977.02A) broad emission line seems also to have a CIII interstellar absorption superposed to
it. The two NIII and the SiIII emission lines (between 980A and 1000A) are also marked, but they
are contaminated with some air glow emission (OI) and are less prominent than the CIII and OVI
emission features. For a more complete comparison we have also marked the positions of the NIV
emission lines about 925A , which form a broad “hump” (and could possibly also include SVI). The
FUSE spectrum of WW Ceti also exhibits some sharper absorption lines, probably of interstellar
origin, the most prominent ones are NI (around 1134A), NII (around 1084-1085A), CII (1036.3A)
and CIII (977A).
2.2. The IUE Archival Observations
The IUE archive contains two observations of WW Ceti with the short-wavelength prime
(SWP) camera through the large aperture at low dispersion with a resolution of 5A, covering the
wavelength range 1170 to 2000A. The brightness state of the system at the time the IUE spectra
were taken was determined by the observed flux levels and IUE fine error sensor visual magnitudes
of the system as confirmed by light-curve data from the American Association of Variable Star
Observers (AAVSO). One of the spectra, SWP24866, was obtained during quiescence, its observing
log is shown in Table 2. In the present work we concentrate only on the quiescent phase of the
system.
The IUE NEWSIPS spectrum was flux-calibration corrected using the Massa-Fitzpatrick cor-
rections (Massa & Fitzpatrick 2000). The spectrum was not corrected for reddening, as E(B-V)
= 0 for WW Ceti (La Dous 1991). The IUE spectrum also exhibits some broad emission lines.
The most prominent ones are CIV (1548/50A), HeII (1640A Balmer α), OIII (1658-1666A) and the
strong feature around 1400 A is either due to either OIV or to SiIV or to both. The spectrum is
very similar to some NL systems (IP). With their broad emission lines, both the FUSE and IUE
spectra show evidence of hot gas.

– 6 –
A comparison of the IUE spectrum in quiescence and the FUSE spectrum in the wavelength
overlap region reveals that the flux levels match thus enabling us to carry out model fits over a
substantially broader wavelength range. We prepared the combined FUSE and IUE spectra for
fitting by masking regions containing emission lines and artifacts. The following wavelengths were
masked: 949−951, 972−995, 1025−1043, 1168−1170, 1190−1240, 1387−1412, 1517−1565, 1620−
1680, 1840 − 1878A. These regions of the spectrum were not included in the fitting.
3. Synthetic Spectral Fitting
We used model accretion disks from the optically thick disk model grid of Wade & Hubeny
(1998) and created model spectra for high-gravity stellar atmospheres using TLUSTY200 (Hubeny
1988), SYNSPEC48 and ROTIN4 (Hubeny & Lanz 1995). Using IUEFIT, a χ2 minimization
routine, we computed χ2ν and scale factor values for each model fit. χ2
ν is known as the “reduced”
chi-squared, namely χ2 per number of degrees of freedom. The number of degrees of freedom ν is
the number of bins Nbins for which observed data is taken into account when calculating χ2 minus
the number of freely varying parameters Np used to calculate the model, namely ν = Nbins −Np,
see e.g. Press et al. (1992). Here we take the number of bins in the wavelength axis excluding
the masked regions. For the IUE data binned at 1.68 A Nbins = 370, for FUSE binned at 0.1
A Nbins = 2293 (and decreases accordingly for binning of 0.2 and 0.5 A ) and for the combined
IUE-FUSE spectrum Nbins = 817 (as the FUSE data there are binned at 0.5 A ).
The range of disk model parameters are the following: WD mass (in solar masses)values of 0.55,
0.80, 1.03, and 1.21; orbital inclination i (in degrees) of 18, 41, 60, 75, and 81. The accretion rate
ranges from 10−10.5M⊙yr−1 to 10−8.5M⊙yr
−1, varying in increments of 0.5 in log M . Therefore, for
the disk models one has Np = 3. For the photosphere models, the effective temperature values range
from 15,000 K to 35,000K in increments of 1,000K. We chose values of log g ranging between 8.0
and 8.6 for consistency with the observed mass. We also varied the stellar rotational velocity V sin i
from 100km s−1 to 1000km s−1 in steps of 100km s−1. In order to try and fit the absorption features
of the spectrum, we also vary the chemical abundances of C, N and Si. The number of freely varying
parameters for the stellar atmosphere models can therefore be as high as N − p = 6. For combined
accretion disk and stellar WD atmosphere models, the disk flux is divided by 100 to normalize it
at 1000pc to match the WD flux, therefore giving explicitly the relative flux contributions of each
component. Then both fluxes are added for comparison with the observed flux. For the combined
models this leads to Np = 8, since for any WD mass there is a corresponding radius, or equivalently
one single value of log g (e.g. see the mass radius relation from Hamada & Salpeter (1961) or
see Wood (1990) for different composition and non-zero temperatures WDs). While we use a χ2
minimization technique, we do not “blindly” select the least χ2 models, but we examine the models
that best fit some of the features such as absorption lines (see the fit to the FUSE spectrum alone)
and, when possible, the slope of the wings of the broad Lyman absorption features. We also select
the models that are in agreement with the known distance of the system.

– 7 –
3.1. Model Fits to the IUE Archival Spectra
It is useful to explore the results of analyzing the FUSE and IUE spectra separately versus when
they are combined. We started with the IUE archival spectrum SWP24866, taken in quiescence.
Applying the grid of disk models to the IUE data, the best-fitting disk-only model had a WD mass
of M1 = 0.80M⊙, an orbital inclination of 60 degrees, and an accretion rate of 10−9.5Myr−1. This
model gave a χ2ν value of 1.870 and a scale factor of 0.063, which yielded a distance of 395 pc.
This accretion rate is rather large to be associated with quiescence and the distance from the scale
factor is far larger than the adopted distance of 186 pc. Therefore we reject this result.
For single temperature white dwarf models, the best-fitting model photosphere had an effective
temperature of 23,000 K, log g= 8.0, giving a χ2ν value of 2.97 and a scale factor of 0.004717, which
yielded a distance of 199 pc. This distance is in excellent agreement with our adopted distance.
This result suggests that a white dwarf with a Twd = 23, 000K could alone account for the FUV
flux without an accretion disk.
3.2. Synthetic Spectral Analysis of the FUSE Spectrum Alone
We first tried an accretion disk alone, but the fit was extremely poor. We then tried to fit the
FUSE spectrum with a WD alone synthetic spectrum. The best fit model was a 27, 000 ± 1, 000K
WD, with log g = 8.3, a rotation rate of 600± 100km s−1, a distance of 212pc and χ2ν = 1.58. The
abundance were C=0.1 x solar, N=2 x solar and Si=0.3 x solar. A solar abundances model had a
χ2ν = 1.629, not statistically different from the non-solar model, however some of the features of the
observed FUSE spectrum were better fitted with non-solar abundances. The results are presented
in Figure 3.
In particular, fitting the following features were the main reason for adopting the non-solar
abundances model as the best fit.
(i) In the solar abundances model there is a broad absorption feature around 1065 which is not
present in the observed FUSE spectrum. When decreasing C this absorption feature disappeared
and we obtained a better fit. This absorption feature is due to
CII 1063.28, 1063.31, 1065.89, 1065.92, 1066.13 A .
(ii) There is a deep absorption feature in the FUSE data around 1084-1085 A, although this
might be due to interstellar absorption we found that increasing N by a factor 2 solar gives a better
fit. This absorption feature is due to
NII 1083.99, 1084.56, 1084.58, 1085.53, 1085.55, 1085.70 A .
(iii) Around 1108-1114, 1123, 1128, 1140-1146 and around 1160 A there are many absorption
features which can be matched only by decreasing C and Si abundances. These are :
SiIII: 1108.36, 1109.94, 1113.17, 1113.20, 1113.23 A
blend: CIII 1125.6 + CII 1127. + SiIV 1128.3 A + CI
blend: CI+CII+CIII 1138-1141 A

– 8 –
blend: SiIII 1140.5-1145.7 A .
While it is obvious that there must be some CIII broad emission around 1175 A there is also
absorption present. Since we do not know a priori how much emission and absorption there is, we
cannot model this region.
Decreasing C and Si further than 0.1 and 0.3 (respectively) led to improvement of the fit in
some parts of the spectrum but the fit also deteriorated in other regions. It is also important to note
that the depth of the broad absorption features which actually form part of the continuum (e.g.
as for Si) depends not only on the abundances but also on the rotational velocity. Increasing the
rotational velocity has the same effect as reducing the abundances, as the depth of the absorption
features decreases. Overall, the CII (around 1065 A ), the SiIII (around 1110 A ) and the Si-C
blend (in the range 1138-1146 A ) were the main absorption features that drove both the Si and
the C to sub-solar values. As these abundances were reduced, the fit of the theoretical spectrum
also slightly improved in other regions (such as around 1055 A and 1080 A ).
We feel confident that the carbon and silicon WD photospheric abundances are actually well
represented by the non-solar best fit models, as these were derived from fitting these regions of the
spectrum that were not contaminated by broad emission features and/or sharp interstellar absorp-
tion features. For Nitrogen, the results are inconclusive as the Nitrogen features were contaminated
by sharp absorptions possibly originating from the ISM or from the immediate surroundings of the
system.
In Figure 4 we show the residual emission, namely, we subtracted the theoretical spectrum from
the observed one. The apparent emission features in the residual spectrum are the OVI doublet
(with an interstellar CII absorption), the two CIII lines (977 A and 1175 A ) and possibly also
NII, NIII, NIV and SiIII as marked in Figure 4. Such emission features are often seen in the FUSE
spectra of IP systems or other DNe systems and it implies that gas is possibly being heated by
shock (e.g. accretion column in magnetic systems).
From these fits, it is evident that a WD alone is not enough to reproduce all the features of
the spectrum. The bottom of Lyβ does not go to zero and indicates the presence of an additional
component, which may or may not be linked to the broad emission features. While it is clear
that the longward wing of the Lyβ cannot go to zero because of OVI emission, the shortward wing
reaches 1 × 10⁻¹⁴erg s−1cm−2 A−1. We tried a combination of a WD plus an accretion disk and,
as in the case of the IUE spectrum, we found that the best fit model had a distance about twice as
large as the adopted distance of 186pc. Therefore, we tried a combination of a hot, fast rotating
belt with a WD. The best combined (WD+belt) model consisted of a WD with a temperature of
25,000K, rotating at 600km s−1, with log g = 8.3 , and with the following abundances: Carbon 0.1
x solar, Nitrogen 2 x solar and Silicon 0.5 x solar. The second component had a temperature of
40,000K, rotating at 3,000km s−1 and had an emitting area of 3 percent of the total WD surface.
The WD contributes 75% of the flux integrated over the FUSE wavelength range, while the second

– 9 –
component contributes the remaining 25%. The χ2ν value was 1.38 with a distance of 190pc. This
best fit is shown in Figure 5.
3.3. Synthetic Spectral Analysis of Combined FUSE plus IUE Spectra
We combined the FUSE and IUE quiescent spectra of WWCeti and first tried single-temperature
white dwarf models to the combined spectra. The best-fitting model for log g = 8.3 yielded the
following parameters: χ2ν = 3.73, d=189pc, Twd = 26, 000 ± 1000K, V sin i = 600 ± 100 km s−1,
and abundances: Carbon 0.1 x solar, Nitrogen 2 x solar and Silicon 0.5 x solar. The white dwarf
rotation (V sin i) rate was determined from fitting the WD model to the spectrum while paying
careful attention to the line profiles in the FUSE portion of the combined spectrum. Namely, we
did not carry out separate fits to individual lines but rather tried to fit the lines and continuum in
the same fit. The best-fitting single temperature WD fit to the combined FUSE plus IUE spectrum
is displayed in figure 6.
Second, we tried models of optically thick accretion disks alone. Since the previous individual
disk fits to the FUSE and IUE spectra alone were very poor, we did not expect the disk fit to
the combined spectrum to be better. For this exercise, we fixed the disk inclination at the value
published for WW Ceti. We also fixed the white dwarf mass at 0.8 M⊙ for consistency and easier
comparison with the white dwarf-only model results. For Mwd = 0.8M⊙, and i = 60 degrees, the
best-fitting accretion disk models had a mass accretion rate in the range M = 10−9.5−10−9M⊙/yr,
leading to a distance of d ≈ 400− 800pc respectively. Again the fit was very poor and the distance
was not in agreement with our adopted value of 186pc.
Next, we tried combination fits of a white dwarf and accretion disk. We follow the same
procedure as described in the previous paragraph, namely we fix the WD mass to 0.8M⊙ and the
inclination to 60 degrees and we vary the mass accretion rate. We then varied the WD temperature
for each given mass accretion rate until we achieved a best-fit. The best fit of all was achieved when
the WD temperature was Twd = 27, 000K and the accretion rate was 10−9.5M⊙/yr. The χ2ν for
this fit was 3.41. The white dwarf contributes only 25% of the flux and the disk contributes 75%
(see figure 7). However, the distance obtained was far too large (d∼460 pc) and the mass accretion
rate rather large for quiescence. Therefore, again, we rejected this result. As can be seen from the
figure, the fit is better in the IUE range than in the FUSE range, where the model flux is basically
20 % too low.
Finally, we compared the results of the above fitting attempts with a two-temperature WD
model fit. A WD is expected to show a temperature variation with latitude if accretion occurs
preferentially at the equator from a disk or if a WD is magnetic and accretes preferentially at
magnetic poles. In the former case, we envision the possibility of a hot accretion belt, or hot
inner disk ring. We ran a series of models in which a WD is cooler and rotates more slowly at
higher latitudes and has a fast spinning (near Keplerian speed) hot atmosphere belt. We tried a

– 10 –
range of combinations of cooler WD and belts of different temperatures and lower gravity. For
the WD we kept log g = 8.3 constant and searched for a best fit consistent with a distance of
d ≈ 186pc. The white dwarf plus accretion belt combination which yielded the best fit has a WD
with Twd = 25, 000K, and an accretion belt with Tbelt = 40, 000K, log g = 6 with solar abundances.
The cooler portion of the WD contributes 75% of the FUV flux while the accretion belt contributes
25% of the FUV flux. This is the same best fit combined model as the one for the FUSE spectrum
alone. The χ2ν value was 3.56 and the scale parameter led to a distance of 190pc. Our comparison
of the two-temperature (WD + accretion belt) model is displayed in figure 8. The improvement
of model fits that result from two-temperature WDs has been reported elsewhere for a number of
other systems (e.g. Szkody et al. 2003; Sion et al. 2003).
4. Conclusion
During the quiescence of WW Ceti, our fits to the combined FUSE + IUE fluxes reveal that a
single-temperature with Twd ∼ 26, 000± 1000K can account for the flux. The white dwarf appears
to have a rotational velocity of 600 ± 100 km s−1. The error bars are chosen here to be the size
of the increments by which the parameters are varied. For WW Cet, which is actually a rather
weak source for FUSE and IUE, these error bars are consistent with the modelings, i.e. smaller
error bars/increments do not lead to a significant improvement in the fit. The best agreement with
the observations is provided by a two-temperature white dwarf model with a cooler white dwarf at
Twd = 25, 000K providing 75% of the FUV flux and a hotter region (accretion belt or optically thick
disk ring) with T = 40,000K contributing 25% of the flux. The fitting of the shape of the absorption
lines in the FUSE range led to the following best fit abundances: Carbon 0.1 x solar, Nitrogen 2 x
solar, and Silicon 0.3-0.5 x solar. In all the fitting models of the combined (FUSE+IUE) data we
have kept the mass of the WD constant (M = 0.8M⊙ corresponding to log g = 8.3) and rejected
models in disagreement with a distance of d ≈ 186pc.
An important point is the significance of the two-temperature WD fit over the single WD fit.
A change in chi-squared from 1.58 to 1.38 (for the FUSE fits) and, even more so, from 3.73 to 3.56
(for the FUSE+IUE fits) is at best a modest improvement in the fit quality with the addition of
the second temperature component. However, adding the second component results in a better fit
to the bottom of the Lyβ line around 1025 A, and improves the fit to the left wing of Lyβ (the
right wing is contaminated by the OVI emission feature). In that region the improvement of the
fit is the actual fitting of the blue wing of the Lyβ in the spectrum.
We remark here that there could be some instrument background contamination contributing
to the flux, such that the Lyβ would actually never go to zero. However, since we have discarded
all the noisy portions of the channels (usually the edges), the actual contribution of the instrument
contamination should be less than ≈ 5 × 10⁻¹⁵erg s−1cm−2A−1 (<50% of the flux) which is the
excess emission at 910A(this is an overestimate, since the region λ < 910A is near the edge where
the noise is maximal).

– 11 –
In the wavelength range λ <970A the improvement of the fit does not fit any actual feature
but only reduces the discrepancy between the model and the observation. Therefore the need and
importance of the second component does not originate from fitting that part of the spectrum where
there is emission but rather it comes from fitting a feature in the continuum. At this stage the
“belt” is really a flat continuum added to improve the fit and it should be regarded as a featureless
blue spectrum. So far the belt is probably not the best physical description of the data but it is the
best available model component to help improve the fit. In fact, the two-temperature WD fit does
not provide the lowest χ2ν , the disk+WD does. However, this lowest disk+WD model, while fitting
better in the IUE (lower resolution) spectral range, does not provide a good fit a in the FUSE
(higher resolution) range of the combined spectrum and is inconsistant with the distance of the
system. As we stated previously, we do not chose blindly the lowest χ2ν model, but we chose one of
the lowest χ2ν models that provides a better fit to some specific parts and features of the spectrum.
The fact that both the WD+belt and the WD+disk provide the lowest χ2ν models, reflects the fact
that the second component cannot, presently, be modeled accurately.
There are broad emission lines which are probably due to a hot gas, and the OVI red-shifted
feature may indicate the possibility that the material is flowing away from the observer. However,
the other emission features are not resolved enough to confirm or refute such a scenario. We do
not discuss here the origin or the possible scenarios of such a flow, though the mechanisms at work
could be as varied as the ones discussed in Hoard et al. (2003) on the FUV observation of the
complex system DW UMa. It might be worth noting that the supra-solar Nitrogen abundance,
albeit uncertain (as it could well be from interstellar origin), together with the sub-solar Carbon
abundance, could be a result of CNO-processing, either from a past nova or from CNO processed
material being transferred from the processed core of the secondary.
Finally, our fitting results provide an additional badly needed temperature data point in the
distribution of WD Twd versus orbital period above the CV period gap where few WD Twds are
available, and an additional white dwarf rotational velocity derived from the FUSE data alone (see
Table 3). The surface temperature and rotational velocity of the white dwarf in WW Ceti are
within the range that has been derived for the handful of other dwarf nova white dwarfs above
the period gap. The effective temperature, Twd = 25, 000K ±1000K, of the white dwarf lies at the
lower boundary of the temperature distribution for dwarf nova white dwarfs above the period gap.
For example, at the high temperature end are RU Peg (Twd = 53,000K, (Sion & Urban 2002))
and Z Cam (Twd = 57,000K; (Hartley et al. 2005)) while SS Aur (Twd = 27,000K; (Sion et al.
2004a)), U Gem (Twd = 30,000K; (Sion et al. 1998)) and RX And (Twd = 34,000K; (Sion et al.
2001; Sepinsky et al. 2002)) make up the remainder of the distribution. The rotation rate of
600± 100km s−1 is at the high end of the rotation rate distribution for CV white dwarfs above and
below the gap (Szkody 2002).
This work was supported by NSF grant AST99-09155, NASA ADP grant NNG04GE78G,
NASA grant NAG5-13765, and by a summer research assistantship from the Delaware Space Grant

– 12 –
Consortium. PG wishes to thank the Space Telescope Science Institute for its kind hospitality.
REFERENCES
Cannizzo, J. 1998, ApJ, 493, 426
Froning, C.S., Long, K.S., Drew, J.E., Knigge, C., & Proga, D. 2001, ApJ, 562, 963
Hamada, T., & Salpeter, E.E. 1961, ApJ, 134, 683
Hartley, L.E., Long, K.S., Froning, C.S., Drew, J.E. 2005, ApJ, 623, 425
Hawkins, M.R., Smith, R., & Jones, D.H.P. 1990, in Accretion-Powered Compact Binaries, ed. C.
Mauche (Cambridge: Cambridge Univ. Press), 113
Hoard, D.W., Szkody, P., Froning, C.S., Long, K.S., & Knigge, C. 2003, ApJ, 126, 2473
Hubeny, I. 1988, Comput. Phys. Commun., 52, 103
Hubeny, I.,& Lanz, T. 1995, ApJ, 439, 875
La Dous, C. 1991, A&A, 252, 100
Long, K.S., & Gilliland, R.L. 1999, ApJ, 511, 916
Massa, F., & Fitzpatrick, E. 2000, ApJS, 126, 517
Patterson, J. 1984, ApJS, 54, 443
Press, W.H., Teukolsky, S.A., Vetterling, W.T., Flannery, B.P., Numerical Recipes in Fortran 77,
The Art of Scientific Computing, Second Edition, 1992, Cambridge University Press.
Ringwald, F.A., Thorstensen, J., Honeycutt, R., & Smith, R.C. 1996, AJ, 111, 2077
Ritter H., & Kolb U. 2003, A&A, 404, 301 <http://physics.open.ac.uk/RKcat/RKcat AA.ps>
Sepinsky, J., Sion, E.M., Gansicke, B., & Szkody, P. 2002, ApJ, 574, 937
Sion, E.M., & Urban, J. 2002, ApJ, 572, 456
Sion, E.M., Cheng, F., Szkody, P., Sparks, W.M., Gansicke, B.T., Huang, M., & Mattei, J. 1998,
ApJ, 496, 876
Sion, E.M., Cheng, F., Godon, P., Urban, J.A., Szkody, P. 2004a, AJ, 128, 183
Sion, E.M., Szkody, P., Cheng, F.H., Gansicke, B., LaDous, C., & Hassall, B. 2001, ApJ, 555, 834
Sion, E.M., Winter, L., Urban, J.A., Tovmassian, G.H., Zharikov, S., Gansicke, B.T., Orio, M.
2004b, AJ, 128, 1795
– 13 –
Sproats, L.N., Howell, S.B., & Mason, K.O. 1996, MNRAS, 282, 1211
Szkody, P. 2002, 201st AAS meeting, # 110.01; BAAS, 34, 1278
Tappert, C., Wargau, W., Hanuschik, R.W., & Vogt, N. 1997, A&A, 327, 231
Townsley, D., & Bildsten, L. 2004, ApJ, 600, 390
Wade, R.A., & Hubeny, I. 1998, ApJ, 509, 350
Warner, B. 1987, MNRAS, 227, 23
Warner, B. 1995, Cataclysmic Variable Stars (Cambridge: Cambridge Univ. Press)
Winter, L., & Sion, E.M. 2003, ApJ, 582, 352
Wood, M.A. 1990, Ph.D. thesis, University of Texas at Austin
Young, P., & Schneider, D.P. 1981, ApJ, 247, 960
This preprint was prepared with the AAS LATEX macros v5.2.

– 14 –
Table 1: WW Ceti System Parameters
Subtype: U Gem
Porb(d): 0.1758
inclination i (deg): 54± 4
Spectral Type: M2.5V
M1(M⊙): 0.85 ± 0.11
M2(M⊙): 0.41 ± 0.10
Vmax: 9.3
Vmin: 13.9
References: Hawkins, Smith & Jones (1990); Ringwald et al. (1996); Tappert et al. (1997); Ritter &
Kolb (2003)

– 15 –
Table 2: IUE Observing Log
SWP Aperture Disp. Date Time of Observation texp(s) Continuum Bckgr.
24866 Large Low 1985 Jan 8 16:29:20 9899 76 cts/s 34 cts/s

– 16 –
Table 3: Dward Novae Above the Gap with Known quiescent WD’s Temperature
System Subtype Mwd Period Twd V sin i References
(M⊙) (hours) (K) (km s−1)
RU Peg U Gem 1.10 8.99 53,000 100 Sion & Urban (2002); Sion et al. (2004a)
Z Cam Z Cam 0.99 6.96 57,000 300 Hartley et al. (2005)
EY Cyg U Gem 1.20 5.24 22,000 600 Sion et al. (2004b)
RX And Z Cam 1.14 5.04 34,000 600 Sion et al. (2001); Sepinsky et al. (2002)
SS Aur U Gem 1.08 4.38 27,000 400 Sion et al. (2004a)
U Gem U Gem 1.26 4.25 30,000 100 Sion et al. (1998); Long & Gilliland (1999)
Froning et al. (2001)
WW Cet U Gem? 0.85 4.22 25,000 600 This work
– 17 –
FIGURE CAPTIONS
Fig. 1 - The FUSE spectrum of WW Ceti. The wavelength is given in A, the flux is given
in erg s−1cm−2A−1. We have marked the emission and absorption lines and features. The airglow
emission (sharp emission lines) have been annotated with a plus sign inside a circle. The sharp
NI and NII absorption lines are probably not associated with WW Ceti. Note the very broad and
prominent OVI doublet emission.
Fig. 2 - Fitting of the oxygen doublets with two Gaussians. Upper panel: the Gaussians
have been shifted by +1.2A and are located at λO=1033.112 A & 1038.813 A . The Gaussians
have the form ∝ exp − {λ−λO
w}2 where w = 3.2 A . Lower panel: the Gaussians are at the rest
frame wavelengths of the Oxygen doublet (1031.912 A & 1037.613 A ) and their width w has been
increased to w = 3.5 A to improve the fit.
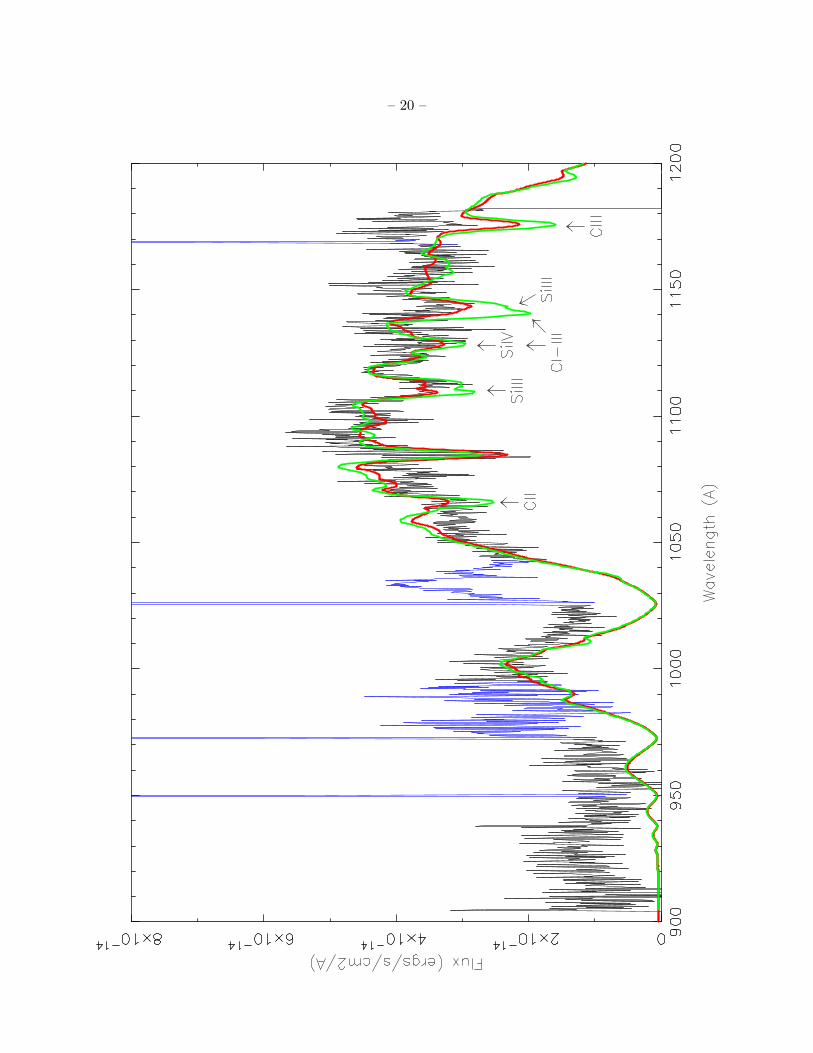
Fig. 3 - Best-fitting single temperature WD fit to the FUSE spectrum of WW Ceti in quies-
cence: T=27,000K, log g = 8.3 and V sin i = 600km s−1. The regions of the FUSE spectrum that
have been masked are plotted in blue. The solar abundances best-fit is in green and the non-solar
abundances best fit is in red. The main absorption features which are improved by the decrease of
C and Si abundances are shown with arrows.
Fig. 4 - Residual emission in the FUSE spectrum after the non-solar abundances best fit WD
model (presented in Figure 3) has been subtracted.
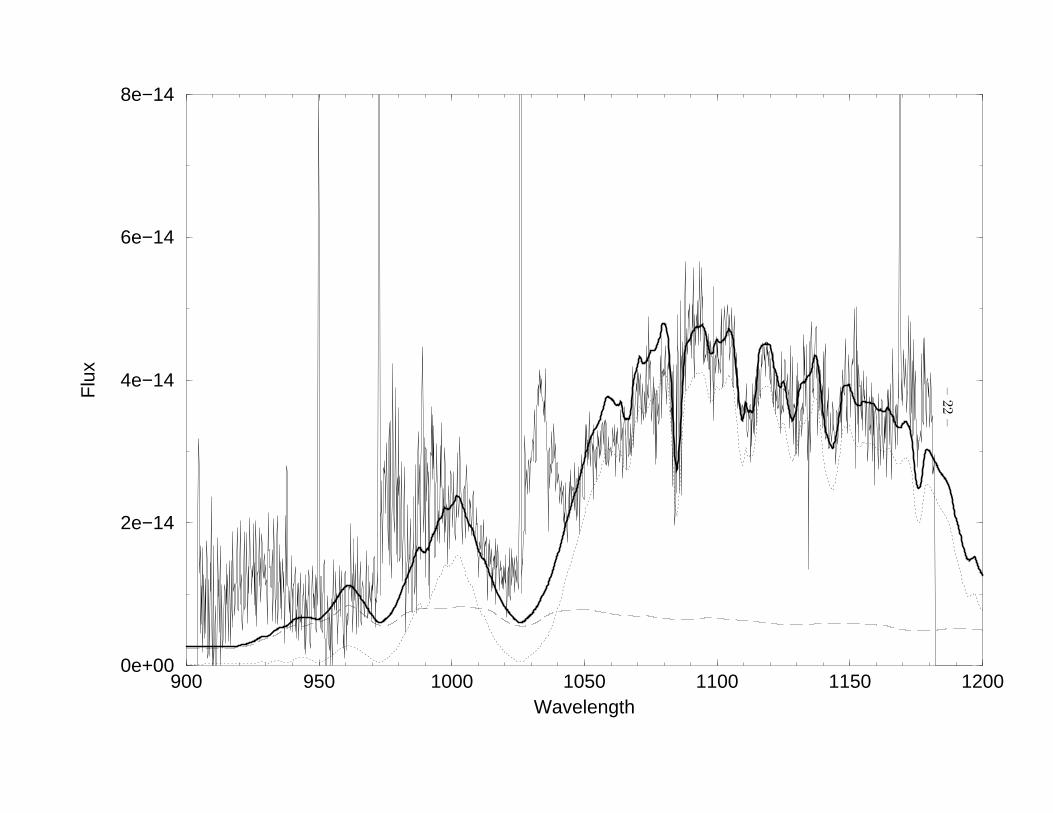
Fig. 5 - Two-temperature (white dwarf plus accretion belt) fit to the FUSE spectrum of
WW Ceti in quiescence. The dotted line represents the WD model, the dashed line represents the
accretion belt, and the solid line represents the combined model. For the WD: Twd = 25, 000K,
log g = 8.3 and V sin i = 600km s−1. For the accretion belt: Tbelt = 40, 000K, log g = 6 and
V sin i = 3000km s−1. The cooler portion of the WD contributes 75% of the FUV flux while the
accretion belt contributes 25% of the FUV flux with a fractional area of only 3%.
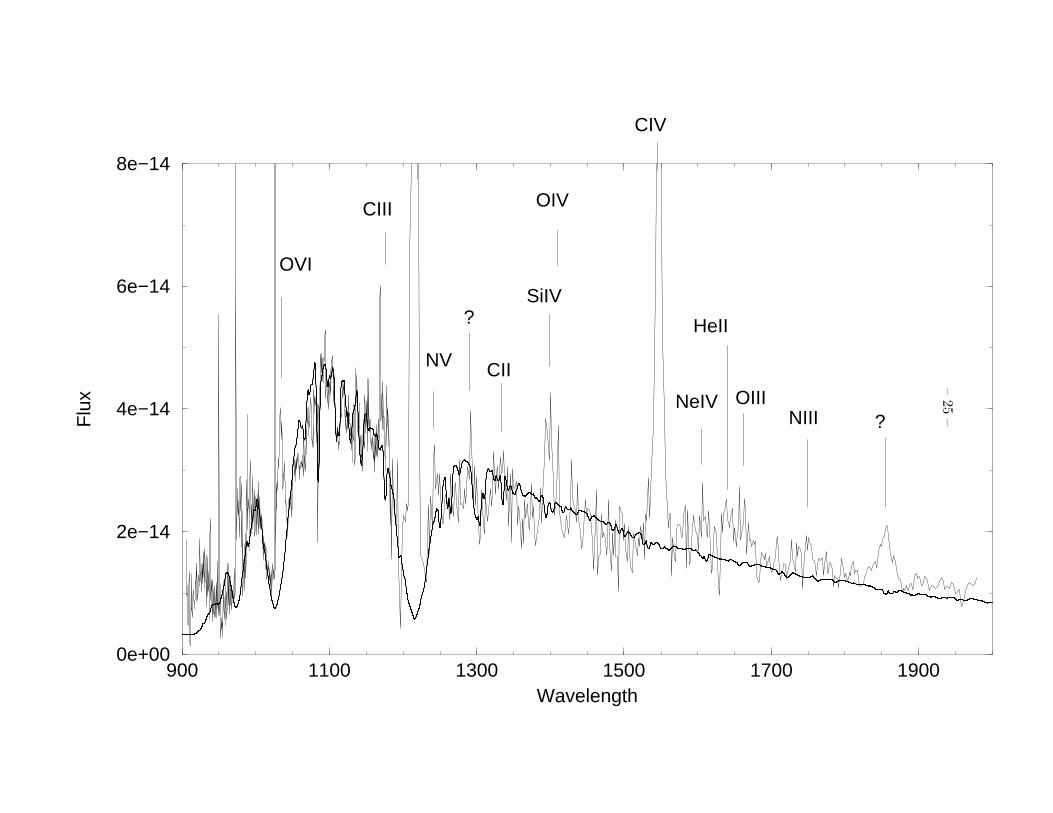
Fig. 6 - Best-fitting single temperature WD fit to the combined FUSE plus IUE spectrum of
WW Ceti is quiescence: Twd = 26, 000K with log g = 8.3.
Fig. 7 - Best-fitting white dwarf plus accretion disk model to the combined FUSE plus IUE
spectrum of WW Ceti in quiescence. The WD has a temperature of 27,000K and the mass accretion
rate is M = 10−9.5M⊙yr−1. While the fit is rather good, the distance obtained is too large by a
factor of two and the mass accretion rate is quite large for quiescence.
Fig. 8 - Two-temperature (white dwarf plus accretion belt) fit to the combined FUSE + IUE
spectra of WW Ceti in quiescence. the best fit has a WD with Twd = 25, 000K and an accretion
belt with Tbelt = 40, 000K and log g = 6. The cooler portion of the WD contributes 75% of the
FUV flux while the accretion belt, with only 3% of the total emitting area, contributes 25% of the
FUV flux.
– 18 –

– 19 –
– 20 –

– 21 –
–22
–
900 950 1000 1050 1100 1150 1200Wavelength
0e+00
2e−14
4e−14
6e−14
8e−14F
lux

– 23 –

– 24 –
–25
–
900 1100 1300 1500 1700 1900Wavelength
0e+00
2e−14
4e−14
6e−14
8e−14
Flu
x
OVI
CIII
NV
?
CII
SiIV
OIV
CIV
NeIV
HeII
OIIINIII ?


![#23 TWD COMIC [ENG]](https://static.fdocuments.in/doc/165x107/568c37871a28ab02359be8f4/23-twd-comic-eng.jpg)


