arXiv:astro-ph/0505385v1 18 May 2005
25
arXiv:astro-ph/0505385v1 18 May 2005 Accepted to the Astrophysical Journal, Part 1 Preprint typeset using L A T E X style emulateapj v. 11/12/01 NEW LOW ACCRETION-RATE MAGNETIC BINARY SYSTEMS AND THEIR SIGNIFICANCE FOR THE EVOLUTION OF CATACLYSMIC VARIABLES 1,2 Gary D. Schmidt 3 , Paula Szkody 4 , Karen M. Vanlandingham 3 , Scott F. Anderson 4 , J. C. Barentine 5 , Howard J. Brewington 5 , Patrick B. Hall 6 , Michael Harvanek 5 , S. J. Kleinman 5 , Jurek Krzesinski 5,6 Dan Long 5 , Bruce Margon 8 , Eric H. Neilsen, Jr. 9 , Peter R. Newman 5 , Atsuko Nitta 5 , Donald P. Schneider 10 , and Stephanie A. Snedden 5 [email protected] Accepted to the Astrophysical Journal, Part 1 ABSTRACT Discoveries of two new white dwarf plus M star binaries with striking optical cyclotron emission features from the Sloan Digital Sky Survey (SDSS) brings to six the total number of X-ray faint, magnetic accretion binaries that accrete at rates ˙ M 10 −13 M ⊙ yr −1 , or <1% of the values normally encountered in cataclysmic variables. This fact, coupled with donor stars that underfill their Roche lobes and very cool white dwarfs, brand the binaries as post common-envelope systems whose orbits have not yet decayed to the point of Roche-lobe contact. They are pre-magnetic CVs, or pre-Polars. The systems exhibit spin/orbit synchronism and apparently accrete by efficient capture of the stellar wind from the secondary star, a process that has been dubbed a “magnetic siphon”. Because of this, period evolution of the binaries will occur solely by gravitational radiation, which is very slow for periods >3 hr. Optical surveys for the cyclotron harmonics appear to be the only means of discovery, so the space density of pre-Polars could rival that of Polars, and the binaries provide an important channel of progenitors (in addition to the asynchronous Intermediate Polars). Both physical and SDSS observational selection effects are identified that may help to explain the clumping of all six systems in a narrow range of magnetic field strength around 60 MG. Subject headings: novae, cataclysmic variables — magnetic fields — polarization — stars: individual (SDSS J083751.00+383012.5, SDSS J132411.57+032050.5, SDSS J155331.12+551614.5, SDSS J204827.91+005008.9) 1. introduction The physics of radial accretion onto the surface of a white dwarf divides naturally into regimes defined by the specific accretion rate and local magnetic field strength (e.g., Lamb & Masters 1979; Wickramasinghe & Ferrario 2000 and references therein). For comparatively dense flows and weak fields, ˙ m 1 g cm −2 s −1 , B 50 MG, a strong shock radiates primarily by the bremsstrahlung mechanism (emissivity ǫ br ∝ N 2 e ) at a temperature com- mon to both ions and electrons of kT ∼ 10 − 30 keV. The highest accretion rates, ˙ m 100 g cm −2 s −1 , are still cooled largely by hard X-rays, but the ram pressure of the stream can depress the shock below the level of the surrounding photosphere, so that the emergent re- processed radiation appears predominately in the soft X- rays/EUV. More rarefied streams and/or stronger mag- netic fields favor cyclotron emission (ǫ cyc ∝ N e B 2 ), which results in a reduced shock height and two-fluid plasma with the electrons being substantially cooler than the ions (Fischer & Beuermann 2001). At the typical total mass accretion rate of a magnetic cataclysmic variable (CV; ˙ M ∼ 10 −11 − 10 −10 M ⊙ yr −1 ; e.g., Warner 1995), the conditions in the accretion region(s) are generally spanned by the above parameter range, and strong X-ray and po- larized optical cyclotron emission are observed. In view of this fact, it is no coincidence that the current catalog of magnetic CVs (Ritter & Kolb 2003) is dominated by discoveries from orbiting X-ray observatories (especially ROSAT). The recent initiation of large-area, deep optical surveys – generally targeted at the extragalactic universe – has un- 1 A portion of the results presented here were obtained with the MMT Observatory, a facility operated jointly by The University of Arizona and the Smithsonian Institution. 2 Based in part on observations with the Apache Point Observatory 3.5 m telescope and the Sloan Digital Sky Survey, which are owned and operated by the Astrophysical Research Consortium (ARC). 3 Steward Observatory, The University of Arizona, Tucson, AZ 85721. 4 Department of Astronomy, University of Washington, Box 351580, Seattle, WA 98195-1580. 5 Apache Point Observatory, P.O. Box 59, Sunspot, NM 88349 6 Department of Physics & Astronomy, York University, 4700 Keele St., Toronto, ON, M3J 1P3, Canada. 7 Mt. Suhora Observatory, Cracow Pedagogical University, ul. Podchorazych 2, 30-084 Cracow, Poland. 8 Space Telescope Science Institute, 3700 San Martin Drive, Baltimore, MD 21218. 9 Fermi National Accelerator Laboratory, P.O. Box 500, Batavia, IL 60510. 10 Pennsylvania State University, Department of Physics & Astronomy, 525 Davey Lab., University Park, PA 16802. 1
Transcript of arXiv:astro-ph/0505385v1 18 May 2005

arX
iv:a
stro
-ph/
0505
385v
1 1
8 M
ay 2
005
Accepted to the Astrophysical Journal, Part 1
Preprint typeset using LATEX style emulateapj v. 11/12/01
NEW LOW ACCRETION-RATE MAGNETIC BINARY SYSTEMS AND THEIR SIGNIFICANCEFOR THE EVOLUTION OF CATACLYSMIC VARIABLES1,2
Gary D. Schmidt3, Paula Szkody4, Karen M. Vanlandingham3, Scott F. Anderson4, J. C.Barentine5, Howard J. Brewington5, Patrick B. Hall6, Michael Harvanek5, S. J.
Kleinman5, Jurek Krzesinski5,6 Dan Long5, Bruce Margon8, Eric H. Neilsen, Jr.9, PeterR. Newman5, Atsuko Nitta5, Donald P. Schneider10,
and
Stephanie A. Snedden5
[email protected] to the Astrophysical Journal, Part 1
ABSTRACT
Discoveries of two new white dwarf plus M star binaries with striking optical cyclotron emissionfeatures from the Sloan Digital Sky Survey (SDSS) brings to six the total number of X-ray faint, magnetic
accretion binaries that accrete at rates M . 10−13 M⊙ yr−1, or <1% of the values normally encounteredin cataclysmic variables. This fact, coupled with donor stars that underfill their Roche lobes and verycool white dwarfs, brand the binaries as post common-envelope systems whose orbits have not yetdecayed to the point of Roche-lobe contact. They are pre-magnetic CVs, or pre-Polars. The systemsexhibit spin/orbit synchronism and apparently accrete by efficient capture of the stellar wind from thesecondary star, a process that has been dubbed a “magnetic siphon”. Because of this, period evolutionof the binaries will occur solely by gravitational radiation, which is very slow for periods >3 hr. Opticalsurveys for the cyclotron harmonics appear to be the only means of discovery, so the space density ofpre-Polars could rival that of Polars, and the binaries provide an important channel of progenitors (inaddition to the asynchronous Intermediate Polars). Both physical and SDSS observational selectioneffects are identified that may help to explain the clumping of all six systems in a narrow range ofmagnetic field strength around 60 MG.
Subject headings: novae, cataclysmic variables — magnetic fields — polarization — stars: individual(SDSS J083751.00+383012.5, SDSS J132411.57+032050.5,SDSS J155331.12+551614.5, SDSS J204827.91+005008.9)
1. introduction
The physics of radial accretion onto the surface of awhite dwarf divides naturally into regimes defined by thespecific accretion rate and local magnetic field strength(e.g., Lamb & Masters 1979; Wickramasinghe & Ferrario2000 and references therein). For comparatively denseflows and weak fields, m & 1 g cm−2 s−1, B . 50 MG,a strong shock radiates primarily by the bremsstrahlungmechanism (emissivity ǫbr ∝ N2
e ) at a temperature com-mon to both ions and electrons of kT ∼ 10 − 30 keV.The highest accretion rates, m & 100 g cm−2 s−1, arestill cooled largely by hard X-rays, but the ram pressureof the stream can depress the shock below the level ofthe surrounding photosphere, so that the emergent re-processed radiation appears predominately in the soft X-
rays/EUV. More rarefied streams and/or stronger mag-netic fields favor cyclotron emission (ǫcyc ∝ NeB
2), whichresults in a reduced shock height and two-fluid plasmawith the electrons being substantially cooler than the ions(Fischer & Beuermann 2001). At the typical total massaccretion rate of a magnetic cataclysmic variable (CV;
M ∼ 10−11 − 10−10 M⊙ yr−1; e.g., Warner 1995), theconditions in the accretion region(s) are generally spannedby the above parameter range, and strong X-ray and po-larized optical cyclotron emission are observed. In viewof this fact, it is no coincidence that the current catalogof magnetic CVs (Ritter & Kolb 2003) is dominated bydiscoveries from orbiting X-ray observatories (especiallyROSAT).
The recent initiation of large-area, deep optical surveys– generally targeted at the extragalactic universe – has un-
1 A portion of the results presented here were obtained with the MMT Observatory, a facility operated jointly by The University of Arizonaand the Smithsonian Institution.2 Based in part on observations with the Apache Point Observatory 3.5 m telescope and the Sloan Digital Sky Survey, which are owned andoperated by the Astrophysical Research Consortium (ARC).3 Steward Observatory, The University of Arizona, Tucson, AZ 85721.4 Department of Astronomy, University of Washington, Box 351580, Seattle, WA 98195-1580.5 Apache Point Observatory, P.O. Box 59, Sunspot, NM 883496 Department of Physics & Astronomy, York University, 4700 Keele St., Toronto, ON, M3J 1P3, Canada.7 Mt. Suhora Observatory, Cracow Pedagogical University, ul. Podchorazych 2, 30-084 Cracow, Poland.8 Space Telescope Science Institute, 3700 San Martin Drive, Baltimore, MD 21218.9 Fermi National Accelerator Laboratory, P.O. Box 500, Batavia, IL 60510.10 Pennsylvania State University, Department of Physics & Astronomy, 525 Davey Lab., University Park, PA 16802.
1

2 SCHMIDT ET AL.
covered a sample of six accreting magnetic binaries thatdisplay remarkably prominent, detached, and circularly-polarized cyclotron emission harmonics atop the stellarcontinua (Reimers et al. 1999; Reimers & Hagen 2000;Szkody et al. 2003, hereafter S03). The almost completelack of X-ray emission from these systems (Szkody et al.2004; hereafter S04) explains how they eluded the earlierall-sky X-ray surveys and, together with the optical spec-tral appearance, implies an extremely low specific accre-tion rate, m ∼ 0.001−0.01 g cm−2 s−1. Here, theory indi-cates that no shock forms (Kuijpers & Pringle 1982). This“bombardment” regime is a non-hydrodynamic solutionthat describes conditions in which the heated electronscool on a time scale short compared with the stopping timeof the protons (e.g., Woelk & Beuermann 1996 and refer-ences therein). In the case of a strongly magnetic whitedwarf, the cooling occurs primarily by cyclotron emissionat a low atmospheric column depth and at a temperaturewell below that of a radial shock (kT ∼ 1 keV). Thus, vir-tually all of the accretion energy emerges in a few isolatedemission features at low harmonic number. Though thevery low-m regime was explored theoretically to explainobservations of intense cyclotron lines in known AM Hersystems during temporary episodes of low mass transfer(total accretion rate M ∼ 10−12 M⊙ yr−1), it appears thatthe newly-discovered objects represent a distinct, possiblyevolutionary, binary phase with even more extreme andpersistent characteristics. Indeed, Schwope et al. (2002)have coined the term Low Accretion Rate Polar (LARP)to highlight their potential importance.
In this paper we report the discovery of two additionallow-m magnetic binaries from recent Sloan Digital SkySurvey (SDSS) observations. Followup photometric, spec-troscopic, and spectropolarimetric observations of theseand previously-discovered examples are analyzed to gaininsight into the currently small but intriguing class of ob-jects. From this evidence we explore ideas as to theirevolutionary state, space density, and relevance to bothmagnetic and nonmagnetic CVs. Preliminary discussion ofthese results was presented by Schmidt (2004), and someof the conclusions were reached by Webbink & Wickra-masinghe (2004) from a more theoretical perspective.
2. observational data
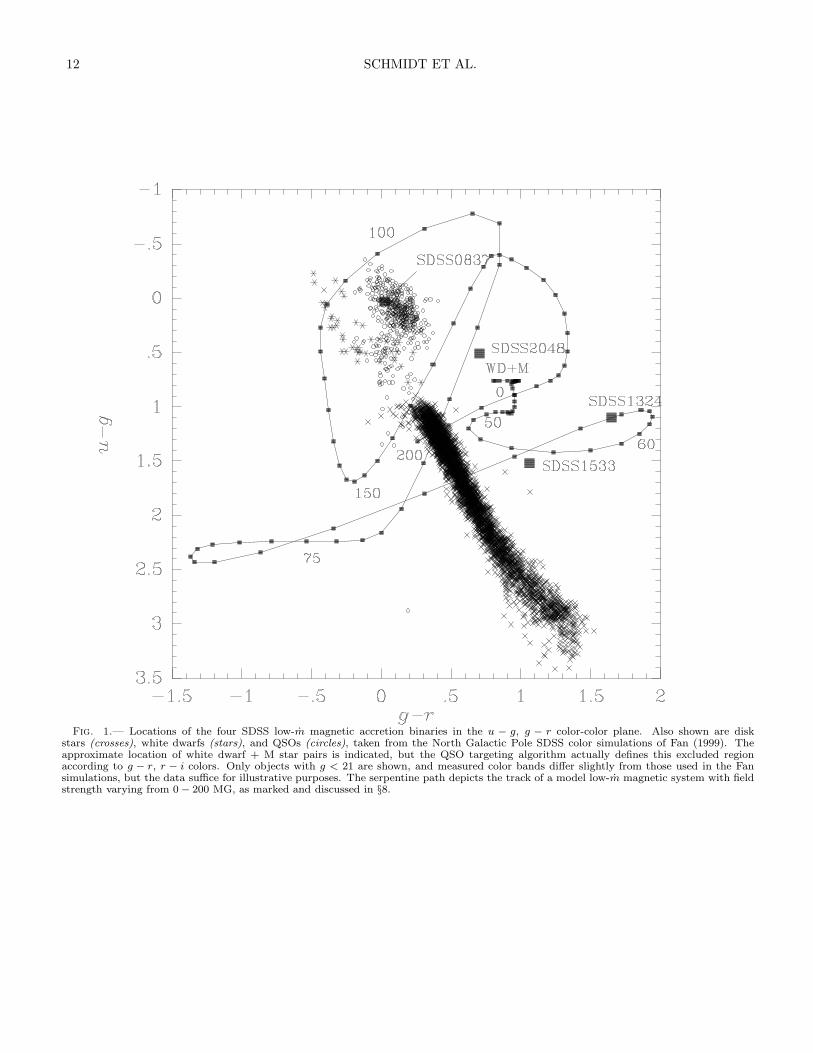
The SDSS has proven to be an extremely valuable, ifnot optimized, tool for identifying various classes of stel-lar systems. More than 120 new CVs have been catalogedthus far (Szkody et al. 2005 and references therein), basedon spectroscopy of targets selected by algorithms that aresensitive to regions of the color-color planes occupied byhot stars, QSOs, white dwarfs and white dwarf-M starpairs. Indeed, because of the presence of intense, narrow,cyclotron harmonics, three of the four SDSS low-m mag-netic accretion binaries were targeted as candidate QSOs.The exception is SDSS J2048+005011, which exhibits com-paratively weak features and was targeted as part of theSloan Extension for Galactic Understanding and Evolu-tion (SEGUE; e.g., Beers et al. 2004). As an illustration,we compare the locations of the four SDSS low-m systems
to other classes of objects in the SDSS u − g, g − r planein Figure 1.
The SDSS spectroscopic data are obtained with twindual-beam spectrographs covering the regions 3900 −6200 A and 5800− 9200 A at a resolving power of λ/dλ ∼1800. The wide, continuous spectral coverage providesbroad sensitivity to cyclotron emission features, which maybe prominent at only one or two harmonics of the cyclotronfundamental frequency ωc = eB/mec. Details of the SDSSphotometric and spectroscopic hardware, as well as thedata reduction procedures and targeting strategy, can befound in Fukugita et al. (1996), Gunn et al. (1998), Hogget al. (2001), Lupton et al. (1999, 2001), York et al.(2000), Pier et al. (2003), Smith et al. (2002), and Ivezicet al. (2004).
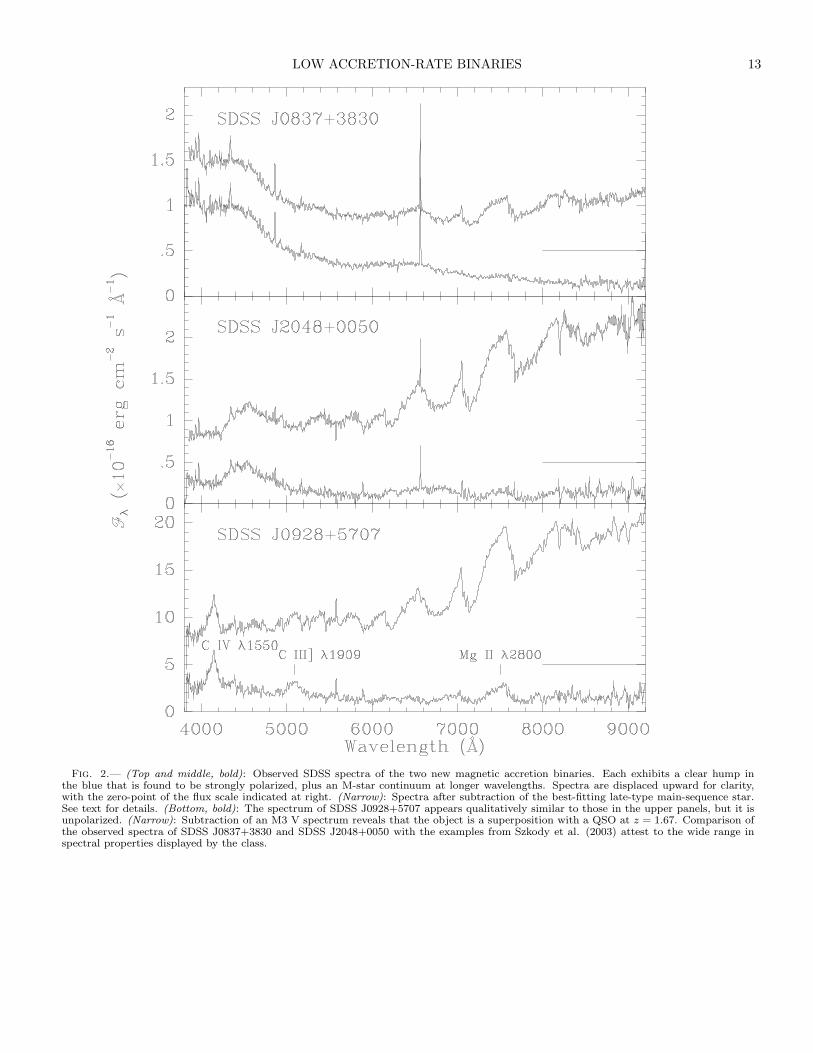
Followup observations of known magnetic systems andconfirmation of new candidates were made through opti-cal spectroscopy and circular spectropolarimetry with theinstrument SPOL (Schmidt et al. 1992) attached to the6.5 m MMT atop Mt. Hopkins and the Steward Obser-vatory 2.3 m Bok telescope on Kitt Peak. Polarimetricdata are essential because of the ∼141 million objects im-aged thus far by the SDSS, it is inevitable that there willbe chance superpositions of QSOs and late-type Galacticstars whose total flux spectra mimic the binaries discussedhere. As an example, SDSS J092853.51+570735.4 showsonly marginal evidence for duplicity in the SDSS imag-ing, yet in the survey spectrum displayed in the bottompanel of Figure 2, exhibits a single emission feature at4140A and the molecular band structure of an M dwarf.In this respect it resembles the other two objects depictedin Figure 2. However, SDSS J0928+5707 shows no circu-lar polarization to an upper limit of v = V/I = 0.4%, andas also shown in the figure, subtraction of the spectrum ofan M3 V spectrum reveals the blue continuum and emis-sion lines of a z = 1.67 QSO. SDSS J164209.57+213352.8,with z = 1.43, and probably SDSS J155839.64+082720.1and SDSS J105322.24+535510.1, are other cases that havebeen encountered thus far.
In the configuration used, the 1200×800 pixel SITeCCD used in the spectropolarimeter provides a cover-age ∼λλ4200 − 8400 and resolution ∼15 A. The thinned,back-illuminated, and anti-reflection coated device fea-tures broad sensitivity with quantum efficiency reaching92% and a read noise of 2.3e−. Circular spectropolarime-try is obtained from 4-exposure sequences in different ori-entations of a quarter-waveplate, with a Wollaston prismlocated in the collimated spectrograph beam splitting thelight into the complementary senses of polarization re-quired for measurement of a Stokes parameter. Total fluxspectra are derived from the sum of the polarized spectra,with calibrations based on observations of spectral fluxstandard stars made in the identical instrument configu-ration on the same night, and terrestrial absorption fea-tures removed through observations of proximate early-type stars. Data reduction is carried out using customIRAF scripts12.
Two runs of CCD photometry were made onSDSS J0837+3830 on 2004 Nov. 30 and Dec. 1 in an effort
11 For brevity, we will refer to objects in the text and figures by the designation SDSS Jhhmm±ddmm.12 IRAF is distributed by the National Optical Astronomy Observatories, which are operated by the Association of Universities for Researchin Astronomy, Inc., under cooperative agreement with the National Science Foundation.

LOW ACCRETION-RATE BINARIES 3
to derive a photometric period. These observations weremade in unfiltered light at the MDM 2.4 m telescope onKitt Peak with the Templeton CCD (a 1024×1024 24µmpixel, thinned, back-illuminated SITe CCD). Seeing waspoor, averaging ∼4′′ FWHM on the first night and 6′′ onthe second, and the latter run was cut short by clouds.Integration times were 300 s throughout. The data frameswere reduced using standard IRAF routines and field starswere used to perform the relative photometry.
Finally, time-resolved spectra, using 15 min integra-tions over the course of 4.3 hrs, were acquired forSDSS J2048+0050 on 2004 October 4 using the ApachePoint Observatory (APO) 3.5 m telescope. The Dou-ble Imaging Spectrograph was used with the 1.5′′ slit inhigh-resolution mode, resulting in a resolution of ∼3Aand wavelength coverage of 4000− 5200A in the blue and6000−7600A in the red. Reduction of the spectra to wave-length and flux was accomplished with standard IRAFroutines using lamps and standard star frames obtainedduring the same night. Radial velocity and flux measure-ments of the Hα and Hβ lines were made with the “e”routine (which determines the line centroid) in the IRAFSPLOT package. A log of all of the above observations isprovided as Table 1.
3. two new low accretion-rate magneticbinaries
Two new binaries with prominent, isolated emissionfeatures have been identified from SDSS spectroscopythrough the end of 2004. In coordinate and Plate-MJD-Fiber notation, they are: SDSS J083751.00+383012.5 =828-52317-049, from Data Release 3 (DR3; Abazajian etal. 2005) and reported by Szkody et al. (2005), andSDSS J204827.91+005008.9 = 1909-53242-601. The lat-ter object will be included in a future SDSS data release.Photometry is provided as SDSS psf magnitudes in Table2.
In the SDSS spectra shown in Figure 2, distinguishinghumps between 4000A and 5000A are evident in both ob-jects, but basic differences between these spectra and thoseof previous low-m magnetic systems (Reimers & Hagen1999; Reimers et al. 2000; S03) highlight the wide varietyof the class: The hump in SDSS J0837+3830 dominatesthe underlying stellar continuum with a broad and ratherflat-topped profile (FWHM & 1000A), and it is accompa-nied by prominent narrow Balmer emission lines up to atleast Hγ. Though the lines are likely more indicative ofthe conditions on the M-star surface than of any accretionstream, all of these characteristics are consistent with anaccretion rate that may be slightly higher than has beenestimated for the previous systems (M ∼ 10−13 M⊙ yr−1).In contrast, the single hump in SDSS J2048+0050 is weakcompared with the cool companion, and even though anarrow Hα line is evident, Hβ is barely detected. If thesefeatures are characteristic of the binary over long timescales, the accretion rate would seem to be extremely low.
3.1. SDSS J0837+3830
Each of the two runs of CCD photometry onSDSS J0837+3830 shows a clear brightness variation ona timescale of a few hours. The two nights were therefore
combined and power spectrum analysis performed. Theresult displays two peaks of equal significance at periodsof 3.18 and 3.65 hr, i.e., a difference of one cycle betweenthe two nights. Least-squares fits to a sine wave yielda semi-amplitude of 0.06 mag in either case, and inspec-tion suggests that the period with the slightly higher totalχ2, 3.18 hr, might actually be preferred because of fewerdiscrepant data points. This choice is depicted in Fig-ure 3. Because the CCD was used unfiltered, it is notpossible to categorically assign the photometric variationto a changing view of the magnetic field in the cyclotronemission region (the white dwarf spin period) as opposedto the varying aspect of a tidally-locked secondary star(the orbital period). However, where information is avail-able for the previously-studied low-m systems listed inTable 3, indications are that spin-orbit synchronism hasbeen established13, and we presume that this is the casealso in SDSS J0837+3830. Unfortunately, the interval be-tween the photometric observations and our spectroscopydescribed below is too long to place the latter data on aphase scale.
All four epochs of followup spectroscopy ofSDSS J0837+3830 yielded spectra that mimic the sur-vey data shown in Figure 2: a single dominant cyclotronhump in the blue, narrow Balmer emission lines, andthe continuum of a cool companion star with R ∼ 19.2.Indeed, the observational record for this object is as ex-tensive as for the previously-discovered low-m magneticsystems, and shows no evidence for high accretion statesover a period of 3 yr. The longest run with the spectropo-larimeter spanned slightly more than 1.2 hr, or ∼40% ofthe photometric period, while the object was setting onthe evening of 2004 May 13. As depicted in Figure 4,each of the five 800 s sequences displayed circular polar-ization of nearly −20% in the 4500A hump, and a secondnegatively-polarized feature is present near 6200A. For alow plasma temperature, these can be readily assigned toharmonics n = ω/ωc = 4 and 3, respectively, in a fieldof 65 MG. However, the shape of the n = 3 circular po-larization harmonic is distorted into a peaked profile, andsignificant positive circular polarization, v = 2 − 4%, ismeasured between the harmonics. This indicates that theoppositely-polarized magnetic pole is also accreting, andthat it may have a slightly different field strength as wellas a lower accretion rate. Variations through the sequenceare confined to a reduction in the emission-line strengthand possible fading of the n = 4 harmonic. The constancyin radial velocity of the Hα emission line to ≤50 km s−1
and the small amplitudes of polarimetric and photometricvariability suggest that this binary may be oriented at alow inclination.
3.2. SDSS J2048+0050
The APO spectra of SDSS J2048+0050 appear very sim-ilar to the SDSS spectrum shown in Figure 2, which wasobtained about 1.5 months earlier. The blue spectra coverthe cyclotron hump near 4550A and Hβ, while the redspectra follow Hα and the TiO bands. The Balmer linesare very narrow, ruling out an origin in an infalling stream,and He II λ4686 is not present, indicating the lack of a hard
13 See also §4
4 SCHMIDT ET AL.
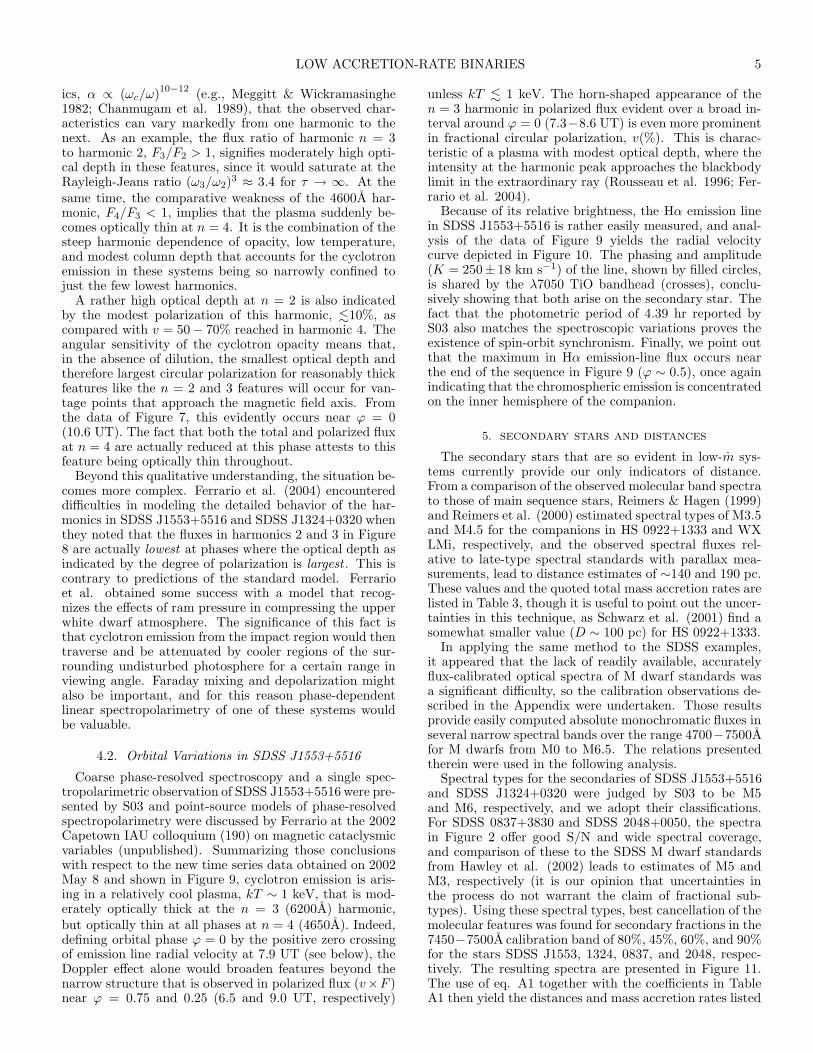
irradiating continuum. The time-resolved spectra show achanging amplitude of the cyclotron hump and strength ofthe Balmer emission, with the Hβ line disappearing com-pletely in several spectra. Least squares fitting of the ve-locity measurements to a sinusoid yields a period of 4.2hr (250 min) for Hα with a K semi-amplitude of 153 ± 5km s−1 and rms deviation of 14 km s−1 around the fit.Hβ was more difficult to measure and had fewer samplesdue to its disappearance at some phases, so the periodwas fixed at 250 min to derive a best fit solution withK = 124 ± 7 km s−1 and an rms of 18 km s−1. Again,our knowledge of the period is insufficient to link to otherdatasets. The fits are shown along with the data pointsand Hα line fluxes in Figure 5. A least-squares sine fit tothe fluxes indicates that the peak flux is offset by ∼0.14phase from the negative-to-positive velocity zero-crossingthat defines ϕ = 0. The implications of these observationsare that the lines originate predominately from the innerhemisphere of the secondary star, similar to the conclusionreached for WX LMi (HS 1023+3900) by Schwope et al.(2002), but the emission is not symmetric around the lineof centers. If the enhanced emission is caused by irradi-ation of the secondary by a hot area near the accretingpole of the white dwarf, then it is likely that the pole isnot directly opposite the secondary. Among the spin-orbitsynchronized magnetic CVs (Polars) it is common to findthe principal magnetic pole advanced somewhat progradeof the secondary in its orbit (Cropper 1988).
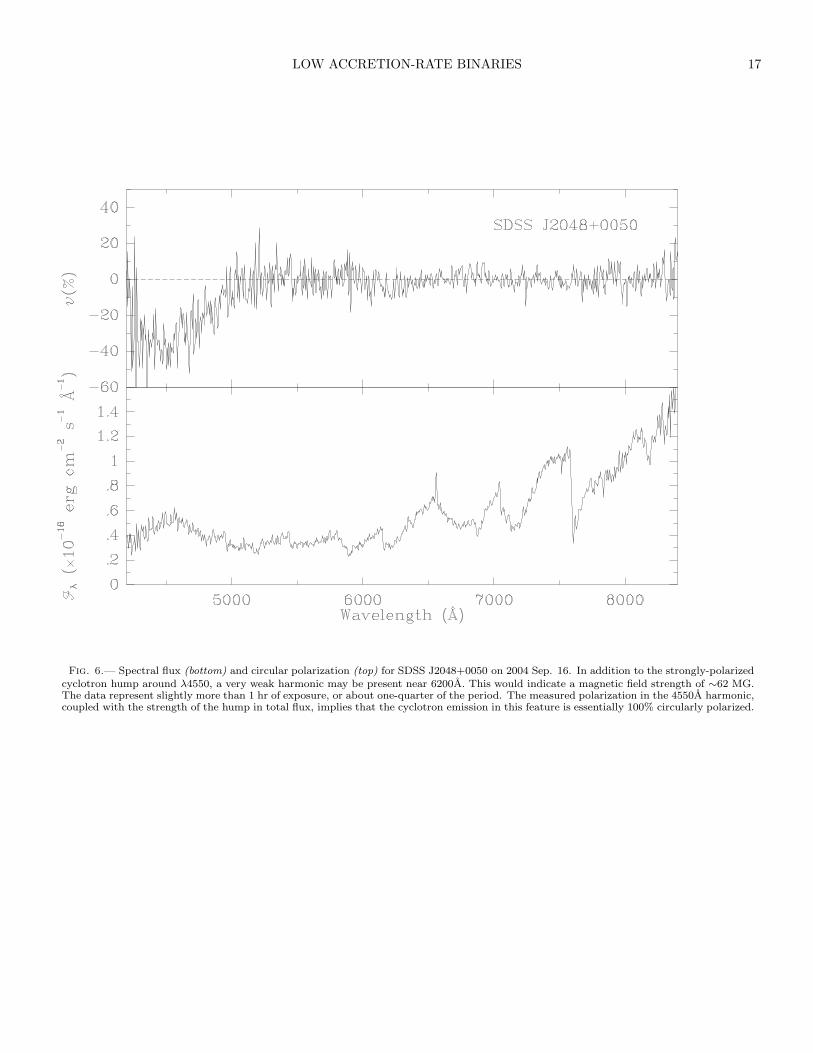
Spectropolarimetry of SDSS J2048+0050 has thus farbeen limited to slightly more than 1 hr obtained throughcirrus on the 2.3 m telescope. The data were acquired infive sequences, and very little variation can be detectedthrough the series. The combined flux spectrum, shownin Figure 6, again closely resembles the SDSS spectrum inFigure 2 both in absolute brightness and in the presenceof a single hump centered near 4550A. Hα is weak and Hβis absent altogether at this combination of S/N and reso-lution. The net circular polarization in the 4550A featureis extremely high at −38%. This, coupled with the factthat the peak flux of the feature is elevated only ∼40%above the stellar continuum, implies that the cyclotronlight in this harmonic must be essentially 100% circularlypolarized! The polarization also dips slightly below zeroaround 6200A, suggesting the presence of a second, weakercyclotron harmonic akin to that in SDSS J0837+3830. Ifreal (see §5), the harmonics have the same numerical as-signment as in that system and the magnetic field strengthis very similar at ∼62 MG. No evidence exists for emissionfrom the opposite magnetic pole, at least during the phaseinterval recorded by the spectropolarimetry.
SDSS J2048+0050 may be associated with a weak X-ray source in the ROSAT All Sky Survey (RASS) at thelevel of 0.014 count s−1, although there are other opticalobjects within the error circle. Using the crude conversionof 1 count s−1 = 7×10⁻¹² erg cm−2 s−1 and a distance of260 pc (derived below), a 0.1 − 2.4 keV X-ray luminosityof LX ∼ 8× 1029 erg s−1 is found. This would be approx-imately an order of magnitude larger than the measure-ments of LX for SDSS J1553+5516 and SDSS J1324+0320by S04, which were interpreted to arise from coronal emis-sion on the secondaries. The result for SDSS J2048+0050
is extremely uncertain and begs for a deeper observation.
4. new results on known low-m systems
4.1. Orbital Variations in SDSS J1324+0320
The cyclotron emission harmonics in SDSS J1324+0320display the greatest contrast relative to the underlyingcontinuum of any of the low-m systems discovered thusfar. The SDSS spectrum was presented by S03 togetherwith a single observation of confirming spectropolarime-try, and a magnetic field strength of 63 MG was estimatedfrom the identification of the humps with harmonics n = 2(8200A), 3 (5600A), and 4 (4600A). A period of ∼2.6 hrwas also derived from a 1.3 mag modulation in the r-bandlight curve. Because the cyclotron features overwhelm thestellar components in the optical, this period was ascribedto the rotation of the white dwarf, which was presumed tobe synchronized to the orbital motion. The system was un-detected in the RASS and produced only 0.0012±0.0003count s−1 in the most sensitive XMM -Newton detector(the EPIC pn; S04).
A full orbit of circular spectropolarimetry ofSDSS J1324+0320 obtained at the MMT in 2004 Feb.is presented in Figure 7. The time sequences representthe circularly polarized spectral flux14, −v×Fλ, and totalflux, Fλ, for successive 13 min observations. Prior to dis-play, the spectrum of an M6 V star was subtracted fromthe data, as this spectral type was determined by S03 tobest match the band features. It is clear from inspectionthat the dominant n = 3 harmonic at 5600A is indeedthe origin of the dramatic modulation in the r-band lightcurve, but plasma effects cause an even greater variationin the circularly polarized flux. In the first and last fewobservations of the series an extremely weak, narrow Hαemission line can be recognized in the total flux spectrum.The integrated flux and radial velocity of this feature havebeen measured for all spectra in which it can be discerned,and the results are shown in Figure 8. The accompany-ing least-squares sinusoidal fits to the variations showthat the minimum in Hα flux nearly coincides with thepositive zero-crossing of radial velocity (uncertainties intimes of zero-crossing for the fitted curves are each slightlymore than 0.1 hr). As in SDSS J2048+0050, we assignϕ = 0 (UT ≈ 10.6) to this crossing. Combined with avelocity semi-amplitude of 342 ± 146 km s−1, the charac-teristics argue for a system viewed at a high inclination,with the line emission confined largely to the inner hemi-sphere of the companion. ϕ = 0 then corresponds to thetime that the secondary star and white dwarf are mostnearly aligned along our line of sight. The antiphasingbetween Hα line strength and overall cyclotron flux inFigure 7 additionally implies that the dominant accretingpole of SDSS J1324+0320 is located on the inner hemi-sphere of the white dwarf. As is true for the other low-msystems, the agreement between the 2.6 hr photometricperiod and the independently derived spectroscopic valueof 2.62 ± 0.24 hr implies that the white dwarf spin andbinary motion are locked.
The spectral sequences in Figure 7 offer an instructivedisplay of the emission properties of a magnetized plasma.The cyclotron absorption coefficient at low temperatures issuch a steep function of frequency in the first few harmon-
14 Note that the polarized flux has been negated to facilitate comparison with the total flux spectra.
LOW ACCRETION-RATE BINARIES 5
ics, α ∝ (ωc/ω)10−12
(e.g., Meggitt & Wickramasinghe1982; Chanmugam et al. 1989), that the observed char-acteristics can vary markedly from one harmonic to thenext. As an example, the flux ratio of harmonic n = 3to harmonic 2, F3/F2 > 1, signifies moderately high opti-cal depth in these features, since it would saturate at theRayleigh-Jeans ratio (ω3/ω2)
3 ≈ 3.4 for τ → ∞. At thesame time, the comparative weakness of the 4600A har-monic, F4/F3 < 1, implies that the plasma suddenly be-comes optically thin at n = 4. It is the combination of thesteep harmonic dependence of opacity, low temperature,and modest column depth that accounts for the cyclotronemission in these systems being so narrowly confined tojust the few lowest harmonics.
A rather high optical depth at n = 2 is also indicatedby the modest polarization of this harmonic, .10%, ascompared with v = 50 − 70% reached in harmonic 4. Theangular sensitivity of the cyclotron opacity means that,in the absence of dilution, the smallest optical depth andtherefore largest circular polarization for reasonably thickfeatures like the n = 2 and 3 features will occur for van-tage points that approach the magnetic field axis. Fromthe data of Figure 7, this evidently occurs near ϕ = 0(10.6 UT). The fact that both the total and polarized fluxat n = 4 are actually reduced at this phase attests to thisfeature being optically thin throughout.
Beyond this qualitative understanding, the situation be-comes more complex. Ferrario et al. (2004) encountereddifficulties in modeling the detailed behavior of the har-monics in SDSS J1553+5516 and SDSS J1324+0320 whenthey noted that the fluxes in harmonics 2 and 3 in Figure8 are actually lowest at phases where the optical depth asindicated by the degree of polarization is largest . This iscontrary to predictions of the standard model. Ferrarioet al. obtained some success with a model that recog-nizes the effects of ram pressure in compressing the upperwhite dwarf atmosphere. The significance of this fact isthat cyclotron emission from the impact region would thentraverse and be attenuated by cooler regions of the sur-rounding undisturbed photosphere for a certain range inviewing angle. Faraday mixing and depolarization mightalso be important, and for this reason phase-dependentlinear spectropolarimetry of one of these systems wouldbe valuable.
4.2. Orbital Variations in SDSS J1553+5516
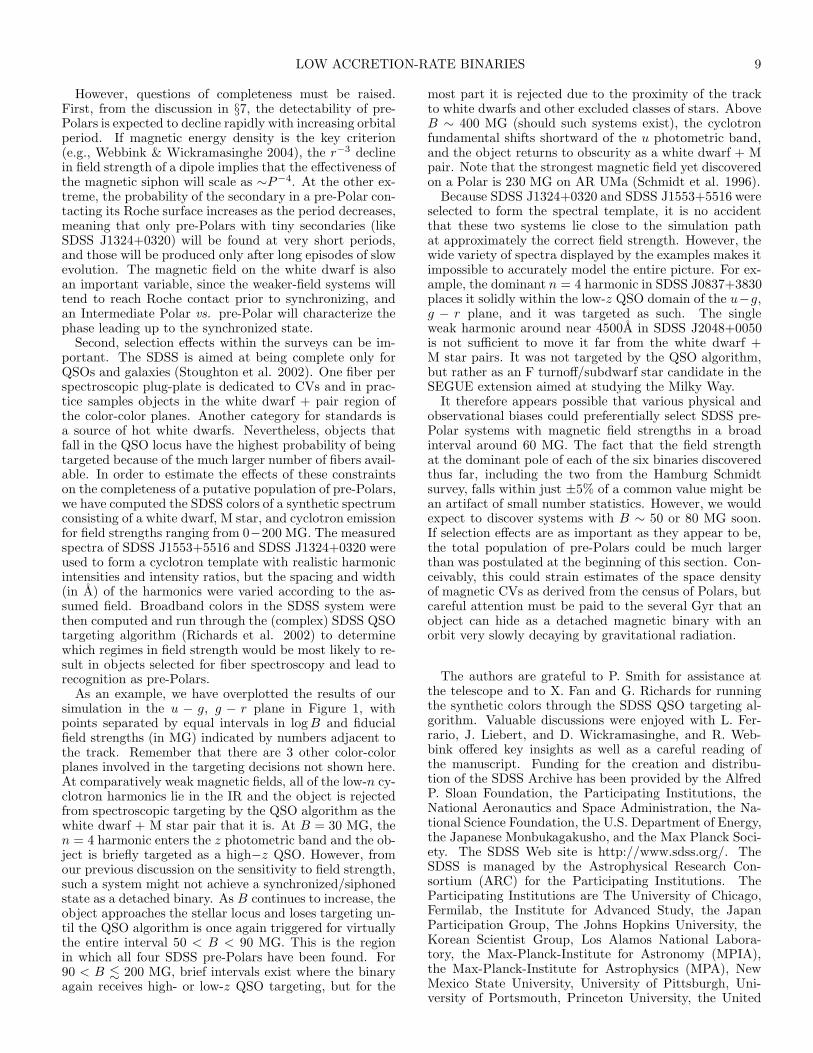
Coarse phase-resolved spectroscopy and a single spec-tropolarimetric observation of SDSS J1553+5516 were pre-sented by S03 and point-source models of phase-resolvedspectropolarimetry were discussed by Ferrario at the 2002Capetown IAU colloquium (190) on magnetic cataclysmicvariables (unpublished). Summarizing those conclusionswith respect to the new time series data obtained on 2002May 8 and shown in Figure 9, cyclotron emission is aris-ing in a relatively cool plasma, kT ∼ 1 keV, that is mod-erately optically thick at the n = 3 (6200A) harmonic,but optically thin at all phases at n = 4 (4650A). Indeed,defining orbital phase ϕ = 0 by the positive zero crossingof emission line radial velocity at 7.9 UT (see below), theDoppler effect alone would broaden features beyond thenarrow structure that is observed in polarized flux (v×F )near ϕ = 0.75 and 0.25 (6.5 and 9.0 UT, respectively)
unless kT . 1 keV. The horn-shaped appearance of then = 3 harmonic in polarized flux evident over a broad in-terval around ϕ = 0 (7.3−8.6 UT) is even more prominentin fractional circular polarization, v(%). This is charac-teristic of a plasma with modest optical depth, where theintensity at the harmonic peak approaches the blackbodylimit in the extraordinary ray (Rousseau et al. 1996; Fer-rario et al. 2004).
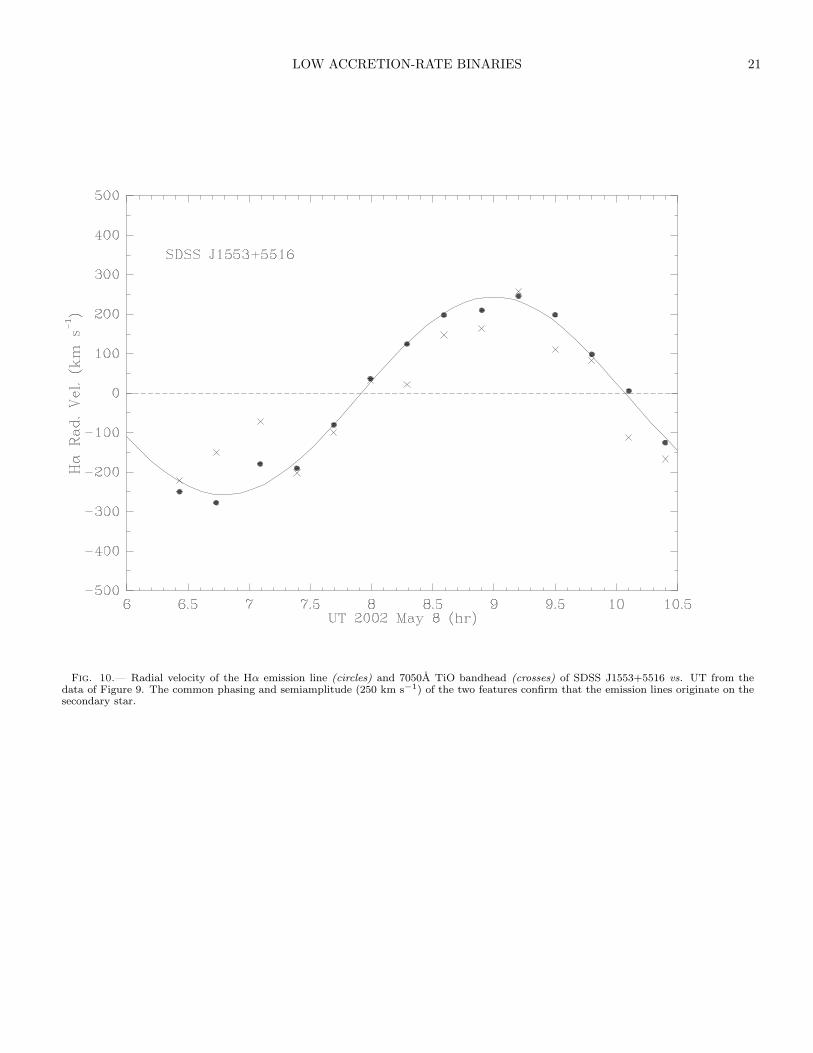
Because of its relative brightness, the Hα emission linein SDSS J1553+5516 is rather easily measured, and anal-ysis of the data of Figure 9 yields the radial velocitycurve depicted in Figure 10. The phasing and amplitude(K = 250± 18 km s−1) of the line, shown by filled circles,is shared by the λ7050 TiO bandhead (crosses), conclu-sively showing that both arise on the secondary star. Thefact that the photometric period of 4.39 hr reported byS03 also matches the spectroscopic variations proves theexistence of spin-orbit synchronism. Finally, we point outthat the maximum in Hα emission-line flux occurs nearthe end of the sequence in Figure 9 (ϕ ∼ 0.5), once againindicating that the chromospheric emission is concentratedon the inner hemisphere of the companion.
5. secondary stars and distances
The secondary stars that are so evident in low-m sys-tems currently provide our only indicators of distance.From a comparison of the observed molecular band spectrato those of main sequence stars, Reimers & Hagen (1999)and Reimers et al. (2000) estimated spectral types of M3.5and M4.5 for the companions in HS 0922+1333 and WXLMi, respectively, and the observed spectral fluxes rel-ative to late-type spectral standards with parallax mea-surements, lead to distance estimates of ∼140 and 190 pc.These values and the quoted total mass accretion rates arelisted in Table 3, though it is useful to point out the uncer-tainties in this technique, as Schwarz et al. (2001) find asomewhat smaller value (D ∼ 100 pc) for HS 0922+1333.
In applying the same method to the SDSS examples,it appeared that the lack of readily available, accuratelyflux-calibrated optical spectra of M dwarf standards wasa significant difficulty, so the calibration observations de-scribed in the Appendix were undertaken. Those resultsprovide easily computed absolute monochromatic fluxes inseveral narrow spectral bands over the range 4700−7500Afor M dwarfs from M0 to M6.5. The relations presentedtherein were used in the following analysis.
Spectral types for the secondaries of SDSS J1553+5516and SDSS J1324+0320 were judged by S03 to be M5and M6, respectively, and we adopt their classifications.For SDSS 0837+3830 and SDSS 2048+0050, the spectrain Figure 2 offer good S/N and wide spectral coverage,and comparison of these to the SDSS M dwarf standardsfrom Hawley et al. (2002) leads to estimates of M5 andM3, respectively (it is our opinion that uncertainties inthe process do not warrant the claim of fractional sub-types). Using these spectral types, best cancellation of themolecular features was found for secondary fractions in the7450−7500A calibration band of 80%, 45%, 60%, and 90%for the stars SDSS J1553, 1324, 0837, and 2048, respec-tively. The resulting spectra are presented in Figure 11.The use of eq. A1 together with the coefficients in TableA1 then yield the distances and mass accretion rates listed

6 SCHMIDT ET AL.
in Table 3. For reference, an accretion rate of 10−13 M⊙
yr−1 corresponds to a luminosity Lacc ∼ 6× 1029 erg s−1.The distance estimate to SDSS J1553+5516 is somewhatlarger than the 100 pc used by S03, but the values are prob-ably consistent to within the accuracy of the technique.In fact, considering the combined uncertainties in spectralclassification of the secondaries, fractional contributionsto the spectra, standard calibration, and slit/fiber losses,distances to individual objects should not be trusted tobetter than 50%, or the resulting luminosities to a factorof two. Note that the spectrum of SDSS J2048+0050 dis-played in Figure 11 exhibits a broad bump around 6600Athat exceeds the residuals from the M-star subtraction andthat we take in support of our polarimetric identificationof the n = 3 cyclotron harmonic (§3.2).
In computing the total mass accretion rates, the whitedwarf mass was taken to be 0.6 M⊙ and gravitational en-ergy was assumed to be converted solely into cyclotron flux(see, however, §6), with only a small allowance for harmon-ics outside the observed window. The flux progression inthe observed harmonics, which typically peaks at n = 3,supports this view. The exception is SDSS 0837+3830,which apparently is not optically thin in the bluest har-monic measured (n = 4). For this system the uncertainty
in M is somewhat higher. The absence of significant X-ray emission has been demonstrated for SDSS J1553+5516and SDSS J1324+0320 (S04), and theory (e.g., Woelk &Beuermann 1992) asserts that this should be the case forthe field strengths and specific accretion rates indicated bythe cyclotron spectra.
6. primary star temperatures
Temperatures for the white dwarfs have been esti-mated at Teff ≤ 10, 000 K for both HS 0922+1333 andSDSS J1553+5516 (Reimers et al. 1999; S03), and13,000 K ± 1000 K for WX LMi (Reimers & Hagen 2000).All are unusually cool in comparison to the primaries ofPolars, which themselves are cooler than the white dwarfsin nonmagnetic CVs (Sion 1999). The difference betweenthe latter two classes is understood to reflect differentlevels of accretion-induced heating, largely compressionalheating of the interior (Townsley & Bildsten 2002). Byextension, the temperature limit for SDSS J1553+5516not only implies that the system is relatively old, τcool &0.7 Gyr, but can be used to constrain the mean accretionrate over the past ∼106 yr to 〈M〉 . 3 × 10⁻¹² M⊙ yr−1
(Townsley & Bildsten 2004; S04).Analysis of the spectra of the other three SDSS
systems yields similarly low estimates: Teff .14, 000 K for SDSS J0837+3830 and .7,500 K for bothSDSS J1324+0320 and SDSS J2048+0050. Each of thesevalues is based on the observed flux level in a gap be-tween cyclotron harmonics, after subtraction of the best-fitting M dwarf template, and makes use of surface fluxesfrom the nonmagnetic log g = 8 DA model atmospheressummarized by Bergeron et al. (1995). We have alsoassumed a stellar radius of 8 × 108 cm (appropriate forMwd ∼ 0.6 M⊙), and include an allowance of 50% abovethe distances listed in Table 3 to account for the uncertain-ties in those estimates. While higher mass white dwarfs(smaller radii) would permit higher temperatures, valuesincrease by only 20 − 50% for Mwd = 1 M⊙, and in any
case the possibility of additional emission sources contam-inating the gaps renders the estimates upper limits.
In evaluating the spectra, it was evident that thespectral shape of the underlying continuum occasion-ally appeared hotter than the temperature indicated bythe measured flux at a specific wavelength. The situa-tion is depicted in Figure 11 as a comparison betweenthe secondary-subtracted SDSS spectra and model stel-lar energy distributions. Because the model tempera-tures, which range from 5,500 K for SDSS J1324+0320to 9,500 K for SDSS J0837+3830, were computed on thebasis of the flux at a cyclotron-free wavelength in the in-terval 5000 − 5600A, the continua match here. However,for SDSS J1553+5516 and SDSS J2048+0050 the modelatmospheres fall well short of the measured flux around4000A. The spectrum of SDSS J1324+0320 is too faint inthe blue for a reliable comparison and the broader n = 4harmonic in SDSS J0837+3830 confounds the assignmentof the stellar continuum at the shortest wavelengths.
The inconsistency between continuum shape and ab-solute flux level for at least SDSS J1553+5516 andSDSS J2048+0050 is reminiscent of the difficulties thatplague temperature determination of non-accreting highlymagnetic white dwarfs, where observed optical continuaare found to be significantly steeper than predicted by non-magnetic white dwarf models (e.g., Schmidt et al. 1986;Gansicke et al. 2001). However, the disparity is consider-ably greater in the low-m systems, despite a field strength(∼65 MG) below the level at which substantial effects onthe emitted continuum are expected (>100 MG). Unfortu-nately, the best attempts to estimate bound-free opacitiesin the presence of a strong magnetic field (Merani et al.1995) have not proven to be noticeably better in explainingthe observed spectral energy and polarization distributions(Jordan & Merani 1995) at high strengths.
We suggest that a more viable explanation of the dif-ferences between indicators of stellar temperature is thepresence of a heated cap surrounding the magnetic pole(s).Irradiated hot spots are known to be important in andaround the impact regions of Polars, where temperaturesas high as 3 × 10⁵ K and sizes up to a fraction f = 0.1 ofthe stellar surface are measured (e.g., Vennes et al. 1995;Gansicke et al. 1998; Mauche 1999). Even if cyclotronemission is the dominant cooling mechanism in a low-msystem, approximately half of that radiation will be di-rected downward, where it will be intercepted and reradi-ated in the UV or EUV by the white dwarf photosphere.Considering the sizes of the impact regions on Polars, a hotspot covering 2−5% of the stellar surface in a low-m mag-netic binary would not be unreasonable. From simple sim-ulations using blackbodies (Gansicke et al. 1998; Mauche1999) we have found that a spot with Teff = 20, 000 K andf = 0.04 could steepen the net continuum of a star witha surface temperature of 8,500 K to an equivalent tem-perature of >10,000 K, while increasing the absolute fluxin the optical by only ∼30%. Other combinations are, ofcourse, possible.
The total luminosity of a hot spot with the above char-acteristics implies a total accretion rate M ∼ 4×10⁻¹³ M⊙
yr−1, slightly higher than the highest rates indicated bythe optical cyclotron luminosity in Table 3. However, thereis independent evidence in favor of such spots in the form

LOW ACCRETION-RATE BINARIES 7
of the flux-modulated narrow Balmer emission lines de-scribed in §3 and 4. While Balmer emission is a commonattribute of active late-type stars, in each of the four SDSSexamples the line flux was found to be enhanced on theinner (irradiated) side of the secondary. Assuming thateach ionizing photon incident on the secondary gives riseto one Hα photon, a spot with Teff = 20, 000, f = 0.04could account for a luminosity LHα ∼ 3 × 1026 erg s−1 ina binary with P = 4 hr. This is a significant fraction ofthe 2− 20× 1026 erg s−1 measured in the modulated por-tions of the line. Higher temperatures and lower coveringfactors would bring the numbers into better agreement.The fact that SDSS J0837+3830 exhibits the largest mea-sured Hα luminosity, as well as the highest inferred ac-cretion rate and hottest white dwarf of the SDSS objects,is a reassuring consistency check. Some support is alsoprovided by the (marginal) detection of a ∼46 eV compo-nent in the EUV portion of the XMM-Newton spectrumof SDSS J1553+5516 (S04) that could not be explained bycoronal emission from the secondary star. A more defini-tive test is possible in the form of UV/EUVE photometrythrough an orbital cycle (a la Gansicke et al. 1998), indeedNUV/FUV observations of SDSS J1553+5516 are in thequeue for GALEX . If irradiated accretion spots contributesignificantly to the optical continua of the low-m magneticbinaries, the implication is that the physics of the impactregion involve more cooling mechanisms than have beendiscussed to date.
7. low accretion-rate magnetic systems aspre-polars
7.1. Undersized Companions
The total accretion rate estimates in Table 3, ∼5 ×10⁻¹⁴−3×10⁻¹³ M⊙ yr−1, are all <1% of the values typ-ically measured for Polars during high accretion states. Infact, the numbers bear more similarity to the integratedsolar wind mass loss rate of 2× 10⁻¹⁴ M⊙ yr−1. The ten-dency of diskless CVs to lapse into periods of inactivityis well known, but even in low states the accretion lumi-nosities of Polars are nearly an order of magnitude largerthan we have measured for the low-m systems (Ramsay etal. 2004). Furthermore, the durations of Polar low statesare typically found to lie in the range of weeks to ∼1 yr15,and the overall duty-cycle of accretion appears to be ∼50%(Hessman et al. 2000; Ramsay et al. 2004). In contrast,none of the objects listed in Table 3 has ever been observedin a high state, despite repeated telescopic visits separatedby intervals as long as a few yr (Table 1 and Schwarz et al.2001). These facts, coupled with the low surface tempera-tures found for the primary stars, motivate their identityas a new class of chronically low-m systems.
An explanation for the distinctively low accretion ratesand a clue to their evolutionary status is the fact that inall six cases the secondary stars appear to underfill theirRoche lobes. This has already been noted for WX LMi bySchwarz et al. (2001), who pointed out that a star withthe measured spectral type of M4.5 V has a radius 20%smaller than the Roche lobe for P = 2.8 hr. The lobedimensions scale directly with stellar separation, therefore
the overall situation can be appreciated simply by notingthat the spectral type expected for a Roche lobe-fillingmain-sequence star varies from M2 at a period of 4 hrto M4.5 at P = 2 hr. These types are systematicallyearlier (by 0.5 to 3 subtypes) than the measured spectraltypes in Table 3. Moreover, the mean difference of nearly1.5 subtypes is large enough to accommodate any modernmass-radius relation for the lower main sequence as well asprimary star masses as large as the Chandrasekhar limit.Beuermann et al. (1998) and Baraffe & Kolb (2000) havepointed out that, among CVs in general, a spectral typedifference in the same sense is observed for systems withP > 3 hr. Simulations by Baraffe & Kolb indicate thatthe general trend observed for 3 < P < 6 hr, as well asthe width of the 2 − 3 hr period gap, can be explained bythe donor stars being out of thermal equilibrium owing tomass loss at a rate M = 1−2×10⁻⁹ M⊙ yr−1. While thisaccretion rate is in rough agreement with what is inferredfrom luminosity estimates for disk CVs above the gap, thegenerally much lower luminosities of Polars have long beeninterpreted to imply that they accrete at rates 1−2 ordersof magnitude less, a fact explicable by the inhibiting effectsof the primary star’s magnetic field on magnetic brakingfrom the donor (Webbink & Wickramasinghe 2002 andreferences therein). Thus, in the Baraffe & Kolb (2000)scenario, the systematic difference in spectral type shouldnot exist for secondary stars in the synchronized magneticCVs. Unfortunately, Polars are strongly clustered belowthe period gap, and only 4 systems exist with P > 3 hrin the list analyzed in the above studies. Among them isV1309 Ori at P = 8 hr, whose M0.5 secondary is evolved(Garnavich et al. 1994). There is a hint that companionsin the remaining 3 magnetic objects are 0.5 − 1 subtypelater than expected for main sequence donors, but a largersample is required to confirm or reject the notion.
Questions about the secondaries in Polars notwithstand-ing, mass loss rates of <10−12 M⊙ yr−1 imply evolution-ary timescales far longer than the donor star’s thermaltimescale. For the same accretion rates, irradiation of thesecondary star amounts to at most a few percent of itsnormal photospheric output, even for the shortest orbitalperiods. Thus, there is every reason to assume that thesecondaries in low-m systems have the properties of main-sequence stars.
7.2. A “Magnetic Siphon” of the Stellar Wind
The diminutive sizes of the companions in low-m sys-tems coupled with evidence that the binaries have been inprotracted states of very weak accretion strongly suggestthat some or all of the systems have never achieved Roche-lobe contact - i.e., that they are pre-Polars. The absenceof detached magnetic white dwarf + M star binaries hasbeen a subject of recent discussion (Silvestri et al. 2005;Liebert et al. 2005), with the realization that selectioneffects must be playing a significant role. Identifying thelow-m magnetic binaries as the immediate precursors of atleast some Polars would solve part of the riddle, leavingopen the question of the whereabouts of long-period sys-tems that never experience the common-envelope phase of
15 The glaring exception is the ultrashort period system EF Eri, which has been in a protracted low state since 1997 (Wheatley & Ramsay1998) but this binary more appropriately belongs near the opposite end of the evolutionary spectrum from the systems discussed here (Harrisonet al. 2004).

8 SCHMIDT ET AL.
evolution. In this picture, LARPs, while most definitely“Polar”ized, are not CVs at all, but pre-CVs.
In a binary that has not yet evolved to the point ofRoche-lobe overflow, some portion of the secondary star’sstellar wind will always arrive at the surface of the whitedwarf16. For nonmagnetic primaries, the accreted fractionis very small, and the gravitational energy is an insignif-icant heating source spread over a large fraction of thewhite dwarf surface. However, a strongly magnetic pri-mary couples effectively to the magnetic field lines of thesecondary (Li et al. 1994), so plasma that would otherwisebe centrifugally driven to large distances ends up on thewhite dwarf. Moreover, Li et al. find that, above a criticalmagnetic field strength, this “magnetic siphon”17 is capa-ble of collecting the entire stellar wind from the secondary.Webbink & Wickramasinghe (2004) offer an analytic ar-gument based on energy densities that arrives at the sameconclusion. The critical field strength depends on orbitalperiod and geometry (Li et al. 1995), but appears to be inthe range 50 − 100 MG. Thus, at B ∼ 60 MG, it is quitepossible that the low-m systems discussed here representexamples where the magnetic siphon is essentially perfect.Ironically, the effects of the magnetic field are essentialboth in capturing the wind and in confining the resultingemission to a few very prominent features in the optical. Ifeither process were not active, the objects would not standout in optical AGN surveys, and thus would not be iso-lated for study. Selection effects in the SDSS are discussedat more length below.
It is important to note that, while stellar chromo-spheric/coronal activity and rotational spin-down are in-tensely studied effects of mass loss from late-type stars,thus far only upper limits (.10−10 M⊙ yr−1) have been es-tablished for the actual wind rates (e.g., Wargelin & Drake2001). The mass accretion rates inferred for low-m mag-netic accretion binaries may therefore prove to be the firsttrue measures of the amount of material carried away. Toapply the results to single stars, corrections will have tobe made for the facts that the binary examples present areduced gravitational barrier and are in forced rapid rota-tion, but even these adjustments will be unnecessary forevaluating recent suggestions that the long-held magneticbraking model for CV evolution may be much less effec-tive than previously thought (cf. Pinsonneault et al. 2002;Kolb 2002).
7.3. Thoughts on Evolution
The low-m systems offer interesting insight into the pos-sible evolutionary stages of a magnetic binary. We makethe standard assumption that a pre-CV emerges from thecommon envelope (CE) detached and with the degeneratecore in asynchronous rotation. Whether the orbital pe-riod of a post-CE binary is affected by the presence ofa magnetic field on the degenerate core is a matter ofsome debate (Liebert et al. 2005). However, assumingthat tidal forces on the secondary are sufficiently strong,the binary orbit will decay and the period decrease underthe relatively vigorous effects of magnetic braking via thesecondary star’s entrained wind (e.g., Verbunt & Zwaan1981). The next major event - synchronization of the
white dwarf spin and orbital periods, or the initiation ofaccretion by Roche-lobe overflow - depends on the primarystar magnetic field strength and secondary size: a modestmagnetic field paired with a comparatively massive sec-ondary will initiate Roche-lobe overflow first and appearat relatively long periods as an Intermediate Polar or otherdisk CV not yet recognized to be magnetic. In this case,a magnetic interaction between the stars may eventuallysynchronize the system at a shorter period and a Polar willensue. If, however, the field strength on the white dwarfis high and/or the secondary star small, the locked statusof the pre-Polars tells us that synchronization can occurprior to the onset of Roche-lobe overflow, at a period ofat least 4.4 hr for B = 60 MG. As the white dwarf spinand orbital periods approach a common value, and whilethe stellar wind can still couple to open field lines of thewhite dwarf, spin-down might be assisted by the coopera-tive magnetic braking mechanism originally suggested bySchmidt et al. (1986) but shown to be ineffective once asynchronized state is achieved (Li et al. 1994).
It is difficult to imagine a magnetic siphon operatingefficiently in a binary whose spin and orbital motions areuncoupled. Therefore, we take the onset of synchronism tobe accompanied by the disappearance of angular momen-tum loss by magnetic braking. The estimate of Webbink &Wickramasinghe (2004) that this might occur in binariesas large as a ∼ 10 R⊙ is probably optimistic, but it sug-gests the potential effectiveness of the process. The pre-Polar now enters a possibly protracted era of period evolu-tion governed solely by gravitational radiation and accret-ing by a magnetic siphon effect on the stellar wind. In-terestingly, nova eruptions may actually occur during thisphase, but the recurrence time would be exceedingly long(∼1 Gyr). Eventually, Roche-lobe contact is establishedin this already synchronized binary, and a Polar is formed.Our estimate of Teff ≤ 5, 500 K of SDSS J1324+0320 atP = 2.6 hr demonstrates that the total time elapsed be-tween the common envelope and Polar states can exceed 4Gyr. This, together with the existence of an IntermediatePolar stage for other systems, offers a ready explanationfor the propensity of Polars to exist at short orbital peri-ods.
8. discovery and census of pre-polars
The identification of 4 pre-Polars in the first ∼5000 deg2
surveyed by the SDSS suggests that an additional 1−2 willbe found before completion of the project and that ∼30would be cataloged if the entire sky were surveyed. FromTable 3, the effective sampling distance of such a surveymight be estimated at D ∼ 300 pc, i.e., similar to the vol-ume surveyed for X-ray bright (Polar) systems by ROSAT(Beuermann & Burwitz 1995), which discovered ∼80% ofthe 80 known Polars. Thus, at face value, the space den-sity of systems in the pre-Polar state might be expected tobe about half of that for currently accreting Polars. Theratio is similar to that implied by a comparison between4 pre-Polars and the 14 confirmed Polars that have beenfound in the portion of the sky sampled through SDSSDR4 (Szkody et al. 2005 and references therein).
16 This is the same stellar wind that is held accountable for the dominant angular momentum loss in long-period disk CVs.17 An apropos term coined by R. Webbink.
LOW ACCRETION-RATE BINARIES 9
However, questions of completeness must be raised.First, from the discussion in §7, the detectability of pre-Polars is expected to decline rapidly with increasing orbitalperiod. If magnetic energy density is the key criterion(e.g., Webbink & Wickramasinghe 2004), the r−3 declinein field strength of a dipole implies that the effectiveness ofthe magnetic siphon will scale as ∼P−4. At the other ex-treme, the probability of the secondary in a pre-Polar con-tacting its Roche surface increases as the period decreases,meaning that only pre-Polars with tiny secondaries (likeSDSS J1324+0320) will be found at very short periods,and those will be produced only after long episodes of slowevolution. The magnetic field on the white dwarf is alsoan important variable, since the weaker-field systems willtend to reach Roche contact prior to synchronizing, andan Intermediate Polar vs. pre-Polar will characterize thephase leading up to the synchronized state.
Second, selection effects within the surveys can be im-portant. The SDSS is aimed at being complete only forQSOs and galaxies (Stoughton et al. 2002). One fiber perspectroscopic plug-plate is dedicated to CVs and in prac-tice samples objects in the white dwarf + pair region ofthe color-color planes. Another category for standards isa source of hot white dwarfs. Nevertheless, objects thatfall in the QSO locus have the highest probability of beingtargeted because of the much larger number of fibers avail-able. In order to estimate the effects of these constraintson the completeness of a putative population of pre-Polars,we have computed the SDSS colors of a synthetic spectrumconsisting of a white dwarf, M star, and cyclotron emissionfor field strengths ranging from 0−200 MG. The measuredspectra of SDSS J1553+5516 and SDSS J1324+0320 wereused to form a cyclotron template with realistic harmonicintensities and intensity ratios, but the spacing and width(in A) of the harmonics were varied according to the as-sumed field. Broadband colors in the SDSS system werethen computed and run through the (complex) SDSS QSOtargeting algorithm (Richards et al. 2002) to determinewhich regimes in field strength would be most likely to re-sult in objects selected for fiber spectroscopy and lead torecognition as pre-Polars.
As an example, we have overplotted the results of oursimulation in the u − g, g − r plane in Figure 1, withpoints separated by equal intervals in log B and fiducialfield strengths (in MG) indicated by numbers adjacent tothe track. Remember that there are 3 other color-colorplanes involved in the targeting decisions not shown here.At comparatively weak magnetic fields, all of the low-n cy-clotron harmonics lie in the IR and the object is rejectedfrom spectroscopic targeting by the QSO algorithm as thewhite dwarf + M star pair that it is. At B = 30 MG, then = 4 harmonic enters the z photometric band and the ob-ject is briefly targeted as a high−z QSO. However, fromour previous discussion on the sensitivity to field strength,such a system might not achieve a synchronized/siphonedstate as a detached binary. As B continues to increase, theobject approaches the stellar locus and loses targeting un-til the QSO algorithm is once again triggered for virtuallythe entire interval 50 < B < 90 MG. This is the regionin which all four SDSS pre-Polars have been found. For90 < B . 200 MG, brief intervals exist where the binaryagain receives high- or low-z QSO targeting, but for the
most part it is rejected due to the proximity of the trackto white dwarfs and other excluded classes of stars. AboveB ∼ 400 MG (should such systems exist), the cyclotronfundamental shifts shortward of the u photometric band,and the object returns to obscurity as a white dwarf + Mpair. Note that the strongest magnetic field yet discoveredon a Polar is 230 MG on AR UMa (Schmidt et al. 1996).
Because SDSS J1324+0320 and SDSS J1553+5516 wereselected to form the spectral template, it is no accidentthat these two systems lie close to the simulation pathat approximately the correct field strength. However, thewide variety of spectra displayed by the examples makes itimpossible to accurately model the entire picture. For ex-ample, the dominant n = 4 harmonic in SDSS J0837+3830places it solidly within the low-z QSO domain of the u−g,g − r plane, and it was targeted as such. The singleweak harmonic around near 4500A in SDSS J2048+0050is not sufficient to move it far from the white dwarf +M star pairs. It was not targeted by the QSO algorithm,but rather as an F turnoff/subdwarf star candidate in theSEGUE extension aimed at studying the Milky Way.
It therefore appears possible that various physical andobservational biases could preferentially select SDSS pre-Polar systems with magnetic field strengths in a broadinterval around 60 MG. The fact that the field strengthat the dominant pole of each of the six binaries discoveredthus far, including the two from the Hamburg Schmidtsurvey, falls within just ±5% of a common value might bean artifact of small number statistics. However, we wouldexpect to discover systems with B ∼ 50 or 80 MG soon.If selection effects are as important as they appear to be,the total population of pre-Polars could be much largerthan was postulated at the beginning of this section. Con-ceivably, this could strain estimates of the space densityof magnetic CVs as derived from the census of Polars, butcareful attention must be paid to the several Gyr that anobject can hide as a detached magnetic binary with anorbit very slowly decaying by gravitational radiation.
The authors are grateful to P. Smith for assistance atthe telescope and to X. Fan and G. Richards for runningthe synthetic colors through the SDSS QSO targeting al-gorithm. Valuable discussions were enjoyed with L. Fer-rario, J. Liebert, and D. Wickramasinghe, and R. Web-bink offered key insights as well as a careful reading ofthe manuscript. Funding for the creation and distribu-tion of the SDSS Archive has been provided by the AlfredP. Sloan Foundation, the Participating Institutions, theNational Aeronautics and Space Administration, the Na-tional Science Foundation, the U.S. Department of Energy,the Japanese Monbukagakusho, and the Max Planck Soci-ety. The SDSS Web site is http://www.sdss.org/. TheSDSS is managed by the Astrophysical Research Con-sortium (ARC) for the Participating Institutions. TheParticipating Institutions are The University of Chicago,Fermilab, the Institute for Advanced Study, the JapanParticipation Group, The Johns Hopkins University, theKorean Scientist Group, Los Alamos National Labora-tory, the Max-Planck-Institute for Astronomy (MPIA),the Max-Planck-Institute for Astrophysics (MPA), NewMexico State University, University of Pittsburgh, Uni-versity of Portsmouth, Princeton University, the United

10 SCHMIDT ET AL.
States Naval Observatory, and the University of Wash-ington. Support is provided by the NSF for the studyof magnetic stars and stellar systems at the University of
Arizona through grant AST 03-06080, and for cataclysmicvariables at the University of Washington through AST02-05875.
REFERENCES
Abazajian, K., et al. 2005, AJ, 129, 1755Baraffe, I., Chabrier, G., Allard, F., & Hauschildt, P.H. 1998, A&A,
337, 403Baraffe, I., & Kolb, U. 2000, MNRAS, 318, 354Beers, T.C., Allende Preito, C., Wilhelm, R., Yanny, B., & Newberg,
H. 2004, PASA, 21, 207Bergeron, P., Wesemael, F., & Beauchamp, A. 1995, PASP, 107, 1047Beuermann, K., Baraffe, I., Kolb, U., & Weichold, M. 1998, A&A,
339, 518Beuermann, K., & Burwitz, V. 1995, in Cape Workshop on Magnetic
Cataclysmic Variables, ASP Conf. Ser., Vol. 85, ed. D.A.H.Buckley & B. Warner, (San Francisco: ASP), 99
Chanmugam, G., Barrett, P.E., Wu, K., & Courtney, M.W. 1989,ApJS, 71, 323
Cropper, M. 1988, MNRAS, 231, 597Fan, X. 1999, AJ, 117, 2528Ferrario, L., Wickramasinghe, D.T., & Schmidt, G. 2004, in The
Astrophysics of Cataclysmic Variables and Related Objects, ASPConf. Ser., Vol. 330, ed. J.M. Hameury & J.P. Lasota, (SanFrancisco: ASP), 411
Fischer, A., & Beuermann, K. 2001, A&A, 373, 211Fukugita, M., Ichikawa, T., Gunn, J.E., Doi, M., Shimasaku, K., &
Schneider, D.P. 1996, AJ, 111, 1748Gansicke, B.T., Hoard, D.W., Beuermann, K., Sion, E.M., & Szkody,
P. 1998, A&A, 338, 933Gansicke, B.T., Schmidt, G.D., Jordan, S., & Szkody, P. 2001, ApJ,
555, 380Garnavich, P.M., Szkody, P., Robb, R.M., Zurek, D.R., & Hoard,
D.W. 1994, ApJ, 435, L141Gunn, J.E., et al. 1998, AJ, 116, 3040Gunn, J.E., & Stryker, L.L. 1983, ApJS, 52, 121Harrison, T.E., Howell, S.B., Szkody, P.. Homeier, D., Johnson, J.J.,
& Osborne, H.L. 2004, ApJ, 614, 947Hawley, S., et al. 2002, AJ, 123, 3409Henry, T.J., Kirkpatrick, J.D., & Simons, D.A. 1994, AJ, 108, 1437Hessman, F.V., Gansicke, B.T., & Mattei, J.A. 2000, A&A, 361, 952Hogg, D.W., Finkbeiner, D.P., Schlegel, D.J., & Gunn, J.E. 2001,
AJ, 122, 2129Ivezic, Z., et al. 2004, AN, 325, 583Jacoby, G.H., Hunter, D.A., & Christian, C.A. 1984, ApJS, 56, 257Jordan, S., & Merani, N. 1995, in White Dwarfs, Proc. 9th European
Workshop on White Dwarfs, ed. D. Koester & K. Werner,(Heidelberg: Springer-Verlag), p. 135
Kirkpatrick, J.D., Henry, T.J., & McCarthy, D.W. 1991, ApJS, 77,417
Kolb, U. 2002, in The Physics of Cataclysmic Variables and RelatedObjects, ASP Conf. Ser., Vol. 261, ed. Gansicke, B.T., Beuermann,K., & Reinsch, K., (San Francisco: ASP), 180
Kuijpers, J., & Pringle, J.E. 1982, A&A, 114, L4Lamb, D.Q., & Masters, A.R. 1979, ApJ, 234, L117Li, J.K., Wickramasinghe, D.T., & Wu, K.W. 1995, MNRAS, 276,
255Li, J.K., Wu, K.W., & Wickramasinghe, D.T. 1994, MNRAS, 268,
61Liebert, J., Wickramasinghe, D.T., Schmidt, G.D., Silvestri, N.M.,
Hawley, S.L., Szkody, P., Ferrario, L., Webbink, R.F., Oswalt,T.D., Smith, J. Allyn, & Lemagie, M.P. 2005, AJ, 129, 2376
Lupton, R.H., Gunn, J.E., Szalay, A.S. 1999, AJ, 118, 1406Lupton, R.H., Gunn, J.E., Ivezic, Z., Knapp, G.R., Kent, S.M.,
& Yasuda, N. 2001, in Astronomical Data Analysis Software &Systems X, ASP Conf. Ser., Vol. 238, ed F.R. Harnden, Jr., F.A.Primini, & H.E. Payne, (San Francisco: ASP), 269
Massey, P., Strobel, K., Barnes, J.V., & Anderson, E. 1988, ApJ,328, 315
Mauche, C. 1999, in Annapolis Workshop on Magnetic CataclysmicVariables, ASP Conf. Ser., Vol. 157, ed. C. Hellier & K. Mukai,(San Francisco: ASP), 157
Meggitt, S.M.A., & Wickramasinghe, D.T. 1982, MNRAS, 198, 71Merani, N., Main, J., & Wunner, G. 1995, A&A, 298, 193Pier, J.R., Munn, J.A., Hindsley, R.B., Hennessy, G.S., Kent, S.M.,
Lupton, R.H., & Ivezic, Z. 2003, AJ, 125, 1559Andronov, N., Pinsonneault, M.H., & Sills, A. 2003, ApJ, 582, 358Ramsay, G., Cropper, M., Wu, K., Mason, K.O., Cordova, F.A., &
Priedhorsky, W. 2004, MNRAS, 350, 1373Reimers, D., & Hagen, H.-J. 2000, A&A, 358, L45Reimers, D., Hagen, H.-J., & Hopp, U. 1999, A&A, 343, 157Richards, G.T., et al. 2002, AJ, 123, 2945Ritter H., & Kolb U. 2003, A&A, 404, 301Rousseau, Th., Fischer, A., Beuermann, K., & Woelk, U. 1996, A&A,
310, 526Schmidt, G. 2004, in The Astrophysics of Cataclysmic Variables and
Related Objects, ASP Conf. Ser., Vol. 330, ed. J.M. Hameury &J.P. Lasota, (San Francisco: ASP), 125
Schmidt, G.D., Stockman, H.S., & Grandi, S.A. 1986, ApJ, 300, 804Schmidt, G.D., Stockman, H.S., & Smith, P.S. 1992, ApJ, 398, L57Schmidt, G.D., Szkody, P., Smith, P.S., Silber, A., Tovmassian, G.,
Hoard, D.W., Gansicke, B.T., & de Martino, D. 1996, ApJ, 473,483
Schmidt, G.D., West, S.C., Liebert, J., Green, R.F., & Stockman,H.S. 1986, ApJ, 309, 218
Schwarz, R., Schwope, A.D., & Staude, A. 2001, A&A, 374, 189Schwope, A.D., Brunner, H., Hambaryan, V., Schwarz, R., Staude,
A., Szokoly, G., & Hagen, H.-J. 2002, in The Physics ofCataclysmic Variables and Related Objects, ASP Conf. Ser., Vol.261, ed. Gansicke, B.T., Beuermann, K., & Reinsch, K., (SanFrancisco: ASP), 102
Silvestri, N.M., Lemagie, M.P., Hawley, S.L., Schmidt, G.D., Szkody,P., Liebert, J., & Wolfe, M.A. 2005, AJ, in preparation
Sion, E.M. 1999, PASP, 111, 532Smith, J.A., et al. 2002, AJ, 123, 2121Stoughton, C., et al. 2002, AJ, 123, 485Szkody, P., et al. 2003, ApJ, 583, 902 (S03)Szkody, P., et al. 2005, AJ, 129, 2386Szkody, P., Homer, L., Chen, B., Henden, A., Schmidt, G., Anderson,
S., Hoard, D., Voges, W., & Brinkmann, J. 2004, AJ, 128, 2443(S04)
Townsley, D.M., & Bildsten, L. 2002, in The Physics of CataclysmicVariables and Related Objects, ASP Conf. Ser., Vol. 261, ed.Gansicke, B.T., Beuermann, K., & Reinsch, K., (San Francisco:ASP), 31
.2004, ApJ, 600, 390Vennes, S., Szkody, P., Sion, E.M., & Long, K.S. 1995, ApJ, 445, 921Verbunt, F., & Zwaan, C. 1981, A&A, 100, L7Wargelin, B.J., & Drake, J.J. 2001, ApJ, 546, L57Warner, B. 1995, Cataclysmic Variable Stars (Cambridge:
Cambridge Univ. Press)Webbink, R.F., & Wickramasinghe, D.T. 2004, in The Astrophysics
of Cataclysmic Variables and Related Objects, ASP Conf. Ser.,Vol. 330, ed. J.M. Hameury & J.P. Lasota, (San Francisco: ASP),137
Webbink, R.F., & Wickramasinghe, D.T. 2002, MNRAS, 335, 1Wheatley, P.J., & Ramsay, G. 1998, in ASP Conf. Ser., Vol. 137,
Wild Stars in the Old West, ed. S. Howell, E. Kuulkers, & C.Woodward (San Francisco: ASP), 446
Wickramasinghe, D.T., & Ferrario, L. 2000, PASP, 112, 873Woelk, U., & Beuermann, K. 1992, A&A, 256, 498
.1996, A&A, 306, 232York, D.G., et al. 2000, AJ, 120, 1579

LOW ACCRETION-RATE BINARIES 11
Table 1
LOG OF OBSERVATIONS
Object UT Date Telescope Type Duration Comments(SDSS+) (yyyymmdd) (h:mm)
J083751.00+383012.5 20020212 SDSS 2.5 m Spectroscopy 0:4520040424 MMT Cir. spectropol. 1:1320040513 MMT Cir. spectropol. 1:2720040921 MMT Cir. spectropol. 0:3520041130 MDM 2.4 m CCD imaging 2:56 poor seeing20041201 MDM 2.4 m CCD imaging 4:44 poor seeing20050316 Bok 2.3 m Cir. spectropol. 0:30
J132411.57+032050.5 20030529 MMT Cir. spectropol. 2:2820040216 MMT Cir. spectropol. 2:59
J155331.12+551614.5 20020318 Bok 2.3 m Cir. spectropol. 3:27 clouds at end20020508 Bok 2.3 m Cir. spectropol. 4:1620040216 MMT Cir. spectropol. 0:18
J204827.91+005008.9 20040824 SDSS 2.5 m Spectroscopy 1:3320040916 Bok 2.3 m Cir. spectropol. 1:12 cirrus20041004 APO 3.5 m Spectroscopy 4:18
Table 2
SDSS PHOTOMETRY
Object g u − g g − r r − i i − z
SDSS J083751.00+383012.5 19.14 +0.01 +0.03 +0.49 +0.70SDSS J204827.91+005008.9 19.38 +0.56 +0.70 +1.08 +0.68
Table 3
LOW ACCRETION-RATE MAGNETIC BINARIES
Object Period Mag.a Bb M D Sp. Type Ref.(h) (MG) (M⊙ yr−1) (pc) (secondary)
SDSS J1324+0320 2.60 22.1 64 ∼1 × 10⁻¹³ 450 M6 5,6,7WX LMi (HS 1023+3900) 2.78 18.0 60(68) <3 × 10⁻¹³ 140 M4.5 1,3,4SDSS J0837+3830 3.18 or 3.65 19.1 65(??) ∼2 × 10⁻¹³ 330 M5 7HS 0922+1333 4.07 19 66(81:) ∼3 × 10⁻¹³ 190 M3.5 2,4SDSS J2048+0050 4.2 19.7 62: ∼5 × 10⁻¹⁴ 260 M3 7SDSS J1553+5516 4.39 18.5 60 6 × 10⁻¹⁴ 130 M5 5,6,7
ag for SDSS objects; B for HS objects.
bParentheses denote secondary pole.
References. — (1) Reimers et al. (1999); (2) Reimers & Hagen (2000); (3) Schwarz et al. (2001);(4) Schwope et al. (2002); (5) Szkody et al. (2003); (6) Szkody et al. (2004); (7) This paper.
12 SCHMIDT ET AL.
Fig. 1.— Locations of the four SDSS low-m magnetic accretion binaries in the u − g, g − r color-color plane. Also shown are diskstars (crosses), white dwarfs (stars), and QSOs (circles), taken from the North Galactic Pole SDSS color simulations of Fan (1999). Theapproximate location of white dwarf + M star pairs is indicated, but the QSO targeting algorithm actually defines this excluded regionaccording to g − r, r − i colors. Only objects with g < 21 are shown, and measured color bands differ slightly from those used in the Fansimulations, but the data suffice for illustrative purposes. The serpentine path depicts the track of a model low-m magnetic system with fieldstrength varying from 0 − 200 MG, as marked and discussed in §8.
LOW ACCRETION-RATE BINARIES 13
Fig. 2.— (Top and middle, bold): Observed SDSS spectra of the two new magnetic accretion binaries. Each exhibits a clear hump inthe blue that is found to be strongly polarized, plus an M-star continuum at longer wavelengths. Spectra are displaced upward for clarity,with the zero-point of the flux scale indicated at right. (Narrow): Spectra after subtraction of the best-fitting late-type main-sequence star.See text for details. (Bottom, bold): The spectrum of SDSS J0928+5707 appears qualitatively similar to those in the upper panels, but it isunpolarized. (Narrow): Subtraction of an M3 V spectrum reveals that the object is a superposition with a QSO at z = 1.67. Comparison ofthe observed spectra of SDSS J0837+3830 and SDSS J2048+0050 with the examples from Szkody et al. (2003) attest to the wide range inspectral properties displayed by the class.

14 SCHMIDT ET AL.
Fig. 3.— Two consecutive nights of CCD photometry of SDSS J0837+3830 phased on a period of 3.18 hr. The least-squares fit sine wavesemiamplitude is 0.06 mag. Scatter is attributable to poor seeing during the observations.

LOW ACCRETION-RATE BINARIES 15
Fig. 4.— Spectral flux (left) and circular polarization (right) for SDSS J0837+3830 on 2004 May 13. Sequences cover 1.23 hr, or nearly40% of the orbital period, with the mid-UT of each spectrum indicated in the right panel. The only convincing change through the seriesis a decrease in the emission-line strength, likely due to our varying view of the inner hemisphere of the secondary star. Note the distortedappearance in polarization of the harmonic at 6200A and the weak positive circular polarization between harmonics, indicating that accretionoccurs onto both magnetic poles.

16 SCHMIDT ET AL.
Fig. 5.— Emission-line velocities and Hα flux (in units of 10−16 erg cm−2 s−1) for SDSS J2048+0050, phased on a period of 4.2 hr, withϕ = 0 defined by the positive zero-crossing of radial velocity.
LOW ACCRETION-RATE BINARIES 17
Fig. 6.— Spectral flux (bottom) and circular polarization (top) for SDSS J2048+0050 on 2004 Sep. 16. In addition to the strongly-polarizedcyclotron hump around λ4550, a very weak harmonic may be present near 6200A. This would indicate a magnetic field strength of ∼62 MG.The data represent slightly more than 1 hr of exposure, or about one-quarter of the period. The measured polarization in the 4550A harmonic,coupled with the strength of the hump in total flux, implies that the cyclotron emission in this feature is essentially 100% circularly polarized.

18 SCHMIDT ET AL.
Fig. 7.— Spectrum of circularly polarized flux, −v × Fλ (left), and total flux Fλ (right), vs. UT as marked, covering a full 2.6 hr cycle ofSDSS J1324+0320 on 2004 Feb. 16. The total flux spectrum is shown after the subtraction of an M6 V stellar template, the spectral typejudged to best match the observed stellar features. Note that the polarized flux has been negated to facilitate comparison with the total fluxspectrum.

LOW ACCRETION-RATE BINARIES 19
Fig. 8.— Radial velocity (top) and flux (bottom) of the weak, narrow Hα emission line of SDSS J1324+0320 vs. UT from the data of Figure7. The best-fit period (shown) has a value of 2.62 ± 0.24 hr. Note that the minimum Hα flux and positive zero-crossing of radial velocitycoincide with the peak in flux of the n = 3 cyclotron harmonic in Figure 6, indicating that the spin and orbital periods are essentially lockedand that the emission line arises on the inner hemisphere of the secondary star.

20 SCHMIDT ET AL.
Fig. 9.— Spectrum of circularly polarized flux, v ×Fλ (left), and total flux Fλ (right), vs. UT as marked, covering nearly a complete cycleof SDSS J1553+5516 on 2002 May 8. Scaling of the ordinate differs by a factor 2 between the two panels, as indicated.
LOW ACCRETION-RATE BINARIES 21
Fig. 10.— Radial velocity of the Hα emission line (circles) and 7050A TiO bandhead (crosses) of SDSS J1553+5516 vs. UT from thedata of Figure 9. The common phasing and semiamplitude (250 km s−1) of the two features confirm that the emission lines originate on thesecondary star.

22 SCHMIDT ET AL.
Fig. 11.— Secondary-subtracted survey spectra of the four SDSS low-m systems (bold), with the energy distributions of white dwarfphotospheres plotted below (narrow), where the stellar temperatures have been computed according to the measured spectral flux betweencyclotron harmonics in the 5000 − 5600A interval. The implied white dwarfs are unusually cool for accretion binaries, with Teff ranging from5,500 K for SDSS—J1324+0320 to 9,500 K for SDSS J0837+3830. Note, however, that the stellar continuum falls short of the observed fluxnear 4000A in at least SDSS J1553+5516 and SDSS J2048+0050, suggesting the presence of an irradiated hot spot surrounding the pole(s).
LOW ACCRETION-RATE BINARIES 23
APPENDIX
distance estimation from new calibrated m dwarf spectra
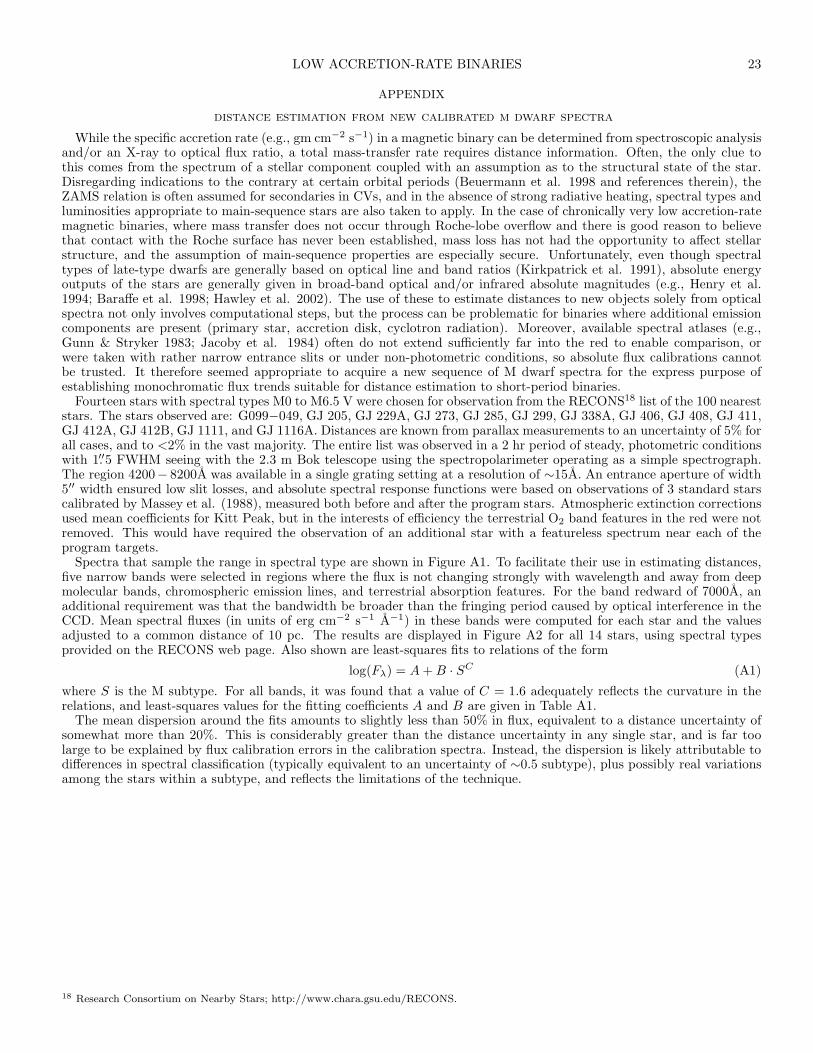
While the specific accretion rate (e.g., gm cm−2 s−1) in a magnetic binary can be determined from spectroscopic analysisand/or an X-ray to optical flux ratio, a total mass-transfer rate requires distance information. Often, the only clue tothis comes from the spectrum of a stellar component coupled with an assumption as to the structural state of the star.Disregarding indications to the contrary at certain orbital periods (Beuermann et al. 1998 and references therein), theZAMS relation is often assumed for secondaries in CVs, and in the absence of strong radiative heating, spectral types andluminosities appropriate to main-sequence stars are also taken to apply. In the case of chronically very low accretion-ratemagnetic binaries, where mass transfer does not occur through Roche-lobe overflow and there is good reason to believethat contact with the Roche surface has never been established, mass loss has not had the opportunity to affect stellarstructure, and the assumption of main-sequence properties are especially secure. Unfortunately, even though spectraltypes of late-type dwarfs are generally based on optical line and band ratios (Kirkpatrick et al. 1991), absolute energyoutputs of the stars are generally given in broad-band optical and/or infrared absolute magnitudes (e.g., Henry et al.1994; Baraffe et al. 1998; Hawley et al. 2002). The use of these to estimate distances to new objects solely from opticalspectra not only involves computational steps, but the process can be problematic for binaries where additional emissioncomponents are present (primary star, accretion disk, cyclotron radiation). Moreover, available spectral atlases (e.g.,Gunn & Stryker 1983; Jacoby et al. 1984) often do not extend sufficiently far into the red to enable comparison, orwere taken with rather narrow entrance slits or under non-photometric conditions, so absolute flux calibrations cannotbe trusted. It therefore seemed appropriate to acquire a new sequence of M dwarf spectra for the express purpose ofestablishing monochromatic flux trends suitable for distance estimation to short-period binaries.
Fourteen stars with spectral types M0 to M6.5 V were chosen for observation from the RECONS18 list of the 100 neareststars. The stars observed are: G099−049, GJ 205, GJ 229A, GJ 273, GJ 285, GJ 299, GJ 338A, GJ 406, GJ 408, GJ 411,GJ 412A, GJ 412B, GJ 1111, and GJ 1116A. Distances are known from parallax measurements to an uncertainty of 5% forall cases, and to <2% in the vast majority. The entire list was observed in a 2 hr period of steady, photometric conditionswith 1.′′5 FWHM seeing with the 2.3 m Bok telescope using the spectropolarimeter operating as a simple spectrograph.The region 4200− 8200A was available in a single grating setting at a resolution of ∼15A. An entrance aperture of width5′′ width ensured low slit losses, and absolute spectral response functions were based on observations of 3 standard starscalibrated by Massey et al. (1988), measured both before and after the program stars. Atmospheric extinction correctionsused mean coefficients for Kitt Peak, but in the interests of efficiency the terrestrial O2 band features in the red were notremoved. This would have required the observation of an additional star with a featureless spectrum near each of theprogram targets.
Spectra that sample the range in spectral type are shown in Figure A1. To facilitate their use in estimating distances,five narrow bands were selected in regions where the flux is not changing strongly with wavelength and away from deepmolecular bands, chromospheric emission lines, and terrestrial absorption features. For the band redward of 7000A, anadditional requirement was that the bandwidth be broader than the fringing period caused by optical interference in theCCD. Mean spectral fluxes (in units of erg cm−2 s−1 A−1) in these bands were computed for each star and the valuesadjusted to a common distance of 10 pc. The results are displayed in Figure A2 for all 14 stars, using spectral typesprovided on the RECONS web page. Also shown are least-squares fits to relations of the form
log(Fλ) = A + B · SC (A1)
where S is the M subtype. For all bands, it was found that a value of C = 1.6 adequately reflects the curvature in therelations, and least-squares values for the fitting coefficients A and B are given in Table A1.
The mean dispersion around the fits amounts to slightly less than 50% in flux, equivalent to a distance uncertainty ofsomewhat more than 20%. This is considerably greater than the distance uncertainty in any single star, and is far toolarge to be explained by flux calibration errors in the calibration spectra. Instead, the dispersion is likely attributable todifferences in spectral classification (typically equivalent to an uncertainty of ∼0.5 subtype), plus possibly real variationsamong the stars within a subtype, and reflects the limitations of the technique.
18 Research Consortium on Nearby Stars; http://www.chara.gsu.edu/RECONS.

24 SCHMIDT ET AL.
Table A1
FITTING COEFFICIENTS
FOR MONOCHROMATICFLUX RELATIONS
Band Aa Ba
4700 − 4740 −12.23 −0.1795100 − 5150 −12.29 −0.1656100 − 6140 −11.97 −0.1746760 − 6840 −12.04 −0.1597450 − 7500 −11.85 −0.122
aFλ in units of erg cm−2 s−1
A−1, for a distance of 10 pc.
Fig. A1.— Sample M dwarf spectra obtained with a resolution of ∼15A to calibrate monochromatic absolute flux-spectral type relations.Narrow bands defined for the analysis are marked.

LOW ACCRETION-RATE BINARIES 25
Fig. A2.— Dependence of spectral flux in the narrow bands of Figure A1 - adjusted to a common distance of 10 pc - on M subtype, witha displacement of 2 dex between successive relations. Equations describing the fits are provided in the text.