arXiv:astro-ph/0502258 v1 14 Feb 2005
26
arXiv:astro-ph/0502258 v1 14 Feb 2005 From Young and Hot to Old and Cold: Comparing White Dwarf Cooling Theory to Main Sequence Stellar Evolution in Open Clusters Ted von Hippel The University of Texas at Austin, Department of Astronomy, 1 University Station C1400, Austin, TX 78712-0259, email: [email protected] ABSTRACT I explore the current ability of both white dwarf cooling theory and main sequence stellar evolution theory to accurately determine stellar population ages by comparing ages derived using both techniques for open clusters ranging from 0.1 to 4 Gyr. I find good agreement between white dwarf and main sequence evolutionary ages over the entire age range currently available for study. I also find that directly comparing main sequence turn-off ages to white dwarf ages is only weakly sensitive to realistic levels of errors in cluster distance, metallicity, and reddening. Additional detailed comparisons between white dwarf and main sequence ages have tremendous potential to refine and calibrate both of these important clocks, and I present new simulations of promising open cluster targets. The most demanding requirement for these white dwarf studies are very deep (V ≥ 25–28) cluster observations made necessary by the faintness of the oldest white dwarfs. Subject headings: open clusters and associations: general — stars: evolution — white dwarfs 1. Introduction White dwarf cooling theory currently provides the most reliable age for the Galactic disk (Winget et al. 1987; Oswalt et al. 1996; Leggett, Ruiz, & Bergeron 1998; Knox, Hawkins, & Hambly 1999), whereas main sequence stellar evolution provides the most reliable age for the Galactic halo (e.g., Salaris & Weiss 2002; Krauss & Chaboyer 2003). In order to understand the detailed sequence of formation of the Galactic disk and halo, as well as the thick disk, bulge, and local satellite galaxies, these two time scales need to be placed on the same absolute age system. The only current empirical approach available to inter-calibrate
Transcript of arXiv:astro-ph/0502258 v1 14 Feb 2005

arX
iv:a
stro
-ph/
0502
258
v1
14 F
eb 2
005
From Young and Hot to Old and Cold: Comparing White Dwarf
Cooling Theory to Main Sequence Stellar Evolution in Open
Clusters
Ted von Hippel
The University of Texas at Austin, Department of Astronomy, 1 University Station C1400,
Austin, TX 78712-0259, email: [email protected]
ABSTRACT
I explore the current ability of both white dwarf cooling theory and main
sequence stellar evolution theory to accurately determine stellar population ages
by comparing ages derived using both techniques for open clusters ranging from
0.1 to 4 Gyr. I find good agreement between white dwarf and main sequence
evolutionary ages over the entire age range currently available for study. I also
find that directly comparing main sequence turn-off ages to white dwarf ages is
only weakly sensitive to realistic levels of errors in cluster distance, metallicity,
and reddening. Additional detailed comparisons between white dwarf and main
sequence ages have tremendous potential to refine and calibrate both of these
important clocks, and I present new simulations of promising open cluster targets.
The most demanding requirement for these white dwarf studies are very deep
(V ≥ 25–28) cluster observations made necessary by the faintness of the oldest
white dwarfs.
Subject headings: open clusters and associations: general — stars: evolution —
white dwarfs
1. Introduction
White dwarf cooling theory currently provides the most reliable age for the Galactic disk
(Winget et al. 1987; Oswalt et al. 1996; Leggett, Ruiz, & Bergeron 1998; Knox, Hawkins,
& Hambly 1999), whereas main sequence stellar evolution provides the most reliable age
for the Galactic halo (e.g., Salaris & Weiss 2002; Krauss & Chaboyer 2003). In order to
understand the detailed sequence of formation of the Galactic disk and halo, as well as the
thick disk, bulge, and local satellite galaxies, these two time scales need to be placed on the
same absolute age system. The only current empirical approach available to inter-calibrate

– 2 –
these two age systems is to derive white dwarf (WD) cooling ages and main sequence turn-
off (MSTO) ages for a number of single-age stellar populations over a wide range of ages.
Since old WDs are faint (MV > 16), a further constraint is that the stellar population is
within a few kiloparsecs, or the target objects become too faint (V ≥ 30) to observe. In
addition, each stellar population should have a single heavy element abundance, yet the
total sample of stellar populations should cover a range of heavy element abundances, so
that detailed studies can search for any metallicity effects on age potentially missing from
either theory. Many of the most well-known open clusters fit these needs for nearby, single-
age, single-metallicity stellar populations well, and furthermore a sample of some of the most
favorable open clusters cover a wide range of ages and a substantial range of heavy element
abundances. Globular clusters can be used to extend such a study to even greater ages
and lower metallicities, though at present only a few globular clusters are near enough for
observations to be performed to the limit of their coolest WDs.
The first studies to explicitly compare WD cooling and MSTO ages for star clusters were
those of Claver (1995) and von Hippel, Gilmore, & Jones (1995). These studies demonstrated
that the WD sequence of a cluster shows a low-luminosity terminus that is determined by the
cooling age of the WD population and its comparatively short pre-WD evolution. Subsequent
studies (Richer et al. 1998; von Hippel & Gilmore 2000; von Hippel 2001; Claver et al. 2001)
have shown that for open clusters, WD cosmochronology and main sequence stellar evolution
give similar cluster ages. WD age studies have now been extended to one globular cluster
(NGC 6121 = M4) where a WD age has been derived (Hansen et al. 2002), disputed (De
Marchi et al. 2003), and defended (Richer et al. 2004). Regardless of the observational
reliability of the M4 study, WD cooling models are not yet at the point where they can
give reliable values for the great ages of globular clusters (Hansen & Liebert 2003), due to
uncertainties in the theory of cool WDs. The pay-off of an independent, accurate, and precise
age determination for globular clusters via the WD cooling technique is enormous, however,
and so its calibration is of fundamental importance. Such an independent age determination
would either support or contradict ages derived from main sequence stellar evolution and
should allow a more precise comparison between the age of the Galaxy and the now precise,
if model-dependent, age for the Universe from WMAP observations (Bennett et al. 2003).
Additionally, with the Advanced Camera for Surveys (ACS) in the Hubble Space Tele-
scope (HST), it is easy to reach the terminus of the white dwarf sequence in a number of open
clusters and possible to reach the terminus in a few of the nearest globular clusters. Cluster
observations of sufficient depth, V > 26, are often not possible with the current generation
of 8-10m telescopes, however, not only because of the low flux levels, but also because of
the many contaminating, compact background galaxies with the approximate colors of cool
white dwarfs. For those clusters where the faintest WDs are brighter than the limit of 8-10m
– 3 –
observing capabilities, it may be possible with proper motions derived from second epoch
observations obtained some years later, to remove the contaminating background galaxies.
Next generation 20- to 30-meter ground-based telescopes should also be able to make these
very deep observations, especially once their adaptive optics systems are pushed blueward
into the I-band, where contaminating faint background galaxies can be spatially resolved.
These current and forthcoming instrumental capabilities, along with recent improvements in
both stellar evolution and WD cooling theory, justify a renewed look at the current state-
of-the art in both theories and an examination of which clusters would be best suited to the
improved techniques and instrumentation.
2. White Dwarf Versus Main Sequence Ages in Open Clusters
How do the ages derived by main sequence stellar evolution and WD cooling ages com-
pare in open clusters? Table 1 presents a list of open clusters for which a WD (cooling plus
precursor) age has been derived, along with recent age determinations from main sequence
stellar evolution studies. In choosing which MSTO ages to incorporate, I have used those
studies that relied on models with core convective overshoot as past studies of NGC 2420
(von Hippel & Gilmore 2000) and M 37 (Kalirai et al. 2001) have found a better match
between core convective MSTO ages and WD ages for these clusters. I do not include the
new WD cooling results for M4 in Table 1 due to the current extrapolation in WD theory
necessary to date this cluster. The first column lists the cluster name, the second column
lists the derived WD age and ±1σ age errors, the third column lists the main sequence turn-
off age and ±1σ age range from one or more recent studies, and the fourth column points
to a reference list for the WD and MSTO ages. Prior discussions of the comparison of WD
and MSTO ages in open clusters can be found in von Hippel (2001) and Hansen (2004).
To graphically present the main results of Table 1, Figure 1 presents MSTO versus WD
ages for these clusters. The WD age for the Hyades is a lower limit since 50 to 90% of the
Hyades has likely evaporated (Weidemann et al. 1992), possibly taking with it some of the
oldest WDs. (Strictly speaking, cluster WD ages, unlike field star white dwarf ages, always
provide a lower age limit since the oldest WDs could be missing due to partial cluster evap-
oration.) The WD age for the oldest cluster plotted here, M 67, is based on a statistically
measured WD luminosity function for the cluster after subtraction of a comparison field
(Richer et al. 1998). For this cluster, candidate cluster WDs have not yet been spectro-
scopically confirmed, and therefore the WD versus MSTO comparison at this age is not yet
firmly established. Figure 1 demonstrates that there is a good overall agreement between
cluster ages derived via the two different techniques. Assuming one uses modern overshoot
– 4 –
ages, the WD and MSTO ages agree for six open clusters within their age errors, and the
remaining cluster (the Hyades) is consistent with this age agreement. Stellar evolution and
white dwarf cooling provide consistent ages over the broad age range that we can currently
test, 0.1 to at least 2 Gyr and probably to 4 Gyr.
To further study the utility of Figure 1, I calculated the effects of typical observational
errors in this diagram. I considered three types of observational error. For the first type
of error, I over-estimate the distance by 0.2 mag, due for example to a combination of
photometric calibration errors and errors in deriving the main sequence fitting distance. For
the second type of error, I over-estimate the metallicity by 0.2 dex. For the third type of
error, I also over-estimate the metallicity by 0.2 dex, but now I also adjust the reddening
to compensate for the color change in the main sequence turn-off caused by the metallicity
error. One or more of these three types of error are present in just about any study of open
or globular clusters, and the values have been set to be in the range of typical to somewhat
conservative. To convert these assumed errors into an age error I use the cluster models
outlined in the next section.
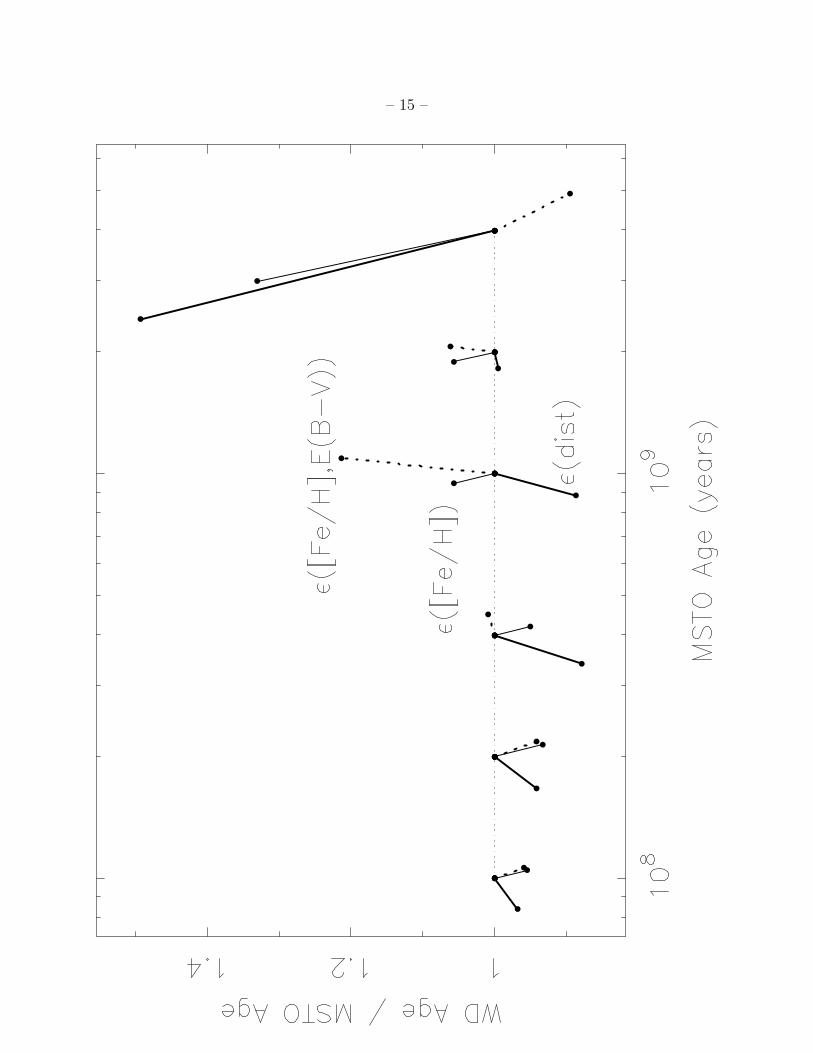
Figure 2 presents the effect of these three types of error on the derived MSTO age versus
the ratio of the WD-to-MSTO age over the range of 100 Myr to 4 Gyr. The thick lines show
the effect of over-estimating distances by 0.2 mag, which forces the cluster MSTO and WD
ages to be under-estimated since both turn-off stars and WDs are then assumed to be brighter
than they actually are. The thin lines show the effect of over-estimating metallicity by 0.2
dex, in which case overly red isochrones are force-fit to the turn-off stars and the MSTO
ages change. In the cluster models there is no significant change in the WD ages with this
small metallicity change, as metallicity is assumed to enter only through the slightly-modified
ages of the high mass precursors to the oldest WDs, and this latter effect is included. The
dotted lines show the effect of over-estimating metallicity by 0.2 dex, then compensating by
under-estimating reddening to keep the cluster turn-off at the same color. This type of error
affects the WD ages since a change in reddening changes the apparent magnitude of the WD
terminus. Of course, for some real clusters with low reddening, it is not possible to lower the
reddening enough to match some erroneous metallicity determinations, and in these cases
there are additional limitations on errors in this third category. It is comforting to see that
the net effect of realistic errors on the WD and MSTO ages are small, typically changing
the ratio of ages by ∼10% through much of this age range, though reaching a maximum for
distance errors amounting to ∼50% at 4 Gyr. The derived absolute MSTO ages change by
< 25%, except at 4 Gyr where the effect of an overestimated distance by 0.2 mag lowers the
implied MSTO age by 40% to ∼2.4 Gyr. In this case the implied WD age drops by 10% to
∼3.6 Gyr.

– 5 –
Figure 2 also shows interesting responses to these sources of error for clusters as a
function of age. While over-estimating distances always causes an under-estimate in both
the MSTO and WD ages, the ratio of these two under-estimated ages changes around 2
Gyr. For younger clusters, the sensitivity of the location of the WD terminus to age is
slightly greater (up to 10%) than the sensitivity of the location of the MSTO to age, and
thus the WD approach under-estimates age to a slightly greater degree than the MSTO
approach. At 2 Gyr, both the MSTO and WD age techniques are equally sensitive to direct
displacements in luminosity, and at 4 Gyr the MSTO age is the more sensitive technique, and
thus under-estimates age to a greater degree than the WD technique. The change in relative
sensitivity of the two techniques to metallicity errors near 1 Gyr is predominantly due to the
effect of metallicity changes on the MSTO, since the WD technique is largely insensitive to
metallicity errors. The dominant effect is that the MSTO becomes fainter if metallicity is
over-estimated for clusters between 0.1 and 0.4 Gyr, whereas the MSTO becomes brighter for
clusters between 1 and 4 Gyr, at least for our input stellar models (Girardi et al. 2000) near
solar metallicity. The final type of error, with combined and offsetting errors in metallicity
and reddening, is somewhat more complicated. For the youngest clusters and our input
models, a change in metallicity causes only a small color change, and therefore induces only
a small error in reddening. The color change increases rapidly as age increases to 1 Gyr,
reaching a maximum color difference of B − V ≈ 0.08 mag for a change in metallicity of
0.2 dex, then decreases slowly as age increases to 4 Gyr. The basic effect is that the MSTO
ages are over-estimated with this particular coupling of errors (over-estimating metallicity
by 0.2 dex, then compensating by under-estimating reddening), since the under-estimated
reddening forces one to compensate and assume the MSTO is fainter than it really is. The
effect on the implied WD ages from this type of error is determined by the size of the
reddening error and the sensitivity of the WD technique to shifts in luminosity as a function
of age. For young clusters the effect is small since the under-estimated reddening is small.
As the offsetting error in reddening increases, its effect on the WD ages becomes significant.
In Figure 3, I again present the three categories of error studied in Figure 2, now in the
same observational plane of Figure 1. In this diagram of direct age comparison, it is clear
that the effects of typical errors are to move the derived ages largely along the one-to-one
correspondence line. This is both good news and bad news for comparing WD and MSTO
ages in clusters. The bad news is that independent ages via the two techniques offer little
leverage on the other cluster parameters of distance, metallicity, and reddening. The good
news is that the relative ages of the clusters change little with these types of errors, especially
for clusters younger than 2 Gyr, and so comparing these two ages remains a powerful way
of checking on the consistency between main sequence evolutionary theory and white dwarf
cooling theory. At 4 Gyrs the departure from the correspondence line is greater for a distance

– 6 –
error of 0.2 mag, but fortunately the cluster in that position in Figure 1, M 67, is one of
the best studied old open clusters, and its distance uncertainty is likely to be substantially
less (Sarajedini et al. 2004, and references therein). Figure 3 also demonstrates at least part
of the reason why the clusters in Figure 1 agree so well in their MSTO and WD ages - this
diagram, at least in this age range, is insensitive to reasonable errors in cluster distance,
metallicity, or reddening.
While the agreement between MSTO and WD ages should give us confidence in both
methods of age dating stellar populations with ages of ≤ 4 Gyr, we need to remain cautious
when interpreting and comparing ages for older populations such as the Galactic disk and
halo. It is also important to increase the precision of age dating clusters younger than 4
Gyr, as increased precision could help tease out subtle effects that may not be correctly
modeled in white dwarf or main sequence stellar evolution. Such effects could include the
degree of core overshooting and its metallicity dependence as well as the transition from
the CNO bi-cycle to PP burning in main sequence stars, or for white dwarfs, mass loss on
the asymptotic giant branch and the initial-final mass relation, envelope effects and dredge-
up, and carbon-oxygen phase separation during crystallization. Future observations and
analyses of more star clusters over a broad age range are therefore needed to increase age
dating precision, refine current WD and main sequence theory, and to improve the analyses
of ages for older stellar populations, particularly those older than 4 Gyr. Additionally, age
studies for clusters nominally at the same age, but with different metallicities, are needed to
test the dependence of both WD cooling theory and main sequence theory on heavy element
abundance, since we know the most about the high metallicity Sun and solar neighborhood
yet wish most to age date the low metallicity Galactic halo.
3. Improving White Dwarf Age Determinations: New Observations and New
Techniques
How do we build upon and refine the present, carefully collected set of observations
and results comparing WD ages and MSTO ages? Certainly, HST with the ACS offers new
capability, and capability well-matched to this problem. The next generation of very large
ground-based telescopes should also easily recover the coolest white dwarfs in many open
clusters and probably also in a few of the nearest globular clusters, especially if their adaptive
optics systems can be pushed into the I-band, a wavelength sensitive to cool WDs and to
background galaxy morphology. To motivate further studies comparing MSTO to WD ages
in clusters, I present here a handful of simulated clusters that appear to be good candidates
for investigation. These simulations allowed me to explore the trade-offs between cluster

– 7 –
parameters, the contaminating Galactic field, and observational difficulty, and thereby reject
some clusters that would be poor candidates for WD age studies.
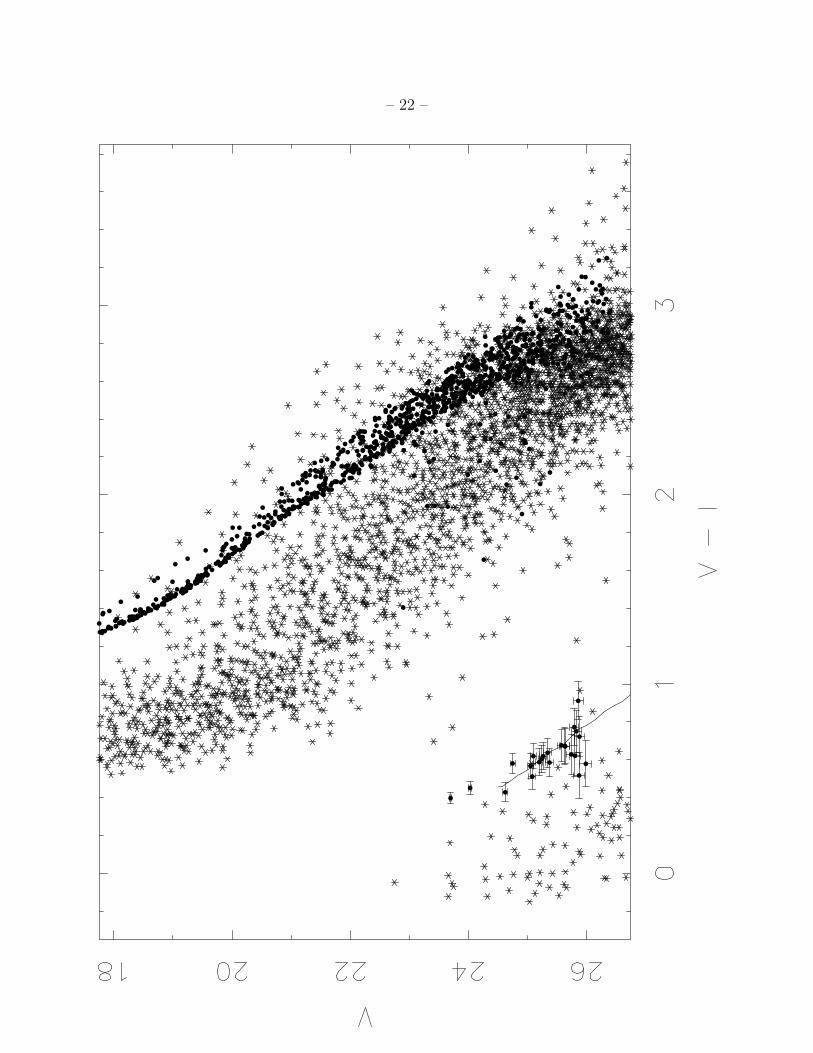
In Figures 4-10, I present simulated V I color magnitude diagrams (CMDs) for the open
clusters NGC 1245, NGC 2204, NGC 2243, NGC 2360, NGC 2506, NGC 2660, and NGC
7789. The major characteristics of these clusters are listed in Table 2. These clusters were
chosen since they are relatively nearby, rich in members, have moderate or low inter-stellar
absorption, and in the important age range for WD age studies – these are good candidates
for HST/ACS observations. Two older clusters, NGC 188 (∼ 7 Gyr; Sarajedini et al. 1999)
and NGC 6791 (∼ 8 Gyr; Chaboyer et al. 1999) are not presented here, though they are
good, but difficult, observational targets. At this point, I am not simulating such clusters
since their highest mass, crystallizing WDs are not yet modeled (see below) in a sufficiently
realistic manner for ages greater than 5 Gyr.
The cluster simulations of Figures 4-10 incorporate a Miller & Scalo (1979) initial mass
function (IMF), main sequence and giant branch stellar evolution time scales of Girardi et
al. (2000), the initial (main sequence) - final (white dwarf) mass relation of Weidemann
(2000), WD cooling time scales of Wood (1992), and WD atmosphere colors of Bergeron
et al. (1995). Each star is randomly drawn from the IMF and, based on an appropriate
binary star fraction (here set to 50%, typical for open clusters), randomly assigned to be
a single star or a binary with a companion also randomly drawn from the IMF1. Other
stellar evolution (e.g., Yi et al. 2001; Baraffe et al. 1998; Siess, Dufour, & Forestini 2000)
and WD cooling (e.g., Benvenuto & Althaus 1999; Hansen 1999) models could have been
used, but for the present purposes, these often-used models adequately cover parameter
space. The simulated color magnitude diagrams incorporate realistic photometric errors,
for observational depths set to match V = 26 or 0.5 magnitudes beyond the WD terminus,
whichever is fainter, at S/N = 152. The simulated CMDs also incorporate field stars as
1The implied age from either the MSTO technique or the WD technique is insensitive to the IMF. The
IMF serves only to populate the particular mass region that is currently at the MSTO or at the faint end of
the WD sequence. If there are insufficient stars, particularly if the cluster is young, then the few cluster stars
coupled with the IMF can create an additional, statistical uncertainty to locating the MSTO or faintest WDs.
Binaries of nearly any mass ratio have a similar effect. WDs in such systems are generally not recognized
and MSTO stars in such systems are found brighter and generally redder than the MSTO, and therefore
they do not help define the MSTO.
2From experience, S/N=15 is required to obtain good morphological rejection of background galaxies at
HST resolution. By placing this value 0.5 mag below the expected terminus of the WD sequence, one has
a bit of insurance against the cluster being older than expected. While not strictly necessary, even if the
cluster is as old as expected, the clear gap below the WD sequence, now devoid of contaminating background
galaxies, makes a convincing case that the WD terminus has been properly identified. If the WD terminus

– 8 –
predicted by the model of Reid & Majewski (1993). These simulations do not include mass
segregation or other dynamical processes, which can be important in open clusters, especially
for the lowest mass stars, but which typically have little effect on the measured WD mass
fraction (von Hippel 1998; see also Hurley & Shara 2003 who find that the WDLF and mass
function are insensitive to dynamical effects at 0.5 to 1 half-mass radii). The cluster stars
are presented as filled circles, whereas the field stars are presented as 6-pointed symbols.
One sigma error bars are included for the cluster white dwarfs only. To guide the eye to the
expected location of the WDs in these CMDs, the cooling track for a 0.7 M⊙ WD cooler
than Teff = 15,000 K from Hansen (1999) is presented in each CMD. A clear limitation of
these simulations is that stars with masses ≤ 0.15M⊙ are not included, thus the unrealistic
lower limit to the main sequence and the limited variety of binaries among the lowest mass
stars. Since the focus of this study is on stars that can become WDs, this simplification is
merely one of presentation. The number of simulated cluster stars should be approximately
the number that one would observe near the cluster centers in an HST/ACS field (3.37 ×
3.37 arc minutes). This number is determined by normalizing the star counts of each cluster
to the known brighter stars in these clusters from the published CMDs (see reference list in
Table 2). This technique, though dependent on an extrapolation of the IMF, has worked
well enough in the past, providing the approximate predicted number of cluster stars in
HST/WFPC2 observations of NGC 2420 (von Hippel & Gilmore 2000).
Even a quick study of these simulated clusters shows some of the difficulties in planning
and analyzing observations of the faint cluster WDs. While the main sequence typically
stands out against the background Galactic field stars, the WD sequence is often harder to
distinguish. The contaminating objects in the WD region, however, are simulated Galactic
field WDs, whose number counts at these faint flux levels is unknown. It is also important
to remove the abundant background galaxies at the faint flux levels where the WDs are
found, as these galaxies outnumber cluster WDs and have similar colors. These contami-
nating background galaxies are not included in the cluster simulations, which assume some
technique is applied effectively to remove them. The need to remove background galaxies is
one of the primary reasons HST is so appropriate for this study. Next generation ground-
based telescopes with I-band AO systems could also morphologically reject the background
galaxies, but at present this is not possible from the ground. Among these simulated clusters
some (NGC 2243 and NGC 2660) display enough WDs that there is a clear pile-up near the
WD terminus. Others (NGC 2204 and NGC 2506) should be uncrowded enough that cluster
WDs will dominate the lower left of the CMD. The remaining three clusters may pose greater
difficulties, especially if crowding is worse than predicted, though there are additional means
is at V < 25.5, it is easiest to still observe to V = 26, since this depth can be achieved in a single HST orbit.

– 9 –
to extract the cluster WDs. The easiest approaches are to observe additional cluster fields
in order to build up the number of cluster WDs, to observe nearby control fields to bet-
ter estimate Galactic field star and background galaxy contamination, and to add a third,
blue-sensitive filter to the observation sequence. While field WDs will not separate as well
from cluster WDs with the addition of another filter, the greater color baseline and three
filter information will help separate the warmer white dwarfs (those with strong balmer lines,
with Teff & 8000 K) from background main sequence stars. Should these techniques prove
insufficient and where a particular cluster is a good example in age - metallicity parameter
space, a second HST epoch a few years later (King et al. 1998) or ground-based epoch about
a decade later (see Platais et al. 2003) can be obtained to isolate the cluster stars based on
common proper motion.
4. Conclusion
White dwarf cooling theory and very deep observations in star clusters provide a new
tool to test stellar evolution theory and time scales as well as place two different age dating
techniques on the same calibrated scale. Fortunately, directly comparing main sequence
turn-off ages to white dwarf ages is only weakly sensitive to realistic levels of errors in
cluster distance, metallicity, and reddening. More generally, it is encouraging to see the good
overall agreement between WD and modern MSTO ages over the range 0.1 to 4 Gyr. Future
application of WD isochrones to open clusters with a variety of ages and metallicities, such as
those open clusters I have simulated, will test the consistency and limitations of white dwarf
and main sequence evolution theory. Eventually, very deep observations of globular clusters
with HST and the ACS and future, large ground-based facilities, calibrated by extensive HST
and ground-based observations and analyses of stars in open clusters, will yield accurate and
precise WD ages for the Galactic halo. These same open cluster observations will calibrate
ongoing (Kilic et al. 2005) work on the age of the Galactic disk via field white dwarfs. This
latter technique can date individual WDs (Bergeron, Leggett, & Ruiz 2001), and its improved
calibration will allow WD researchers to determine not just the age of the Galactic disk, but
also the age and age distribution of the Galactic thick disk and halo.
I would like to thank Mukremin Kilic, Mike Montgomery, and Don Winget for helpful
discussions and the anonymous referee for a review that helped me substantially improve this
paper. This material is based upon work supported by the National Aeronautics and Space
Administration under Grant No. NAG5-13070 issued through the Office of Space Science,
and by the National Science Foundation through Grant AST-0307315.

– 10 –
REFERENCES
Baraffe, I., Chabrier, G., Allard, F., & Hauschildt, P. H. 1998, A&A, 337, 403
Bennett, C. L., et al. 2003, ApJS, 148, 1
Benvenuto, O. G., & Althaus, L. G. 1999, MNRAS, 303, 30
Bergbusch, P. A., Vandenberg, D. A., & Infante, L. 1991, AJ, 101, 2102
Bergeron, P., Leggett, S. K., & Ruiz, M. T. 2001, ApJS, 133, 413
Bergeron, P., Wesemael, F., & Beauchamp, A. 1995, PASP, 107, 1047
Burke, C. J., Gaudi, B. S., DePoy, D. L., & Pogge, R. W. 2004, AJ, 127, 2382
Carraro, G., & Chiosi, C. 1994, A&A, 287, 761
Chaboyer, B., Green, E. M., & Liebert, J. 1999, AJ, 117, 1360
Claver, C. F. 1995, PhD Thesis, The University of Texas at Austin
Claver, C. F., Liebert, J., Bergeron, P., & Koester, D. 2001, ApJ, 563, 987
Demarque, P., Green E. M., & Gunther, D. B. 1992, AJ, 103, 151
Demarque, P., Sarajedini, A., & Guo, X.-J. 1994, ApJ, 426, 165
Dinescu, D. I., Demarque, P., Guenther, D. B., & Pinsonneault, M. H. 1995, AJ, 109, 2090
Dobbie, P. D., Pinfield, D. J., Napiwotzki, R., Hambly, N. C., Burleigh, M. R., Barstow, M.
A., Jameson, R. F., & Hubeny, I. 2005, MNRAS, in press (astro-ph/0410529)
Frogel, J. A., & Twarog, B. A. 1983, ApJ, 274, 270
Gim, M., Vandenberg, D. A., Stetson, P. B., Hesser, J. E., & Zurek, D. R. 1998, PASP, 110,
1318
Girardi, L., Bressan, A., Bertelli, G., & Chiosi, C. 2000, A&AS, 141, 371
Grocholski, A. J., & Sarajedini, A. 2003, MNRAS, 345, 1015
Hansen, B. M. S. 1999, ApJ, 520, 680
Hansen, B. 2004, Phys. Rep., 399, 1
Hansen, B. M. S., et al. 2002, ApJ, 574, L155
Hansen, B. M. S., & Liebert, J. 2003, ARA&A, 41, 465
Hurley, J. R., & Shara, M. M. 2003, ApJ, 589, 179
Kalirai, J. S., Ventura, P., Richer, H. B., Fahlman, G. G., Durrell, P. R., D’Antona, F., &
Marconi, G. 2001, AJ, 122, 3239
Kassis, M., Janes, K. A., Friel, E. D., & Phelps, R. L. 1997, AJ, 113, 1723

– 11 –
Kilic, M., Munn, J. A., Harris, H. C., Liebert, J., von Hippel, T., Williams, K. A., Metcalfe,
T. S., & Winget, D. E. 2005, AJ, submitted
King, I. R., Anderson, J., Cool, A. M., & Piotto, G. 1998, ApJ, 492, L37
Krauss, L. M., & Chaboyer, B. 2003, Sci, 299, 65
Lee, S. H., Kang, Y.-W., & Ann, H. B. 1999, PKAS, 14, 61
Leggett, S. K., Ruiz, M. T., & Bergeron, P. 1998, ApJ, 497, 294
Marconi, G., Hamilton, D., Tosi, M., & Bragaglia, A. 1997, MNRAS, 291, 763
Mermilliod, J.-C., & Mayor, M. 1990, A&A, 237, 61
Miller, G. E., & Scalo, J. M. 1979, ApJS, 41, 513
Oswalt, T. D., Smith, J. A., Wood, M. A., & Hintzen, P. 1996, Nature, 382, 692
Perryman, M. A. C., et al. 1998, A&A, 331, 81
Platais, I., Kozhurina-Platais, V., Mathieu, R. D., Girard, T. M., & van Altena, W. F. 2003,
AJ, 126, 2922
Pols, O. R., Schroder, K.-P., Hurley, J. R., Tout, C. A., & Eggleton, P. P. 1998, MNRAS,
298, 525
Reid, I. N., & Majewski, S. R. 1993, ApJ, 409, 635
Richer, H. B., et al. 2004, AJ, 127, 2904
Richer, H. B., Fahlman, G. G., Rosvick, J., & Ibata, R. 1998, ApJ, 504, L91
Salaris, M., & Weiss, A. 2002, A&A, 388, 492
Sandrelli, S., Bragaglia, A., Tosi, M., & Marconi, G. 1999, MNRAS, 309, 739
Sarajedini, A., Brandt, K., Grocholski, A. J., & Tiede, G. P. 2004, AJ, 127, 991
Sarajedini, A., von Hippel, T., Kozhurina-Platais, V., & Demarque, P. 1999, AJ, 118, 2894
Siess, L., Dufour, E., & Forestini, M. 2000, A&A, 358, 593
Steinhauer, A. 2003, Ph.D. Thesis, University of Indiana
Steinhauer, A., & Deliyannis, C. P. 2004, ApJ, 614, L65
Twarog, B. A., Anthony-Twarog, B. J., & Bricker, A. R. 1999, AJ, 117, 1816
von Hippel, T. 1998, AJ, 115, 1536
von Hippel, T. 2001, in ASP Conf. Ser. 245, Astrophysical Ages and Time Scales, ed. T. von
Hippel, C. Simpson, & N. Manset (San Francisco: ASP), 190
von Hippel, T., & Gilmore, G. 2000, AJ, 120, 1384

– 12 –
von Hippel, T., Gilmore, G., & Jones, D. H. P. 1995, MNRAS, 273, L39
Weidemann, V. 2000, A&A, 363, 647
Weidemann, V., Jordan, S., Iben, I., & Casertano, S. 1992, AJ, 104, 1876
Winget, D. E., Hansen, C. J., Liebert, J., van Horn, H. M., Fontaine, G., Nather, R. E.,
Kepler, S. O., & Lamb, D. Q. 1987, ApJ, 315, L77
Wood, M. A. 1992, ApJ, 386, 539
Yi, S., Demarque, P., Kim, Y.-C., Lee, Y.-W., Ree, C. H., Lejeune, Th., & Barnes, S. 2001,
ApJS, 136, 417
This preprint was prepared with the AAS LATEX macros v5.2.

– 13 –
Fig. 1.— Main sequence turn-off versus white dwarf ages from recent studies. The WD
age for the Hyades is a lower limit to a greater degree than are the WD ages for the other
clusters, since 50 to 90% of the Hyades has likely evaporated (Weidemann et al. 1992).
Fig. 2.— The effect of three types of errors on the derived MSTO age versus the ratio of
the WD-to-MSTO age over the range of 100 Myr to 4 Gyr. Calculations are performed at
log(age) = 8.0, 8.3, 8.6, 9.0, 9.3, and 9.6. The thick lines show the effect of overestimating
distance by 0.2 mag. The thin lines show the effect of overestimating metallicity by 0.2 dex.
The dotted lines show the effect of overestimating metallicity by 0.2 dex, then compensating
by decreasing reddening to keep the MSTO at the same color.
Fig. 3.— The three categories of error presented in the MSTO age versus WD age diagram.
The symbols are the same as in Figure 2. The diagonal dotted line crossing most of the
diagram is the one-to-one correspondence line where MSTO ages and WD ages are identical.
Fig. 4.— Simulated V I color magnitude diagrams for the open cluster NGC 1245, with
cluster parameters as listed in Table 2.
Fig. 5.— Same as Figure 4, but for NGC 2204.
Fig. 6.— Same as Figure 4, but for NGC 2243.
Fig. 7.— Same as Figure 4, but for NGC 2360.
Fig. 8.— Same as Figure 4, but for NGC 2506.
Fig. 9.— Same as Figure 4, but for NGC 2660.
Fig. 10.— Same as Figure 4, but for NGC 7789.

– 14 –
– 15 –

– 16 –

– 17 –

– 18 –

– 19 –

– 20 –

– 21 –
– 22 –

– 23 –

– 24 –
Table 1. White Dwarf Versus Main Sequence Ages for Open Clusters
Cluster WD Age (Gyr) MSTO Age (Gyr) Ref
(1) (2) (3) (4)
M 35 0.141 (+0.083,−0.043) 0.150 (±0.06) 1
Hyades 0.3 (±0.03) 0.625 (+0.05,−0.125) 2
M 37 0.57 (+0.15,−0.18) 0.52 (+0.6,−0.7) 3
Praesepe 0.606 (+0.202,−0.109) 0.625 (±0.05) 4
NGC 2477 1.3 (±0.2) 1.0 (+0.3,−0.2) 5
NGC 2420 2.0 (±0.2) 2.15 (±0.25) 6
M 67 4.3 (+0.2,−0.8) 4.0 (±0.5) 7
References. — 1. The WD age is derived from the cooling age
for the oldest cluster WD from Williams, Bolte, & Koester (2004)
plus a precursor age of ∼ 56 Myr, based on the object’s initial mass
(∼ 7M⊙), which was calculated from the Weidemann (2000) initial-
final mass relation. The MSTO ages are based on Grocholski &
Sarajedini (2003), Steinhauer (2003), and Steinhauer & Deliyannis
(2004). 2. The WD age is from Weidemann et al. (1992) and the
MSTO age is from Perryman et al. (1998). 3. The WD and MSTO
ages are from Kalirai et al. (2001). The MSTO age range is extracted
from their discussion as it is not explicitly presented. 4. The WD
age is derived from the cooling age of the oldest WD from Dobbie et
al. (2005) plus a precursor age of 106 (+109,−43) Myr based on the
object’s initial mass of 5.3 (+1.4,−1.3) M⊙, in turn derived from the
Weidemann (2000) initial-final mass relation. The MSTO age is from
Perryman et al. (1998). 5. The WD age is from von Hippel, Gilmore
& Jones (1995) and the MSTO age is from Kassis et al. (1997). 6.
The WD age is from von Hippel & Gilmore (2000) and the MSTO
ages represent the mean and range of the convective overshoot results
of Carraro & Chiosi (1994); Demarque, Sarajedini & Guo (1994);
Lee et al. (1999); Pols et al. (1998); and Twarog, Anthony-Twarog

– 25 –
& Bricker (1999). 7. The WD age is from Richer et al. (1998) and
the MSTO ages are from Demarque, Green & Gunther (1992) and
Dinescu et al. (1995).

– 26 –
Table 2. Open Cluster Parameters for Simulations
Cluster V −MV AV Age l b Ref
(1) (2) (3) (4) (5) (6) (7)
NGC 1245 12.95 0.68 1.0 146.63 −8.92 1
NGC 2204 13.35 0.25 2.5 226.02 −16.07 2
NGC 2243 13.05 0.12 5. 239.50 −17.98 3
NGC 2360 10.5 0.25 2.2 229.80 −1.40 4
NGC 2506 12.8 0.22 1.9 230.60 9.97 5
NGC 2660 13.4 1.2 0.9 265.84 −3.03 6
NGC 7789 12.2 0.81 1.6 115.49 −5.35 7
References. — 1. Burke et al. 2004 2. Frogel & Twarog
1983 3. Bergbusch, Vandenberg, & Infante 1991 4. Mermilliod
& Mayor 1990 5. Marconi et al. 1997 6. Sandrelli et al. 1999
7. Gim et al. 1998