Arvind Fashions Limited · CEO, Lifestyle Brands • 12+ Yrs in Arvind • 21 Yrs of Experience in...
39
0 Arvind Fashions Limited Investor Roadshow August 2018
Transcript of Arvind Fashions Limited · CEO, Lifestyle Brands • 12+ Yrs in Arvind • 21 Yrs of Experience in...

0
Arvind Fashions Limited
Investor RoadshowAugust 2018

1
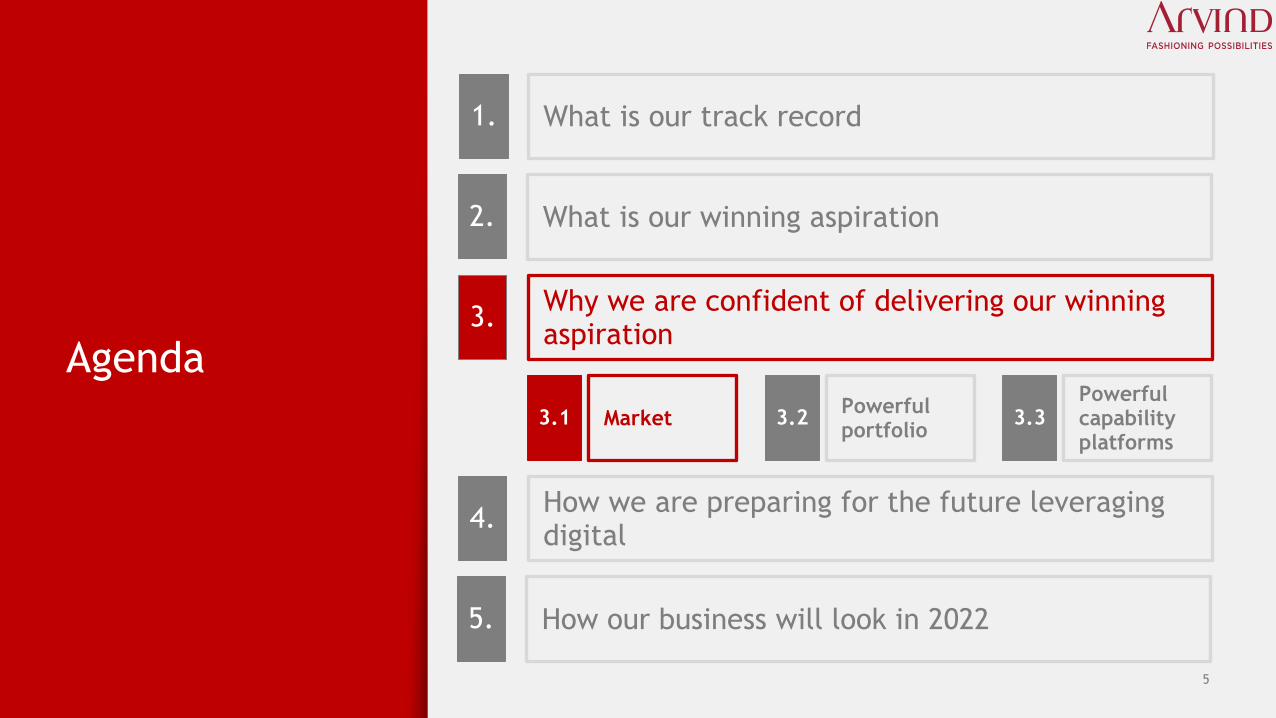
Agenda
2. What is our winning aspiration
1. What is our track record
3.Why we are confident of delivering our winning aspiration
4.How we are preparing for the future leveraging digital
5. How our business will look in 2022

2
With improved profitability
Track record of robust and profitable growth
FY17
2,290
FY16
3,794
FY15
3,324
2,1421,737
FY18
+22%
FY14
240
165
101128
FY17FY16
95
FY15FY14
+26%
FY18
Fastest growing branded apparel company
Sales (Rs. Cr) EBITDA (Rs. Cr)
EBITDA%
5.5% 6.0% 4.4% 5% 6.3%
Sales growing at
22% CAGR

3
Agenda
2. What is our winning aspiration
1. What is our track record
3.Why we are confident of delivering our winning aspiration
4.How we are preparing for the future leveraging digital
5. How our business will look in 2022

4
Sales growth at
20%+ CAGR
100 bps improvement each year for
the next 4 yearsWith sharp increase in
capital efficiency
Our winning aspiration
+20%
FY19E FY21EFY20E
3,794
FY18 FY22E
+36%
FY22E
240
FY20EFY18 FY21EFY19E FY19E FY21EFY18
4.4%
FY20E FY22E
25.0%
Sales (Rs. Cr) ROCE (%)EBIDTA (Rs. Cr)
EBIDTA%
6.3% 7.3% 8.3% 9.3% 10.3%
5
Agenda
2. What is our winning aspiration
1. What is our track record
3.Why we are confident of delivering our winning aspiration
4.How we are preparing for the future leveraging digital
5. How our business will look in 2022
3.1 Market 3.2Powerful portfolio
3.3Powerful capability platforms
6
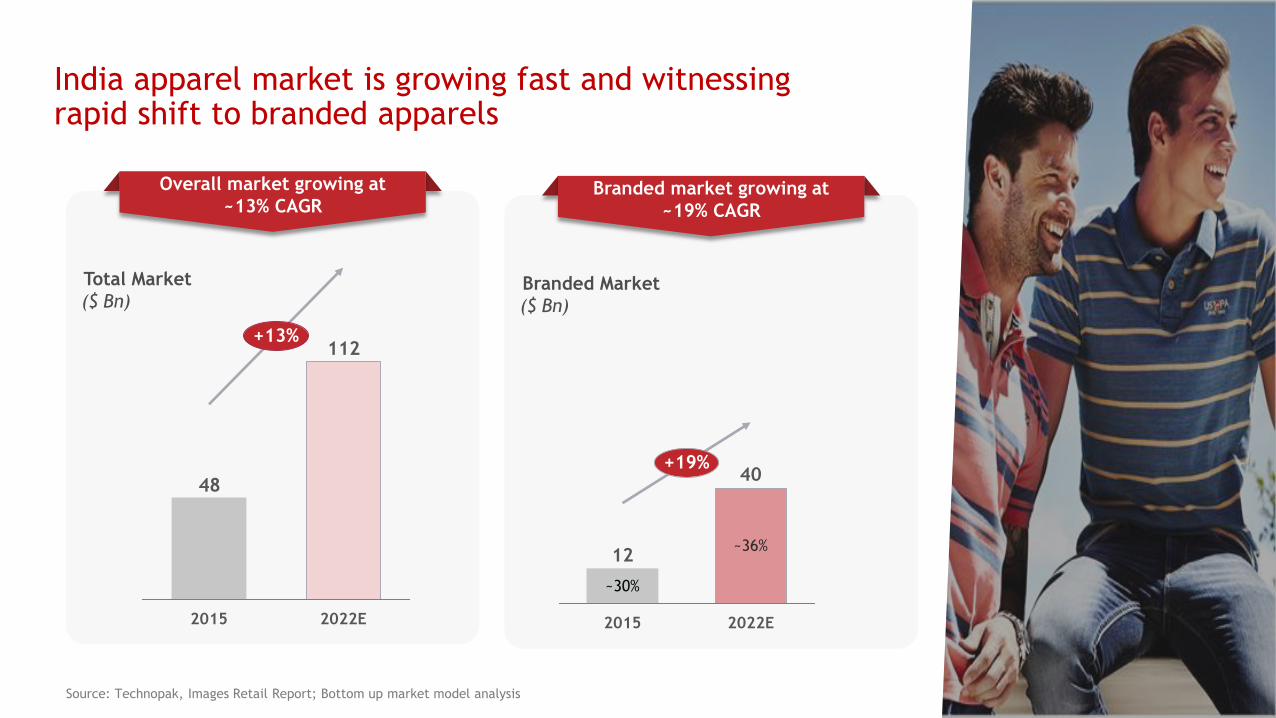
India apparel market is growing fast and witnessingrapid shift to branded apparels
112
48
2015
+13%
2022E
Overall market growing at
~13% CAGR
Source: Technopak, Images Retail Report; Bottom up market model analysis
Total Market
($ Bn)
+19%
~30%
2015
~36%
40
2022E
12
Branded market growing at
~19% CAGR
Branded Market
($ Bn)
7
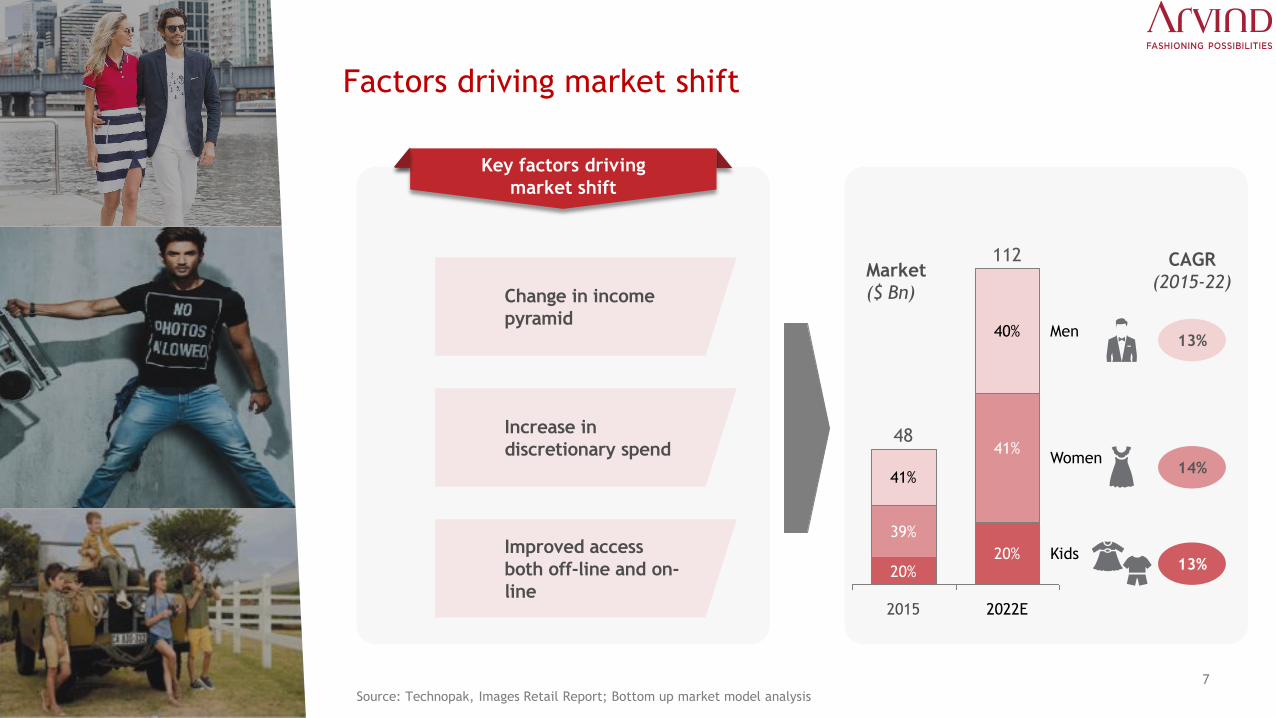
13%
14%
13%
41%
112
2015
Men
Kids
40%
41%
2022E
20%
48Women
39%
20%
CAGR
(2015-22)Market
($ Bn)
Factors driving market shift
Change in income
pyramid
Increase in
discretionary spend
Improved access
both off-line and on-
line
Source: Technopak, Images Retail Report; Bottom up market model analysis
Key factors driving
market shift

8
Increasing preferences for casuals & denim wear
1. Customer research, 2016 Source: BCG Customer research, Bottom up market model
Age & urbanization in favor of
casualization…
…dress code of India is becoming
more casual…Men’s casual wear market
expected to grow at 18%
Median age in India expected to be
29 years by 2020
Younger people spending more on
casual wear1
80
40
0
20
100
60
33%
67%59%
18-25
years
41%
44%
25-40
Years
56%
40+
years
Spend on casual wear is less than before
Spend on casual wear has increased or stayed same
75%+ men wear casuals more than
thrice a week1
Increasing acceptance of casual wear
at work places...
No. of days / week casual wear is worn
70
20
10
0
12%
1-2
65%
3-5
23%
0
1%
>5
New Age Service Industry
Established Players
12
0
2
4
6
8
10
12
Market (USD Bn)
+18%
20222015
4
In contrast, men's formal wear
market expected to grow at ~11%

9
Agenda
2. What is our winning aspiration
1. What is our track record
3.Why we are confident of delivering our winning aspiration
4.How we are preparing for the future leveraging digital
5. How our business will look in 2022
3.1 Market 3.2Powerful portfolio
3.3Powerful capability platforms

10
Arvind’s winning portfolio mirrors market trends – unmatched portfolio in casuals and denim wear
Source: BCG, Internal analysis
25-30% market share; higher than #2 and #3 put together in branded premium casual wear market
Bra
nded m
ark
et
Super Premium
$ 2.0 Bn$ 0.7 Bn
2015 2022
Mass Premium
$ 26.0 Bn$ 8.7 Bn
2015 2022

11
Powerful portfolio addresses three other significant opportunities
Kids wear
$ 5.1 Bn$ 2.9 Bn
2015 2022
Value fashion
$ 12 Bn$ 2.7 Bn
2015 2022
Inner wear
$ 2.8 Bn$1.9 Bn
2015 2022
Bra
nded m
ark
et
12
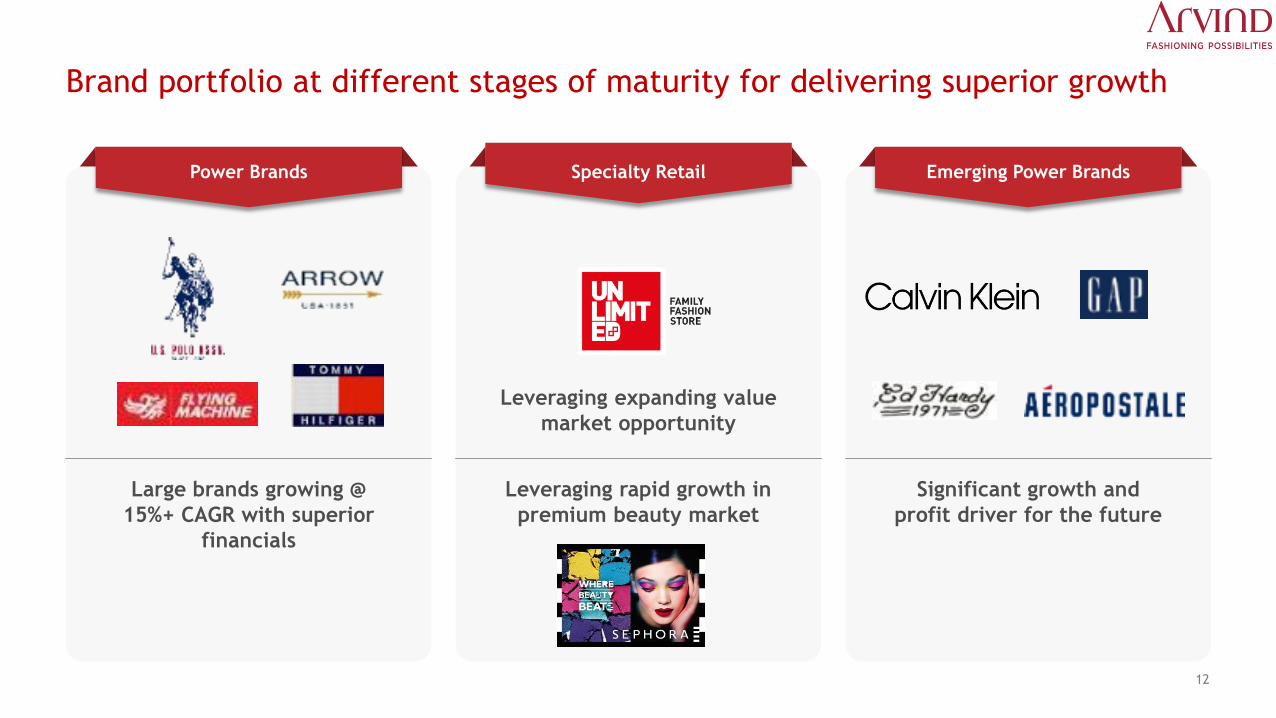
Brand portfolio at different stages of maturity for delivering superior growth
Power Brands Specialty Retail Emerging Power Brands
Leveraging expanding value
market opportunity
Large brands growing @
15%+ CAGR with superior
financials
Leveraging rapid growth in
premium beauty market
Significant growth and
profit driver for the future

13
Power brands growing at 15%+ CAGR with superior financials
11.5% 12.3% 14.5%
Above 35%ROCE
(%)
EBITDA
(%)
Sales
(Rs Cr.)
1,185
2,307
4,000+18%
18%
FY22FY14 FY18
14
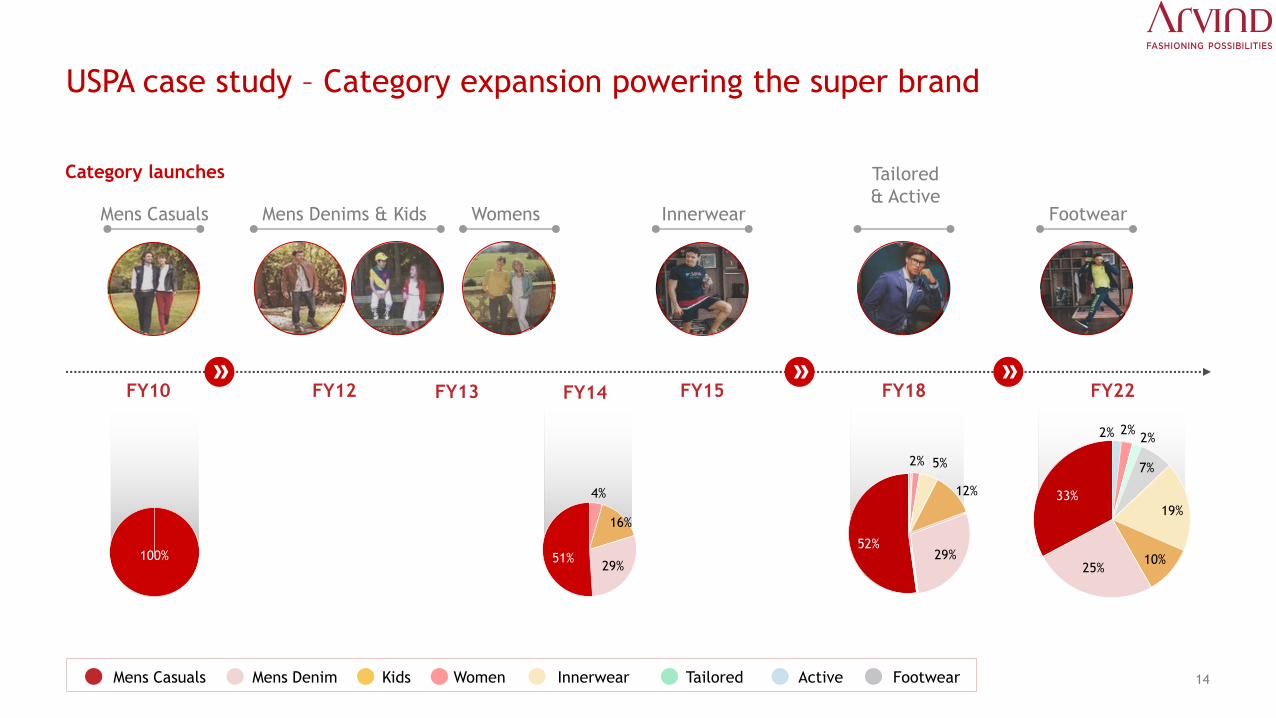
100%100%
2% 2%2%
7%
19%
10%25%
33%
2% 5%
12%
29%52%
4%
16%
29%51%
USPA case study – Category expansion powering the super brand
Mens Casuals Mens Denims & Kids Womens Innerwear
Tailored
& ActiveFootwear
FY10 FY13FY12 FY15 FY18 FY22
ActiveTailoredWomen FootwearInnerwearMens Casuals
Category launches
Mens Denim
FY14
Kids
15
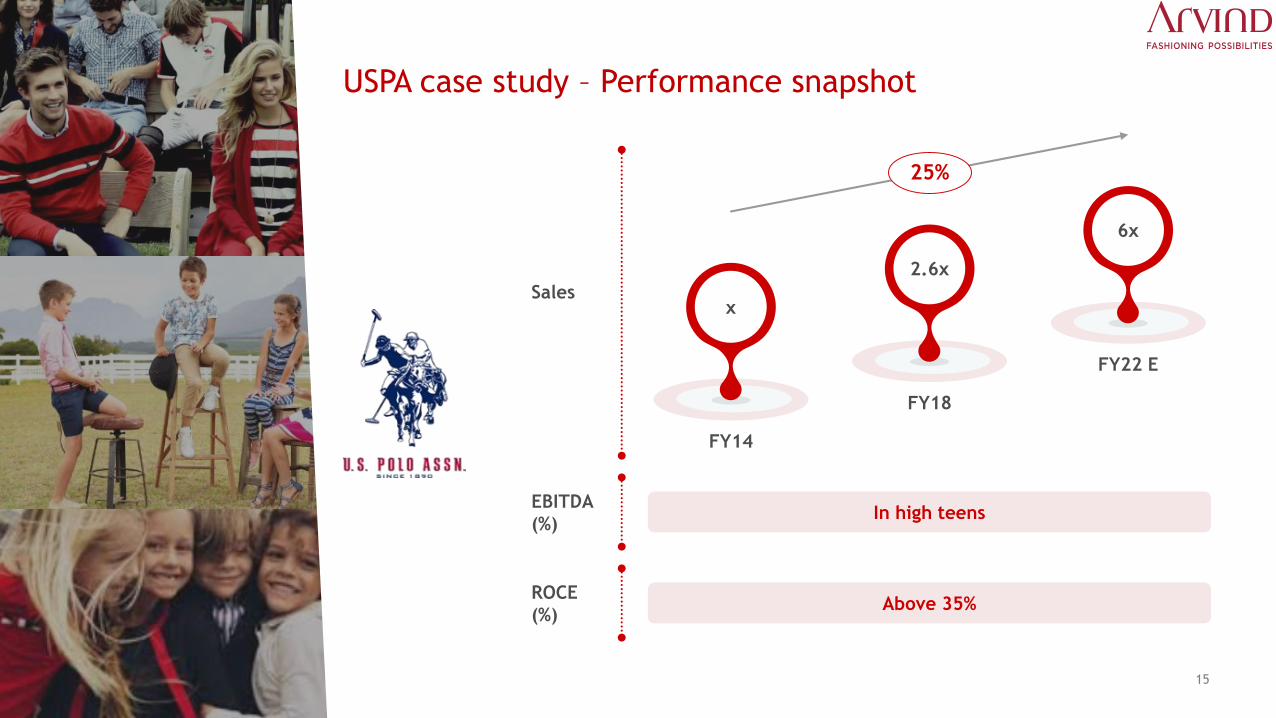
USPA case study – Performance snapshot
ROCE
(%)Above 35%
In high teensEBITDA
(%)
25%
Sales
FY18
FY22 E
FY14
x
2.6x
6x

16
USPA case study – Runway for sustained high growth
Innerwear
Kidswear
Footwear
Size of the bubble indicates size of the opportunity
FY16 FY22 EFY14 FY18
Three categories with combined potential to reach Rs 1000 Cr.+ by 2022

17
USPA case study – Runway for sustained high growth
Retail
Univ.FY15 FY18
CAGRCities #Stores Sales Cities #Stores Sales
Metros 8 8 87 x 8 110 1.3x 10%
Tier 1 32 29 58 x 32 99 1.4x 12%
Tier 2 43 22 26 x 38 59 2.2x 31%
Tier 3 320 36 35 x 55 61 1.8x 23%
Department stores
FY15 FY18CAGR
#Counters Sales #Counters Sales
429 x 1,008 2.0x 20%
Online
FY15 FY18CAGR
Sales Sales
x 7.7x 97%
Tier 2/3, Department stores and Online will continue to provide growth momentum

18
38% to 45%
FY15 FY18
Mens-wear 70% 40%
Womens – Ethnic wear 15% 21%
Women-Western wear 5% 14%
Kids-wear 7% 18%
Accessories 3% 7%
Category mix
Gross Margin
Outcome
Leveraging expanding value market opportunity – Unlimited case study
Large size to optimal Size
• 10,000 Sq. Ft
• Moved from discount proposition to
value proposition
• A family fashion store
• Preferred locations – malls & high traffic
high streets
• Equal representation for men, women &
kids
• Mainly private brands
Key actions
Bra
nd
Posi
tionin
gA
ssort
ment
Sto
re
Layout

19
Scaling up Unlimited
Sales
(Rs Cr.)
FY14
569
FY18
700
FY22E
30%
5%
EBITDA
(%) 2.9% Break-even 7-8%
110
FY17
75
FY19FY18
51
FY16
38
Proving the
concept
Rapid
expansion
Expanding footprint
#Stores
230 stores by 2022

20
Growing Beauty &
Personal Care market
Sephora – Leading position in premium beauty segment with portfolio of exclusive brands
9.0
95%
0.5
(5%)
100%
Mass
Premium
2022
18.4
92%
1.5
(8%)
2015
CAGR Premium Market(2015-22)
CAGR Mass Market(2015-22)
~25%
~17%
Leveraging
capabilities
Data source: Euromonitor: Premium beauty and personal care is the aggregation of premium colour cosmetics, fragrances, deodorants, skin care, sun care, baby and child-specific products, bath and shower and hair care. Mass beauty and personal care is the aggregation of mass colour cosmetics, fragrances, deodorants, skin care, sun care, baby and child-specific products, bath and shower and hair care.
Market size
($ Bn)
Brand
development
Go to market
capabilities

21
17*4
Accelerating momentum to be Rs 1,000 Cr. beauty retailer by 2025
Concept already profitable
* As of Aug 2018
Performance since takeover
Sales
# stores
FY16
x
FY18
5x
Potential to grow to
Rs 700-800 Cr. by FY22
with 50 stores and
15% contribution from online

22
Potential power brands – growth & profit driver for the future
Sales(Rs Cr.)
EBITDA positive FY19 onwards
-
~400
800+20%+
FY22FY14 FY18
EBITDA
(%)
23
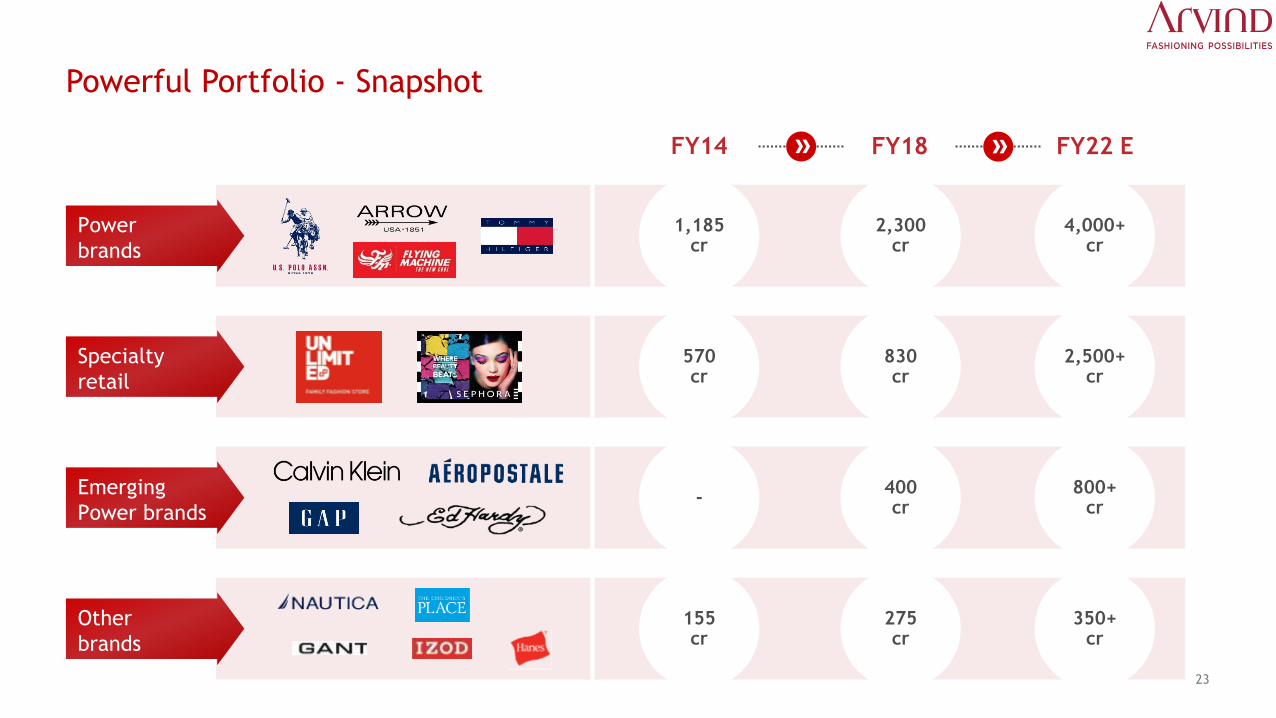
Powerful Portfolio - Snapshot
FY14 FY18 FY22 E
1,185cr
2,300cr
4,000+cr
570cr
830cr
2,500+cr
-400cr
800+cr
155cr
275cr
350+cr
Power
brands
Specialty
retail
Emerging
Power brands
Other
brands

24
Agenda
2. What is our winning aspiration
1. What is our track record
3.Why we are confident of delivering our winning aspiration
4.How we are preparing for the future leveraging digital
5. How our business will look in 2022
3.1 Market 3.2Powerful portfolio
3.3Powerful capability platforms

25
Management Team
Powerful capability platforms
SourcingGo-to-
marketOnline
Product/
Design

26
Strong Product/Design capabilities
• Strong Product/Design team
‒ 250+ designers & merchants
• Deep understanding of Indian consumer requirements
‒ Track record of creating India specific designs for international brands
• Innovation leader
‒ Slim fit
‒ Stitch less shirts
‒ Auto flex trousers
‒ Eco friendly denim
• Multi-category design expertise

27
Powerful go-to-market capabilities have led to rapid footprint expansion
2013 2014 2016 20182012 2014 2016 2018
Retail
Stores(# of stores)
Cities covered(# of towns)
1300
903811
2008 2015 2016 2018
167
180150
2008 2015 2016 2018
120
58
Departmental stores(# of counters)
Other Multi-brand stores(# of stores)
Multi-brand
7001000
1400
327
671956
1423 1800
189 stores in the
top 25 malls vs 115
store for next best
competitor.
Highest for any
lifestyle player in
India
Presence in 140+
Tier 2/3 towns
Go to
Market
Distribution
Strength
Warehouse
& Logistics
Brand
Development
Capabilities

28
Sourcing expertise - Scaled up business without any manufacturing investments through strategic vendor relationships
51
20
FY14 FY18
33
17
Annual sourcing volume(in mn)
Number of product categories
Handling large
volumes
Multi category
expertise
• Menswear
• Womens wear
• Kids wear
• Innerwear
• Menswear
• Womens wear

29
Strong e-commerce expertise
2%
356
139
+86%
FY18FY16FY14
30
6% 9%
Sales(Rs Cr.)
Share %
• Own e-ecommerce through NNNOW.com
• Differentiated through Omni-channel Experience
• GMV run rate at 100 Cr+ contributing to 10% of
ecommerce sales
Own e-commerce
• Strategic partner to all e-commerce players
• First call for any new e-commerce player
• Strong pricing control
3rd Party e-commerce

30
Has the best track record in scaling up brands leveraging powerful capability platforms
2010 2014 2015
Rs 1000+ Cr Rs 150+ Cr Rs 100+ Cr
Year of launch and current size

31
Experienced Leadership Team
Four Functional Heads
• 7+ Yrs at Arvind
• 23+ Yrs of experience of which
12 yrs in HUL
• Chartered Accountant
S KannanCFO
Anindya RaySr. VP – Sourcing & Tech Services
• 10+ Yrs at Arvind
• 21+ Yrs at Madura, UCB & Arvind
Shilpa VaidChief HR Officer
• 18+ Yrs of experience
• 2+ Yrs at Arvind
• MBA
Piyush ChowhanCIO
• 2+ Yrs in Arvind• 18+ Yrs experience in retail &
technology• MBA
Six Business Leaders
Alok DubeyCEO, Lifestyle Brands
• 12+ Yrs in Arvind
• 21 Yrs of Experience
in Titan, Swatch
• MBA
CS Shekar CEO, Value Fashion
• Joined Arvind in 2015
• 27+ Yrs of experience
in Landmark Group in
India and Middle East
Sumit DhingraCEO, HBD Brands
• 8 Yrs in Arvind
• 12 Yrs of experience
in Madura
• MBA – IIM Lucknow
Parag DaniCEO, BTL Brands
• 2+ Yr in Arvind
• 21+ Yrs of experience
in Madura, Levis and
Reliance
• MBA – Jamnalal Bajaj
Nitin AgarwalCOO – Innerwear Business
• 3+ Yrs of experience in
Arvind
• 12+ Yrs of experience
• MBA - IIM Lucknow
Vivek BaliCOO- Sephora
• Joined in 2015
• 27+ Yrs experience in
beauty retail at
Lakme Lever,
Polaroid, Avon
Beauty, Reliance
Retail and Landmark
Group
• PGPIM from IMI
J SureshManaging Director & CEO,
• 13 Yrs in Arvind
• 18 Yrs in HUL
• MBA – IIM Bangalore

32
Organization structure geared to scale up brands with low fixed cost
Sourcing
Finance
IT
Logistics
HR
2
1
3
4
5
1
2
3
4
5
Arvind’s plug and play capabilitiesBrand’s own capabilities
Product
Sales
channels
Marketing

33
Agenda
2. What is our winning aspiration
1. What is our track record
3.Why we are confident of delivering our winning aspiration
4.How we are preparing for the future leveraging digital
5. How our business will look in 2022

34
Three key transformational projects to sustain competitive edge and deliver superior financial performance
• Analytics driven retail planning
• AI driven buying
• Auto replenishment
• …
Supply chain optimization1
Best in class omni-channel capabilities
• Endless aisles
• Click and collect
• Store order and home fulfillment
• Store digitization
• …
2
Improve speed to market, through
manufacturing flexibility
• 30-40% of products to move to sourcing
lead times of <12 weeks
3
.. delivering superior financial
performance
Improved LTL growth
Higher inventory turns
• Improved from 3x in FY17 to 3.7x in
FY18
• Target of 4.6x in FY19 and 4.9x
going forward
Improved profitability through higher
full price sell through

35
Agenda
2. What is our winning aspiration
1. What is our track record
3.Why we are confident of delivering our winning aspiration
4.How we are preparing for the future leveraging digital
5. How our business will look in 2022

36
Shape of our portfolio
100+ Cr
500+ Cr
1,000+ Cr
2,000+ Cr
#4
#1
-
- -
-
#3
#5 #5
#3
#1
#2
FY 14 FY18 FY 22 E

37
Sales to grow at
20%+ yoy
100 bps improvement for
the next 4 yrsSteady rise in
Capital efficiency
Shape of our business
+20%
FY19E FY21EFY20E
3,794
FY18 FY22E
+36%
FY22E
240
FY20EFY18 FY21EFY19E FY19E FY21EFY18
4.4%
FY20E FY22E
25.0%
Sales (Rs. Cr) ROCE (%)EBIDTA (Rs. Cr)
EBIDTA%
6.3% 7.3% 8.3% 9.3% 10.3%

Thank You!