Arun b shrestha
22
International Centre for Integrated Mountain Development Kathmandu, Nepal Sustained hydropower potential in the Hindu Kush Himalaya river basins due to increasing glacier melt and precipitation International Conference on Climate Change Innovation and Resilience for Sustainable Livelihood 12-14 January 2015, Kathmandu Arun B Shrestha [email protected]
Transcript of Arun b shrestha

International Centre for Integrated Mountain Development
Kathmandu, Nepal
Sustained hydropower potential in the
Hindu Kush Himalaya river basins due to
increasing glacier melt and precipitation
International Conference on Climate Change Innovation and
Resilience for Sustainable Livelihood
12-14 January 2015, Kathmandu
Arun B Shrestha [email protected]

Lutz, A. F., W. W. Immerzeel, A. B. Shrestha, and M. F. P. Bierkens,
2014: Consistent increase in High Asia's runoff due to increasing
glacier melt and precipitation. Nature Clim. Change, advance online
publication.
Himalayan Climate Change Adaptation
Programme (HICAP)

The “Third Pole”
Largest reserve of snow and ice outside the polar regions
• Contributions of snow
and ice?
• Impact of cc on
glaciers?
• Impact on the water
availability and
infrastructure?

Approach
• High resolution (1 km) fully distributed model for
the upstream parts of the Indus, Ganges,
Brahmaputra, Salween and Mekong (HI-SPHY;
based on Immerzeel et al. 2010)
• Reference period from 1998 until 2007
• Calibration using observed runoff
• Climate change scenarios
• Ensemble of latest CMIP5 GCM output
• Downscaling -change method
• Transient runs until 2050

Model domain
!(
!(
!(!(!(!(!(!(
!(!(!(
!(!(!(!(!(
!(
!(!(
!(
!(!(
!(
!(
!(!(
!(
!(!(
!( Outflow locations to downstream models0 200 400 600 800 1000
km
Upper Indus 437.201 km2
Upper Ganges 169.162 km2
Upper Brahmaputra 372.664 km2
Upper Salween 103.497 km2 Upper Mekong
77.696 km2

Basin scale model set-up and
calibration

Input data
• Digital Elevation Model
(HydroSheds based on
NASA SRTM)
• APHRODITE and
Princeton gridded data
• Runoff from 12
measurements stns in
Nepal and Pakistan
• FAO Soil
• MERIS Land Use
Legend
> 7000 m
< 500 m0 200 400 600 800 1000
km
Soil types (FAO)0 200 400 600 800 1000
km
Land Use (GlobCover)0 200 400 600 800 1000
km

Climate change scenarios
• Use two representative concentration
pathways (RCP)
– RCP8.5 (8.5 W/m2 in 2100) extreme
– RCP4.5 (4.5 W/m2 in 2100) less extreme
• Forcing regional and global circulation
models until 2050
• 4 GCMs for RCP4.5 and 4 GCMs for RCP
8.5 spanning entire range of possible
futures:
– Dry & cold
– Dry & warm
– Wet & cold
– Wet & warm
• Total 2 RCPs x 4 models = 8 sets of climate
projections
• Downscaled using -change method

Model input data River runoff data 1998-2007 for calibration
Legend
River runoff data locations0 200 400 600 800 1000
km
• 12 locations with river flow
data series (not all
complete)
• Data provided by DHM
Nepal, IWMI, PMD, and
WAPDA Pakistan

Basin-scale
1 km grid
cell scale
Glacier projections
Fractional
glacier
cover
Glacier
hypsometry
Classificatio
n glacier
size classes
Glacier
mass
balance
Volume-
Area-
scaling
1 km grid
cell scale
Updated
fractional
glacier
cover per
cell DEM
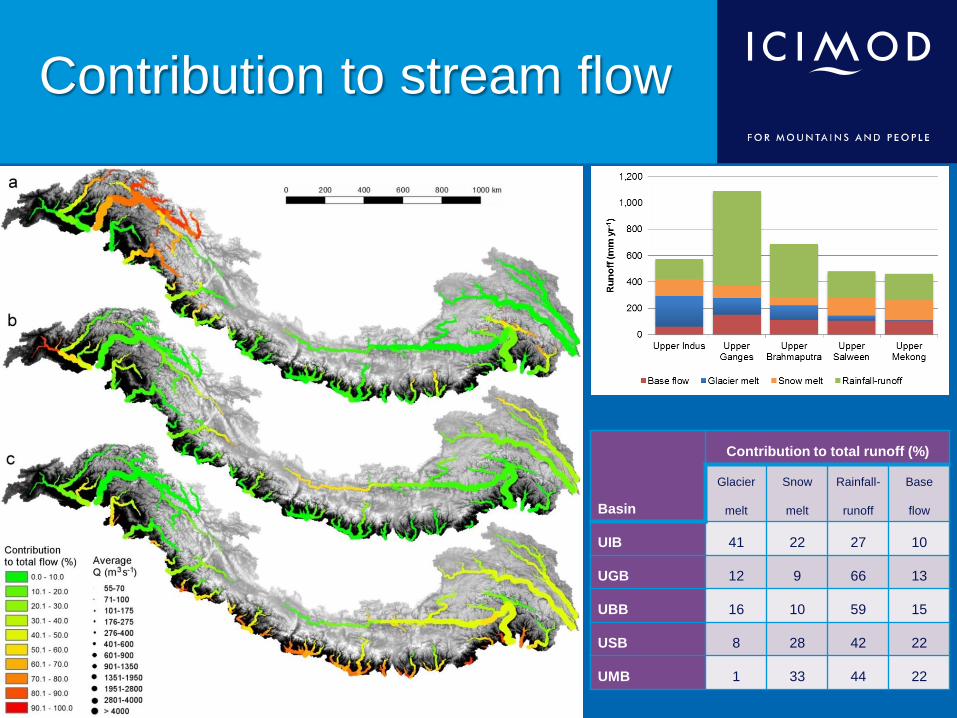
Contribution to stream flow
Basin
Contribution to total runoff (%)
Glacier
melt
Snow
melt
Rainfall-
runoff
Base
flow
UIB 41 22 27 10
UGB 12 9 66 13
UBB 16 10 59 15
USB 8 28 42 22
UMB 1 33 44 22

Glacier change

Changes in hydrological regime
RCP4.5
RCP8.5
No significant
change in water
availability

Changes in hydrological
regimes

Case study - Koshi
RCP 4.5
RCP 8.5
Tama
Koshi Dudh
Koshi

Hydropower potential Flow duration curves

Flow duration curves

Hydropower potential
• First order estimate using Water
Evaluation and Planning Tool
(WEAP)
• Hypothetical reservoir at catchment
outlet – Reservoir storage capacity - half the annual
inflow during the reference period (1998-
2007).
– Reservoir initial storage - 80% of the total
storage capacity.
– A volume-elevation curve typical for mountain
reservior
– Evaporation and infiltration to groundwater
are neglected.
– Top buffer - 50% of the total storage capacity.
Below this level releases constrained by a
buffer coefficient which is assumed to be 50%
– The hydropower generation is assumed to be
not constrained by a maximum turbine flow.
Expected increase in Nepalese energy
demand (NEA, 2012)

2041-2050

Conclusions
• Hydrological model provides insight into
stream flow composition
• Glacier changes ranging from 25 – 50%
• Changes in outflow to downstream areas:
overall remains the same or increases
• Glacier melt contribution decreases
• Rainfall-runoff increases
• No negative impacts on hydropower potentials

• High uncertainty in the precipitation forcing for
high altitudes and uncertainty in climate
projections
• First order assessment, recommendations for
more accurate assessments:
– Assessment of hydropower potential per subcatchment
– Include multiple potential dam heights and storage
volumes, or assessment of possible reservoir
morphology and possible dam height
• Not considered: extreme events, glacial hazards

Thank you