Aruba Designed Speed 802 11n
76
Peter Thornycroft October 2007 www.arubanetworks.com
Transcript of Aruba Designed Speed 802 11n

Peter ThornycroftOctober 2007
www.arubanetworks.com

Designed for Speed
Network Infrastructure in an 802.11n World
Peter Thornycroft Aruba Networks October 2007

Designed for Speed - 802.11n Theory and Practice
Aruba Networks

1
www.arubanetworks.com
Table of Contents
Chapter 1 Preparing for the 802.11n adoption wave 3Introduction 3
Benefits for the Enterprise 4Benefits for the user 5These benefits will be elusive for a while 5802.11n migration strategies for enterprises 7Network design with 802.11n 8Wired backhaul from APs & LAN implications 9Implications for rogue APs and WIDS 10Good-neighbour (or bad-neighbour) strategies 10
Chapter 2 Technology in 802.11n 12Techniquesforhigh-throughputPHY 12
High Throughput PHY: Maximum Ratio Combining 13High Throughput PHY: Space-time Block Coding 14High Throughput PHY: Spatial Division Multiplexing 16High throughput PHY: Transmit Beamforming (TxBF) 21MIMO, STBC, SDM, Beamforming… terminology 22802.11n MIMO configurations and terminology 24Hierarchy of MIMO techniques 24High Throughput PHY: 40 MHz channels 25High Throughput PHY: Shorter guard interval 26High Throughput PHY: More subcarriers 27High Throughput PHY: New Modulation Rates 27High Throughput PHY: Duplicate format 31
TechniquestoenhancetheMAC 31Frame aggregation 31Multiple Traffic ID Block Acknowledgement (MTBA) 32Reduced inter-frame spacing (RIFS) 33Spatial multiplexing power save (SM power save) 33Power Save Multi-poll (PSMP) 34Compatibility Modes and Legacy Support in 802.11n 35Greenfield, High-throughput and non-HT modes 36Phased coexistence Operation (PCO) 38

2
Designed for Speed - 802.11n Theory and Practice
Aruba Networks
Other mechanisms for coexistence: Dual-CTS protection (CTS-to-self) 39Other mechanisms for coexistence: 40 MHz-intolerant indication 40Using 802.11n in the 2.4 GHz band 40Using 802.11n in the 5 GHz band 42
Chapter 3 Product development and capabilities 43StandardsandCertificationframework 43
Expected product introduction timelines 45
Chapter 4 Migration strategies 47Differentpathstoenterprise-wide802.11n 47
Greenfield 48Summary of ‘Greenfield’ recommendations: 49AP-overlay 50Summary of ‘Overlay’ recommendations: 51AP substitution 52Summary of ‘AP substitution’ recommendations: 53
Otherconsiderationswhenplanninganupgrade 53
Chapter 5 Conclusion 55
Appendix 56Noteonexpected‘real-world’cellcapacitywith802.11n 56
Noteonexpected‘real-world’datarateswith802.11n 58Methodology 58Free Space propagation loss, SNR and channel capacity 59In-building propagation loss 59SNR and channel capacity 60Applying noise and calculating expected data rates for 802.11n 61
FormsofMIMO 66Channel estimation 67
Glossaryoftermsusedinthisnote 68
References 69

�www.arubanetworks.com
Chapter 1 Preparing for the 802.11n adoption waveThe 802.11n standard heralds a new world for enterprise wireless networks. 802.11n brings higher data rates, longer range and more reliable coverage than previous Wi-Fi technology: it represents a significant upgrade in performance. Not only will 802.1n change what you can expect from a wireless LAN, it will change how you think about wireless technology. For example, you will often want to avoid ‘line of sight’, as 802.11n actually works better when there are signal reflections in the radio path from transmitter to receiver, meaning performance can improve as distance increases.
However, the migration to 802.11n poses some challenges. Most of the benefits will only be realized when 802.11n-capable clients are used with similar infrastructure, as even a few legacy (802.11a/b/g) clients in the cell will drastically reduce overall performance compared to a uniform greenfield 802.11n network. For best performance, LAN edge switch ports and cabling to the access points will require an upgrade to Gigabit Ethernet and the new 802.�at power-over-Ethernet standard.
Migration strategies will require careful planning and patience. In this paper, we will explain the advanced technology introduced in 802.11n, allowing non-specialists to understand its benefits and to plan their own upgrade strategies.
IntroductionWi-Fi technology has carved a path of ever-increasing performance from the earliest pre-802.11 standards through 802.11b to 802.11a/g, with peak data rates rising from 2Mbps to 54Mbps. The latest set of innovations is a package known as 802.11n. As 802.11n is a very new technology, this paper should be considered a snapshot of progress in late 2007, rather than a definitive guide.
We refer in this paper to two key documents that shape the industry, and will endeavour to maintain consistency in using these terms:
• ‘802.11n-Draft2.0’ is a technical standard developed by the IEEE 802.11 working group in early 2007. This is the base technical standard for all 802.11n products. However, 802.11n is not a finished work, and the IEEE continues to develop, refine and (in some cases) correct it.
Chapter 1 - Preparing for the 802.11n adoption wave

4
Designed for Speed - 802.11n Theory and Practice
Aruba Networks
• Meanwhile ‘Draft-n’ is an interoperability certification developed by the Wi-Fi Alliance, a trade association of companies interested in promoting 802.11 products (‘Wi-Fi’ is a Wi-Fi Alliance brand). ‘Draft-n’ is a certification awarded by the Wi-Fi Alliance to indicate a product has passed a set of tests that ensure it will inter-operate with other ‘Draft-n’ products. For this certification, the Wi-Fi Alliance took parts of ‘802.11n-Draft2.0’ and developed a series of tests involving a testbed of early ‘Draft-n’ equipment: thus the certification tests only a subset of the full ‘802.11n-Draft2.0’ functionality. (It is important to distinguish ‘Draft-n’, a certification, from ‘pre-n’ which is a label used by many equipment vendors before the certification was available. Many of these products do indeed interoperate, but they are not certified by any independent organization.)
Benefits for the Enterprise
802.11n includes a number of complex technological advances which are explained in detail later in this paper. However, a focus on the complex technology can distract from the overall concepts and implications for network design.
• Increased capacity. 802.11n enables increased data rates, improving the usable data capacity of a cell from perhaps 15-20 Mbps with 802.11a/g to 100-200 Mbps (see appendix for more analysis). Given that this capacity will be spread over a number of simultaneous users, performance should match or exceed that of a wired 100Mbps Ethernet connection, the standard for desktop connectivity.
• Improved range. An 802.11g connection from AP to client can usefully extend up to 60 metres in open, unobstructed areas but this range drops to only 20 metres in office environments. 802.11n will increase this through multiple-input, multiple-output (MIMO) techniques which involve driving multiple antennas (we used the term ‘antenna chains’ in this note) on the access point and the client. In some parts of the network this will lead to simpler design, with larger cells and fewer APs required to cover a given area.
• More uniform ‘reliable’ coverage. Coverage in Wi-Fi networks is notoriously spotty. A user may have a good signal at some point, but moving the client a short distance, stepping in front of it, or even opening a door across the room can significantly affect the signal strength received, moving the client into a coverage ‘null’ and hence

5www.arubanetworks.com
reducing performance. One contributor to this issue is multipath propagation, and the best technology to counter this to date has been antenna diversity – nearly every Wi-Fi device sports two antennas, and switches between them so when one is in a multipath null, the other should still have a workable signal. The MIMO technology in 802.11n is extremely effective in reducing the effect of multipath nulls.
• Lower network costs. This is a consequence of improved range and more uniform coverage: APs can be spaced further apart. This reduces costs in a number of ways: fewer APs, lower installation costs, possibly fewer LAN edge switch ports, and fewer outdoor APs to cover campus areas between buildings. Conversely, 802.11n APs will initially be more expensive than existing equipment, although we expect this premium will erode over time. Also, where networks, or areas within networks are designed to capacity limits (the bandwidth available per user) rather than range, it may not be possible to increase AP spacing.
Benefits for the user
End users will also benefit from higher data rates, higher throughput and more uniform coverage. For a given group of users in a cell, each will now have access to more bandwidth. The WLAN will no longer be the limiting factor for application performance, overcoming a significant obstacle to un-wiring the desktop. One example of an application that will benefit from 802.11n is video, both interactive and broadcast, which many organizations are beginning to use as an internal communications tool. Earlier 802.11 networks can support video, but its demands are sufficient to stress current installations. Not only will 802.11n provide more bandwidth, it also incorporates many features to optimize video performance.
These benefits will be elusive for a while
While the promise of 802.11n is great, there are many reasons it will be difficult for enterprises to realize its full expected benefits in the short-term. Obstacles include:
• The presence of legacy clients impairs 802.11n’s performance. The benefits outlined above are easy to achieve in a ‘greenfield’ network, where all APs and all clients are 802.11n-capable. However, very few deployments are completely new, particularly on the client side.
Chapter 1 - Preparing for the 802.11n adoption wave
6
Designed for Speed - 802.11n Theory and Practice
Aruba Networks
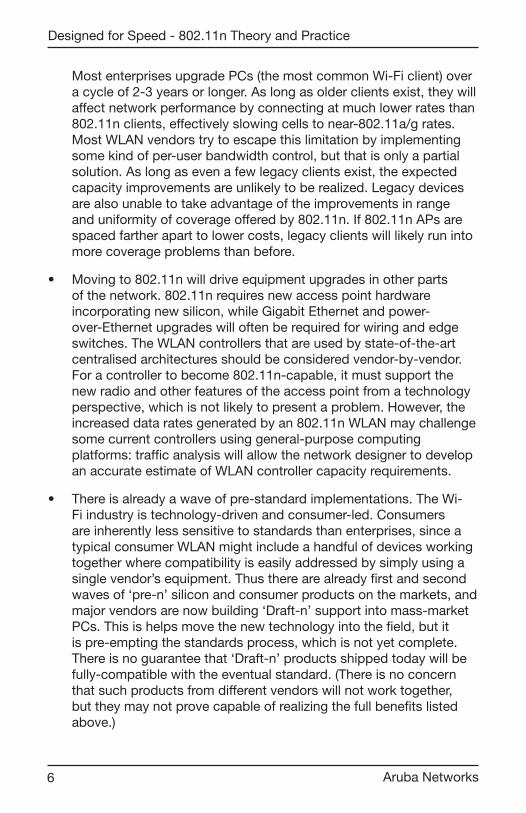
Most enterprises upgrade PCs (the most common Wi-Fi client) over a cycle of 2-� years or longer. As long as older clients exist, they will affect network performance by connecting at much lower rates than 802.11n clients, effectively slowing cells to near-802.11a/g rates. Most WLAN vendors try to escape this limitation by implementing some kind of per-user bandwidth control, but that is only a partial solution. As long as even a few legacy clients exist, the expected capacity improvements are unlikely to be realized. Legacy devices are also unable to take advantage of the improvements in range and uniformity of coverage offered by 802.11n. If 802.11n APs are spaced farther apart to lower costs, legacy clients will likely run into more coverage problems than before.
• Moving to 802.11n will drive equipment upgrades in other parts of the network. 802.11n requires new access point hardware incorporating new silicon, while Gigabit Ethernet and power-over-Ethernet upgrades will often be required for wiring and edge switches. The WLAN controllers that are used by state-of-the-art centralised architectures should be considered vendor-by-vendor. For a controller to become 802.11n-capable, it must support the new radio and other features of the access point from a technology perspective, which is not likely to present a problem. However, the increased data rates generated by an 802.11n WLAN may challenge some current controllers using general-purpose computing platforms: traffic analysis will allow the network designer to develop an accurate estimate of WLAN controller capacity requirements.
• There is already a wave of pre-standard implementations. The Wi-Fi industry is technology-driven and consumer-led. Consumers are inherently less sensitive to standards than enterprises, since a typical consumer WLAN might include a handful of devices working together where compatibility is easily addressed by simply using a single vendor’s equipment. Thus there are already first and second waves of ‘pre-n’ silicon and consumer products on the markets, and major vendors are now building ‘Draft-n’ support into mass-market PCs. This is helps move the new technology into the field, but it is pre-empting the standards process, which is not yet complete. There is no guarantee that ‘Draft-n’ products shipped today will be fully-compatible with the eventual standard. (There is no concern that such products from different vendors will not work together, but they may not prove capable of realizing the full benefits listed above.)

7www.arubanetworks.com
Thus, while the eventual benefits are easy to see, it may prove more difficult to ‘get there from here’. These obstacles can be overcome by carefully considering the plan to migrate from current WLAN installations to a new 802.11n infrastructure.
802.11n migration strategies for enterprises
802.11n includes a number of mechanisms for successful coexistence with legacy 802.11 networks. As noted above, these operating modes impair many of the performance advantages of a greenfield 802.11n network, but they do offer complete support for older 802.11 clients. Thus, 802.11n access points can be installed before any 802.11n clients are present, and operate in 802.11a/b/g mode. It will be possible to mix 802.11n access points within an 802.11a/b/g network, replacing selected existing access points, or deploying new 802.11n access points as an overlay in parallel with an existing 802.11 network: a later section of this note provides more detail on migration strategies.
Since the IEEE will not finalize its technical specification until 2008, the only short-term option for network managers wishing to move to 802.11n is ‘Draft-n’ equipment. This will certainly offer good legacy 802.11 support, but it is currently unknown how the final 802.11n standard may differ from ‘Draft-n’. Our feeling at Aruba is that such differences are likely to be minor, but facts will only become apparent with the passage of time. Aruba suggests that enterprises install ‘Draft-n’ access points for testing with ‘Draft-n’ clients in a pilot or limited trial of the technology. For some enterprises a more widespread deployment may be appropriate, but we suggest doing so only after a consideration of the technology risks.
Finally, before embarking on a technology migration it is useful to assess the requirements and drivers. The most compelling reason to move to 802.11n is to provide greater bandwidth for users. 802.11n will indeed provide increased raw data rates, but for many enterprises there is actually only a limited need to provide greater bandwidth on the wireless network: most current users’ performance is not limited by the WLAN, but by other bottlenecks in the application-delivery network. For those current 802.11 networks where performance is an issue, opportunities for improvement often exist; for instance, by making more use of the 5 GHz band, in similar fashion to a practical 802.11n network. Other measures to improve performance of existing WLANs include providing more access points, reducing the size of the 802.11 cells and increasing the capacity of each cell even as it serves fewer users.
Chapter 1 - Preparing for the 802.11n adoption wave
8
Designed for Speed - 802.11n Theory and Practice
Aruba Networks
These techniques for designing high-performance 802.11 enterprise WLANs have been refined by vendors over a number of years. While the overall network efficiency and performance will fall short of a ‘greenfield’ uniform 802.11n network, such a mid-life upgrade can provide the desired performance improvements for another 12-24 months, by which time the technology risks of moving to 802.11n will have been allayed.
Network design with 802.11n
For RF planning purposes, 802.11n differs from 802.11a/g in utilizing MIMO and the option of a 40MHz channel, which provides approximately twice the data rate of a 20 MHz channel, but uses twice the RF spectrum. Because the 2.4 GHz band has a limited number of channels, the 40 MHz option is unlikely to be used in this band (and this combination is not part of the ‘Draft-n’ certification), although the many other enhancements in 802.11n will still provide significant performance improvements. However, the 40 MHz channel will be popular in the 5 GHz band where channels are plentiful.
Most RF planning tools rely on modeling the reduction of signal strength over distance and across or through RF obstructions. For most purposes, this reduces to a simple calculation of dB loss at a given distance from the AP; knowing the transmit power, the data rate achievable at a given distance from the AP can be easily calculated. For instance, to plan an Aruba network, the required inputs are the dimensions of the floorplan, the minimum data rate desired and the cell overlap factor. Since the propagation characteristics for 802.11n signals should be little different from 802.11a/g, existing RF planning tools such as this one will need little modification.
The new factors that must be considered are the number of antennas on both AP and client, and whether the design should account for legacy clients.
The output of the RF planning tool will be, as before, a ‘grid’ of suggested AP locations that satisfy the input parameters. A benefit of 802.11n should be that a greenfield design with 802.11n clients can be built with fewer APs, but still give better performance than an equivalent 802.11a/g design.
The type, placement and attitude of the antennas, particularly on the AP, may be important to 802.11n performance; most enterprise office deployments will use the captive antennas supplied on the AP. Spacing

�www.arubanetworks.com
the antennas by at least half a wavelength (6.25cm for 2.4GHz or 2.7cm for 5.5GHz) will give better performance.
Wired backhaul from APs & LAN implications
With 802.11a/g, the maximum data rate on the air is 54Mbps, and actual, achievable data throughput tops out at about 26Mbps. Such a rate is easily supported on a 10/100Mbps Ethernet connection for backhaul from the AP. 802.11n rates, however, can move well beyond 100Mbps, at least for peak traffic. A ‘dual-radio’ ‘Draft-n’ access point can generate 600Mbps peak traffic and this is too much for a single connection, so vendors have three options in designing APs:
• Use multiple 10/100 Ethernet connections to the AP. Two (or more) cable drops and two LAN edge switch ports will be needed for each AP location.
• Continue with the current design, with one 10/100 Ethernet, realizing that at peak loads this will be the network bottleneck. In the short-term this may be acceptable: traffic peaks will be widely spaced since clients do not often connect at maximum data rates.
• Provide Gigabit Ethernet connections (10/100/1000). This comprehensively accommodates the traffic load, but may require that cabling is upgraded to Category 5e or Category 6, and that LAN edge switches provide GE ports. Thus far, most infrastructure vendors are providing this GE option.
Other areas of the LAN should be checked for traffic capacity but will probably not require augmentation. This is because the traffic on the upstream connection from the edge switch still represents the same aggregate number of users and applications as when clients were all wired.
The power consumption of 802.11n APs is greater than for 802.11a/g APs, exceeding 802.�af limits (12.�5W maximum can be delivered to a Class � device under 802.11af, now properly termed clause �� of updated 802.�-2005 ). This means the edge switches or in-line power injectors must support the unratified 802.�at standard. Alternatively, the AP must use a local power brick.
Chapter 1 - Preparing for the 802.11n adoption wave

10
Designed for Speed - 802.11n Theory and Practice
Aruba Networks
Implications for rogue APs and WIDS
One significant issue for 802.11n infrastructure will be providing RF monitoring and wireless intrusion detection (WIDS). This is because the ‘rogue AP’ problem will reappear, as employees use 802.11n consumer products at home, find they work and bring them to the office. The only way to reliably identify the traffic using these devices (when in greenfield mode) is to use another 802.11n device such as an 802.11n AP in monitor mode.
Once 802.11n is deployed, WIDS will need some enhancements to identify characteristics of 802.11n-specific attacks, but as most attacks are at higher levels than the PHY, the current WIDS functionality will be portable to 802.11n.
Good-neighbour (or bad-neighbour) strategies
802.11n networks will often overlap with other 802.11 networks. In some cases the network manager will wish to cooperate with these neighbours, while in others it may be better to use non-coexisting modes, supporting higher throughput, and to ignore occasional interference. 802.11n allows a number of strategies.
Several forms of interference are possible:
• If an 802.11n network is operating in ‘greenfield’ mode, its transmissions will not be comprehensible to 802.11a/b/g APs and clients. Therefore, even though neighbouring cells may be operating in the same RF channel, the transmissions from one cell (AP and clients) will appear as noise bursts to the other. This interference will work in both directions: 802.11n transmissions are likely to be affected as much as the legacy network.
• An 802.11n network using a 40 MHz channel will have just this effect in the 5 GHz band. In 2.4 GHz, because the channel boundaries of 802.11n do not line up with the traditional channels used in 802.11b/g (channels 1, 6, 11), transmissions will inevitably overlap in frequency. This one reason such 40 MHz operation at 2.4 GHz is not recommended. However, it is quite reasonable to use 802.11n in 20 MHz channels in the 2.4 GHz band.
• An 802.11n network operating in mixed-mode is entirely compatible with overlapping 802.11a/b/g cells. In this mode, all transmissions

11www.arubanetworks.com
are prefixed by a preamble that uses legacy modulation, allowing such networks to coexist.
• Another optional mechanism, Phased Coexistence Operation (PCO) allows an AP to alternate between a 40 MHz channel and each of the constituent 20 MHz channels. The AP sets the Network Availability Vector (NAV) on the 20 MHz channels to inhibit transmissions for a time, during which it and whatever 40 MHz-capable clients it supports switch to 40 MHz operation.
Chapter 1 - Preparing for the 802.11n adoption wave
12
Designed for Speed - 802.11n Theory and Practice
Aruba Networks
Chapter 2 Technology in 802.11nThe ‘802.11n-Draft2.0’ standard includes several key technologies and features. This section includes a brief but technical treatment of all significant new technologies.
• High throughput PHY (physical layer): MIMO. The new PHY uses Orthogonal Frequency Division Multiplexing (OFDM) modulation with additional coding methods, preambles, multiple streams and beam-forming. These features can support higher data rates, longer ranges, and a much larger range of data rates than earlier 802.11 standards. The MIMO technique that is synonymous with 802.11n belongs in this section.
• High throughput PHY: 40 MHz channels. Two adjacent 20 MHz channels are combined to create a single 40 MHz channel. This relatively simple technique, already used in some point-to-point bridges and consumer equipment, more than doubles the effective data rate under a given set of RF conditions.
• Efficient MAC: MAC aggregation. Two MAC aggregation methods are supported to efficiently pack smaller packets into a larger frame. This reduces the number of frames on the air, and reduces the time lost to contention for the medium, improving overall throughput.
• Efficient MAC: Block Acknowledgement. Particularly for streaming traffic such as video, a performance optimization where one acknowledgement can cover many transmitted frames, so an ack is no longer required for every frame. This technique was first introduced in 802.11e.
• Power Saving: power save multi-poll. This is an extension of the U-APSD and S-APSD concepts introduced in 802.11e.
Techniques for high-throughput PHY802.11n marks a significant increase in complexity over previous ver-sions, giving it excellent performance, but adding to the burdens of those explaining the technology. Several different techniques are used, and at times combined, to give the improved PHY performance. We will examine some of these techniques in this section, particularly those dealing with the advantages of multiple antenna systems.

1�www.arubanetworks.com
Legacy 802.11 equipment only drives one antenna at a time, and only receives on one antenna at a time, usually the same antenna. ‘802.11n-Draft2.0’ assumes that multiple antennas are used for either or both the transmit and receive functions. There are four distinct algorithms at work:
• Maximum ratio combining is a receiver function, where signals received on multiple antennas, whether from one or a number of transmit antennas, can be combined to improve the signal-to-noise ratio. MRC is an antenna diversity technique that can increase range for a given data rate.
• Space-time block coding can be used where there are multiple transmit antennas, regardless of the number of receive antennas. STBC is an antenna-diversity technique that improves the signal-to-noise ratio at the receiver, also allowing an increased range for a given data rate.
• Spatial division multiplexing is the technique most often associated with MIMO. Rather than increasing range, SDM sends different ‘spatial streams’ of data from each transmit antenna. Since these streams carry different data, the overall data rate of the system is increased. Under good conditions, a MIMO system of two transmit and two receive antennas doubles the achievable data rate over a single-antenna (SISO) system.
• Transmit beamforming is a technique where signals sent to multiple transmit antennas can be phased such that the RF power at a targeted receive antenna is maximized. TxBF is discussed here even though the technique is not included in ‘802.11n-Draft2.0’.
High Throughput PHY: Maximum Ratio Combining
MRC is an established technique using multiple receive antennas to extract a better signal: it requires more than one receive antenna chain, but can work with a single transmit antenna. Since ‘Draft-n’ equipment already features multiple independent receive chains, MRC is easily added to ‘Draft-n’ products.
Chapter 2 - Technology in 802.11n
14
Designed for Speed - 802.11n Theory and Practice
Aruba Networks
AB
1
2SNR
time
0
3
-3
-6
6
9
12
(dB)SNR 1
SNR 2
Combined SNR
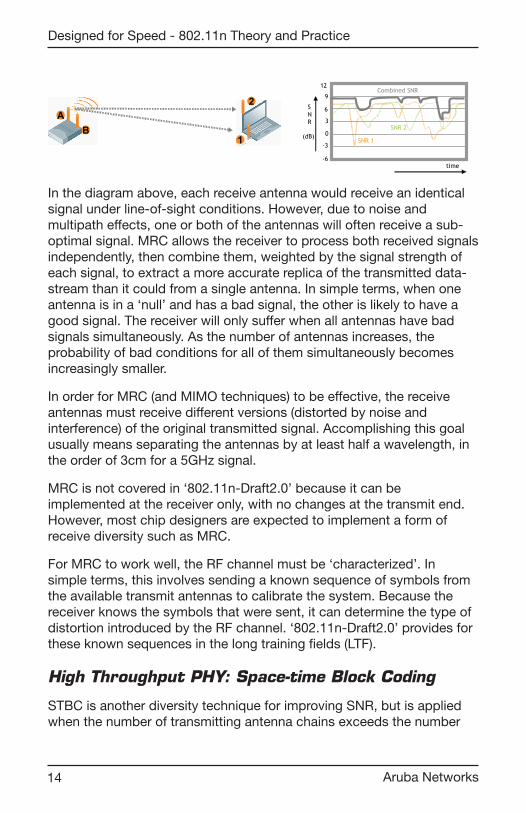
In the diagram above, each receive antenna would receive an identical signal under line-of-sight conditions. However, due to noise and multipath effects, one or both of the antennas will often receive a sub-optimal signal. MRC allows the receiver to process both received signals independently, then combine them, weighted by the signal strength of each signal, to extract a more accurate replica of the transmitted data-stream than it could from a single antenna. In simple terms, when one antenna is in a ‘null’ and has a bad signal, the other is likely to have a good signal. The receiver will only suffer when all antennas have bad signals simultaneously. As the number of antennas increases, the probability of bad conditions for all of them simultaneously becomes increasingly smaller.
In order for MRC (and MIMO techniques) to be effective, the receive antennas must receive different versions (distorted by noise and interference) of the original transmitted signal. Accomplishing this goal usually means separating the antennas by at least half a wavelength, in the order of �cm for a 5GHz signal.
MRC is not covered in ‘802.11n-Draft2.0’ because it can be implemented at the receiver only, with no changes at the transmit end. However, most chip designers are expected to implement a form of receive diversity such as MRC.
For MRC to work well, the RF channel must be ‘characterized’. In simple terms, this involves sending a known sequence of symbols from the available transmit antennas to calibrate the system. Because the receiver knows the symbols that were sent, it can determine the type of distortion introduced by the RF channel. ‘802.11n-Draft2.0’ provides for these known sequences in the long training fields (LTF).
High Throughput PHY: Space-time Block Coding
STBC is another diversity technique for improving SNR, but is applied when the number of transmitting antenna chains exceeds the number
15www.arubanetworks.com
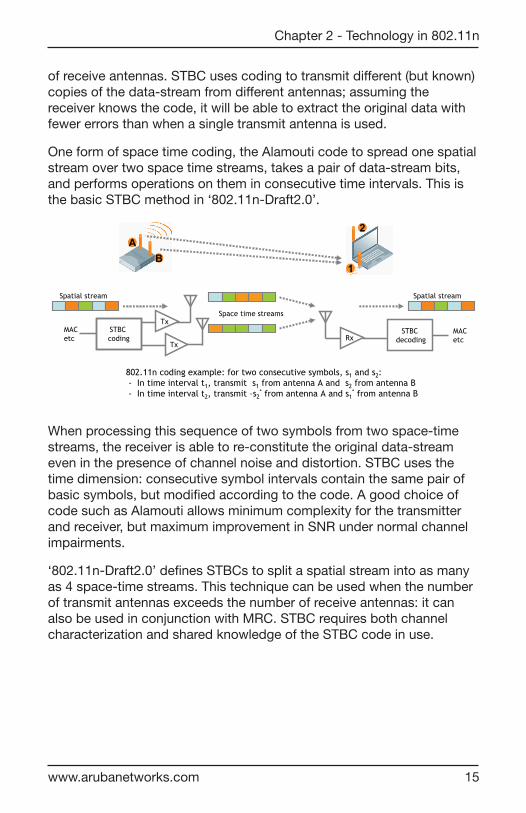
of receive antennas. STBC uses coding to transmit different (but known) copies of the data-stream from different antennas; assuming the receiver knows the code, it will be able to extract the original data with fewer errors than when a single transmit antenna is used.
One form of space time coding, the Alamouti code to spread one spatial stream over two space time streams, takes a pair of data-stream bits, and performs operations on them in consecutive time intervals. This is the basic STBC method in ‘802.11n-Draft2.0’.
AB
1
2
STBCcoding
Tx
Tx
MACetc
STBCdecodingRx
MACetc
Spatial stream Spatial stream
Space time streams
802.11n coding example: for two consecutive symbols, s1 and s2:- In time interval t1, transmit s1 from antenna A and s2 from antenna B- In time interval t2, transmit –s2
* from antenna A and s1* from antenna B
When processing this sequence of two symbols from two space-time streams, the receiver is able to re-constitute the original data-stream even in the presence of channel noise and distortion. STBC uses the time dimension: consecutive symbol intervals contain the same pair of basic symbols, but modified according to the code. A good choice of code such as Alamouti allows minimum complexity for the transmitter and receiver, but maximum improvement in SNR under normal channel impairments.
‘802.11n-Draft2.0’ defines STBCs to split a spatial stream into as many as 4 space-time streams. This technique can be used when the number of transmit antennas exceeds the number of receive antennas: it can also be used in conjunction with MRC. STBC requires both channel characterization and shared knowledge of the STBC code in use.
Chapter 2 - Technology in 802.11n

16
Designed for Speed - 802.11n Theory and Practice
Aruba Networks
High Throughput PHY: Spatial Division Multiplexing
802.11n achieves its significant improvements in data rate through the use of MIMO (Multiple Input, Multiple Output) spatial division multiplexing. SDM requires MIMO, specifically the transmitting and receiving stations must each have multiple RF chains with multiple antennas – it does not work where either station has only a single antenna chain. The diagram shows the simplest MIMO system, with two transmitting and two receiving antenna chains (2 spatial streams).
AB
1
2
Signalprocessing
Tx
Tx
MACetc
Signalprocessing
Rx
Rx
MACetc
Each antenna is connected to its own RF chain for transmit and receive. The baseband processing on the transmit side can synthesize different signals to send to each antenna, while at the receiver the signals from different antennas can be decoded individually. (We will simplify this explanation by showing only one direction of transmission, practical systems will transmit in both directions.)
Under normal, line of sight conditions, the receiving antennas all ‘hear’ the same signal from the transmitter. Even if the receiver uses sophisticated techniques to separate the signals heard at antennas 1 and 2, it is left with the same data. If the transmitter attempts to send different signals to antennas A and B, those signals will arrive simultaneously at the receiver, and will effectively interfere with each other. There is no way under these conditions to better the performance of a non-MIMO system: one might as well use only one antenna at each station.

17www.arubanetworks.com
AB
1
2
(Nearly all 802.11 stations built to date actually use two antennas. However, this is not MIMO – the radio switches a single radio chip from one antenna to the other, so only one is used at any time. Using two antennas in this way helps to negate the effects of multipath, as when one antenna is in a multipath ‘null’, the other is likely to have a better signal. It is generally reckoned that using antenna diversity in this way improves overall reception by perhaps �-6 dB, although the effect is of course statistical. MIMO is different in that both antennas are driven by or receiving signals at all times, and those transmitted signals need not be identical.)
AB
1
2
However, if there is sufficient RF distortion in the path, receiving antennas will see different signals from each transmit antenna. The transmit antenna radiates a signal over a broad arc, and it scatters and reflects off various objects in the surrounding area. Each reflection entails a loss of signal power and a phase shift, and the longer the reflected path, the more delay is introduced relative to a line-of-sight signal. In the past, multipath has been the enemy of radio systems, as the receiver sees a dominant signal (line of sight if it is present), and all the multipath signals tend to interfere with it, effectively acting as noise or interference and reducing the overall throughput of the system. Multipath effects also change over time, as objects in the path move, and movement of reflecting objects results in a Doppler shift of the frequency of the received signal, further complicating the control mechanisms needed to counter multipath.
Chapter 2 - Technology in 802.11n

18
Designed for Speed - 802.11n Theory and Practice
Aruba Networks
To understand how MIMO works, first consider the signal each receive antenna sees in a multipath environment.
a
b c
a
b
c
Rec
eive
dpow
erle
vel
time
Dominant signal at Rx antenna 1 isfrom path a. Path b, c and othermultipath signals cause somedegradation to the dominant signal– a similar effect to higherbackground noise.
Total throughput (per unit time) from transmitter to receiver =
-a b
AB
1
2
In this example there are � multipath signals arriving at antenna 2. The strongest is signal a, and the information carried in this signal will be decoded. Other signals arrive at lower power levels, and they are time-shifted (or phase-shifted) compared to a, so it is likely they will degrade the overall signal-to-noise ratio associated with a.

1�www.arubanetworks.com
A2B2
A1
B1
B1
A1
B2
A2
Dominant signal at Rx antenna1 is from Tx antenna A (B1signal and other multipathsignals cause some degradation)
Dominant signal at Rx antenna2 is from Tx antenna B (A2signal and other multipathsignals cause some degradation)
Rec
eive
dpow
erle
vel
time
Total throughput (per unit time) from transmitter to receiver =
+
AB
1
2
When multiple antennas are considered, however, MIMO offers considerable gains in throughput. The example above shows that each receive antenna receives its dominant signal from a different transmit antenna: receiver 1 uses transmitter A while receiver 2 uses transmitter B. When the system understands this, it can take advantage by transmitting different signals from each antenna, knowing each will be received with little interference from the other. Herein lies the genius of MIMO.
(In fact the technique is more sophisticated, using RF channel characterization as explained earlier in this paper: it is not necessarily the case that individual signal paths can be drawn between pairs of transmit-receive antennas, but given that the nature of the cross
Chapter 2 - Technology in 802.11n

20
Designed for Speed - 802.11n Theory and Practice
Aruba Networks
coupling is known at the receiver, and that mathematical conditions for the channel are favourable, this is the overall effect.)
S2insignal
processingMACetc
S1 in
S2out
S1 out
V11
V21
V12
V22
signalprocessing
MACetc
U11
U21
U12
U22
The diagram above shows a more detailed explanation of MIMO implementation. At the transmit side, signal processing provides real and imaginary outputs S1in and S2in. These are then mixed with different weights V11 etc, before the signals are combined and delivered to the transmit antennas. A similar mixing function processes signals from the receive antennas using weights U11 etc. Provided the RF characteristics are known, the weights U11… can be calculated and set for optimum throughput, given the RF channel conditions.
The most favourable case would be where each transmit-receive pair operates with a completely independent RF path: a 2x2 (2 antennas at each station) system will have double the throughput of a single-antenna 1x1 system, and a �x� configuration could extend to triple the throughput. 802.11n defines MIMO configurations from 2x1 to 4x4 antennas and up to spatial streams.
MIMO is the most difficult aspect of 802.11n to understand: multipath (reflected RF between transmitter and receiver) is normally the enemy of performance, but with MIMO it can be used constructively. Line of sight normally gives the best performance, but with MIMO it provides just baseline data rates. (Note, however, that reflected signals are usually much weaker than primary, line-of-sight signals. Even though losing line-of-sight may allow use of more RF paths and hence the additive MIMO effect, the signal-to-noise ratio of each path may be considerably worse than previously. It is difficult to predict the relative weight of these two opposing effects.)
As noted above, MIMO works best when antennas are positioned more than half a wavelength apart. For 5.5 GHz, half a wavelength is about 2.7 cm or one inch. The ‘802.11n-Draft2.0’ standard mandates at least two spatial streams (antennas) for access points and one spatial stream for client devices, with a maximum of 4 spatial streams per device.

21www.arubanetworks.com
One key question in MIMO systems is how to tune the transmit signals at different antennas for optimum reception at the receiver. ‘802.11n-Draft2.0’ offers different methods for this. With implicit feedback the MIMO transmitter characterizes signals from the receiver, and assumes that the channel is reciprocal – reflections and impairments operate equally in both directions. This is a reasonable approximation for most purposes, but better performance is achieved when the receiver sends explicit feedback messages to the transmitter; with these, the transmitter can accurately tune its signals for optimum reception and best signal to interference and noise ratios at the receiver.
High throughput PHY: Transmit Beamforming (TxBF)
Transmit beamforming is a technique that has been used in radio for many years; it is included in the ‘802.11n-Draft2.0, but is not part of the ‘Draft-n’ certification, and will not be seen in products until 2008 at the earliest. Beamforming will allow an AP to ‘focus’ its transmission to a particular client in the direction of that client (and vice versa for a client with multiple antennas), allowing higher signal to noise ratios and hence higher data rates than would otherwise be the case.
Identical RF signals are transmittedfrom each antenna, but very slightlyoffset in time (phase)
A
B
C
Tra
nsm
itte
dpow
erle
vel
time
tcb
tca
A
B
C
Rec
eive
dpow
erle
vel
time
Transmit timing offsets arecalculated to match the path delaysof the different RF beams, so all signals are directed at the target in phase -
This results in constructiveinterference, and a highersignal-to-noise ratio at thereceive antenna
A
BC
Normal isotropicradiation pattern
Directional pattern afterbeamforming
By carefully controlling the time (or phase) of the signal transmitted from multiple antennas, it is possible to shape the overall pattern of the received signal, emulating a higher-gain, or directional antenna in the direction of the target. The same implicit and explicit feedback mechanisms used to characterize the MIMO channel allow beamforming.
Chapter 2 - Technology in 802.11n
22
Designed for Speed - 802.11n Theory and Practice
Aruba Networks
In practice, beamforming may be used when MIMO with SDM is not effective. This is because beamforming aims to produce a single, coherent RF signal at the receiver, while SDM relies on multiple, independent signals.
Beamforming will only work well with 802.11n clients, as it works best with explicit feedback messages from the client. This highlights a difference from some other ‘adaptive antenna’ or ‘beam steering’ technologies: in 802.11n, the beam is not based on an indication of the direction of a client, but rather on the actual RF conditions at its antennas; hence the requirement for explicit feedback messages.
MIMO, STBC, SDM, Beamforming… terminology
In this note, we use the term ‘MIMO’ (Multiple Input, Multiple Output) for any system where the transmitter has a number of antenna chains (antennas that can be powered simultaneously with independent signals) and/or receiver chains. Many commentators use terms such as ‘SIMO’, ‘SISO’: we see these as degenerate forms of MIMO, but there is a brief explanation in the Appendix. A MIMO system can use a variety of techniques to improve range and/or data rate.
The key technique associated with MIMO is ‘SDM’ (spatial division multiplexing). For our purposes, these are related terms: SDM provides a MIMO system with its superior data throughput. SDM allows transmission of multiple streams of data, enabling higher data throughput due to the multiple antenna chains.
The following diagrams explain the difference between MIMO/SDM, STBC, MRC and transmit beamforming as used in this document.

2�www.arubanetworks.com
AB
1
2
SDM combined with antenna diversity. In this example, the path between the A-3 antennapair has different RF characteristics from the other antenna pairs: it offers RF diversity,and carries one spatial stream. The other inter-antenna paths, B/C to 1/2, are not RF-isolated, so they cannot only be used for one further spatial stream. However, transmitbeamforming or receive antenna diversity may be used to optimise this spatial stream. Inthis case a system with 3 transmit and 3 receive antennas nevertheless supports only 2spatial streams.
C
3
P1a
P1b
P1a
P1b
P1a
P1b
P1P1 P1P1
AB
AB 1
2
1
2P1a
P1b
P1a
P1b
P1a
P1b
MIMO with Spatial Diversity Multiplexing (SDM) and Space Time Block Coding (STBC).Independent paths between pairs of antennas allow data transmission in parallel: datapackets (P1) are interleaved and mapped to different paths, where they may be encodedat a different data rate for each path, depending on RF conditions. The receiverinterleaver re-builds the original packet.
P1P1P1P1P1P1P1P1
AB
AB
1
2
1
2
P1
P1
P1P1
Transmit beamforming. The transmitter sends a single stream of data, adjusting thesignal from each antenna to ensure the optimal signal forms at the receiving antenna. Thisis used where there is little RF separation between the different inter -antenna paths, soSDM is not useful.
AB
AB
1
2
1
2
P1 P1
Receive antenna spatial diversity. Working on only one transmitted signal, the receivercan use RF combining techniques on signals from different receive antennas to achievehigher signal-to-noise ratios and higher data rates.
P1
While SDM is a multiplexing technique to increase overall data rate, STBC and MRC are diversity techniques that improve the signal to noise and interference ratio, SNR or SINR. These techniques can be combined under some conditions.
Chapter 2 - Technology in 802.11n
24
Designed for Speed - 802.11n Theory and Practice
Aruba Networks
802.11n MIMO configurations and terminology
A full specification of an 802.11n system includes a number of parameters. MIMO is often defined as MxN: e.g. 2x2, �x�. In this case M refers to the number of transmit antennas configured, and N to the number of antennas at the receiver. Next the number of spatial streams must be specified. While for most access points this will be the same as the number of antennas, many clients, particularly where power consumption, processing or size is a concern, may have ‘asymmetric’ capabilities. 802.11n offers MIMO specifications up to 4x4, with 4 spatial streams.
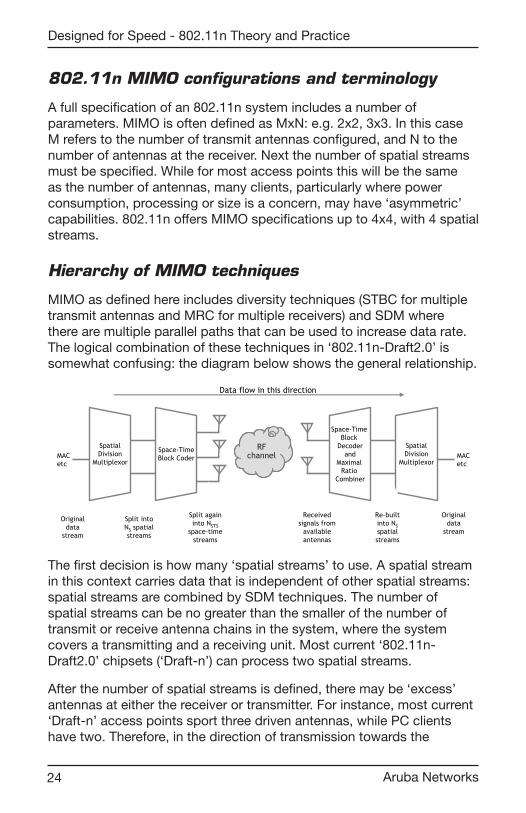
Hierarchy of MIMO techniques
MIMO as defined here includes diversity techniques (STBC for multiple transmit antennas and MRC for multiple receivers) and SDM where there are multiple parallel paths that can be used to increase data rate. The logical combination of these techniques in ‘802.11n-Draft2.0’ is somewhat confusing: the diagram below shows the general relationship.
MACetc
SpatialDivision
Multiplexor
Space-TimeBlock Coder MAC
etc
SpatialDivision
Multiplexor
Space-TimeBlock
Decoderand
MaximalRatio
Combiner
RFchannel
Data flow in this direction
Originaldata
stream
Split intoNS spatialstreams
Split againinto NSTS
space-timestreams
Receivedsignals from
availableantennas
Re-builtinto NSspatialstreams
Originaldata
stream
The first decision is how many ‘spatial streams’ to use. A spatial stream in this context carries data that is independent of other spatial streams: spatial streams are combined by SDM techniques. The number of spatial streams can be no greater than the smaller of the number of transmit or receive antenna chains in the system, where the system covers a transmitting and a receiving unit. Most current ‘802.11n-Draft2.0’ chipsets (‘Draft-n’) can process two spatial streams.
After the number of spatial streams is defined, there may be ‘excess’ antennas at either the receiver or transmitter. For instance, most current ‘Draft-n’ access points sport three driven antennas, while PC clients have two. Therefore, in the direction of transmission towards the

25www.arubanetworks.com
client, the access point has an excess transmitter. This transmitter can be used to provide better performance by implementing STBC. The STBC encoder takes the two spatial streams from the SDM block, and expands them to form three signals to drive the transmit antennas.
At the receiver, antenna chains are programmed for the STBC used at the transmitter, and may use whatever MRC capabilities the designer implements. In this case one would not expect any gains from MRC, as there are (to approximate to a simple model) two antennas receiving two spatial streams. The combined system gains bandwidth from SDM, and some SNR gains from STBC: in practice, SNR may translate to a higher data-rate for a given range, or a longer range for a given data-rate, it’s the implementer’s choice.
The diagram below shows the reverse link, where the transmitter has two antenna chains and the receiver three. Now, it is not possible to use an STBC gain, as there are no ‘excess’ transmit antennas, but the MRC processing the receiver realizes from its excess antenna will provide approximately the same gain.
MACetc
SpatialDivision
Multiplexor
Space-TimeBlock Coder MAC
etc
SpatialDivision
Multiplexor
Space-TimeBlock
Decoderand
MaximalRatio
Combiner
RFchannel
Data flow in this direction
Originaldata
stream
Split intoNS spatialstreams
Split againinto NSTS
space-timestreams
Receivedsignals from
availableantennas
Re-builtinto NSspatialstreams
Originaldata
stream
High Throughput PHY: 40 MHz channels
All earlier versions of 802.11 have used 20 MHz channels, defined in the 2.4 GHz and 5 GHz bands. Some vendors have increased throughput, particularly in point-to-point bridging applications by using two adjacent channels simultaneously, usually modulating each channel separately then combining the streams at the far end.
‘802.11n-Draft2.0’ specifies operation in the same 20 MHz channels used by 802.11b/g in the 2.4 GHz and 802.11a in the 5 GHz bands, but adds a mode where a full 40-MHz wide channel can be used. As might
Chapter 2 - Technology in 802.11n

26
Designed for Speed - 802.11n Theory and Practice
Aruba Networks
be expected, this offers approximately twice the throughput of a 20 MHz channel. However, while in the 5 GHz band the channels are defined as pairs of existing 20 MHz channels, they do not line up with commonly-used 20 MHz channels in the 2.4 GHz band, as these channels are not adjacent. This means that when a 40 MHz channel is used in 2.4 GHz, it will interfere with at least one other 802.11b/g channel.
High Throughput PHY: Shorter guard interval
The diagram shows how the guard interval is used in OFDM. 802.11 uses complex modulation techniques with OFDM, where groups of input data are coded into a single OFDM symbol at RF.
a
b
c
a
b
c
Rec
eive
dpow
erle
vel
time
802.11n (also 802.11a/g)transmission is by OFDM symbols(examples N, N+1, N+2). Multipathincreases delay spread at thereceiver; the guard interval preventsinter-symbol interference. In thisexample, path b is within the guardinterval while c causes inter-symbolinterference.
AB
1
2
N N+1 N+2
N N+1 N+2
N N+1 N+2
Previous 802.11 standards used a guard interval of 800nsec. 802.11n adds an optionfor 400nsec, negotiated between receiver and transmitter, for cases where the worst-case multipath delay is low. (propagation in free-space, delay = distance x 0.3metres/nsec, so 400nsec is equivalent to 120metres path difference.)
Guardinterval
Inter-symbolinterference
For best (least-error) decoding, the symbol must arrive at the receiver without any interference or noise. Previous sections of this document have shown how ‘802.11n-Draft2.0’ uses MIMO to improve reception of multipath, but this only works symbol-by-symbol. Inter-symbol interference occurs when the delay between different RF paths to the receiver exceeds the guard interval, causing a reflection of the previous symbol to interfere with the strong signal from the current symbol: a form of self-interference.

27www.arubanetworks.com
The optional 400nsec short guard interval in 802.11n can be used when the path difference between the fastest and slowest RF paths is less than that limit. The diagram includes a quick path loss calculation, but in reality, indoor multipath reflections can reach 400nsec relatively easily. This means the shorter guard interval will be very useful in consumer settings, but cannot be relied upon when planning for enterprise deployments.
High Throughput PHY: More subcarriers
Through advances in implementation, it is now possible to squeeze more OFDM subcarriers (each subcarrier allows more data to be transmitted over the RF channel) in a 20MHz or 40 MHz channel.
52 subcarriers (48 usable) for a 20 MHznon-HT mode (legacy 802.11a/g) channel
fc +10MHz-10MHz
26 carriers 26 carriers
56 subcarriers (52 usable) for a 20MHz HT mode (802.11n) channel
fc +10MHz-10MHz
28 carriers 28 carriers
114 subcarriers (108 usable) for a 40 MHz HT mode (802.11n) channel
fc +10MHz-20MHz
57 carriers 57 carriers
+20MHz-10MHz
The additional subcarriers effectively add bandwidth to the channel, allowing increased data rates for a given modulation type (see the section below on new modulation rates).
High Throughput PHY: New Modulation Rates
Radio systems have to adapt to the signal and noise characteristics of the RF path, and they accomplish this by changing the modulation rate. For a given SNR (signal to noise ratio) the system will change the modulation rate to provide the best compromise between data rate and error rate: at any point, modulating for a higher data rate will increase the error rate. This is a continuous decision-making process, the transmitter relying on feedback from the receiver about its SNR to adjust the transmit modulation.
Chapter 2 - Technology in 802.11n

28
Designed for Speed - 802.11n Theory and Practice
Aruba Networks
While 802.11a and g specify 8 rates (6, �, 12, 18, 24, �6, 48 and 54 Mbps), 802.11n provides many more: over �00. However, the basic set is of 8 rates:
Basic rates of 802.11n (Mbps) 20 MHz channel; single stream; 800 nsec GI; equal modulation
6.5 1� 1�.5 26 �� 52 58.5 65
This is a set of rates for one spatial stream in a 20 MHz RF channel and with an 800 nsec guard-interval and ‘equal modulation’ on all spatial streams. This basic set of rates is comparable to the 802.11b/g rates above: each rate is improved by about 8% (e.g. 18 to 1�.5 Mbps) by using slightly wider bandwidth, more subcarriers and improved modulation. The 65 Mbps rate has no equivalent in 802.11a/g: it uses 5/6 coding, a higher rate than the previous maximum of �/4.
Other rates are generally derived as multiples of the basic rates above:
Basic rates of 802.11n (Mbps) 20 MHz channel; single stream; 800 nsec GI; equal modulation
1� 26 �� 52 78 104 117 1�0
Rates of 802.11n (Mbps) 40 MHz channel; single stream; 800 nsec GI; equal
1�.5 27 40.5 54 81 108 121.5 1�5
The 40 MHz channel allows slightly more than twice the data rate of two 20MHz channels.
Rates of 802.11n (Mbps) 20 MHz channel; single stream; 400 nsec GI; equal modulation
7.2 14.4 21.7 28.� 4�.� 57.8 65 72.2
The shorter 400nsec guard interval allows slightly higher data rates than 800nsec.
Rates of 802.11n (Mbps) 20 MHz channel; two streams; 800 nsec GI; unequal modulation
�� 52 65 58.5 78 �7.5

2�www.arubanetworks.com
For a given system, the range of choices will be smaller than the tables above or below would indicate, because some of these factors are fixed for a given system:
• 20 MHz or 40 MHz channel. As discussed elsewhere in this paper, a 40 MHz channel will not often be feasible for an enterprise deployment in the 2.4 GHz band. However 40 MHz channels are likely to be widespread in the 5 GHz band.
• Spatial streams. As described above, it will be quite usual for the number of supported spatial streams to be smaller than the number of antenna chains – either because of silicon processing capabilities or because the client has fewer antenna chains than the AP. For instance, client state of the art �x� systems in late 2007 only support 2 spatial streams. Also, where there is insufficient RF path isolation between streams, even a 2x2 system may not be able to support 2 diverse streams.
• Guard interval. The guard interval is the time between OFDM symbols in the air. Normally it will be 800 nsec: the option is for a 400 nsec guard interval, but as noted above, reliable detection with this value may be challenging under indoor conditions.
• Convolutional coding. When data arrives at the PHY layer for transmission, it is scrambled and coded. This alters its spectral characteristics in order to achieve the best signal-to-noise ratio, and also includes built-in error correction, known as convolutional coding. The 802.11n standard includes BCC (block convolutional coding), as included in previous 802.11 standards, but also adds an option for LDPC (low density parity check) coding, which can improve effective throughput for given RF conditions.
• Modulation. All spatial streams may use the same (equal) modulation, or they may carry different (unequal) modulation and coding. An example might be where there are three spatial streams with good MIMO characteristics, but one stream has a high noise floor or a low signal level: under these conditions the weak stream would support a lower data rate than the other streams.
Chapter 2 - Technology in 802.11n

�0
Designed for Speed - 802.11n Theory and Practice
Aruba Networks
Data rate ranges for various 802.11n system parameters
EqualModulation
ChannelWidth (MHz)
GuardInterval(nsec)
Numberof
streams
Minimum
PHY rate (Mbps)
MaximumPHY rate (Mbps)
Number of rates
YES 20 800 1 6.5 65 8YES 20 400 1 7.2 72.2 8YES 20 800 2 1� 1�0 8YES 20 400 2 14.4 144.4 8YES 20 800 � 1�.5 1�5 8YES 20 400 � 21.7 216.7 8YES 20 800 4 26 260 8YES 20 400 4 28.� 288.� 8YES 40 800 1 1�.5 1�5 8YES 40 400 1 15 150 8YES 40 800 2 27 270 8YES 40 400 2 �0 �00 8YES 40 800 � 40.5 405 8YES 40 400 � 45 450 8YES 40 800 4 54 540 8YES 40 400 4 60 600 8NO 20 800 2 �� �7.5 6NO 20 400 2 4�.� 108.� 6NO 20 800 � 52 156 14NO 20 400 � 57.8 17�.� 14NO 20 800 4 65 214.5 24NO 20 400 4 72.2 2�8.� 24NO 40 800 2 81 202.5 6NO 40 400 2 �0 225 6NO 40 800 � 108 �24 14NO 40 400 � 120 �60 14NO 40 800 4 1�5 445.5 24NO 40 400 4 150 4�5 24

�1www.arubanetworks.com
High Throughput PHY: Duplicate format
Non-HT (legacy) duplicate format defines the subcarriers used for transmitting in mixed-mode, where each half of the 40 MHz channel is used separately: it’s the same format used by 802.11a/g devices. This makes the 802.11n access point compatible with legacy devices.
52 x 2 subcarriers (96 usable) for a 40 MHz duplicate format (802.11n)channel (applicable to greenfield and mixed-modes)
fc +10MHz-20MHz
52 carriers 52 carriers
+20MHz-10MHz
Techniques to enhance the MAC
MAC layer enhancements: Frame aggregation
A client (or AP) must contend for the medium (a ‘transmit opportunity’ on the air) with every frame it wishes to transmit. This results in contention, collisions on the medium and backoff delays that waste time that could be used to send traffic. ‘802.11n-Draft2.0’ incorporates mechanisms to aggregate frames at stations, and thus reduce the number of contention events. Many tests have shown the efficacy of this effect in prior 802.11 standards. For instance, in 802.11g, a given configuration can send 26 Mbps of data using 1500 Byte frames, but when the frame length is reduced to 256 Bytes, throughput drops to 12 Mbps.
With MAC-layer aggregation, a station with a number of frames to send can opt to combine them into an aggregate frame (MAC MPDU). The resulting frame contains less header overhead than would be the case without aggregating, and because fewer, larger frames are sent, the contention time on the wireless medium is reduced.
Two different mechanisms are provided for aggregation, known as Aggregated MSDU (A-MSDU) and Aggregated-MPDU (A-MPDU). The figure below shows the general architecture:
Chapter 2 - Technology in 802.11n

�2
Designed for Speed - 802.11n Theory and Practice
Aruba Networks
MAC processing
P1 P2 P3
P1 P2 P3
MACheader P1 P2 P3
P1 P2 P3
MACheaderP1 P2 P3
MAC processing
MSDU (MAC Service Data Unit)
MPDU (MAC Protocol Data Unit)MAC
headerMAC
header
Aggregated MSDU format (A-MSDU) Aggregated MPDU format (A-MPDU)
Applications
PHY layer
MAC processing
In the A-MSDU format, multiple frames from higher layers are combined and processed by the MAC layer as a single entity. Each original frame becomes a subframe within the aggregated MAC frame, with its own sub-header containing source & destination addresses and length. Thus this method can be used for frames with differing source and destination addresses, but only MSDUs of the same priority (access class, as in 802.11e) can be aggregated.
An alternative method, A-MPDU format, allows concatenation of MPDUs into an aggregate MAC frame. Each individual MPDU is encrypted and decrypted separately. Since MPDUs are packed together, this method cannot use the earlier 802.11 per-MPDU acknowledgement mechanism for unicast frames. A-MPDU must be used with the new Block Acknowledgement function of ‘802.11n-Draft2.0’.
In order to accommodate aggregated MAC frames, the maximum frame length accepted by the PHY is increased from 40�5 in previous standards to 655�5.
MAC layer enhancements: Multiple Traffic ID Block Acknowledgement (MTBA)
Earlier 802.11 standards demanded an ack frame for every unicast data frame transmitted. The new block ack feature allows a single ack frame to cover a range of received frames. This is particularly useful for streaming video and other high-speed transmissions, but if a frame has not been received, there will be a delay before a non-acknowledge is received and re-transmission can be accomplished: this is not often a problem with broadcastvideo, where re-transmission is

��www.arubanetworks.com
often not feasible, given the time constraints of the media, but may be problematic for other real-time applications.
P1P2P3 headerheaderheaderP4 header
P1P2P3 header
Ack P1, P2, … P4header
Ack P1, P2, … P3header
Block Ack covers many frames in one Ack
Aggregate MPDU is a special case requiring Block Ack
The format of the Block Ack is a bit-map to acknowledge each outstanding frame: it is based on a mechanism originally defined in 802.11e. The bit-map identifies specific frames not received, allowing selective retransmission of only those required.
MAC layer enhancements: Reduced inter-frame spacing (RIFS)
When a station (client or AP) has a number of frames to send sequentially, it must pause between frames. However, these pauses constitute overhead for the overall network. Prior to 802.11n, the pause between frames transmitted by the same station was set at SIFS (single inter-frame spacing). ‘802.11n-Draft2.0’ defines a smaller spacing, RIFS (reduced inter-frame spacing). RIFS cannot be used for the pause between frames transmitted by different stations, and it can only be used when the station is transmitting in 802.11n HT (greenfield) mode. It accomplishes similar goals to the MAC aggregation functions explained earlier, but arguably with less implementation complexity. ‘802.11n-Draft2.0’ defines a RIFS interval as 2 usec, whereas SIFS is 16 usec.
MAC layer enhancements: Spatial multiplexing power save (SM power save)
The basic ‘802.11n-Draft2.0’ power save mode is based on the earlier 802.11 power save function. In this mode, the client notifies the AP of its power-save status (intention to sleep), then shuts down, only waking for DTIMs (Delivery Traffic Indication Maps) broadcast by the AP, while the AP buffers downlink traffic for sleeping stations between DTIMs.
Chapter 2 - Technology in 802.11n

�4
Designed for Speed - 802.11n Theory and Practice
Aruba Networks
Power save in ‘802.11n-Draft2.0’ is enhanced for MIMO operation with SM power save mode. Since MIMO requires maintaining several receiver chains powered-up, standby power draw for MIMO devices may be considerably higher than for earlier 802.11 equipment.
To mitigate this, a new provision in ‘802.11n-Draft2.0’ allows a MIMO client to power-down all but one RF chain when in power save mode. When a client is in the ‘dynamic’ SM power-save state, the AP sends a wake-up frame, usually an RTS/CTS exchange, to give it time to activate the other antennas and RF chains. In static mode, the client decides when to activate its full RF chains, regardless of traffic status.
MAC layer enhancements: Power Save Multi-poll (PSMP)
PSMP can be considered an extension of APSD from 802.11e: it has the same extensions, scheduled- and unscheduled-PSMP (viz. S-APSD, U-APSD).
Data
Trigger/Data
Multicast
AP
A
A
AP802.11n (HT)
Incoming to AP(wired side) Data
Buffers traffic for A Data Multicast Data
Ack / Sleep
Buffers traffic for A
time
Sleep
Unscheduled PSMP is the simpler mode: it is very similar to U-APSD, supporting both trigger-enabled and delivery-enabled options. Each sleep interval is considered and signaled independently, with the client determining when to wake to receive or transmit data. In the diagram above, the ‘sleep’ frame informs the AP that the client will stop receiving frames until further notice. When the client wishes to communicate, it sends a regular or trigger frame to the AP, and both parties then transmit whatever data is queued. At the end of this exchange, the client can indicate its return to sleep mode.
Scheduled PSMP is very similar to the S-APSD function introduced in 802.11e. The client requests a reservation for a T-Spec (traffic

�5www.arubanetworks.com
specification) from the AP, giving details of data rate, frame size, frame interval and access class (QoS priority) of the traffic streams it wishes to send and receive. The AP, once it has admitted this T-Spec, defines and a polling schedule for the client. Since there may be several clients using S-PSMP, the AP defines global PSMP SP (service period) for S-PSMP traffic, informing other stations they cannot transmit during these intervals. Once a PSMP SP is declared, the AP first transmits data in the downlink direction to all applicable S-PSMP clients during the DTT (downlink transmission time), then accepts traffic from clients during the UTT (uplink transmission time).
A
B
C
AP
802.11nPSMP 802.11n
NotPSMP
802.11nPSMP
DataA
AP
Incoming to AP(wired side)
DataB
Buffers traffic, no polling
DataA
DataB
time
TSpecrequest
PSMP-DTT PSMP-UTT
BTSpecrequest
Publishschedule
DataA
DataB
Data
Buffers traffic, no polling
DataA
DataB
PSMP-DTT PSMP-UTT
Data
AData Data
C sends & receives framessends & receives frames Transmit inhibited by NAV Transmit inhibited by NAV
PSMP = power savemulti-poll
DTT = downlinktransmission time
UTT = uplinktransmission time
S-PSMP is a very efficient way to transmit streaming or periodic traffic over 802.11n: there is no contention for the medium, as everything depends on a published schedule.
Compatibility Modes and Legacy Support in 802.11n
The most vexing aspect of 802.11n is how it works in the presence of earlier 802.11 technologies. Because it operates in the same bands as legacy 802.11, and is developed by the same standards bodies, and because there are already more than 100 million Wi-Fi devices in use world-wide, 802.11n is designed to support earlier forms of Wi-Fi. This includes:
Chapter 2 - Technology in 802.11n

�6
Designed for Speed - 802.11n Theory and Practice
Aruba Networks
• Support for legacy clients. 802.11a/b/g clients can connect to 802.11n APs. They will not be able to use 802.11n features, and their performance will be only marginally improved when connecting to an 802.11n AP.
• Awareness of neighbouring or overlapping 802.11a/b/g networks. This is particularly important when using the new 40 MHz channel capability, which would impair the performance of such networks.
Unfortunately, as explained elsewhere in this note, working with legacy 802.11 clients and networks degrades the performance of 802.11n considerably, to the point where 802.11a/b/g clients will see very comparable performance whether they are using an 802.11a/b/g or 802.11n access point. In addition, working with legacy clients ‘poisons’ the 802.11n cell: its capacity will be severely degraded as soon as even one legacy client is present. This does not negate the need for legacy operation, but it does increase the urgency of upgrading the client population to 802.11n. The diagram below shows how introducing an 802.11a client into an 802.11n cell reduces the throughput (based on data rates alone: the overhead introduced by co-existence mechanisms will further reduce throughput).
A B
AP802.11n52 Mbps
802.11n104 Mbps
A
C
B
AP802.11n52 Mbps
802.11n117 Mbps
802.11a24 Mbps
802.11n
802.11n
2SS SDM 2SS SDM
2SS SDM 2SS SDM
1SS
time
A to AP 1KB @ 52 Mbps
2N
AP to B 1KB@ 104 Mbps
N
Data onthe air
B to AP 1KB@ 104 Mbps
N
AP to A 1KB @ 52 Mbps
2N
B to AP 1KB@ 104 Mbps
N
AP to A 1KB @ 52 Mbps
2N
time
A to AP 1KB @ 52 Mbps
2N
AP to B 1KB@ 104 Mbps
N
Data onthe air AP to C 1KB @ 24 Mbps
4N
AP to A 1KB @ 52 Mbps
2N
Data transferred = 6KB, 3KB to/from A and 3KB to/from B ***(for a time interval of 9N*).
Data transferred = 4KB, 2 KB to/from A, 1KB to/from B, 1KB to/from C ***(for a time interval of 9N) .
*** In a time interval of 9N, ignoring contention time
Greenfield, High-throughput and non-HT modes
Depending on the requirements to support legacy 802.11a/b/g clients, 802.11n defines three modes of client compatibility: High Throughput (Greenfield), High Throughput Mixed-Format and Non-HT (legacy) mode.

�7www.arubanetworks.com
HT (High Throughput) Greenfield format
HT mixed format
Non-HT format
KeySTF Short Training FieldLTF Long Training FieldSIG SignalGF GreenfieldL Legacy (e.g. pre802.11n-HT High Throughput (e.g. 802.11n)
Note: In 802.11n terminology, L = NonHT-
HT-GF-STF HT-LTF1 DataHT-SIG HT-LTF HT-LTF HT-LTF HT-LTF… …
L-STF L-LTF L-SIG HT-SIG HT-STF HT-LTF HT-LTF HT-LTF HT-LTF… … Data
L-STF L-LTF L-SIG Data
High Throughput (HT). In HT or Greenfield mode, the AP does not expect to connect to any legacy 802.11 clients, and indeed, assumes that there are none operating in the area. Even so, the first part of the preamble is a legacy short training sequence, enabling other devices and APs to sense that there is 802.11 equipment in the area. However, after that no indication is available that will allow older devices to understand the remaining part of the transmission: it is all in HT-format. HT-mode is the only one of the three that is not mandatory in the 802.11n standard.
Non-HT format. This is essentially legacy mode. The frames are all in 802.11a/g format (PHY and MAC), so they can be understood and decoded by 802.11a/b/g clients. This mode gives essentially no performance advantage over legacy networks, but offers full compatibility. Non-HT mode cannot be used with 40 MHz channels.
HT Mixed Format. As might be expected, this allows operation of 802.11n clients in HT mode, while legacy clients are fully-supported. There is a full legacy preamble, then the option of using HT or legacy format afterwards. The preamble allows legacy clients to detect the transmission, acquire the carrier frequency and timing synchronization, and the L-SIG field allows them to estimate the length of the transmission.
This (mixed) mode can be used in a 40 MHz channel, but to make it compatible with legacy clients, all broadcast and non-aggregated control frames are sent on a legacy 20 MHz channel as defined in 802.11a/b/g, so as to be interoperable with those clients. And of course all transmissions to and from legacy clients must be within a legacy 20 MHz channel.
Chapter 2 - Technology in 802.11n

�8
Designed for Speed - 802.11n Theory and Practice
Aruba Networks
Phased coexistence Operation (PCO)
Phased coexistence operation is designed to allow an 802.11n AP to support both 802.11n and 802.11a/g clients while being a good neighbour to other legacy 802.11 APs operating in the area.
As the diagram shows, the AP time-slices its cell, switching between 20 MHz, 802.11a/b/g compatible operation in each of the constituent 20 MHz channels and full 40 MHz operation for 802.11n clients. To maintain order and provide the best throughput, two mechanisms are used.
A
B
AP802.11n (HT)20 MHz
802.11a (L)20 MHz
time
RTS (HT)
CTS (HT)
Sends data (HT)
CTS (L)AP
A
CTS (HT) Data frame (L) CTS (L) Data frame (HT)
B
CTS to selfCTS to self
Receives data (L)
Receives data (HT)
Sets NAV Sets NAV
Sets NAV
L = Legacy (802.11a/b/g mode)HT = High Throughput (802.11n mode)
Firstly, for 802.11n clients, the AP advertises a forthcoming switch of operation, allowing these clients to continue communicating in all time slices, whether 20 MHz or 40 MHz. Clearly, throughput is lower during 20 MHz time slices, but nevertheless, two-way transmission between the client and the AP can continue uninterrupted. While the diagram shows all time slices of equal length for simplicity, the AP can choose between a number of defined time intervals for each time slice.
For legacy 802.11 clients, only one of the three modes of operation (40 MHz, upper 20 MHz, lower 20 MHz channels) will be possible at any time: these clients will only operate in one of the 20 MHz channels. During time slices when the AP is in one of the other two modes, these clients must be informed that they cannot transmit: the AP will not be able to receive their frames. This is achieved by the AP transmitting a self-addressed CTS (clear to send, see below) frame with a ‘duration’ value equal to the next time-slice duration. When clients hear this frame, they set their NAV (network allocation vector) to this value:
��www.arubanetworks.com
under the rules of all 802.11 standards, they are not allowed to attempt transmission until this timer has expired.
Phased coexistence operation is also a good-neighbour policy because APs and clients in range of the AP will be able to hear the self-addressed CTS messages and set their NAV timers appropriately, avoiding one form of co-channel interference. However, 802.11a/b/g cells operating in range of a PCO cell will experience reduced capacity, as APs and clients will be inhibited from transmitting for a significant percentage of the time previously available.
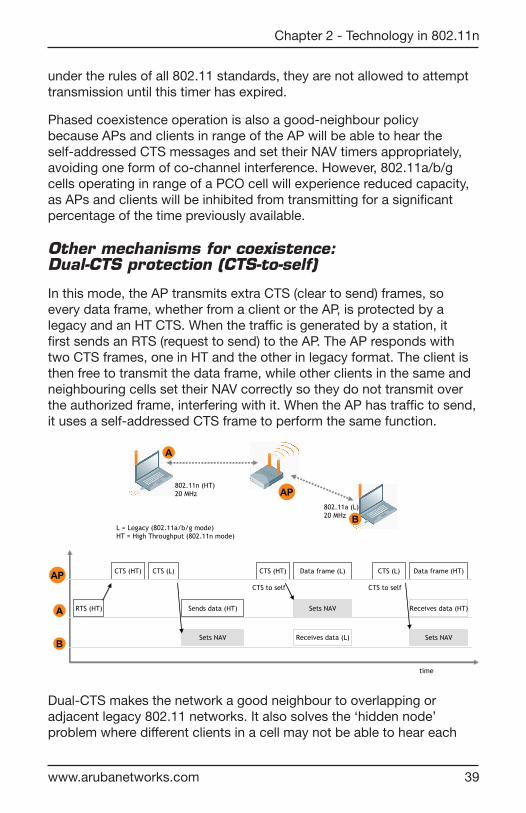
Other mechanisms for coexistence: Dual-CTS protection (CTS-to-self)
In this mode, the AP transmits extra CTS (clear to send) frames, so every data frame, whether from a client or the AP, is protected by a legacy and an HT CTS. When the traffic is generated by a station, it first sends an RTS (request to send) to the AP. The AP responds with two CTS frames, one in HT and the other in legacy format. The client is then free to transmit the data frame, while other clients in the same and neighbouring cells set their NAV correctly so they do not transmit over the authorized frame, interfering with it. When the AP has traffic to send, it uses a self-addressed CTS frame to perform the same function.
A
B
AP802.11n (HT)20 MHz
802.11a (L)20 MHz
time
RTS (HT)
CTS (HT)
Sends data (HT)
CTS (L)AP
A
CTS (HT) Data frame (L) CTS (L) Data frame (HT)
B
CTS to selfCTS to self
Receives data (L)
Receives data (HT)
Sets NAV Sets NAV
Sets NAV
L = Legacy (802.11a/b/g mode)HT = High Throughput (802.11n mode)
Dual-CTS makes the network a good neighbour to overlapping or adjacent legacy 802.11 networks. It also solves the ‘hidden node’ problem where different clients in a cell may not be able to hear each
Chapter 2 - Technology in 802.11n
40
Designed for Speed - 802.11n Theory and Practice
Aruba Networks
others’ transmissions, although, by definition they can all hear the AP and its CTS frames. However, the use of RTS/CTS further reduces the data throughput of the cell.
Other mechanisms for coexistence: 40 MHz-intolerant indication
A mechanism is defined in 802.11n that allows an AP to advertise in its beacon that it prohibits 40 MHz operation in adjacent or overlapping cells. This indication can also be transmitted by a client, informing the AP that it must prohibit 40 MHz operation by all other cell members.
Using 802.11n in the 2.4 GHz band
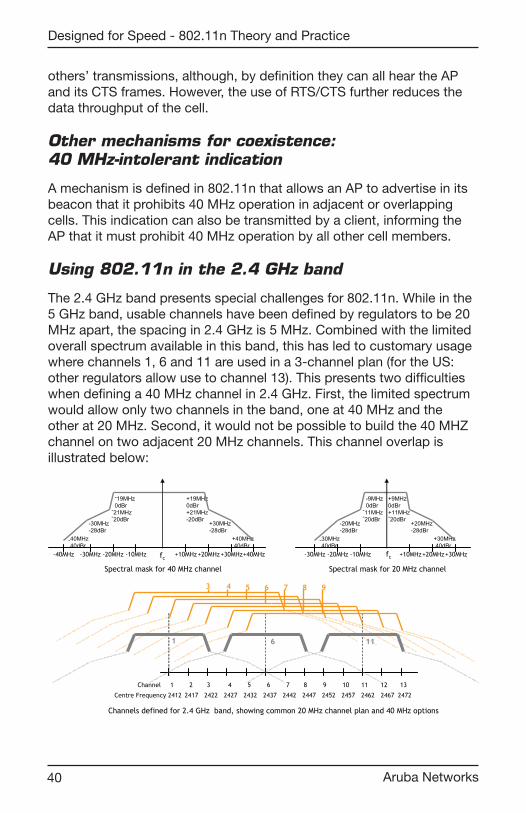
The 2.4 GHz band presents special challenges for 802.11n. While in the 5 GHz band, usable channels have been defined by regulators to be 20 MHz apart, the spacing in 2.4 GHz is 5 MHz. Combined with the limited overall spectrum available in this band, this has led to customary usage where channels 1, 6 and 11 are used in a �-channel plan (for the US: other regulators allow use to channel 1�). This presents two difficulties when defining a 40 MHz channel in 2.4 GHz. First, the limited spectrum would allow only two channels in the band, one at 40 MHz and the other at 20 MHz. Second, it would not be possible to build the 40 MHZ channel on two adjacent 20 MHz channels. This channel overlap is illustrated below:
-21MHz-20dBr
-30MHz-28dBr
-40MHz-40dBr
-19MHz0dBr
+21MHz-20dBr
+30MHz-28dBr
+40MHz-40dBr
+19MHz0dBr
-11MHz-20dBr
-20MHz-28dBr
-30MHz-40dBr
-9MHz0dBr
+11MHz-20dBr
+20MHz-28dBr
+30MHz-40dBr
+9MHz0dBr
fc +10MHz+20MHz+30MHz-30MHz -20MHz -10MHzfc+10MHz+20MHz+30MHz-30MHz -20MHz -10MHz +40MHz-40MHz
1 43 52 6 87 109 11 12 13Channel
Centre Frequency 2412 2417 2422 2427 2432 2437 2442 2447 2452 2457 2462 2467 2472
3 4 5 6 7 8 9
Spectral mask for 40 MHz channel Spectral mask for 20 MHz channel
1 6 11
Channels defined for 2.4 GHz band, showing common 20 MHz channel plan and 40 MHz options
41www.arubanetworks.com
This means that in practice, it is unlikely that 40 MHz channels will be used in the 2.4 GHz band. But this does not mean that 802.11n should not be used: there will be performance improvements even when a 20 MHz channel is used, although the presence of legacy clients will reduce the realized benefits. This also illustrates one of the drivers for using 802.11n in handheld clients such as mobile Wi-Fi phones, and even in plug-in PC NIC cards where space is limited and designers are tempted to revert to 802.11g components for power consumption, size and cost reasons.
Allowing such devices to work in ‘Draft-n’ mode will avoid the need for the cell to fall into a PCO or other coexistence mode, and greatly increase overall cell performance, even if a single antenna with a single transmit/receive chain is used. Designers of small clients such as cellphones are already attacking these challenges using techniques such as diverse polarization and attitude, but a PC with antennas embedded in the frame is likely to realize better MIMO performance than a small hand-held 802.11n device for some time to come.
Chapter 2 - Technology in 802.11n

42
Designed for Speed - 802.11n Theory and Practice
Aruba Networks
Using 802.11n in the 5 GHz band
Channels defined for 5 GHz band (US regulations), showing common 20 MHz channel plan and 40 MHz options
Channel
Frequency (MHz)
US UNII I and UNII II bandsUNII I: 5150-5250 MHzUNII II: 5250-5350 MHz8x 20 MHz channels4x 40 MHz channelsUNII II requires DFS
149 161157153 BandEdge
Channel
Frequency (MHz) 5745 5765 5785 5805 5850
BandEdge5725
US UNII III / ISM band5725-5850 MHz4x 20 MHz channels2x 40 MHz channels
Channel
Frequency (MHz)
US intermediate band(UNII II extended)5450-5725 MHz11x 20 MHz channels5x 40 MHz channelsRequires DFS
36 4844 5240 56 6460 BandEdge
5180 5200 5220 5240 5260 5280 5300 5320 5350
BandEdge5150
100 112108 116104 120 128124
5500 5520 5540 5560 5580 5600 5620 5640
BandEdge5450
136 140 BandEdge
5680 5700 5725
132
5660
We anticipate that ‘Draft-n’ enterprise networks will make extensive use of the 5 GHz band.
The diagram above shows the available 40 MHz channels in the various 5 GHz bands. Note that ‘Dynamic Frequency Selection’ a technique from 802.11h, is required for operation in some of these bands:
‘Draft-n’ silicon is generally compliant with the DFS requirement. The plenitude of channels will allow widespread deployment with 40 GHz channels, and will also allow deployment options with parallel 802.11a and ‘Draft-n’ cells at 5 GHz, allowing the ‘Draft-n’ cells to load-balance legacy clients to the 802.11a cells.

4�www.arubanetworks.com
Chapter 3 Product development and capabilitiesThis section deals with three issues: IEEE 802.11n stipulations for mandatory and optional features; Wi-Fi Alliance tests for certification; and chip-designers implementations. There is a fourth level, those features the equipment vendors such as Aruba will choose to implement, but historically, most features provided by the chip vendors have been supported – and of course, those that are not supported in silicon cannot be implemented in equipment.
Standards and Certification frameworkIn the table below, the first two columns are correct as of September 2007, while the last column is based on discussions with chip vendors, and the opinions and experience of Aruba’s engineering team. The Wi-Fi Alliance has implemented certification for ‘Draft-n’ APs, and two profiles for clients, ‘handheld’ for battery-powered devices and ‘consumer electronics’ for AC-powered, video-capable devices. Each certification includes mandatory and optional elements.
Feature
(M=Mandatory) (O= Optional)
WFA certification requirements ‘Draft-n’
Likely to be implemented by chip vendors and product
vendors?
APsClient:
Handheld
Client: Consumer Electronics
High Throughput PHY
40 MHz channel in 5 GHz
O O O Supported
20 MHz channel in 5 GHz
M O M Supported
40 MHz channel in 2.4 GHz
Not tested
20 MHz channel in 2.4 GHz
M O O Supported
Chapter � - Product development and capabilities

44
Designed for Speed - 802.11n Theory and Practice
Aruba Networks
Concurrent operation in 2.4 & 5 GHz bands
O Supported (this is for a dual-radio
solution: not splitting SS’s over two
bands). After long deliberation, 2.4 GHz-only (and 5
GHz-only) clients are allowed.
SDM (Spatial Division Multiplexing): number of spatial streams supported
2x2 / 4x4 1x1 / 2x2 (equal mod
at client)
2x2 (equal mod only)
Initial chipsets support only 2
spatial streams, (despite public
marketing positions & statements). We expect a maximum of 2 or � antennas
on commercial products.
STBC (Space-time block
coding): the modulation
options available
O We expect only symmetrical coding
options to be implemented initially.
Explicit feedback frames may not work across dis-similar vendors.
Spatial expansion of legacy frames
O We don’t expect to see this capability
initially.
Reverse direction O We don’t expect to see this, except
maybe if same vendor’s chip sets at both ends, AP &
client.
TxBF (Transmit Beamforming)
Not yet properly defined (target Q1 2008). Not likely to
be supported before 2008.
Greenfield Mode O Optional but critical for improved performance!
All products will support this.
L-SIG legacy protection (mixed
mode)
M Supported.
High Throughput duplicate mode
O Supported.

45www.arubanetworks.com
Short guard interval
O Supported.
MRQ/MFB. Fast Link adaptation
M Supported.
MAC Layer Enhancements
A-MPDU, A-MSDU
O Supported (although there are some
questions about a security vulnerability
of A-MSDU)
PSMP. Power Save Multipoll
M Supported.
MTBA Block Ack M Supported.
Quality of Service
WMM (including WMM Power
Save)
M M M Will support WMM in 802.11n mode.
Security
WPA2 M M M Will certainly support WPA2 in all 802.11
modes.
Expected product introduction timelines
This section gives estimates of the type of 802.11n products likely to be offered to the enterprise market, and when they might be introduced. The information is speculative – the passage of time will surely show that much of it is wrong – but it represents the author’s best guess as of late 2007. The major players determining this timeline are the silicon vendors and client (PC) designers – and of course enterprise customers and their buying decisions. This section ignores the consumer market, which is likely to develop much more quickly and may in the end be a significant influence on the enterprise market, especially by affecting silicon prices and overall user acceptance of the technology.
We suggest that while ‘pre-n’ products present too much technology risk to use for more than isolated tests in enterprise networks, ‘Draft-n’ products certified by the Wi-Fi Alliance will be suitable for pilot deployments, and to alleviate any local congestion points before full upgrade plans can proceed, either with ‘Draft-n’ products (after experience, the standards process and certification tests demonstrate reduced risk) or with fully 802.11n-certified products.
Chapter � - Product development and capabilities

46
Designed for Speed - 802.11n Theory and Practice
Aruba Networks
Time Interval Product Cert Notes
�Q-4Q 2007 AP Draft-n APs will support two spatial streams. Many APs will be ‘dual-radio-set’,
capable of either dual-band 802.11n operation or with one radio-set for 802.11n
and the other for 802.11a/g.
PC Draft-n As above. It will take longer for the technology to be integrated on PC motherboards at
manufacture, but this will offer a superior solution, as proper antenna spacing and placement is
easier when embedded in the PC case.
4Q 2007 - 1Q 2008
AP Draft-n APs will support 2 spatial streams.
PC Draft-n New PCs will ship with 802.11n embedded as standard, as vendors ramp production volume up to reduce costs and accelerate
market adoption. Unlikely to move to � spatial streams on the client because the increased cost,
complexity, heat generated and PC board-space is difficult to justify.
2Q-�Q 200� AP, PC n Full 802.11n certification should be available in this timeframe. Capabilities as above. APs will possibly extend to 4 antennas, but unlikely 4
spatial streams, except for special circumstances like point-point bridging applications. APs may
become capable of beamforming.
Phones n Wi-Fi phones have only just incorporated 802.11g, and very
few yet support 5 GHz operation.
2010 Handheld devices
n Bar code readers, location tags & other specialized Wi-Fi clients will take years to
incorporate 802.11n because while 802.11a/g technology is cheaper, more compact & lower-
power (and networks are backwards-compatible), designers will not be able to justify.
47www.arubanetworks.com
Chapter 4 Migration strategies
Different paths to enterprise-wide 802.11nThere are essentially three strategies to get an enterprise WLAN to ‘Draft-n’: greenfield, overlay and interspersed. The four questions the network designer must answer are where to place the new 802.11n APs, which channels to use, whether to remove some older 802.11a/b/g APs, and how to manage the client population.
As indicated earlier, a uniform ‘Draft-n’ network will allow greater range and hence wider AP spacing than an 802.11a/b/g network. RF engineers insist that every site has unique conditions and usually avoid giving any figures for ‘typical’ deployments, but a rule of thumb in ‘carpeted’ enterprise buildings is that with design figures of �-12 Mbps minimum rate and 150% cell overlap, and a ‘typical’ office layout and user population, 802.11a/g APs can be spaced at about 15-21 metres (50–70 feet). With ‘Draft-n’ APs and 802.11a/b/g clients, we would expect the same guidelines to hold: legacy clients will not connect over greater ranges, or at higher data rates.
However, with ‘Draft-n’ APs and ‘Draft-n’ clients, Aruba estimates that AP spacing can be increased to perhaps 20-25 metres (65-85 feet). In a new ‘greenfield’ installation, this can offer a considerable savings in AP hardware, cabling & installation, and even in LAN edge switch ports, closet space, power and cooling provisions.
As noted throughout this paper, ‘Draft-n’ offers an opportunity to increase usage of the 5 GHz band where channels are plentiful, interference is uncommon and 40 GHz channel usage is feasible. However, while 5 GHz ‘Draft-n’ PC clients are readily available, specialized clients such as Wi-Fi phones, location tags or handheld bar-code readers will be confined to 2.4 GHz and 802.11b/g for at least 12-24 months, with few exceptions. For this reason, and because of the considerable installed base of 802.11b/g clients, we suggest that any enterprise network should provide coverage in the 2.4 GHz band. Since WLAN vendors will be marketing access points supporting two radios: either with both capable of ‘Draft-n’, or one ‘Draft-n’ and the other 802.11a/b/g, this will be quite feasible, but remember that if legacy clients are to be fully and reliably supported, AP spacing cannot be increased.
Chapter 4 - Migration strategies

48
Designed for Speed - 802.11n Theory and Practice
Aruba Networks
In general, we recommend that when ‘Draft-n’ access points are used, they should support two radio-sets, one operating with a 40 MHz channel at 5 GHz and the other with a 20 MHz channel at 2.4 GHz. This will provide maximum performance and flexibility for a price premium over a ‘Draft-n’ + 802.11a/b/g or a single 802.11n access point.
Even though phones, location tags and other handheld clients will be slow to adopt 802.11n, it is important that they eventually achieve this goal. Even if they were only to support one antenna, one RF chain and a single spatial stream, the upgrade will prevent access points from dropping into legacy-compatible modes and hence will remove a serious inhibitor of performance as measured by cell capacity.
One driver for introducing ‘Draft-n’ access points in an existing network will be defensive: to provide rogue AP detection that extends to the APs on the shelves of consumer electronics shops. If previous upgrades of Wi-Fi are an indication, the consumer market will lead the enterprise market for several quarters, and while their beacons include legacy transmissions, the only way to reliably classify an 802.11n rogue and its clients will be to use an 802.11n access point. Most WLAN vendors are expected to continue supporting an architecture where a single access point can dynamically switch between coverage and monitoring mode, and in a Wi-Fi service delivery network we expect the usual ratio of 15% to 25% extra access points in order to ensure full monitoring even under heavy load, as well as dynamic network healing in the event of AP failure. If new APs are used for the sole purpose of monitoring, they would normally be installed at wider spacing than indicated above. This may change for 802.11n, since some of the range-enhancing techniques are not symmetrical and depend on the client implementing and enabling particular features.
Greenfield
This strategy is not really a migration: it is building a network with new APs and new clients where there was no WLAN before. This offers an opportunity to start with all ‘Draft-n’ coverage, and to ensure that clients are ‘Draft-n’-capable, or can be rapidly phased-out in favour of capable substitutes. The foremost concern with this strategy is that all clients must be ‘Draft-n’-capable, otherwise older clients will have shorter range, similar to 802.11a/g distances, and will experience very low connectivity rates and coverage holes, at the same time reducing the potential performance of 802.11n clients in the cells where they are connected.

4�www.arubanetworks.com
802.11n Access Points
802.11n coverage
As seen from the figures above, it may be possible to reduce the number of APs required to cover an area by a factor of �0% or more, when comparing ‘Draft-n’ with older 802.11 technologies. This may mean that the capacity of a cell becomes more important than the connection speed of any data client, but this is easily incorporated into the planning stage. The savings indicated above may make it worthwhile to upgrade clients to 802.11n in order to take advantage of the wider AP spacing this enables.
Other aspects of a greenfield deployment include rogue detection and intrusion prevention. These functions should work successfully for all types of 802.11a/b/g/n devices.
A further consideration will be whether to cover one or both of the 2.4 GHz and 5 GHz bands. Enterprise-class PC ‘Draft-n’ clients are likely to be 5 GHz-capable, so for these clients, coverage of 5 GHz only will be sufficient. However, the likelihood of requirements for 2.4 GHz-only client support (as discussed above) means it will be important for most enterprise deployments of this type to include dual-radio access points providing coverage of the 2.4 GHz band, even if this is legacy coverage and it becomes intermittent at the edge of the cell (due to ‘Draft-n’-driven access point spacing).
Summary of ‘Greenfield’ recommendations:
• Confirm that 802.11n-capable clients are available for all current and foreseeable enterprise requirements.
Chapter 4 - Migration strategies

50
Designed for Speed - 802.11n Theory and Practice
Aruba Networks
• RF planning can proceed with 802.11n range assumptions, allowing fewer APs. Use increased AP spacing only if all clients are capable of at least 2 spatial streams. Restrict existing APs to a subset of the available 5 GHz channels, and use the remainder for 802.11n.
• Consider power to the APs, edge switch ports, etc.
• Place APs to avoid line-of-sight for best MIMO performance.
• Disable co-existence mechanisms such as PCO that support mixed-mode operation.
• Enable good-neighbour mechanisms such as dual-CTS if there are other 802.11a APs in the same building, on the same channel..
• Ignore ‘40 MHz-intolerant’ requests, or reject such clients.
• Use dual-radio APs where the primary radio(s) is 802.11n at 5 GHz, while the second radio (can be 802.11a/b/g) runs in the 2.4 GHz band.
• Remember that this scheme does not guarantee complete 2.4 GHz coverage for non-‘Draft-n’ clients: there may be areas at the edge of cells where signal strength will not support an 802.11a/b/g signal.
Note that for a lightly-loaded greenfield network, using ‘Draft-n’ access points with 802.11a spacing, and enabling PCO for a mixed client base presents a perfectly acceptable solution: throughput will initially be low, maybe even lower than an 802.11a network until the number of legacy clients is reduced, but the network can be installed once and grow with the client base, without any required reconfiguration.
AP-overlay
Here, the ‘Draft-n’ network would be planned as if there were no existing network, for optimum placement of the new APs. The old and new networks will be able to operate in parallel if care is taken with RF channel allocation, and when the new one is complete and all clients are 802.11n-capable, the old APs can be de-installed or abandoned. For this scheme, it is important that the radio planning and management algorithm of the WLAN can manage 802.11a, b, g and ‘Draft-n’ cells and APs simultaneously.

51www.arubanetworks.com
802.11n Access Points
802.11a/g Access Points
802.11n coverage
802.11a/g coverage
Since ‘Draft-n’ makes best use of the 5 GHz band (with 40 MHz channels), it makes an attractive overlay on an 802.11b/g network operating at 2.4 GHz: the original network can operate in the 2.4 GHz band (or even 2.4 GHz and several channels of the 5 GHz band) while the ‘Draft-n’ network can use the remainder of the 5 GHz band. In this scenario, there will be no need for legacy clients to connect to the 802.11n network, so it can operate in HT mode. (It may be useful in the early days of such a network to use it in PCO mode if there are very few 802.11n-capable clients, but this will negate much of the throughput advantages of ‘Draft-n’.) Against this, the ‘Draft-n’ network is additive, so additional cabling, power and edge switch ports will probably be required (but it is likely these upgrades would eventually be needed, anyway).
Summary of ‘Overlay’ recommendations:
• Decide on the client migration strategy: it may be better to wait until ‘Draft-n’ clients are available before investing in 802.11n-capable infrastructure.
• RF planning can proceed with ‘Draft-n’ range assumptions, allowing fewer APs.
Chapter 4 - Migration strategies

52
Designed for Speed - 802.11n Theory and Practice
Aruba Networks
• Switch PCO off, use dual-CTS.
• Consider power to the APs, edge switch ports, etc.
• Place APs to avoid line-of-sight for best MIMO performance.
• Use single-radio APs if there is no future requirement for 2.4 GHz ‘Draft-n’ coverage. If there is an intent to eventually remove the older infrastructure, it may be better to use dual-radio access points for the overlay so the second radio can be switched on later (becoming similar to the greenfield model over time, as the original infrastructure disappears).
AP substitution
In this model, existing APs are swapped one-for-one with new ‘Draft-n’ APs. If every AP is replaced with ‘Draft-n’, the resulting network will have plenty of capacity – we estimate perhaps a three-fold improvement, depending on the mix of 802.11a/g and ‘Draft-n’ clients – but will have more APs that would be strictly necessary. In most networks it will be possible to abandon some AP locations – either running an RF planning tool, or using RF self-calibration tools on a network mid-way through migration will give an indication of whether this is feasible.
802.11n Access Points802.11a/g Access Points
802.11n coverage802.11a/g coverage
A network of mixed ‘Draft-n’ and 802.11a/g or even 802.11b APs can operate indefinitely: this is a possible solution where ‘Draft-n’ is important for classifying rogue APs but not for capacity or range considerations. Note that even though APs can be swapped at a location, the new ‘Draft-n’ AP may require different power and Ethernet connections.
5�www.arubanetworks.com
Summary of ‘AP substitution’ recommendations:
• Decide on the client migration strategy: it may be better to wait until ‘Draft-n’ clients are available before investing in ‘Draft-n’-capable infrastructure.
• Run an RF planning tool to determine which APs should be upgraded to 802.11n.
• Enable PCO, dual-CTS.
• Consider power to the APs, edge switch ports, etc.
• Place APs to avoid line-of-sight for best MIMO performance.
• Use single-radio or dual-radio APs, depending on the existing infrastructure and plans for future migration.
Other considerations when planning an upgrade
Points to bear in mind when planning an upgrade strategy:
• ‘Draft-n’ APs will require Gigabit Ethernet connections if the backhaul link is not to become a bottleneck. This may in turn require upgrading cables to Category 5e or Category 6 cable (older Category 5 cable is not rated for Gigabit Ethernet). However, performance will be significantly increased even without the GE upgrade.
• Also, GE ports must be available on LAN edge switches in wiring closets.
• Since 802.�af power-over-Ethernet is not sufficient for many new ‘Draft-n’ APs (assuming at least 2 antennas and RF chains at 5 GHz, an AP will draw at least 15W), 802.�at should be supported by edge switches or mid-span POE equipment, or local power bricks may be required. (Aruba has new AP technology that will avoid this requirement in most cases.)
• AP mounting and positioning guidelines may differ. With earlier 802.11 APs, it was important to provide as clear a line of sight as possible between the AP and the client, so hiding APs behind metal pipes or air conditioning ducts was not recommended. With MIMO, such practices may become optimum for ‘Draft-n’.
Chapter 4 - Migration strategies

54
Designed for Speed - 802.11n Theory and Practice
Aruba Networks
• Opportunities to mount APs ‘in the workspace’ - on walls, partitions and on furniture, but not in the ceiling plenum space – increase with ‘Draft-n’, as the non-line-of-sight characteristics are favourable. This may mitigate some of the installation issues mentioned above: if GE drops already exist in some offices, ‘Draft-n’ APs can be located to take advantage of these, and local power for the AP via a wall brick may be a reasonable option.

55www.arubanetworks.com
Chapter 5 ConclusionThis note has two goals: to explain the technology and features of the 802.11n standard, and to examine its implications for the design of enterprise Wi-Fi networks, in terms of likely product development cycles.
It is clear that 802.11n represents a significant leap forward in technology and performance for enterprise networks. Uniform ‘greenfield’ 802.11n networks will be able to offer much higher capacity and longer range than current WLANs, and there are potential savings in terms of fewer access points to cover a given area.
However, this note has also identified several issues that will delay the adoption of 802.11n in enterprise networks. These include the incomplete state of the standards, infrastructure requirements such as LAN edge switch ports, cabling and power, and the installed base of 802.11a/b/g clients and WLANs that must be considered in any migration strategy. Taken together, these are likely to slow the 802.11n adoption wave, so a number of years will pass before we can realize the full benefits.
In the pages above, we have discussed the facts of 802.11n, along with our best estimates of future activity. There is a case in enterprise networks for tuning and extending existing 802.11a/g networks in the short-term, while testing and running pilot trials on ‘Draft-n’ and eventually full 802.11n-compliant products. When and how to migrate to 802.11n will be an important decision: the information here is intended to assist the enterprise network manager in formulating an optimum upgrade strategy.
Despite our best efforts, developments will inevitably prove us wrong in some of the predictions above: our advice to the reader is to check often with the technical press and vendors for current information.
802.11n offers very real and exciting benefits: it will eventually change the way we build and operate enterprise wireless LANs.
Chapter 5 - Conclusion
56
Designed for Speed - 802.11n Theory and Practice
Aruba Networks
Appendix
Note on expected ‘real-world’ cell capacity with 802.11nWhereas an 802.11a/g access point can support a top data rate of 54 Mbps, 802.11n can stretch to 600 Mbps (with full 4x4 configurations, although these are not yet available). This is important, as a Wi-Fi cell (the area covered by a single AP) shares all bandwidth: it’s very similar to the original wired Ethernet, where all stations shared a single segment of cable, and had to co-ordinate transmissions to avoid collisions. Three effects limit the effective capacity of an 802.11 cell (examples are taken from 802.11g, but should be equivalent form 802.11n):
• Actual data rates. While specifications quote maximum data rates, these are only achieved under the best radio conditions. The distance from AP to client, RF obstructions such as walls, furniture, people, and interfering RF transmissions all limit the achievable data rate. Thus, a client 20 metres from the AP in an office environment might only support a data rate of 12 Mbps rather than the advertised peak of 54 Mbps. If all clients connect at this rate, the raw capacity of the cell becomes 12 Mbps.
• Contention loss. Since the wireless medium is shared, stations wishing to send data must contend for temporary control of the medium. This contention takes time that is then not available for data traffic, lowering the capacity of the cell. Contention depends on the number of clients and the length of frames sent: the more clients and the shorter the frame, the less the effective capacity of the cell. For instance, while an 802.11g cell may achieve throughput of 26 Mbps with 1500 Byte frames, capacity drops to around 12 Mbps with 256 Byte frames. The MAC aggregation function in 8 02.11n should reduce losses due to contention, but it will not be effective for all types of traffic.
• Legacy support. All 802.11 systems are designed to support older 802.11 clients. Thus an 802.11g AP will support 802.11b clients. However, there is a cost associated with this. When even a single legacy client joins a cell, all other clients and the AP must indicate traffic is present, using data rates the older client can understand. For 802.11g/b compatibility, this means using RTS/CTS at slower rates, considerably increasing overhead and decreasing cell

57www.arubanetworks.com
capacity. And of course, when the legacy station transmits or receives, it does so at lower data rates, reducing the effective capacity of the cell.
The 400 nsec guard interval is not often a realistic option in an enterprise network, where there will be many multipath reflections, some with long delay spreads.
Client design for 802.11n is challenging, as it is difficult on many devices to find the space to mount extra antennas, the extra RF chains and processing require more board area and power, and of course 802.11n silicon will command a price premium for several years over 802.11a/g silicon. Not least, NIC cards and clients such as Wi-Fi phones are complex to design: until recently, Wi-Fi phones were limited to 802.11b.
All these effects serve to reduce the effective capacity of a cell. Thus, while 802.11n advertises rates to 600Mbps, the expected capacity of an 802.11n cell is between 100 and 200Mbs, and it could certainly be less if clients connect over long distances, transmit short frames, or there are legacy 802.11a/b/g clients present. However, this is still an increase of 5x over 802.11a/g technology.
Here are our estimates of ‘reasonable’ expectations for data rates in an enterprise 802.11n deployment (this assumes ‘greenfield’ deployment with no legacy 802.11a/b/g clients or APs). Interpret this table as a comparison of the achievable data rate of 802.11n with that of 802.11a or 802.11g at the same distance from the access point. Alternatively, it can be read as the capacity of a cell (with all-802.11n clients) when compared with a cell of the same radius.
Spatial Streams Channel width (MHz)
Guard Interval (nsec)
Range of PHY rates (MHz)
Performance relative to 802.1 a/g
1 (2x1, �x1) 20 800 7.2-72.2 1x - 1.5x
1 (2x1, �x1) 40 800 1�.5 - 1�5 1.5x - 2x
2 (2x2) 40 800 27 - 270 2x - 4x
� (�x�) 40 800 40.5 - 405 4x - 6x
In addition to the PHY effects above, the many MAC enhancements in 802.11n will increase the throughput, and hence the capacity of a cell. Analysis of these effects is challenging, as they are extremely dependent
Appendix

58
Designed for Speed - 802.11n Theory and Practice
Aruba Networks
on the data patterns. Some of the enhancements are aimed specifically at streaming media such as video, but there has been speculation that they may actually reduce the throughput of other types of traffic such as voice or file transfers.
Note on expected ‘real-world’ data rates with 802.11nThis section is not based on thorough testing. It is not based on rigorous simulation. When papers giving figures through either of these methods become available, they will be both more accurate and more useful than the section below. However, since little information has not been published in digestible form, this analysis, which is based on many simplifications, but which gives results Aruba judges to be reasonable, may serve as a guide to the performance expected in practical 802.11n networks.
Methodology
This explanation is not necessary to an understanding of the results below, but is included so the scientifically-inclined can understand the degree of simplification involved in deriving the results.
In deriving the expected data rates and how they vary with distance from the access point, the following steps are employed:
• Calculate free space loss with distance.
• Apply a model (Rappaport et al) for typical in-building propagation loss.
• Calculate the signal to noise ratio (SNR) by distance from the access point.
• Apply some random statistics to the above to simulate a real-world network.
• Calculate the Shannon bandwidth of the channel, based on the SNR.
• Round to the nearest (lower) data rate available
This necessarily includes many approximations. In addition to the methodology above, the following assumptions were used:

5�www.arubanetworks.com
• Propagation loss at 5.5 GHz
• In-building propagation loss index of 2.7
• Assumed transmit power to the antenna of 100 mW, and combined antenna gains of 6 dBi
• 20 MHz, 40 MHz channel bandwidths for calculating thermal noise and Shannon bandwidth
• Variation of +/-6 dB in signal strength due to noise and fading effects. This is applied as a random factor uniformly distributed between +/-6 dB of the mean calculated by the in-building propagation formula.
• No allowance is made for beamforming, as this will not be incorporated in shipping silicon until at least 2008.
• Only up to � spatial streams are analysed, rather than the maximum of 4 in the standard: early products are expected to extend only � antennas and 2 spatial streams.
Free Space propagation loss, SNR and channel capacity
The general equation for calculating the loss in power (P) at a distance (d), where P is measured in dB, is given by:
P = 20log10(d) + 20log10(f) + A
Where f is the frequency (for our purposes, 5.5 GHz as the centre of the 5 GHz band), and A is a constant where we sweep a lot of base assumptions. The calculation used in the spreadsheet is:
P = 20log10(d) + 47.26
This is adjusted to give a figure for power at the receive antenna connector based a power level to the transmit connector of 100 mW and combined antenna gains of 6 dBi.
In-building propagation loss
Many academics, notably Theodore Rappaport, have researched how radio waves propagate in-building. It is not too harsh to say that the conclusion is that it is nearly impossible to predict performance in
Appendix
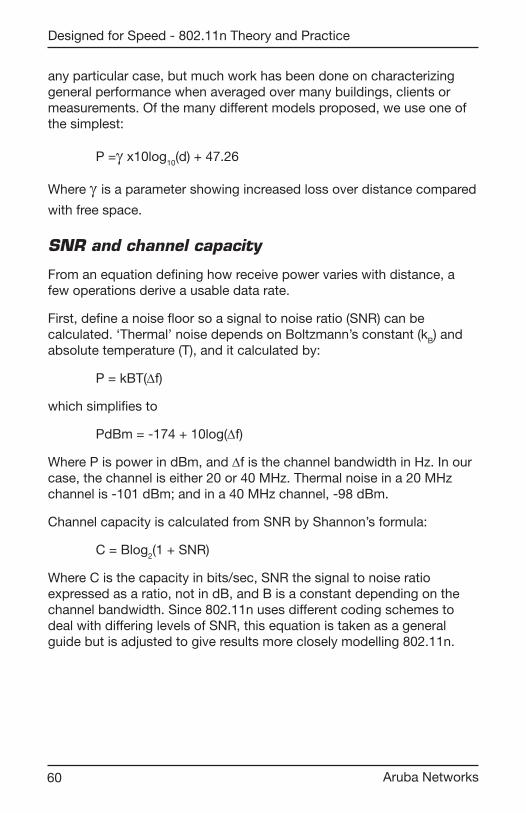
60
Designed for Speed - 802.11n Theory and Practice
Aruba Networks
any particular case, but much work has been done on characterizing general performance when averaged over many buildings, clients or measurements. Of the many different models proposed, we use one of the simplest:
P =γ x10log10(d) + 47.26
Where γ is a parameter showing increased loss over distance compared
with free space.
SNR and channel capacity
From an equation defining how receive power varies with distance, a few operations derive a usable data rate.
First, define a noise floor so a signal to noise ratio (SNR) can be calculated. ‘Thermal’ noise depends on Boltzmann’s constant (kB) and absolute temperature (T), and it calculated by:
P = kBT(Δf)
which simplifies to
PdBm = -174 + 10log(Δf)
Where P is power in dBm, and Δf is the channel bandwidth in Hz. In our case, the channel is either 20 or 40 MHz. Thermal noise in a 20 MHz channel is -101 dBm; and in a 40 MHz channel, -�8 dBm.
Channel capacity is calculated from SNR by Shannon’s formula:
C = Blog2(1 + SNR)
Where C is the capacity in bits/sec, SNR the signal to noise ratio expressed as a ratio, not in dB, and B is a constant depending on the channel bandwidth. Since 802.11n uses different coding schemes to deal with differing levels of SNR, this equation is taken as a general guide but is adjusted to give results more closely modelling 802.11n.

61www.arubanetworks.com
Maximum data rate (Mbps)
In-building
Free spaceDistance (meters)
Free space and in-building propogation loss model
0
10
20
30
40
50
60
70
80
1 2 4 5 7 8 9 11 12 14 15 16 18 19 21 22 23 25 26 28 29 30 32 33 35
The graph above shows the results of the free-space and in-building propagation models. The ‘free-space’ line assumes uninterrupted line-of-sight behaviour, and is obviously the upper-bound of what could be expected in practice: it will not be possible to improve on these figures in practical networks. The in-building plot shows a much steeper decline of data rate with distance, as one might expect: generally it assumes non-line-of-sight, and many multipath reflections. The general form of this curve is well-accepted: the slope varies depending on the type of environment. Our assumption is for a propagation factor γ of 2.7 (estimates vary from 2.0 for free-space to �.5 in extremely challenging environments), and we judge this reasonable for a building with few ‘thick’ internal walls, but with desks, cubicle partitions and ‘thin’ office walls and doors. A modern office building might be typical of this, whereas buildings constructed with internal walls of brick or concrete, or containing large metal objects would warrant a higher γ factor.
Applying noise and calculating expected data rates for 802.11n
To the raw calculations above, we add a factor to simulate random noise in the environment. This is a gross simplification of a typical enterprise environment, where there will be sources on non-random noise, and other Wi-Fi devices, which will in effect interfere with the channel under consideration, but it serves to give an indication of expected performance.
Appendix

62
Designed for Speed - 802.11n Theory and Practice
Aruba Networks
The methodology, explained above, is to apply a random variation in the range +/- 6dB to the mean values for in-building propagation above. This gives the figure for a single spatial stream in the plots below.
To model multiple spatial streams (SS), a number of independent random events are calculated, one for each SS in the system. These are then added using a variety of weightings, as it is not reasonable to expect perfect RF isolation of the spatial paths: adding a second SS will cause some interference and degradation of the first. Subtracting from this effect, however, the transmitter can use feedback from the receiver to characterize the combination of channels and adjust it’s antenna weightings. Overall we expect these effects to balance: the calculations above expect that the second and third spatial streams are directly additive to the overall data rates.
0
20
40
60
80
100
120
140
160
1 3 5 6 8
10 12 14 15 17 19 21 23 24 26 28 30 32 33
Free space
2 SS, 20 MHz wtih noise
1 SS, 20 MHz with noise
Data rates varying with distance
Maximum data rate (Mbps)
Distance (meters)
The diagram above also includes a simplification, in that it assumes non-line-of-sight, but with significant multipath: good conditions for MIMO with SDM. Our practical experience in our own office building suggests that actual data rates can be lower at short distances from the access point, because there is more likely to be line-of-sight, especially with ceiling-mounted antennas. This means that at short range, line-of-sight negates the MIMO effect, and data rates are similar to single
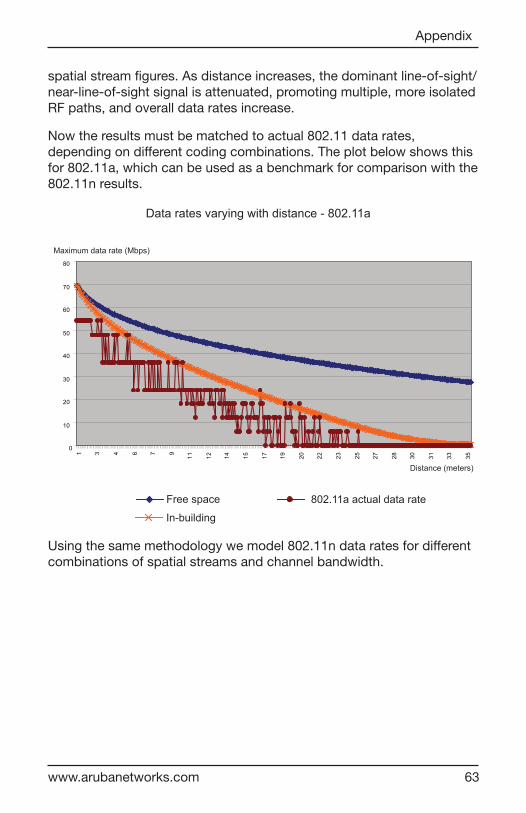
6�www.arubanetworks.com
spatial stream figures. As distance increases, the dominant line-of-sight/near-line-of-sight signal is attenuated, promoting multiple, more isolated RF paths, and overall data rates increase.
Now the results must be matched to actual 802.11 data rates, depending on different coding combinations. The plot below shows this for 802.11a, which can be used as a benchmark for comparison with the 802.11n results.
In-building
Free space 802.11a actual data rate
Maximum data rate (Mbps)
Distance (meters)
Data rates varying with distance - 802.11a
0
10
20
30
40
50
60
70
80
1 3 4 6 7 9
11 12 14 15 17 19 20 22 23 25 27 28 30 31 33 35
Using the same methodology we model 802.11n data rates for different combinations of spatial streams and channel bandwidth.
Appendix

64
Designed for Speed - 802.11n Theory and Practice
Aruba Networks
1 SS, 20MHz 802.11a (20MHz)
2 SS, 40MHz
1 SS, 40MHz
Maximum data rate (Mbps)
Distance (meters)
Data rates varying with distance - 802.11n
0
50
100
150
200
250
300
1 3 5 7 9 11 12 14 16 18 20 22 24 26 28 30 31 33
The results demonstrate that even with one spatial stream, 802.11n gains range over 802.11a/g. This can be ascribed to STBC, MRC and a series of minor PHY-layer improvements (beamforming is not included in this model). The extent of this improvement of 802.11n range over 802.11a is perhaps 5% for single antennas, increasing to 50% where extra antennas are available.
Also, the effective range of 802.11n (the distance at which the lowest data rate becomes unreliable) increases slightly with the number of spatial streams: maybe 20% with the second spatial stream. While this may seem to be a small increase, it will allow an increase in the spacing of access points, and a reduction in their number of perhaps �0-50%.
Note that as this model deals only with range and data rates at the PHY layer, the achievable throughput will be less than indicated above – sometimes considerably less, especially when older 802.11a/b/g clients are present in the cell.
The table below shows the estimated contribution of different 802.11n features in extending range (range here is defined as the distance at which the error rate at the lowest defined data rate becomes excessive: the range is compared to 802.11a).
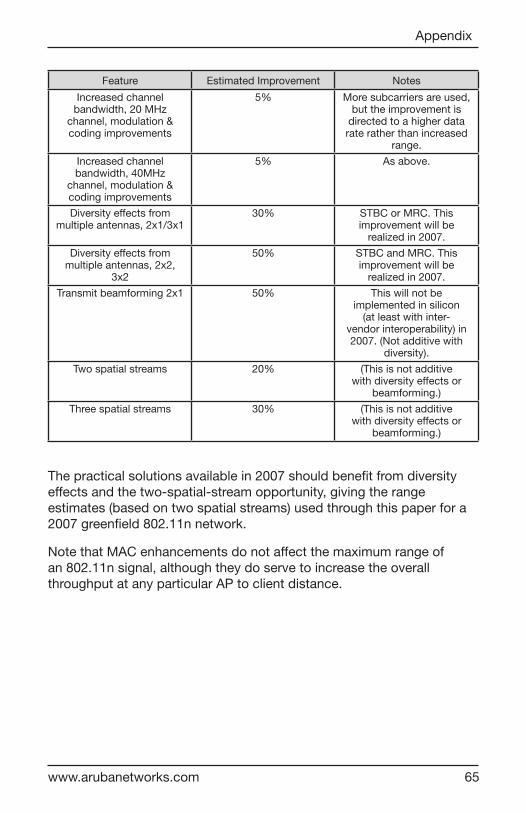
65www.arubanetworks.com
Feature Estimated Improvement Notes
Increased channel bandwidth, 20 MHz
channel, modulation & coding improvements
5% More subcarriers are used, but the improvement is
directed to a higher data rate rather than increased
range.
Increased channel bandwidth, 40MHz
channel, modulation & coding improvements
5% As above.
Diversity effects from multiple antennas, 2x1/�x1
�0% STBC or MRC. This improvement will be
realized in 2007.
Diversity effects from multiple antennas, 2x2,
�x2
50% STBC and MRC. This improvement will be
realized in 2007.
Transmit beamforming 2x1 50% This will not be implemented in silicon
(at least with inter-vendor interoperability) in 2007. (Not additive with
diversity).
Two spatial streams 20% (This is not additive with diversity effects or
beamforming.)
Three spatial streams �0% (This is not additive with diversity effects or
beamforming.)
The practical solutions available in 2007 should benefit from diversity effects and the two-spatial-stream opportunity, giving the range estimates (based on two spatial streams) used through this paper for a 2007 greenfield 802.11n network.
Note that MAC enhancements do not affect the maximum range of an 802.11n signal, although they do serve to increase the overall throughput at any particular AP to client distance.
Appendix

66
Designed for Speed - 802.11n Theory and Practice
Aruba Networks
Forms of MIMOThere are already more than enough terms and acronyms in this document. We have deliberately avoided introducing more than were necessary to explain 802.11n. But the reader may have encountered ‘SIMO’ and other terms. The figure below shows that these are just degenerate forms of MIMO with a single antenna chain at one or the other end of the connection:
Tx
Tx
Rx
Rx
Tx Rx
Tx
Tx Rx
Tx
Rx
Rx
SISO(Single input, single output)
MISO(Multiple input, single output)
SIMO(Single input, multiple output)
MIMO(Multiple input, multiple output)
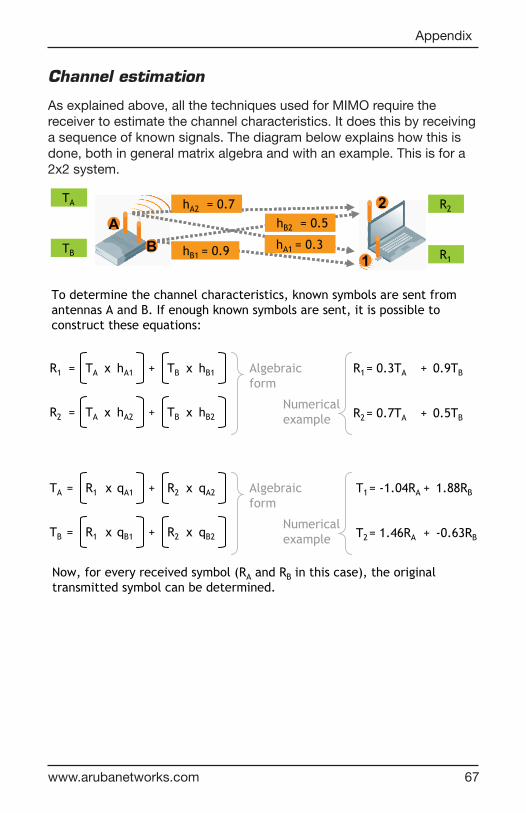
67www.arubanetworks.com
Channel estimation
As explained above, all the techniques used for MIMO require the receiver to estimate the channel characteristics. It does this by receiving a sequence of known signals. The diagram below explains how this is done, both in general matrix algebra and with an example. This is for a 2x2 system.
AB
1
2hA2 = 0.7
hB1 = 0.9
hB2 = 0.5
hA1 = 0.3
To determine the channel characteristics, known symbols are sent fromantennas A and B. If enough known symbols are sent, it is possible toconstruct these equations:
TA
TB
R2
R1
R1 = TA x hA1 + TB x hB1
R2 = TA x hA2 + TB x hB2
TA = R1 x qA1 + R2 x qA2
TB = R1 x qB1 + R2 x qB2
Now, for every received symbol (RA and RB in this case), the originaltransmitted symbol can be determined.
R1= 0.3TA + 0.9TB
R2= 0.7TA + 0.5TB
T1= -1.04RA + 1.88RB
T2= 1.46RA + -0.63RB
Algebraicform
Numericalexample
Algebraicform
Numericalexample
Appendix

68
Designed for Speed - 802.11n Theory and Practice
Aruba Networks
Glossary of terms used in this note802.11 is replete with acronyms, and 802.11n has contributed more than its share to the lexicon. The following is a subset of terms used in the standard, but should cover all terms used above.
A-MPDU Aggregate MAC protocol data unit
A-MSDI Aggregate MAC service data unit
AP Access point
CTS Clear to send
DTT Downlink transmission time (Power-save multi-poll)
HT High throughput
HT-GF-STS High throughput greenfield short training symbol
HT-STF High throughput long training field
HT-SIG High throughput signal field
HT-STF High throughput short training field
LDPC Low density parity check
L-LTF Non-high throughput (= legacy) long training field
L-SIG Non-high throughput (= legacy) signal field
L-STF Non-high throughput (= legacy) short training field
LTF Long training field
MC Mobility Controller (an Aruba product controlling access points)
MCS Modulation coding scheme
MIMO Multiple input, multiple output
MISO Multiple input, single output
MRQ Modulation coding scheme request
MTBA Multiple traffic ID block acknowledgement
NAV Network Allocation Value
PCO Phased coexistence operation
PSMP Power save multi-poll
6�www.arubanetworks.com
RF Radio frequency
RIFS Reduced inter-frame spacing
RTS Request to send
SISO Single input, single output
SM Spatial multiplexing
SNR Signal to noise ratio
STBC Space time block code
STBC/SM Space time block code / spatial multiplexing
TRQ Training request
TxBF Transmit beamforming
UTT Uplink transmission time (Power save multi-poll)
WLAN Wireless Local Area Network
ReferencesThe IEEE is the fount of 802.11 standards. While it does not publish standards until final ratification, much useful information may be found here: http://grouper.ieee.org/groups/802/11/. In particular, there is a useful summary of each forthcoming amendment (currently under ‘WG Info / 802.11 Quick Guide’) and a current estimate of schedules (use the search box for ‘timeline’).
The information in this paper was taken from and checked against the IEEE document ‘P802.11n draft 2.0’.
The Wi-Fi Alliance certification is ‘Draft-n’. The WFA web site is here: http://wi-fi.org/
Glossary and References

70
Designed for Speed - 802.11n Theory and Practice
Aruba Networks
About Aruba Networks, Inc.Aruba securely delivers the enterprise network to users, wherever they work or roam, with usercentric networks that significantly expand the reach of traditional port-centric networks. Usercentric networks integrate adaptive WLANs, identity-based security, and application continuity services into a cohesive, high-performance system that can be easily deployed as an overlay on top of existing network infrastructure. Adaptive WLANs deliver high-performance, follow-me connectivity so users are always within reach of mission-critical information. Identity-based security associates access policies with users, not ports, to enable follow-me security that is enforced regardless of access method or location. Application continuity services enable followme applications that can be seamlessly accessed across WLAN and cellular networks. The cost, convenience, and security benefits of user-centric networks are fundamentally changing how and where we work. Listed on the NASDAQ and Russell 2000® Index, Aruba is based in Sunnyvale, California, and has operations throughout the Americas, Europe, Middle East, and Asia Pacific regions. To learn more, visit Aruba at http://www.arubanetworks.com.
© 2007 Aruba Networks, Inc. All rights reserved. Aruba Networks, BlueScanner and RFprotect are trademarks of Aruba Networks, Inc. All other trademarks or registered trademarks are the property of their respective holders. All rights reserved. Specifications are subject to change without notice.


www.arubanetworks.com
WP_80211n_US_071018