Arturo Sanchez-Azofeifa, PhD, PEng Cassidy Rankine ... · Cassidy Rankine, Gilberto...
27
Arturo Sanchez-Azofeifa, PhD, PEng Cassidy Rankine, Gilberto Zonta-Pastorello Centre for Earth Observation Sciences (CEOS) Earth and Atmospheric Sciences Department University of Alberta Microsoft WSN Workshop Sao Paulo, Brazil November 2010
Transcript of Arturo Sanchez-Azofeifa, PhD, PEng Cassidy Rankine ... · Cassidy Rankine, Gilberto...
Arturo Sanchez-Azofeifa, PhD, PEng
Cassidy Rankine, Gilberto Zonta-PastorelloCentre for Earth Observation Sciences (CEOS)
Earth and Atmospheric Sciences Department
University of Alberta
Microsoft WSN Workshop
Sao Paulo, Brazil
November 2010

What do we know?
•Well… Very little to start with (although 47% of the tropics are tdfs).
•Dry forests lag on long term studies aimed to understand their response to climate change. In fact, dry forest lag on a ratio of 1:300 scientific papers when compared with tropical rainforests.
•Ecological studies in dry forestes are systematic in two regions: Chamela-Cuixmala biosphere reserve, Mexico; and Santa Rosa National Park; Costa Rica.
•Tropical Forests are not considered part of any global networks aimed to link climate change observations and models to phenological response; nor are part of long term monitoring efforts.
•Tropical dry forests present well define phenological signals allowing for unique opportunities to evaluate their response to climate change and specially drought effects.
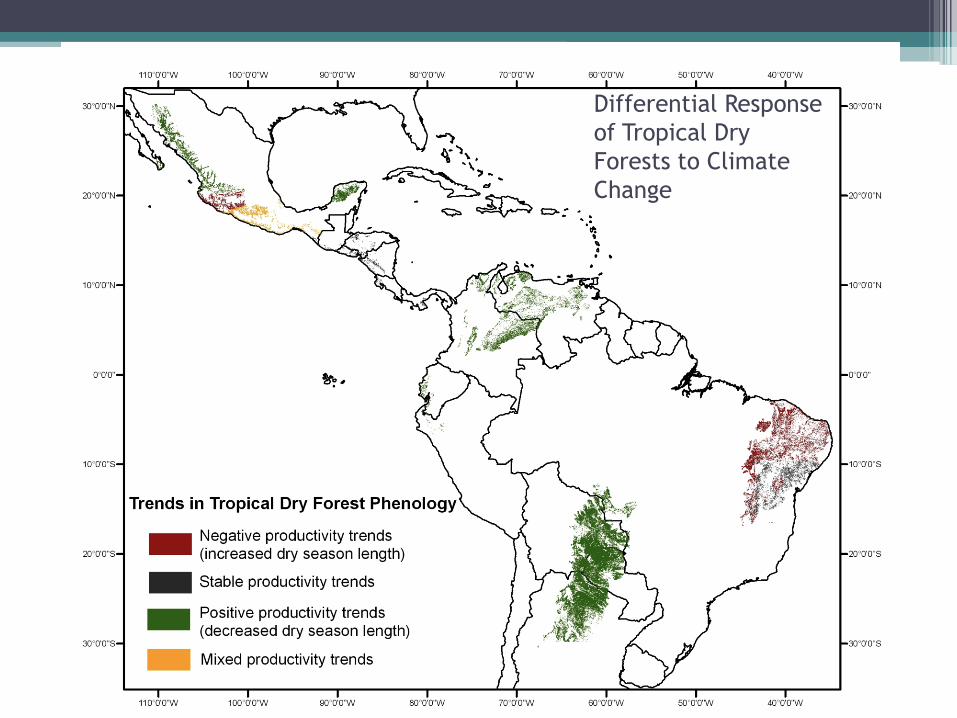
Differential Response
of Tropical Dry
Forests to Climate
Change
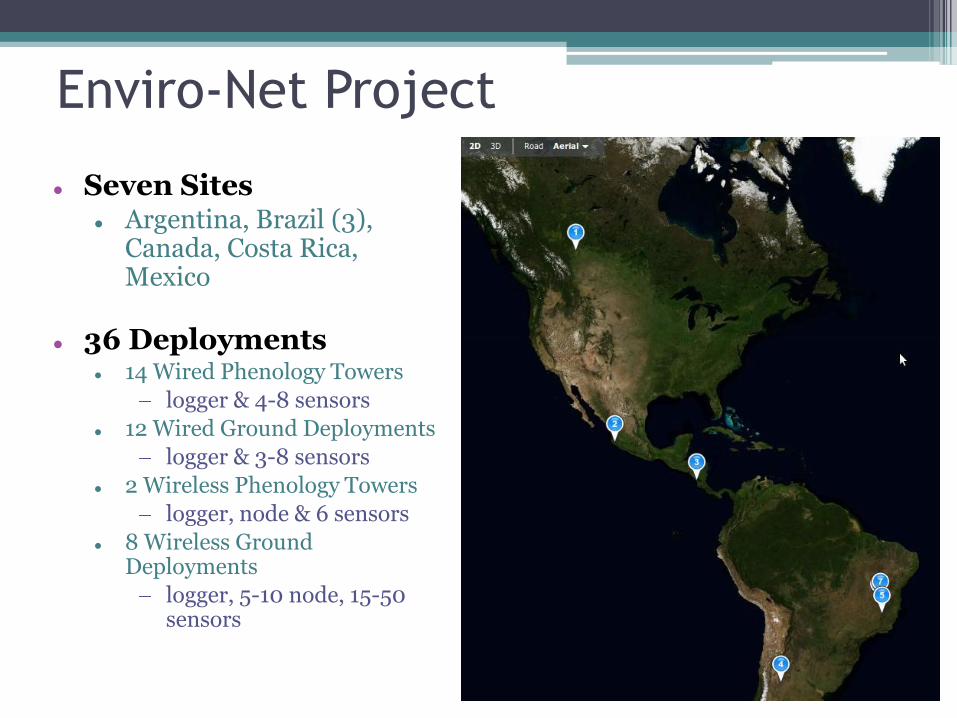
Enviro-Net Project
Seven Sites Argentina, Brazil (3),
Canada, Costa Rica, Mexico
36 Deployments 14 Wired Phenology Towers
logger & 4-8 sensors
12 Wired Ground Deployments
logger & 3-8 sensors
2 Wireless Phenology Towers
logger, node & 6 sensors
8 Wireless Ground Deployments
logger, 5-10 node, 15-50 sensors
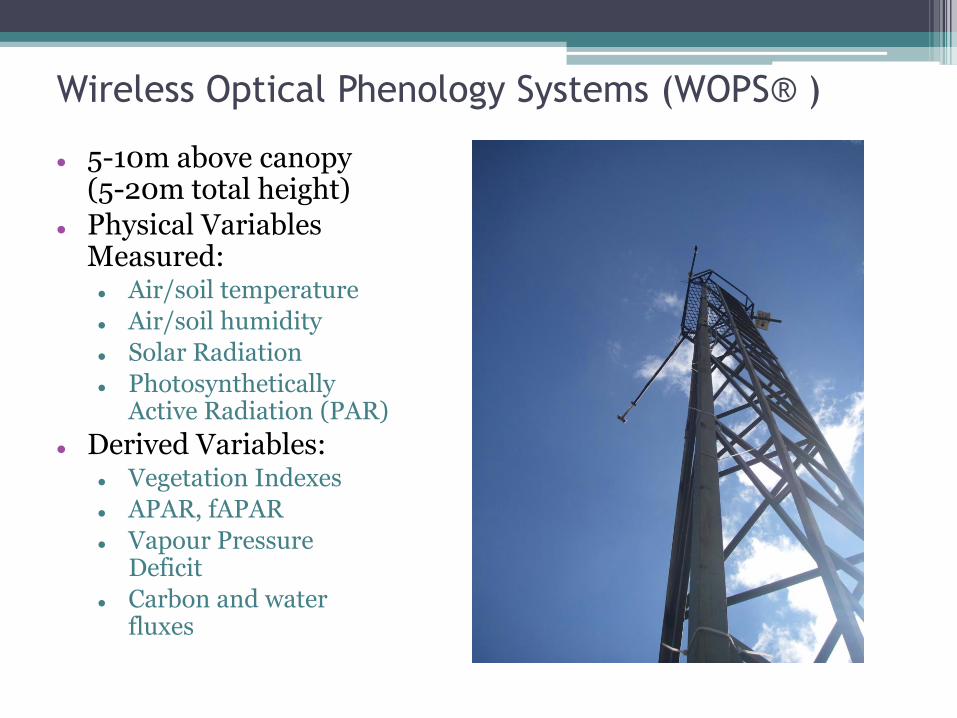
Wireless Optical Phenology Systems (WOPS® )
5-10m above canopy (5-20m total height)
Physical Variables Measured: Air/soil temperature
Air/soil humidity
Solar Radiation
Photosynthetically Active Radiation (PAR)
Derived Variables: Vegetation Indexes
APAR, fAPAR
Vapour Pressure Deficit
Carbon and water fluxes
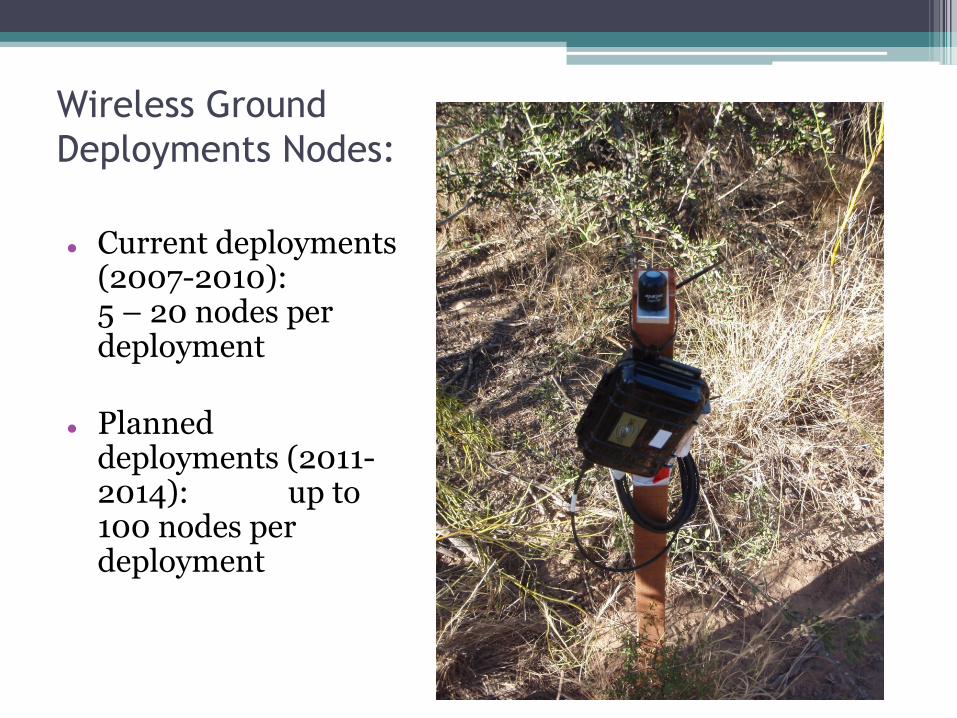
Wireless Ground
Deployments Nodes:
Current deployments (2007-2010): 5 – 20 nodes per deployment
Planned deployments (2011-2014): up to 100 nodes per deployment
WSN Understory PAR
• Understory light environment highly variable
• Networks of ~12 wireless PAR sensors capture this variable nature to better estimate FAPAR
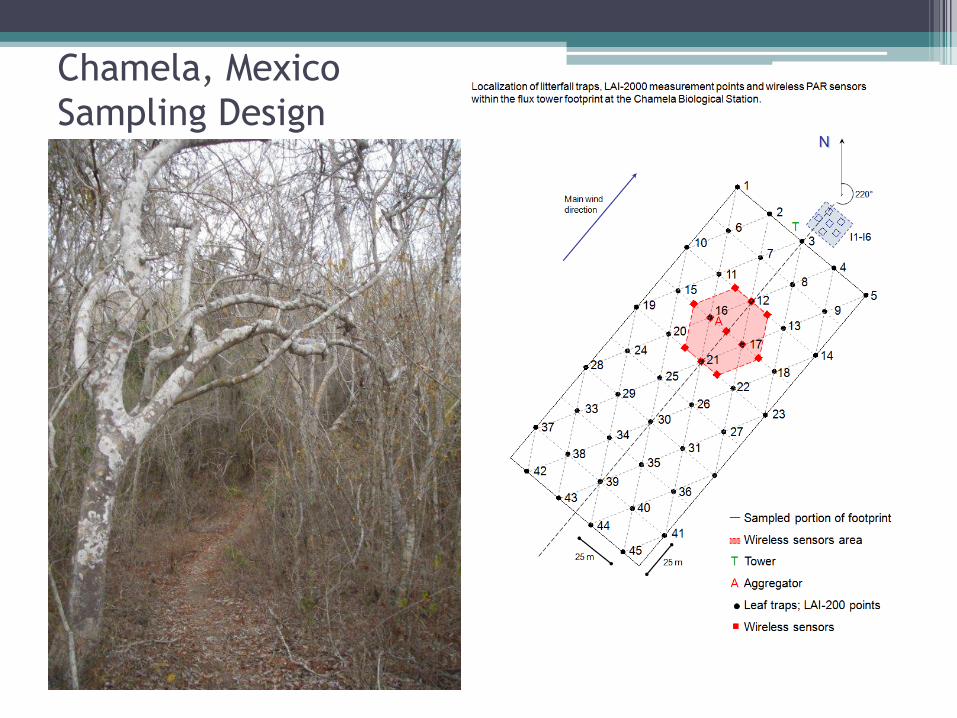
Chamela, Mexico
Sampling Design
Phenology tower
WSN Aggregator, Collector: PAR, T/RHWSN Collector: PAR, T/RH
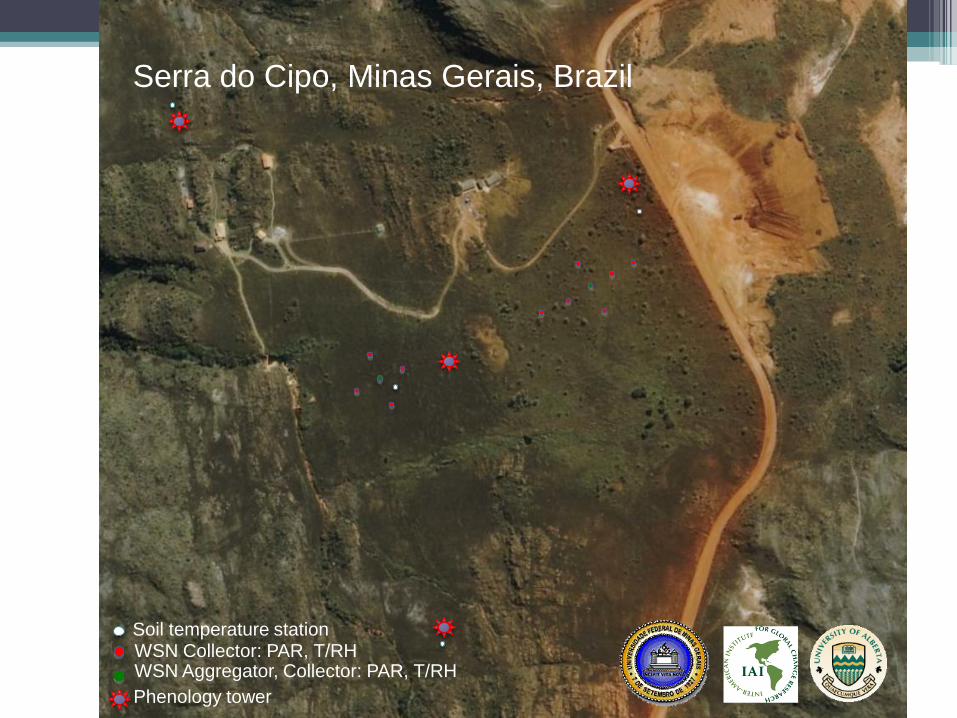
Serra do Cipo, Minas Gerais, Brazil
Soil temperature station
CC4
MC6 MC8
IC7 ETCP
IC4
Phenology tower
Wireless sensor network (PAR, T/RH)
Understory meteorological station (rain, T/RH, PAR, Soil Moisture)
Understory Wireless sensor network PAR experiment
Phenology digital camera & logger
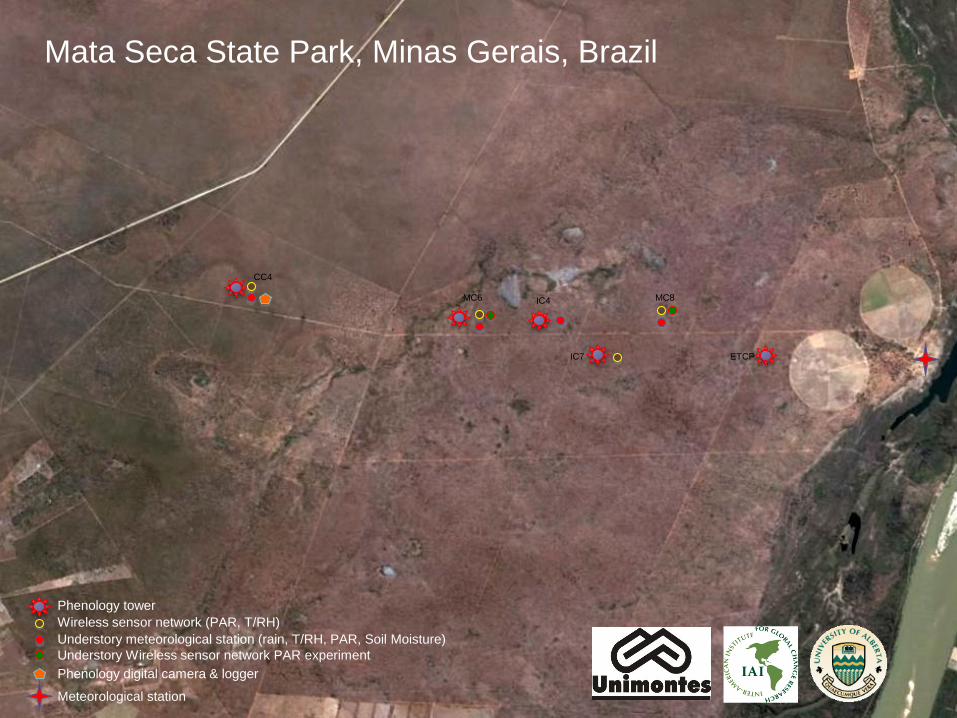
Mata Seca State Park, Minas Gerais, Brazil
Meteorological station

• Data management within Wireless
Sensor Networks (WSNs), e.g.,
algorithms for in-network query
processing
• Exploiting the (potential) synergy
between networking issues and
data management within WSNs,
e.g., logical topology and packet
scheduling oriented by query
semantics
• Indexing of spatio-temporal data
and time-series with a focus on
re-using sound and industrially
tested technologies, e.g., B+-trees
• Data mining, web data and social
network analysis
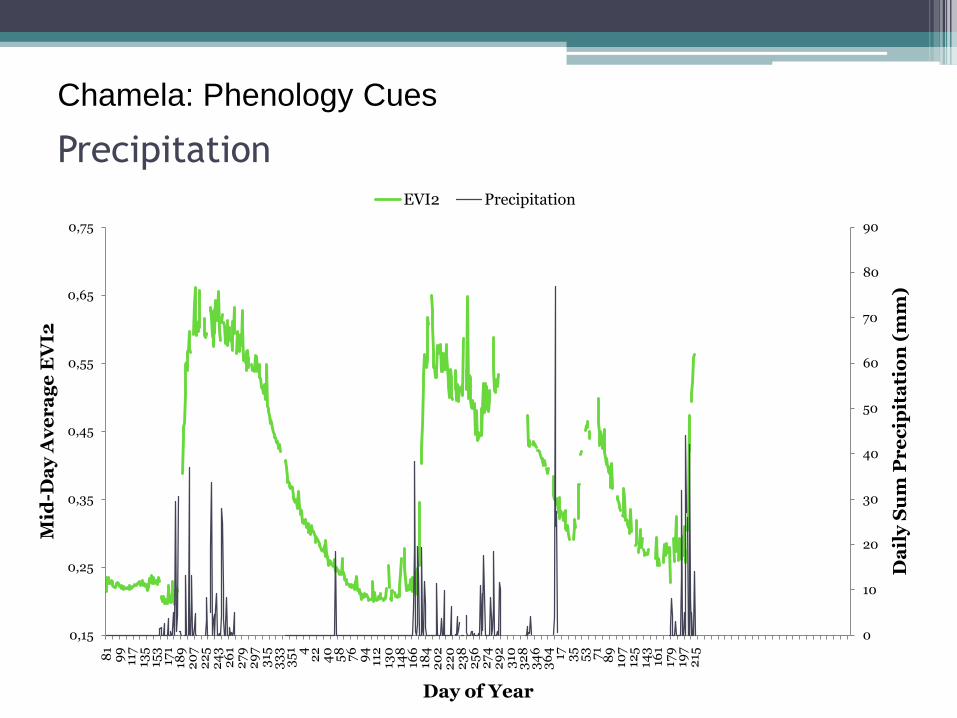
Precipitation
0
10
20
30
40
50
60
70
80
90
0,15
0,25
0,35
0,45
0,55
0,65
0,75
81
99
117
135
153
171
189
20
72
25
24
32
61
27
92
97
315
33
33
51 4
22
40
58 76
94
112
130
148
166
184
20
22
20
23
82
56
27
42
92
310
32
83
46
36
4 17 35
53 71
89
107
125
143
161
179
197
215
Da
ily
Su
m P
re
cip
ita
tio
n (
mm
)
Mid
-Da
y A
ve
ra
ge
EV
I2
Day of Year
EVI2 Precipitation
Chamela: Phenology Cues
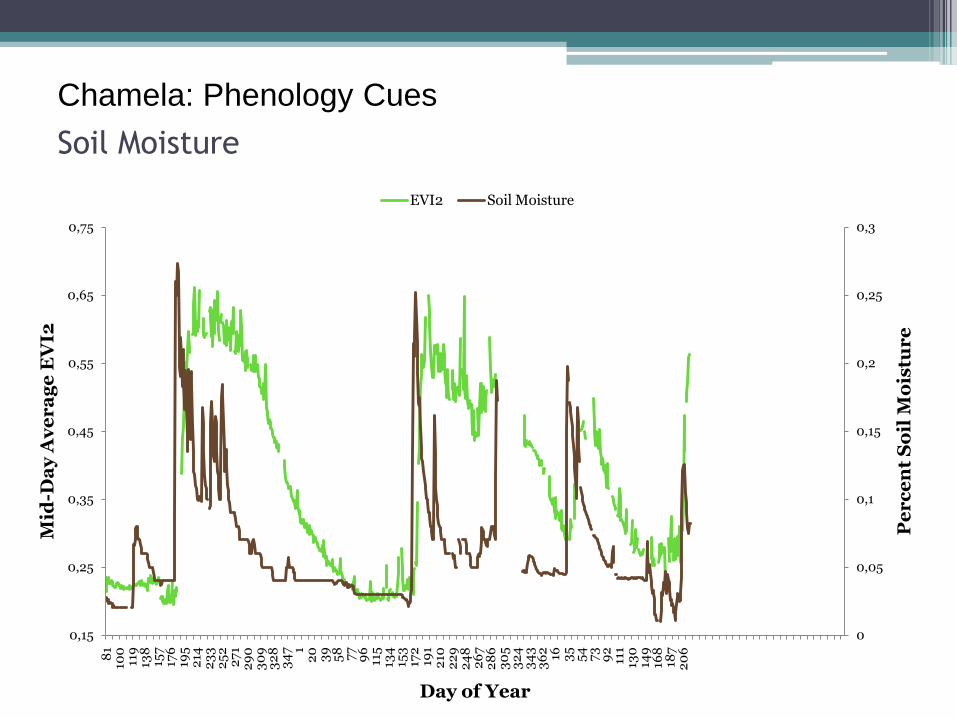
Soil Moisture
0
0,05
0,1
0,15
0,2
0,25
0,3
0,15
0,25
0,35
0,45
0,55
0,65
0,75
81
100
119
138
157
176
195
214
23
32
52
27
12
90
30
93
28
34
7 12
03
95
8 77
96
115
134
153
172
191
210
22
92
48
26
72
86
30
53
24
34
33
62 16 35
54
73
92
111
130
149
168
187
20
6
Pe
rc
en
t S
oil
Mo
istu
re
Mid
-Da
y A
ve
ra
ge
EV
I2
Day of Year
EVI2 Soil Moisture
Chamela: Phenology Cues
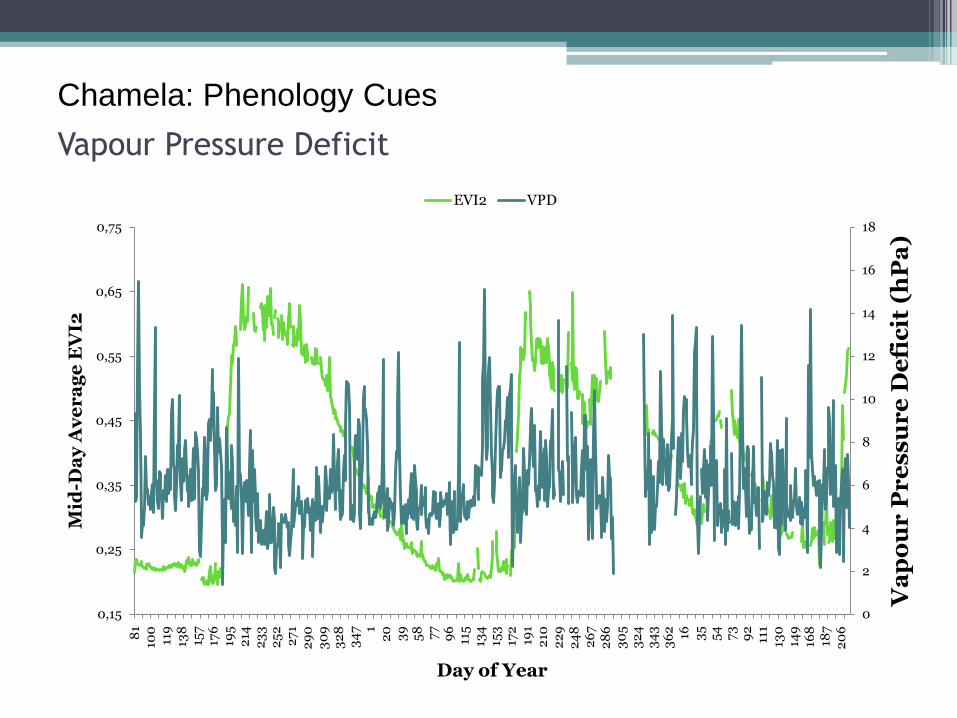
Vapour Pressure Deficit
0
2
4
6
8
10
12
14
16
18
0,15
0,25
0,35
0,45
0,55
0,65
0,75
81
100
119
138
157
176
195
214
23
32
52
27
12
90
30
93
28
34
7 12
03
95
8 77
96
115
134
153
172
191
210
22
92
48
26
72
86
30
53
24
34
33
62 16 35
54
73
92
111
130
149
168
187
20
6
Va
po
ur
Pr
es
su
re
De
fic
it (
hP
a)
Mid
-Da
y A
ve
ra
ge
EV
I2
Day of Year
EVI2 VPD
Chamela: Phenology Cues
0,035
0,045
0,055
0,065
0,075
0,085
0,095
0,15
0,25
0,35
0,45
0,55
0,65
0,75
81
101
121
141
161
181
20
12
21
24
12
61
28
13
01
32
13
41
36
116 36
56
76
96
116
136
156
176
196
216
23
62
56
27
62
96
316
33
63
56 11 31
51
71
91
111
131
151
171
191
211
Ca
no
py
Alb
ed
o (
PA
R O
ut/
PA
R I
n)
Mid
-Da
y C
an
op
y E
VI2
Day of Year
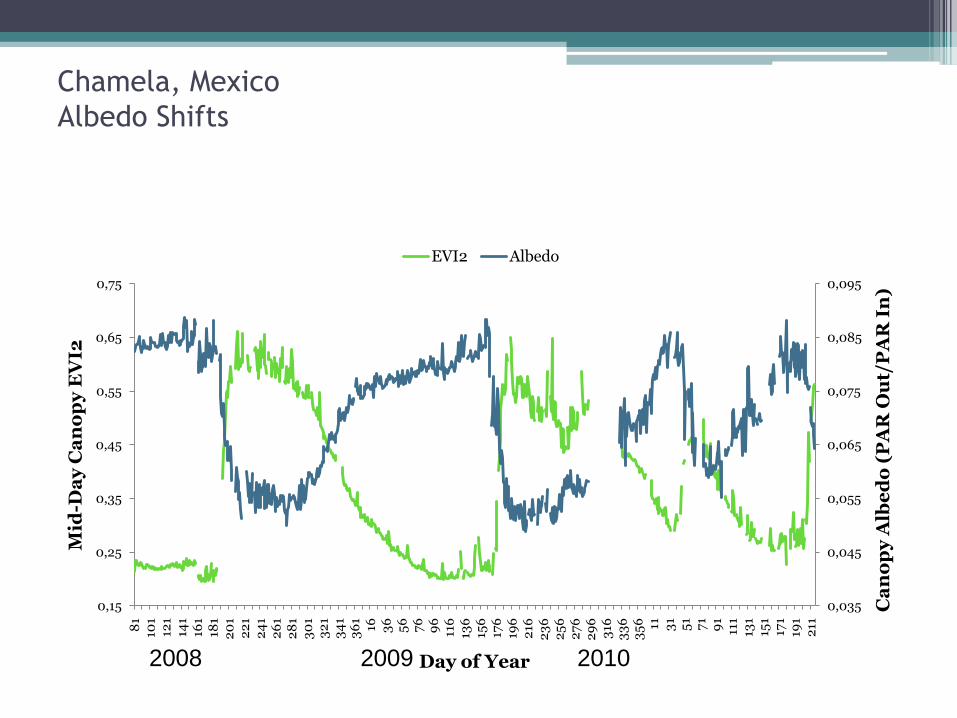
EVI2 Albedo
2008 2009 2010
Chamela, Mexico
Albedo Shifts
0,15
0,25
0,35
0,45
0,55
0,65
0,75
1 8 15 22
29
36
43
50 57
64 71
78
85
92
99
106
113
120
127
134
141
148
155
162
169
176
183
190
197
20
42
112
182
25
23
22
39
24
62
53
26
02
67
27
42
81
28
82
95
30
23
09
316
32
33
30
33
73
44
35
13
58
36
5
Mid
-Da
y C
an
op
y E
VI2
Day of Year
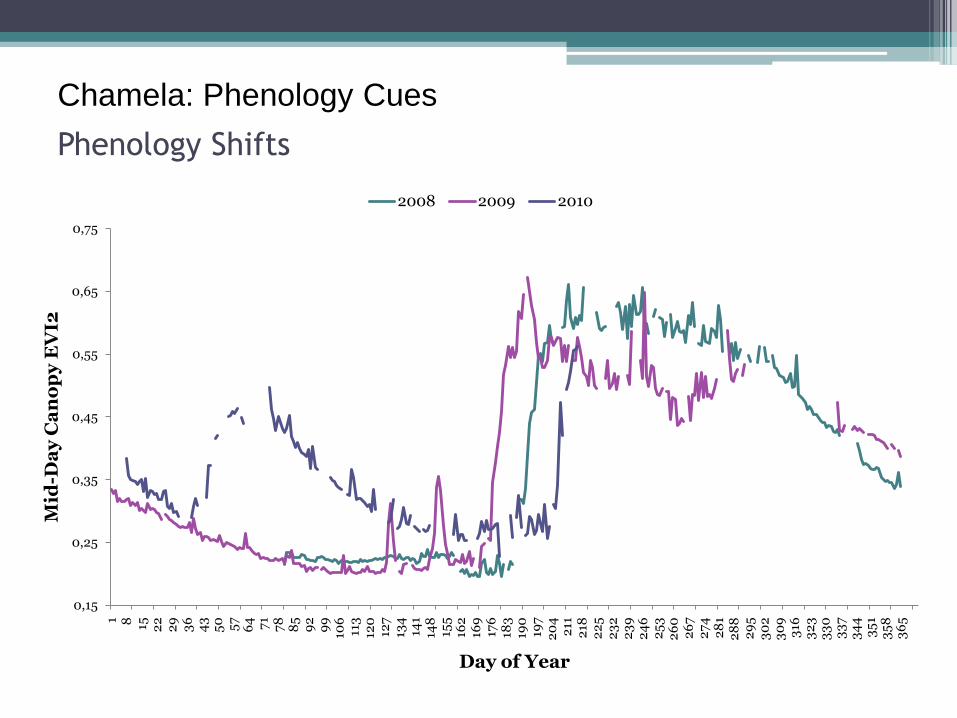
2008 2009 2010
Chamela: Phenology Cues
Phenology Shifts
0
10
20
30
40
50
60
70
80
0,15
0,25
0,35
0,45
0,55
0,65
0,75
171
09
179
09
187
09
195
09
20
3 0
92
11 0
92
19 0
92
27
09
23
5 0
92
43
09
25
1 0
92
59
09
26
7 0
92
75
09
28
3 0
92
91
09
29
9 0
93
07
09
315
09
32
3 0
93
31
09
33
9 0
93
47
09
35
5 0
93
63
09
6 1
014
10
22
10
30
10
38
10
46
10
54
10
62
10
70
10
78
10
86
10
94
10
102
10
110
10
118
10
126
10
134
10
142
10
150
10
158
10
Da
ily
Su
m P
re
cip
ita
tio
n (
mm
)
Ca
no
py
EV
I2
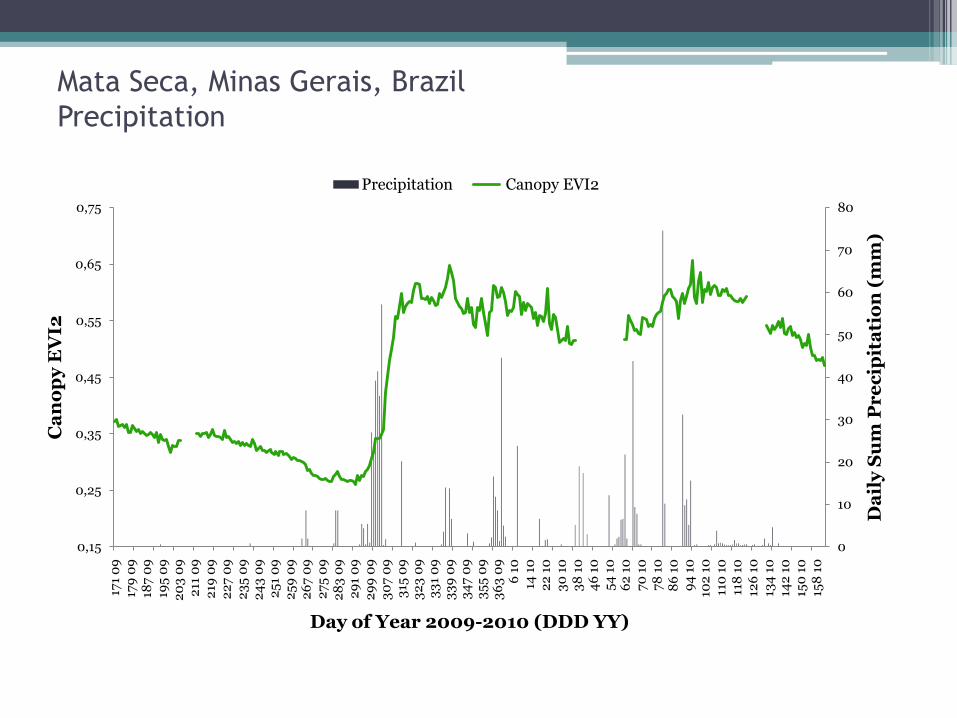
Day of Year 2009-2010 (DDD YY)
Precipitation Canopy EVI2
Mata Seca, Minas Gerais, Brazil
Precipitation
0,0%
5,0%
10,0%
15,0%
20,0%
25,0%
0,15
0,25
0,35
0,45
0,55
0,65
0,75
171
09
180
09
189
09
198
09
20
7 0
9
216
09
22
5 0
9
23
4 0
9
24
3 0
9
25
2 0
9
26
1 0
9
27
0 0
9
27
9 0
9
28
8 0
9
29
7 0
9
30
6 0
9
315
09
32
4 0
9
33
3 0
9
34
2 0
9
35
1 0
9
36
0 0
9
4 1
0
13 1
0
22
10
31
10
40
10
49
10
58
10
67
10
76
10
85
10
94
10
103
10
112
10
121
10
130
10
139
10
148
10
157
10
So
il M
ois
tur
e
(%)
Ca
no
py
EV
I2
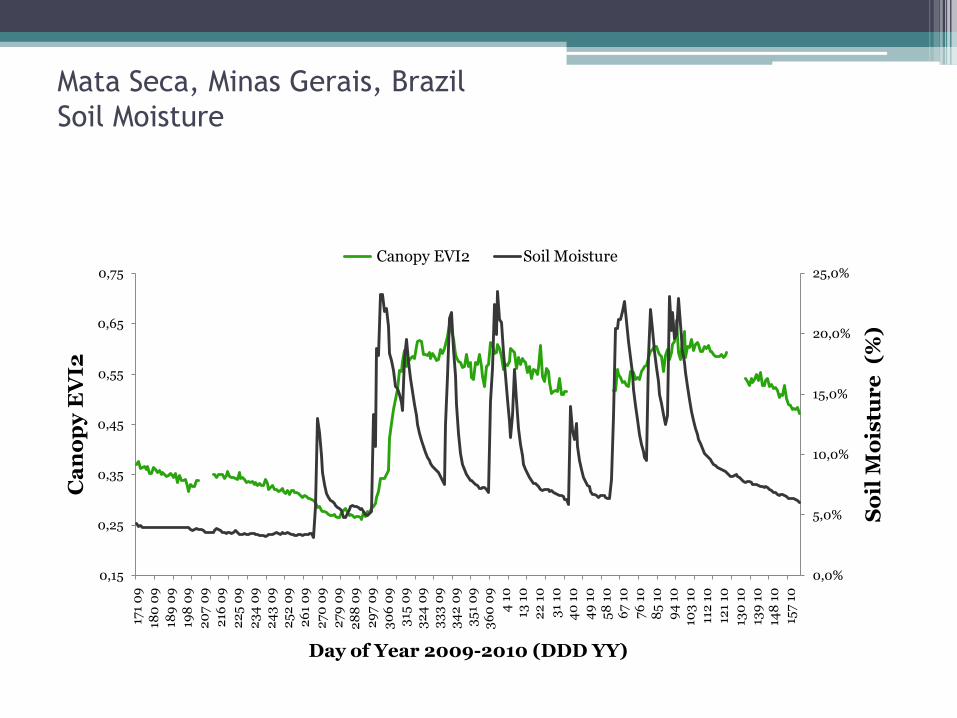
Day of Year 2009-2010 (DDD YY)
Canopy EVI2 Soil Moisture
Mata Seca, Minas Gerais, Brazil
Soil Moisture
0
5
10
15
20
25
30
35
0,15
0,25
0,35
0,45
0,55
0,65
0,75
17
1 0
9
18
0 0
9
18
9 0
9
19
8 0
9
20
7 0
9
21
6 0
9
22
5 0
9
23
4 0
9
24
3 0
9
25
2 0
9
26
1 0
9
27
0 0
9
27
9 0
9
28
8 0
9
29
7 0
9
30
6 0
9
31
5 0
9
32
4 0
9
33
3 0
9
34
2 0
9
35
1 0
9
36
0 0
9
4 1
0
13
10
22
10
31
10
40
10
49
10
58
10
67
10
76
10
85
10
94
10
10
3 1
0
11
2 1
0
12
1 1
0
13
0 1
0
13
9 1
0
14
8 1
0
15
7 1
0
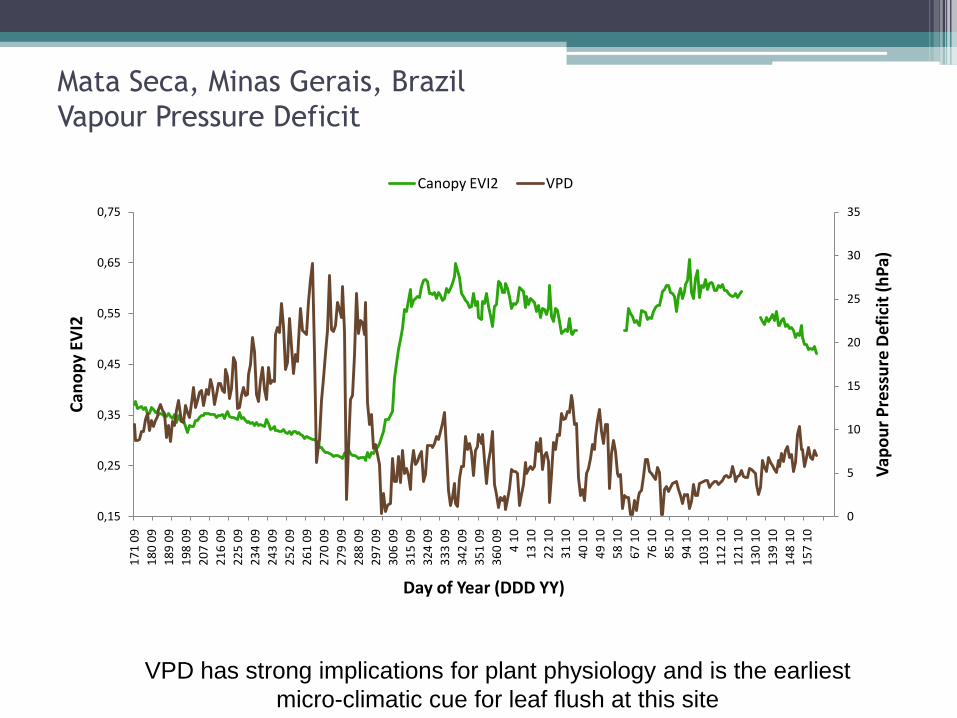
Vap
ou
r P
ress
ure
Def
icit
(h
Pa)
Can
op
y EV
I2
Day of Year (DDD YY)
Canopy EVI2 VPD
VPD has strong implications for plant physiology and is the earliest
micro-climatic cue for leaf flush at this site
Mata Seca, Minas Gerais, Brazil
Vapour Pressure Deficit
0,03
0,035
0,04
0,045
0,05
0,055
0,06
0,065
0,07
0,075
0,08
0,15
0,25
0,35
0,45
0,55
0,65
0,75
171
09
180
09
189
09
198
09
20
7 0
9
216
09
22
5 0
9
23
4 0
9
24
3 0
9
25
2 0
9
26
1 0
9
27
0 0
9
27
9 0
9
28
8 0
9
29
7 0
9
30
6 0
9
315
09
32
4 0
9
33
3 0
9
34
2 0
9
35
1 0
9
36
0 0
9
4 1
0
13 1
0
22
10
31
10
40
10
49
10
58
10
67
10
76
10
85
10
94
10
103
10
112
10
121
10
130
10
139
10
148
10
157
10 Ca
no
py
Alb
ed
o (
PA
R O
ut/
PA
R I
n)
Ca
no
py
EV
I2
Day of Year (DDD YY)
Canopy EVI2 Canopy Albedo
Important implications for phenological remote sensing
Mata Seca, Minas Gerais, Brazil
Alberdo Shifts
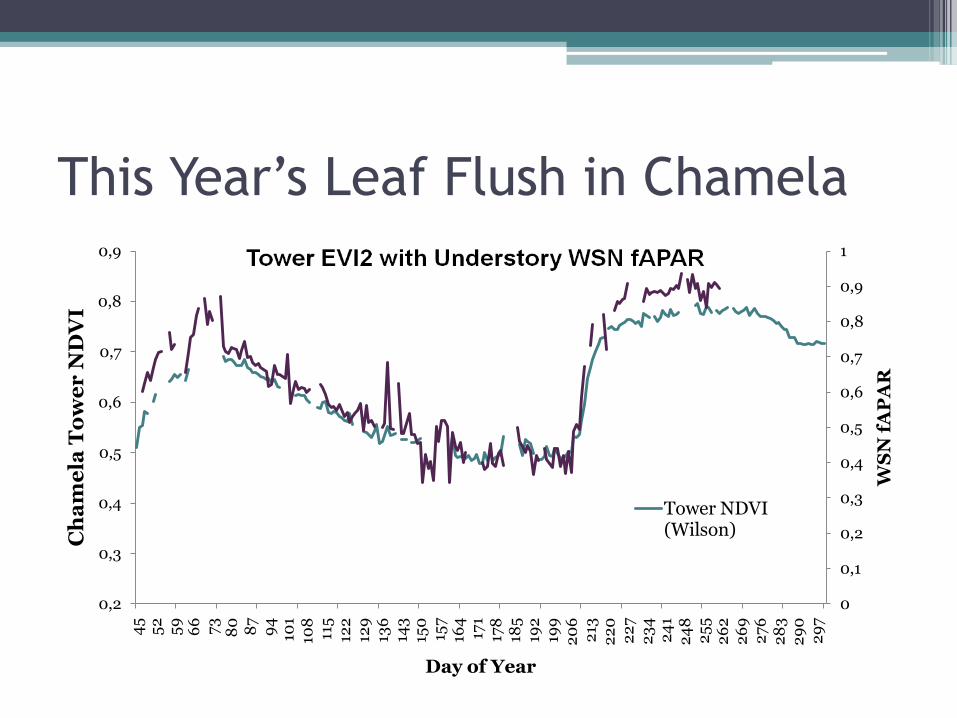
This Year’s Leaf Flush in Chamela
0
0,1
0,2
0,3
0,4
0,5
0,6
0,7
0,8
0,9
1
0,2
0,3
0,4
0,5
0,6
0,7
0,8
0,9
45
52
59
66
73
80 87
94
101
108
115
122
129
136
143
150
157
164
171
178
185
192
199
20
62
132
20
22
72
34
24
12
48
25
52
62
26
92
76
28
32
90
29
7
WS
N f
AP
AR
Ch
am
ela
To
we
r N
DV
I
Day of Year
Tower NDVI (Wilson)
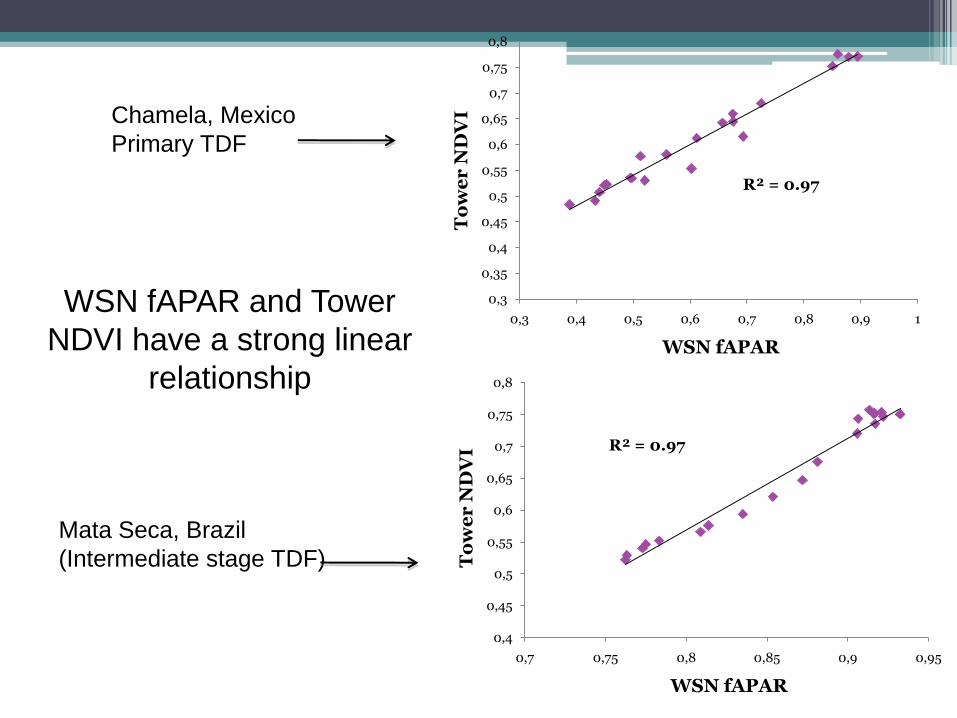
R² = 0.97
0,3
0,35
0,4
0,45
0,5
0,55
0,6
0,65
0,7
0,75
0,8
0,3 0,4 0,5 0,6 0,7 0,8 0,9 1
To
we
r N
DV
I
WSN fAPAR
R² = 0.97
0,4
0,45
0,5
0,55
0,6
0,65
0,7
0,75
0,8
0,7 0,75 0,8 0,85 0,9 0,95
To
we
r N
DV
I
WSN fAPAR
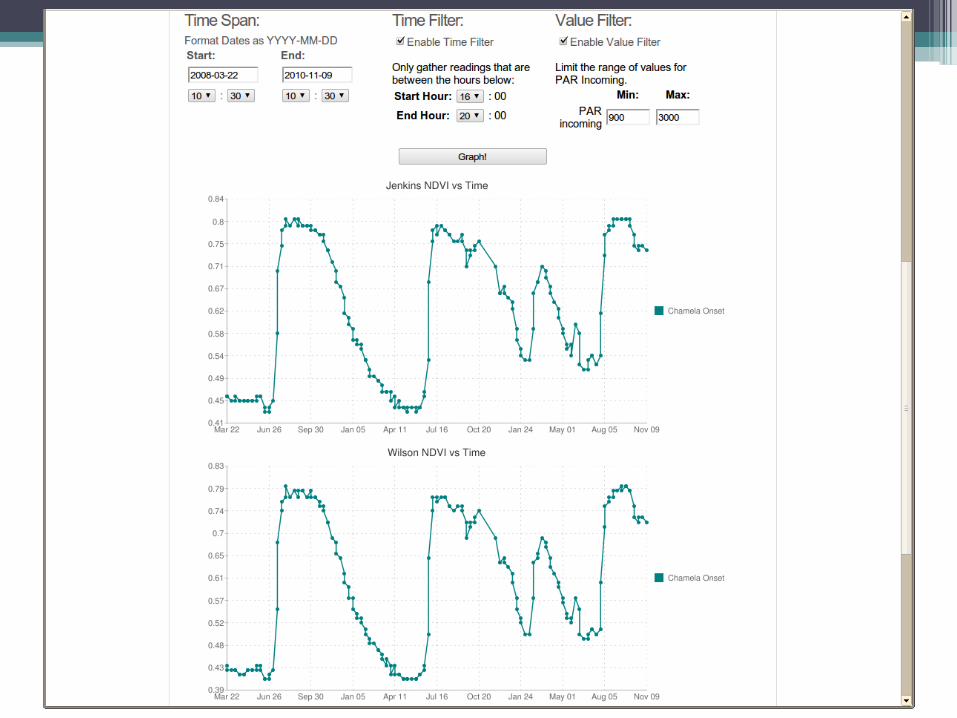
WSN fAPAR and Tower
NDVI have a strong linear
relationship
Chamela, Mexico
Primary TDF
Mata Seca, Brazil
(Intermediate stage TDF)
Conclusion
• WSN for environmental monitoring are providing
important information on cues controlling phenological
processes in tropical dry forests.
• Not all dry forests follow the common “soil moisture”
model, other sites indicate less dependence on this
variable.
• New data analysis and visualization tools are necessary
to handle MASSIVE amounts of information specially on
real time transmissions.