ARTIFICIAL INTELLIGENCE BASED ECG SIGNAL ...ethesis.nitrkl.ac.in/4705/1/211BM1205.pdfARTIFICIAL...
72
ARTIFICIAL INT CLASSIFICATION OF S A Thesis submitted in par Department N TELLIGENCE BASED ECG SIGN SENDETARY, SMOKERS AND A rtial fulfillment of the requirements for t Master of Technology in Biomedical Engineering By NIRAJ BAGH 211BM1205 Under the supervision of Dr. KUNAL PAL t of Biotechnology & Medical Engineering National Institute of Technology Rourkela-769008, Odisha 1 NAL ATHLETES the degree of
Transcript of ARTIFICIAL INTELLIGENCE BASED ECG SIGNAL ...ethesis.nitrkl.ac.in/4705/1/211BM1205.pdfARTIFICIAL...

ARTIFICIAL INTELLIGENCE BASED ECG SIGNAL
CLASSIFICATION OF SENDETARY, SMOKERS AND ATHLETES
A Thesis submitted in partial fulfillment of the requirements for the degree of
Department of Biotechnology & Medical Engineering
National Institute of Technology
ARTIFICIAL INTELLIGENCE BASED ECG SIGNAL
CLASSIFICATION OF SENDETARY, SMOKERS AND ATHLETES
A Thesis submitted in partial fulfillment of the requirements for the degree of
Master of Technology
in
Biomedical Engineering
By
NIRAJ BAGH
211BM1205
Under the supervision of
Dr. KUNAL PAL
Department of Biotechnology & Medical Engineering
National Institute of Technology
Rourkela-769008, Odisha
1
ARTIFICIAL INTELLIGENCE BASED ECG SIGNAL
CLASSIFICATION OF SENDETARY, SMOKERS AND ATHLETES
A Thesis submitted in partial fulfillment of the requirements for the degree of

NATIONAL IN
This is to certify that the thesis entitled “
Classification of Sedentary, Smokers
to the National Institute of Technology, Rourkela for the Degree of Master of Technology is a
record of bonafide research work, carried o
Medical Engineering under my supervision. I believe that the thesis fulfils part of the
requirements for the award of Master of Technology. The results embodied in the thesis have not
been submitted for the award of any other degree
Date- Place-Rourkela
NATIONAL INSTITUTE OF TECHNOLOGY,
ROURKELA
CERTIFICATE
This is to certify that the thesis entitled “Artificial Intelligence Based E
, Smokers and Athletes” by Niraj Bagh (211BM1205)
to the National Institute of Technology, Rourkela for the Degree of Master of Technology is a
record of bonafide research work, carried out by him in the Department of Biotechnology and
Medical Engineering under my supervision. I believe that the thesis fulfils part of the
requirements for the award of Master of Technology. The results embodied in the thesis have not
award of any other degree.
Department of Biotechnology and Medical Engineering
National Institute of Technology, Rourkela
2
STITUTE OF TECHNOLOGY,
Intelligence Based ECG Signal
Niraj Bagh (211BM1205), submitted
to the National Institute of Technology, Rourkela for the Degree of Master of Technology is a
ut by him in the Department of Biotechnology and
Medical Engineering under my supervision. I believe that the thesis fulfils part of the
requirements for the award of Master of Technology. The results embodied in the thesis have not
Dr. Kunal Pal Department of Biotechnology and Medical Engineering
National Institute of Technology, Rourkela

3
ACKNOWLEDGEMENTS
This work was carried out at the Department of Biotechnology and Medical Engineering,
National Institute of Technology, Rourkela, Orissa, under the supervision of Prof. Kunal Pal.
I would like to express my sincere gratitude to Prof. Kunal Pal for his guidance and support
throughout my work. Without him I will never be able to complete my work with this ease. He
was very patient to hear my problems that I am facing during the project work and finding the
solutions. I am very much thankful to him for giving his valuable time for me.
I am highly grateful towards Dr. D.N.Tibarewala, Director, School of Bioscience and
Engineering, Jadavpur University for his immense support right from providing the ECG
acquisition device to every little help required during manuscript preparation.
Next to mention is the worthwhile help, time and consideration of my subjects who helped me in
the ECG data registration, gave their details and without whom this study was beyond
imagination. I am highly grateful towards my seniors, Bishwajit champaty, Sai Satish
Sagiri, Vinay Singh and Beauty Behera for their immense help and support throughout the
project work. I am highly grateful towards my labmates uttam kumar, chandrakamal sinha
,sarada prashana mallick and Shankar khade who constantly helped me during the work.
Last but not the least, I am ever grateful to my inspiration, my Dad, for whom I am
here completing my M.Tech research work. I am highly grateful towards my mother and my
brother for their constant support in all my endeavours.
Date:
Place: NIRAJ BAGH

4
TABLE OF CONTENTS
CHAPTERS PAGE No.
1. INTRODUCTION 1
1.1 Introduction 2
1.2 objective 3
1.3 Thesis Organization 4
2. LITERATURE REVIEW 5
2.1. History and background of HRV 6
2.2. Relation between ANS and HRV 6
2.3. Effect Of Blood Pressure On HRV 6
2.4 Detection Of Myocardial Infarction From HRV 7
2.5. HRV In Diabetes 7
2.6. HRV And Respiration 7
2.7. Role Of Gender And age On HRV 7
2.8. HRV And Fatigue 8
2.9. HRV Changes Due To Smoking And Alcohol 8
2.10. Arrhythmia Classification Using SVM with
Selected Features
8
2.11. A Multistage Neural Networks Classifier For
ECG Events
8
2.12. Time frequency analysis of heart rate variability signal in
prognosis of type-2 diabetic autonomic neuropathy
8
2.13. ECG analysis using wavelet transform: application to myocardial
ischemia detection
9
2.14. The power spectral analysis of heart rate variability in athletes
during exercise
9
2.15. ECG beat classifier designed by combined neural network model 9
2.16. HRV analysis of arrhythmias using linear and non-linear 10

5
Parameters
2.17. Support vector machine based arrhythmia classification using
reduced features
10
2.18. Artificial neural network model based cardiac arrhythmia disease
diagnosis from ECG signal data
10
2.19. Sensitivity of heart rate variability as indicator of driver
Sleepiness
11
2.20. Delineation of ECG characteristic features using multi-resolution
wavelet analysis method
11
2.21. Classification of electrocardiogram signal using
supervised classifier and efficient features
11
2.22. The QRS detection using k-nearest neighbour algorithm
(KNN) and evaluation on standard ECG data base
12
2.23. Detection of ECG characteristic points using multi-resolution
wavelet analysis based selective coefficients methods
12
2.24. A support vector machine classifier algorithm based on a
perturbation method and its application to ECG beat
recognition system
12
2.25. Basiyan ANN classifier for ECG arrhythmia diagnostics system 13
2.26. Generating weighted fuzzy rules from training data for dealing
with the iris data classification problem
13
3. MATERIALS AND METHODS 14
3.1. Volunteers 15
3.2. Materials 16
3.2.1. ECG Data Acquisition and data processing 16
3.3. HRV features 17
3.4. Extraction of time domain/ wavelet domain ECG features 17
4. RESULT AND DISCUSSION 20
4.1. HRV Analysis 21
4.2. AI based classification using HRV features 24

6
4.2.1.CART Analysis 24
4.2.1. a. Result in artificial neural networks (ANN)
25
4.2.1. b. Result in Support Vector Machine (SVM) 27
4.3. Best combination of HRV parameters obtained from cart analysis 27
4.3.1. Result in artificial neural networks (ANN) 27
4.3.2. Result in Support Vector Machine (SVM) 29
4.4. AI based classification using HRV features 29
4.4.1. a. Result in artificial neural networks (ANN) 31
4.5. best combination of HRV parameters obtained from BT analysis 33
4.5.1. Result in artificial neural networks (ANN) 34
4.6. ECG Analysis 35
4.6.1. time domain analysis 35
4.7. AI based classification using time domain features 35
4.7.1. CART Analysis 35
4.7.1. a. Result in artificial neural networks (ANN) 36
4.7.1. b. Result In SVM 37
4.8. AI Based Classification Using Time Domain Features 38
4.8.1. a. Result in artificial neural networks (ANN) 38
4.8.1. b. Result in SVM 41
4.10. AI Based Classification Using Wavelet Features 45

7
4.10.1. CART analysis 45
4.10.1. a. Result in artificial neural networks (ANN) 46
4.10.3. b. Result in Support Vector Machine (SVM) 47
4.11. AI Based Classification Using wavelet Features 48
4.11.1. BT Analysis 48
4.11.1. a. Result in artificial neural networks (ANN) 49
4.11.1. b. Result in Support Vector Machine (SVM) 50
4.12. Discussion 51
4.12.1. Discussion 51
5. CONCLUSION 54
5. 1.Conclusion 55
6.REFERENCES 57
TABLE NO. TITLE PAGE
Table 1 Summary of Participating Volunteers 15
Table 2 HRV parameters 21
Table 3 Importance of HRV parameters in CART analysis 25
Table 4 Classification summary of RRSTD, HRSTD, RMSSD, SD1, LFPWR-
FFT (low frequency power), LFPWR-AR (low frequency power) and
LF/HF-AR for MLP 7-22-3
26
Table 5 Classification summary of RRSTD, HRSTD, RMSSD, SD1, LFPWR-
FFT (low frequency power), LFPWR-AR (low frequency power) and
LF/HF-AR for RBF 7-14-3
26

8
Table 6 Classification Summary for RRSTD, HRSTD, RMSSD, SD1, LFPWR-
FFT (low frequency power), LFPWR-AR (low frequency power) and
LF/HF-AR.) For RBF Kernel
27
Table 7 Classification summary of RMSSD, LFPWR-FFT, LFPWR-AR, and
LH/HF-AR for MLP 4-10-3
28
Table 8 Classification summary of RMSSD, LFPWR-FFT, LFPWR-AR, and
LH/HF-AR for RBF 4-17-3
28
Table 9 Classification summary of RMSSD, LFPWR-FFT, LFPWR-AR, LH/HF-
AR for SVM (RBF kernel)
29
Table 10 the importance of HRV parameters in BT analysis 30
Table 11 Classification summary of HRSTD, VLF-FFT (%), HF-FFT (%), LF-nu-
FFT, HFPK-AR, QRSMN, QRSSTD and QTMN for MLP 8-8-3
31
Table 12 Classification summary of HRSTD, VLF-FFT (%), HF-FFT (%), LF-nu-
FFT, HFPK-AR, QRSMN, QRSSTD and QTMN for RBF 8-15 -3
32
Table 13 classification summary of HRSTD, VLF-FFT (%), HF-FFT (%), LF-nu-
FFT, HFPK-AR, QRSMN, QRSSTD and QTMN for RBF Kernel
32
Table 14 Classification summary of VLF (%)-FFT, HF (%)-FFT, LF-nu-FFT for
MLP 3-10-3
33
Table 15 Classification summary of VLF (%)-FFT, HF (%)-FFT, LF-nu-FFT for
RBF 3-14-3
34
Table 16 Classification summary of VLF (%)-FFT, HF (%)-FFT, LF-nu-FFT for
SVM (RBF kernel)
34
Table 17 the importance of Time Domain parameters in BT analysis 36
Table 18 Classification summary of SKEWNESS for MLP 1-31-3 37
Table 19 Classification summary of SKEWNESS for RBF 1-22-3 37
Table 20 classification summary for SKEWNESS for RBF Kernel 38
Table 21 Importance of time domain parameters in BT analysis 39

9
Table 22 Classification summary of KURTOSIS for MLP 1-21-3 40
Table 23 Classification summary of KURTOSIS for RBF 1-23-3 41
Table 24 classification summary for KURTOSIS for RBF Kernel 41
Table 25
importance of wavelet parameters in CART analysis 45
Table 26 Classification summary of KURT, MEDIAN and MODE for MLP 3-8-3 46
Table 27 Classification summary of KURT, MEDIAN and MODE for RBF 3-13-3 47
Table 28 Classification summary of KURT, MEDIAN and MODE for RBF Kernel 47
Table 29 importance of wavelet parameters in BT analysis 48
Table 30 Classification summary of STD, VAR and RMS for MPL 3-4-3 49
Table 31 Classification summary of STD, VAR and RMS for RBF 3-13-3 50
Table 32 Classification summary for STD, VAR and RMS for RBF Kernel 50
FIGURE NO TITLE PAGE
Figure 1 Schematic diagram of the ECG signal acquisition system 16
Figure 2 Lab VIEW program for interfacing the ECG-USB4704 hardware 17
Figure 3 Detailed work plan for the AI based classification using HRV
features
18
Figure 4 Detailed work plan for the AI based classification using HRV
features
19
Figure 5 Important plot of HRV parameters in CART analysis 24
Figure 6 Important plots of HRV parameters in BT analysis 30
Figure 7 Importance of time domain parameters in CART analysis 35

10
Figure 8 Importance of time domain parameters in BT analysis 38
Figure 9 Detail 8 level wavelet decomposed ECG signal of sedentary class 42
Figure 10 Detail 8 level wavelet decomposed ECG signal of athlete class 43
Figure 11 Detail 8 level wavelet decomposed ECG signal of smoker class 44
Figure 12 Important plot of CART analysis of wavelet reconstructed ECG
signal
45
Figure 13 Important plot of BT analysis of wavelet reconstructed ECG signal 48
11
LIST OF ABBREVIATIONS
ECG Electrocardiogram
BPM Beats per minutes
HRV Heart rate variability
ANS Autonomic nervous system
FIFO First input first output
BT Boosted tree
CART Classification and regression tree
RRMN Mean of RR intervals
HRMN Mean of heart rate
QRSMN Mean of QRS complex
QRSTD Standard deviation of QRS complex
QTMN Mean of QT intervals
LF Low frequency
VLFP Very low frequency peak
VLFPWR Very low frequency power
HF High frequency
HFP High frequency peak
HFPWR High frequency power
AM Arithmetic mean
RMS Root mean square
STD Standard deviation
SUMN Summation
SKWN Skewness
VAR Variance
ANN Artificial neural network
MLP Multilayer perceptron
RBF Radial basis function
SVM Support vector machine

12
ABSTRACT
The current study deals with the design of a computer aided diagnosis procedure to classify 3
groups of people with different lifestyles, namely sedentary, smoker and athletes. The ECG
Classification based on statistical analysis of HRV and ECG features. The heart rate variability
(HRV) parameters and ECG statistical features were used for the pattern recognition in Artificial
Intelligence classifiers. The ECG was recorded for a particular time duration using the EKG
sensor. The HRV, time domain and wavelet parameters were calculated using NI BIOMEDICAL
STARTUP KIT 3.0 and LABVIEW 2010. The important HRV features, time domain and
wavelet features were calculated by the statistical non-linear classifiers (CART and BT).the
important parameters were fed as input to artificial intelligence classifiers like ANN and SVM.
The Artificial Intelligence classifiers like artificial neural network (ANN) and Support vector
Machine (SVM) were used to classify 60 numbers of ECG signal. It was observed from result
that the Multi layer perceptron (MLP) based ANN classifier gives an accuracy of 95%, which is
highest among other the classifiers.
The HRV study implies that the time domain parameters (RMSSD and PNN50), frequency
domain parameters (HF power and LF/HF peak), Poincare parameter (SD1) and geometric
parameters (RR triangular index and TINN) are higher in athlete class and lower in smoker class.
The Higher values of HRV parameters indicate increase in parasympathetic activity and decrease
in sympathetic activity of the ANS. This indicates that the athlete class has better heath and less
chance of cardiovascular diseases where smoker class has high chances of cardiovascular
diseases. These HRV parameters of sedentary class were higher than smoker class but lower than
athlete class. This indicates less chances of cardiovascular disease in sedentary class as compared
to smoker class.
Keywords: ANN,ECG,HRV,SVM

13
CHAPTER 1
INTRODUCTION

14
INTRODUCTION
1.1. INTRODUCTION
Electrocardiogram (ECG) is the biopotential generated from the depolarization and
repolarization of the heart muscles. The ECG can be recorded by using surface electrodes. It
helps in assessing the physiological parameters related to the heart function. The study of the
ECG signal provides information about the health of the heart. The initiation of the activity of
the heart muscles start with the electrical impulse generated by SA node. SA node is enervated
with autonomic nervous system (ANS). ANS is divided into two subsystems, viz.
parasympathetic and sympathetic nervous systems. Parasympathetic nervous system tries to
reduce the heart rate while the sympathetic system tries to increase the heart rate. The sinus
rhythmic activity of the heart is being regulated by the ANS. Due to this reason; there is a
continuous variation in the duration of the heart beats. The phenomenon of occurrence of beat-
to-beat variation is regarded as Heart Rate Variability (HRV). The study of the features obtained
from the HRV has been found to provide information about the functioning of the ANS. Due to
this reason; HRV studies have been extensively used to estimate the functioning capability and
the integrity of the ANS.
The mortality related to the cardiovascular diseases (CVDs) is one of the major causes for the
majority of the deaths across the globe [1]. It is expected that >30 % (17.3 million) of the world
global deaths are due to CVDs. The scenario is even worst in the low- and middle- income
countries where >80% of the population die due to CVDs. It has been projected that the deaths
due to CVDs will be >23.3 million by the year 2030 [2-3]. Many CVD related deaths may be
prevented by addressing and counselling the patients about various factors related to causes of
CVDs. Some of the common factors, but not restricted to, include tobacco use, unhealthy diet
and obesity, physical inactivity, high blood pressure, diabetes and raised lipids.
Decreased heart-rate variability during exercise has often been associated with an increased risk
of sudden death. A recent study claims the probable initial expression of underlying
cardiomyopathy in the electrocardiogram (ECG) of young, highly trained athletes. This might
not be simply the benign of the expression of the cardiac remodelling, which is associated with

15
the athletic conditioning [4]. Hence HRV analysis of athletes may diagnose the concealed
cardiomyopathy at an early stage, which might help avoid sudden cardiac death (SCD) in
athletes.
In hypertensive smokers, inhalation of smoke has shown an increase in the heart rate with a
simultaneous flattering of the T-waves [5].Consequently, the HRV analysis may allow
discriminating parameters in smokers.
This proposed work has been designed to develop a computer aided diagnosis procedure to
classify 3 groups of people with different lifestyles, namely sedentary, smoker and athletes,
based on statistical analysis of HRV and ECG features. In this work, ECG of 60 volunteers was
recorded. The HRV and ECG signal features were determined from the above-mentioned
categories (classes) and used for the classification of the categories for diagnosis.
1.2 OBJECTIVE
The objective of this research is to design and develop a pattern recognition system to classify
ECG signals of different classes of people (like sedentary, athletes and smokers) .The technique
includes:
i. Recording of ECG signals.
ii. Extraction of HRV features using BIOMEDICAL STARTUP KIT 3.0
iii. Extraction of wavelet and of Time domain features.
iv. Signal classifier using artificial neural networks (ANN) and support vector machine
(SVM).

16
1.3 THESIS ORGANIZATION
The thesis deals with the selection HRV based features, time domain and wavelet based features
which are used for classification of ECG signals. The organization of the thesis is as follows
Chapter 2 deals with literature review of work done so far on classification of ECG signals
include both HRV and wavelet based features.
Chapter 3 deals with extracting of ECG signal, calculation of RR intervals, calculation of HRV
parameters, time domain and wavelet parameters, calculation of important feature for ECG
signal classification.
Chapter 4 deals with the classification of ECG signal using signal classifier. The signal
classifier contains artificial neural network (ANN) and support vector machine (SVM). both the
classifier uses their special function to calculate accuracy of the ECG signal.
Chapter 5 deals with future scope of the research work
Chapter 6 deals with references related to classification of ECG signals.

17
2. LITERATURE REVIEW
2.1. BACKGROUND ON HRV STUDY
CHAPTER 2
LITERATURE REVIEW

18
2. LITERATURE REVIEW
2.1. BACKGROUND ON HRV STUDY
In year 1940, Sayers et al. Described the existence of physiological rhythm embedded in the beat
to beat heart rate signals .In year 1965, hon. et al. Observed fetal distress occurred due to
changes in heart rate intervals .in year 1970, Ewing et al. Calculated the short time RR
differences to detect autonomic neuropathy in diabetic patients .in year 1981, akselrod et al
calculated beat to beat cardiovascular activity using power spectral analysis of HR
fluctuations[6].
2.2. RELATION BETWEEN HRV AND ANS
HRV varies due to many factors like exercise, during sleep, change in posture, attitude, drinking
alcohol and smoking, hormonal changes and disease conditions. HRV helps to study the balance
between two sub-system of autonomic nervous system sympathetic nervous system and
parasympathetic nervous system. Sympathetic nervous system on the heart leads to increase the
heart rate by increasing the firing rate of the SAN. The parasympathetic nervous system
decreases the heart rate by decreasing the firing rate of the SAN. The three spectral components
of HRV were defined and were proposed to be the makers of sympathovagal balance[7] .the
three frequency ranges were very low frequency (VLF) ranging from 0.003 to 0.04 Hz, low
frequency (LF) ranging from 0.04 to 0.15 Hz and high frequency (HF) ranging from 0.15 to 0.4
Hz. The high frequency components are the maker of parasympathetic activity and low
frequency components reflects sympathetic and parasympathetic activity [8-10].
2.3. EFFECT OF BLOOD PRESSURE ON HRV
It has been observed that there is a decrease in blood pressure whenever there is a reduction in
breath rate in hypertensive[11] .the breathing exercises including pranayam and yoga have also
shows similar result [12].the relationship between heart rate variability and short-term blood
pressure have been studied in frequency domain[13].

19
2.4. DETECTION OF MYOCARDIAL INFARCTION FROM HRV
It has been observed that there is a deceased in heart rate variability in the patient who have
undergone myocardial infarction[14] .in the ANS system there is increased in sympathetic
activity and decreased parasympathetic activity in such patient[15].this decreased in vagal
activity leads to reduce heart rate variability (HRV) and increase chances of death.
2.5. HRV IN DIABETES
It has been observed that the most HRV parameters like, time domain and frequency domain are
lower in the case of diabetes patient[16].the enduring training in diabetes patient, either not
suffering from diabetic autonomic neuropathy or in its early stages, increase HRV parameters
due to better functioning of sympathetic and parasympathetic nervous system, but it has no effect
on patients suffering from it for a longer period of time[17] .it is observed that there has been a
reduced parasympathetic activity noted in diabetic patient before clinical symptoms of
neuropathy could be detected[18].
2.6. HRV AND RESPIRATION
It has been observed that the HRV increase with decrease in the respiration frequency .the timing
intervals of inspiration and expiration also affect HRV through it has a variable phase
relationship with the cardiac cycle[19-21].it has been also observed that the RSA(respiratory
sinus arrhythmia ) which is called high frequency heart rate variability improves the efficacy of
pulmonary gas exchange throughout the respiration cycle by matching the alveolar gas exchange
and gas exchange in capillaries[22-23].
2.7. ROLE OF GENDER AND AGE ON HRV
Hendrik et al found that the HRV decrease with age and it is higher in case of women as
compared to men [24]. Emese et al proved that alert newborn boys have a lower HRV as
compared to aged matched girls[25]. The HRV not only depends on physiological factors but
also on maturity of individuals.

20
2.8. HRV AND FATIGUE
Jouanin et al concluded that the effect of prolonged physical activities on resting heart rate
variability that the activity of parasympathetic nervous system increase with fatigue[26].
2.9. HRV CHANGES DUE TO SMOKING AND ALCOHOL
The consumption of alcohol and smoking damage the cardiovascular function and also affects
the autonomic nervous system. In both the cases there is a reduction in HRV with an increased
sympathetic activity or reduced vagal activity[27].this can be attribute to the long –term exposure
to environmental tobacco smoke or chronic alcohol dependency[28].
2.10. ARRHYTHMIA CLASSIFICATION USING SVM WITH SELECTED FEATURE S.
In the year 2011, kohli et al. designed support vector machine based method for arrhythmia
classification dataset with selected features[29]. The four SVM methods, one against one (OAO),
one against all (OAA), fuzzy decision function (FDF) and decision directed acyclic graph
(DDAG) to detect cardiac arrhythmia and ECG signal classification. The result shows that the
one against all (OAA) gives better accuracy as compared to other three methods. The accuracy of
OAA is found to be 83.71% withλ=4.
2.11. A MULTISTAGE NEURAL NETWORKS CLASSIFIER FOR ECG EVENTS
In year 2001, Hosseini et al. fed ECG data to multilayer perceptron (MLP) .this ECG data were
taken from MIT/BIH arrhythmia database[30]. The result shows that the average recognition rate
was found to be 0.883.
2.12. TIME FREQUENCY ANALYSIS OF HEART RATE VARIABILITY SIGNAL IN
PROGNOSIS OF TYPE-2 DIABETIC AUTONOMIC NEUROPATHY
In year 2011, Tale et al. recorded ECG data of 20 diabetes mellitus (DM) and 20 normal
volunteers[31]. The time domain- frequency domain parameters were calculated. The result
shows that the time domain parameters SDNN, NN50, PNN50, HRV triangular index are lower
in DM as compared to normal and p<0.005.

21
2.13. ECG ANALYSIS USING WAVELET TRANSFORM: APPLICATION T O
MYOCARDIAL ISCHEMIA DETECTION
In year 2003, Ranjith et al. proposed a method for detection of myocardial ischemia events from
electrocardiogram signal using the wavelet transform technique[32].According to value of
wavelet transform the characteristic points of ECG were signal found. These characteristic points
of ECG signal used to identify ischemia event present in ECG signal.
2.14. THE POWER SPECTRAL ANALYSIS OF HEART RATE VARIABILI TY IN
ATHLETES DURING EXERCISE
In the year 1995, shin et al. Concluded that the effect of autonomic nervous system (ANS) on
heart rate variability (HRV) during dynamic exercise[33]. The feature extraction of 3 athletes
and 7 nonetheless were calculated. The power spectrum of HRV was calculated using FFT and
burg’s maximum entropy methods. The activity of ANS were estimated by determining their
parameters such as low frequency power (LF),high frequency power (HF) and their
ratio(LF/HF).the result shows that during exercise the LF and HF in both the group were
gradually decreased ,which were progressively recover during post exercise. The recovery of HR
during post exercise was faster in athletes as compared to nonetheless, that means Vagals
activities in athletes play a major role not only in lower HR during pre exercise ,but in rapid
recovering of HR during post exercise.
2.15. ECG BEAT CLASSIFIER DESIGNED BY COMBINED NEURAL NETWORK
MODEL
In year 2005, Guler et al. decomposed the ECG signal in time-frequency domain using discrete
wavelet transform and calculated statistical features[34].The first levels of network were
implemented for ECG beat classification using statistical features as input. To improve accuracy
second level network were implemented using output of first level network as input. Four types
of ECG beats obtained with accuracy of 96.94% using combined neural network.

22
2.16. HRV ANALYSIS OF ARRHYTHMIAS USING LINEAR AND NON-L INEAR
PARAMETERS
In the year 2010,thalange et al. calculated linear time and frequency domain index using non-
linear Poincare plot analysis[35]. Initially R peak was detected from ECG signal and RR wave
interval is obtained which is further used for HRV analysis. Spectral analysis is done to estimate
the power contents in different frequency band. It is observed that the RR intervals with variance
of coefficient, power contents in low frequency and high frequency band are play important role
in classification. The position and orientation of RR intervals in Poincare plot play an important
role in the visual identification of arrhythmias.
2.17. SUPPORT VECTOR MACHINE BASED ARRHYTHMIA CLASSIFICA TION
USING REDUCED FEATURES
In the year 2005,song et al. proposed an algorithm for arrhythmia classification associated with
reduced feature dimensions by linear discriminate analysis (LDA) and a support vector machine
(SVM) based classifier[36]. Seventeen original input features were extracted from wavelet
transform and reduced to 4 features using linear discriminate analysis. The performance of SVM
with LDA showed higher than SVM with principle of component analysis (PCA).the SVM
classifier compared with multilayer perceptron (MLP) and fuzzy interference system (FIS)
classifier.
2.18. ARTIFICIAL NEURAL NETWORK MODEL BASED CARDIAC ARRHY THMIA
DISEASE DIAGNOSIS FROM ECG SIGNAL DATA
In the year 2011,Jadhav et al. proposed an artificial neural network (ANN) based cardiac
arrhythmia disease diagnosis system using standard 12 lead ECG signal recording data[37]. This
study mainly focused on classifying disease in normal and abnormal classes. The ANN model is
trained by back propagation algorithm with proper iteration, learning rate and momentum rate.
The classification performance is evaluated by mean square error (MSE), classification
specificity, sensitivity, accuracy, receiver operation characteristics (ROC). The ANN result with
classification accuracy and sensitivity were found to 86.67% and 93.75%.

23
2.19. SENSITIVITY OF HEART RATE VARIABILITY AS INDICATOR OF DRIVER
SLEEPINESS
In the year 2012, Mahachandra et al. investigated the sensitivity of sleepiness detection based on
driver’s heart rate variability (HRV)[38]. Sixteen professional male driver participated in
experiment using driver simulator. The RR intervals calculated during sixty minutes driving,
along with theta brain wave activity derived from EEG measurements. Theta activity was used to
determine the sleepiness event. The time-domain and frequency-domain and Poincare plot of
HRV were calculated. The result shows that the decrement in of root mean square of successive
differences (RMSSD) of RR interval was 28% and decrement in SD1 of Poincare plot was
27%.these two are most important parameters for sleepiness detection.
2.20. DELINEATION OF ECG CHARACTERISTIC FEATURES USING M ULTI-
RESOLUTION WAVELET ANALYSIS METHOD
In year 2012, Banerjee et al. de-noised the ECG signal by decomposing it using discrete
wavelet transform (DWT) and discarding the coefficient corresponding to the noise
components[39]. A multi-resolution analysis along with adaptive thresolding is used for the
detection of R-peak. Then Q, S-peak, QRS complex points were identified. Finally T-wave was
detected. The result shows the sensitivity and positive predictivity were found to 99.8%
and99.6% with MIT BIH arrhythmia data base.
2.21. CLASSIFICATION OF ELECTROCARDIOGRAM SIGNAL USING S UPERVISED
CLASSIFIER AND EFFICIENT FEATURES
In year (2010), Zadeh et al. investigated the design of an efficient system for recognition of the
premature ventricular contraction from the normal beats and other heart diseases[40]. This
system contains three main modules: de-noising module, feature extraction module and signal
classifier module. The stationary wavelet transform was used for de-noising the signal. In feature
extraction module the morphological based feature extraction and timing interval based feature
extraction was calculated. In signal classifier module neural network and support vector machine
was used. The result shows that the support vector machine is better than other classifier. The
accuracy in support vector machine was found to 97.14%.

24
2.22. THE QRS DETECTION USING K-NEAREST NEIGHBOR ALGORIT HM (KNN)
AND EVALUATION ON STANDARD ECG DATA BASE.
In year (2010), Saini et al. proposed an algorithm k-nearest neighbor (KNN) to detect QRS
complex[41]. The data were taken from MIT BIH arrhythmia data base. In this work a digital
band pass filter was used to reduce false detection caused by high power line interferences and
gradient method was used to detect QRS complex. The KNN based classifier depends on the
value of k and the type of distance matrix. In KNN classifier the detection rate, sensitivity and
Specificity were found to 99.89%, 99.86% and 99.86% with k=3.
2.23. DETECTION OF ECG CHARACTERISTIC POINTS USING MULTI -
RESOLUTION WAVELET ANALYSIS BASED SELECTIVE COEFFICI ENTS
METHODS
In year 2010, Pal et al. calculated multi-resolution wavelet transform based system for detection
of QRS complex, P and T wave[42]. The selective coefficient method is used to select proper
wavelet coefficient for signal reconstruction. The measured value is compared to the manual
value and accuracy was calculated. The results shows that true detection rate for R peak was
99%.the base accuracy of the heart rate, P wave, QRS complex and T wave were 97%,96%,95%
and 98%.
2.24. A SUPPORT VECTOR MACHINE CLASSIFIER ALGORITHM BASE D ON A
PERTURBATION METHOD AND ITS APPLICATION TO ECG BEAT
RECOGNITION SYSTEM.
In year 2006, Acir calculated ECG beat recognition using support vector machine (SVM)
classifier designed by perturbation method[43]. The features were calculated and dimension of
each feature set is reduced by using perturbation method. The four type of ECG beat obtained
from MIT BIH data based are recognized with accuracy of 96.5% in support vector machine.

25
2.25. BASIYAN ANN CLASSIFIER FOR ECG ARRHYTHMIA DIAGNOST ICS
SYSTEM
In year 2005, Gao et al. Designed an arrhythmia detection system with Bayesian classifier[44].
The Bayesian classifier was compared with other classifier specially, decision tree and logistic
regression. The correct resample was t-tested and evaluate the result. The result shows that the
Bayesian ANN classifier is one of the optimum models.
2.26. GENERATING WEIGHTED FUZZY RULES FROM TRAINING DATA FOR
DEALING WITH THE IRIS DATA CLASSIFICATION PROBLEM
In the year 2006, Chen et al. designed a new method to generated weighted fuzzy rules from
training data do deals with Iris data classification problems[45]. First training data was converted
to fuzzy rules and weight of input variables was calculated .the result shows that the accuracy
and average fuzzy rules were found to be 96.7% and 8.849.

26
CHAPTER 3
MATERIALS
&
METHODS

27
3. MATERIALS AND METHODS
3.1 VOLUNTEERS
The study was conducted on 60 volunteers aged between 20-26 years. The volunteers were
informed about the experimental details. The written consent of the volunteers was taken before
the commencement of the experiment (Annexure-I).The volunteers were divided into three
classes of sedentary, smoker and athletes. Each class contained 20 volunteers. The volunteers
who smoke regularly (15-20 cigarettes per day) were assigned as smoker. Volunteers habituated
with various athletic activities regularly (~4-5 hours of physical activities per day) were
attributed as athletes. The volunteers who were neither smokers nor athletes were regarded as
sedentary. The height and the weight of the volunteers were recorded. The volunteers were
suggested to sit comfortably in a wooden chair wearing shoes. Wearing of shoes eliminates
grounding effect. Any metallic and electronic gadgets (e.g. mobile phone, hand watch, rings and
bracelet) were removed during the test. The ECG of the volunteers was recorded in between
10.00 pm-11.00 pm before going to bed. The summary of the participating volunteers have been
tabulated in table 1.
Table 1: Summary of participating volunteers
Class Number Age (years)
Mean±SD
Weight (Kg)
Mean±SD
Height (m)
Mean±SD
BMI(kg/m 2)
Mean±SD
Sedentary 20 26.10±1.774 66.75±6.3815 1.633±0.135 19.91±1.99
Athlete 20 23.85±1.7554 62.80±15.7 1.6552±.0921 19.82±2.994
Smoker 20 24.70±1.89 63.75±16.93 1.6886±0.1209 19.86±3.2279
Total 60 24.86±2.004 64.433±13.47 1.6724±0.1162 19.87±2.74

28
3.2 MATERIALS
3.2.1. ECG DATA ACQUITISION AND DATA PROCESSING
Data acquisition
ECG sensor (EKG-BTA, Vernier Software & Technology, Beaverton, OR, USA) was used as a
biopotential amplifier. The sensor was interfaced with the laptop using a low-cost data
acquisition system (USB-4704, Advantech, Corporation). LabVIEW-2010 software was used for
interfacing the USB-4704 with the laptop. The schematic diagram of the ECG acquisition system
has been shown in figure 1. The customized ECG acquisition system was regarded as ECG-
DAQ. The program used for the acquisition of the ECG signal has been shown in figure 2. The
ECG-DAQ was used for recording the ECG signal of the volunteers. The recording was done for
5 min and the recorded signal was saved as LabVIEW measurement file (.lvm file).
Figure 1: Schematic diagram of the ECG signal acquisition system

29
Figure 2: Lab VIEW program for interfacing the ECG-USB4704 hardware
3.3. HRV features
The ECG signal files were converted into binary file (.tdms file extension) and subsequently
used to calculate the HRV features using NI Biomedical Start up Kit-2. The HRV features were
studied in-depth for the probable classification in Statistica software (version 9, Statsoft,
Hamburg, Germany). The schematic representation of the statistical classification has been
shown in figure 3.
3.4. Extraction of time domain/ wavelet domain ECG features
The statistical features of the extracted 5 sec ECG signals were calculated. Similarly, wavelet
features were also calculated using the extracted ECG signals. The ECG signals were
decomposed using multi-level wavelet decomposition. Db06 wavelet was used for the 8-level
signal decomposition. A combination of D7 and D8 components were used for the signal
reconstruction. The statistical features of the reconstructed signals were calculated. The time

30
domain and wavelet domain ECG features were used for classification. The schematic
representation of the classification technique has been shown in figure 4.
Figure 3: Detailed work plan for the AI based classification using HRV features
Identification of important features
(ANOVA, BT and CART classifications)
Artificial intelligence based signal classification
ANN SVM
Data Normalization
Time
domain
POINCARE Frequency
domain
Geometric
ECG signal acquisition
HRV features
Calculation of R-R intervals
dical start

31
Figure 4: Detailed work plan for the AI based classification using HRV features
ECG signal acquisition
Extraction of five second of ECG data
Multi-resolution wavelet analysis
Normalization of statistical parameters
Reconstruction of the signal using D7 and D8
wavelet coefficients
Calculation of statistical parameters
ANOVA, BT and CART classification for important HRV feature
extraction
AI based signal classification
ANN SVM ANN SVM
Calculation of statistical parameters
Normalization of statistical parameters
ANOVA, BT and CART classification for important HRV feature extraction
AI based signal classification

32
CHAPTER 4
RESULTS
& DISCUSSIONS

33
4.RESULT AND DISCUSSION
4.1. HRV ANALYSIS
Table 2: HRV parameters
Various
domain
HRV
parameters Sedentary Smoker Athlete
Time domain
parameters
RMSSD 39.23±27.41 36.14±21.82 49.87±28.46
PNN50 12.73±15.6 9.66±10.90 21.59±19.25
RRSTD 8.90±19.53 39.99±20.83 45.38±19.48
Geometric
measure
RR triangular
index 9.81±3.39 8.98±4 14.34±21.15
TINN 136.30±64.94 123.84±50.35 137.38±65.95
Poincare plot SD1 29.65±22.63 25.61±15.44 36.82±19.65
SD2 65.98±26.55 61.80±32.80 65.02±31.09
Frequency
domain
parameter
LFPOWER 829.97±892.90 1041.9±1420.8 1029.4±852.37
HF POWER 737.03±1030.4 485.21±550.7
871.2590±1064.7
LF /HF 2.12±1.53 2.01±1.57 2.49±1.68
AR spectrum HF peak 2.22±8.84 0.27±0.1052 0.26±0.11
The various HRV parameters have been tabulated in table 2. The time domain feature RMSSD is
the square root of mean square difference of successive RR intervals. The RMSSD was higher in
athlete class. This indicates the long–term variation in athlete class, so there is an increase in
parasympathetic activity and decrease in sympathetic activity which increases the HRV .In case
of smoker class RMSSD was lower. This indicates the short–term variation in athlete class, so
there is an increase in sympathetic and decrease in parasympathetic activity which decrease the
HRV. The RMSSD value of sedentary class lies between two classes hence the HRV of
sedentary is more than the smoker class but less than athlete class. The time domain feature
PNN50 is the proportion of NN50 divide by the total number of NNs. The PNN50 was higher in
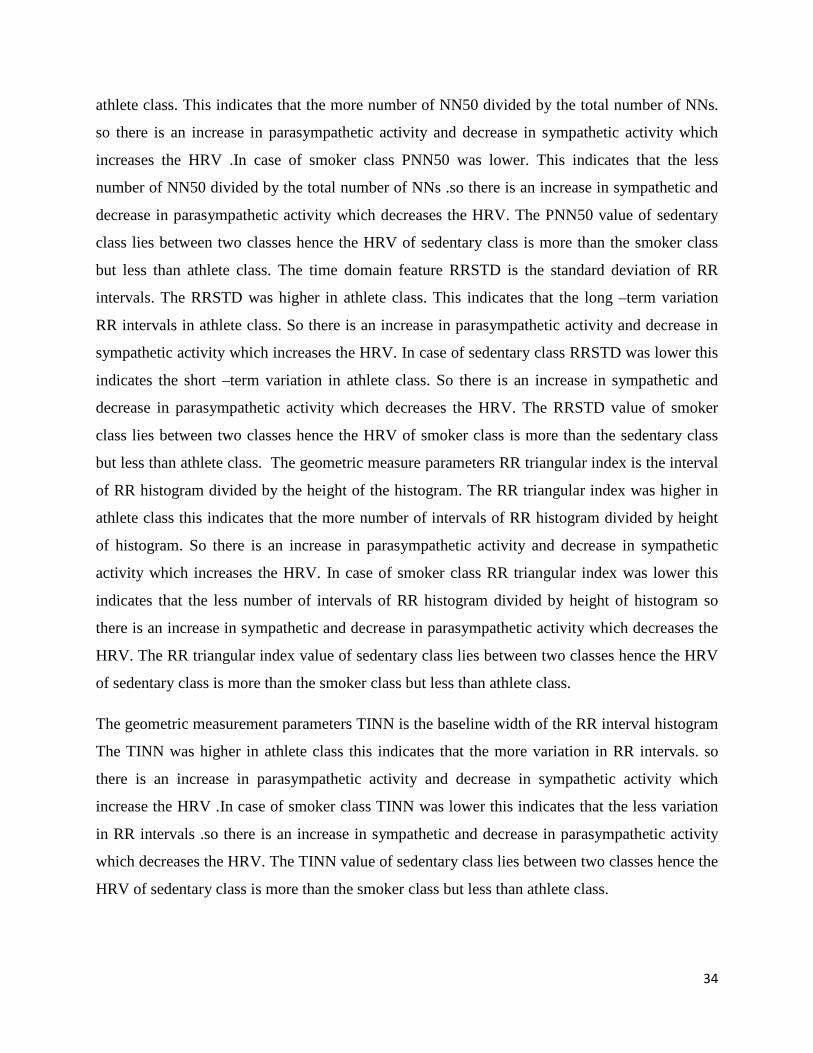
34
athlete class. This indicates that the more number of NN50 divided by the total number of NNs.
so there is an increase in parasympathetic activity and decrease in sympathetic activity which
increases the HRV .In case of smoker class PNN50 was lower. This indicates that the less
number of NN50 divided by the total number of NNs .so there is an increase in sympathetic and
decrease in parasympathetic activity which decreases the HRV. The PNN50 value of sedentary
class lies between two classes hence the HRV of sedentary class is more than the smoker class
but less than athlete class. The time domain feature RRSTD is the standard deviation of RR
intervals. The RRSTD was higher in athlete class. This indicates that the long –term variation
RR intervals in athlete class. So there is an increase in parasympathetic activity and decrease in
sympathetic activity which increases the HRV. In case of sedentary class RRSTD was lower this
indicates the short –term variation in athlete class. So there is an increase in sympathetic and
decrease in parasympathetic activity which decreases the HRV. The RRSTD value of smoker
class lies between two classes hence the HRV of smoker class is more than the sedentary class
but less than athlete class. The geometric measure parameters RR triangular index is the interval
of RR histogram divided by the height of the histogram. The RR triangular index was higher in
athlete class this indicates that the more number of intervals of RR histogram divided by height
of histogram. So there is an increase in parasympathetic activity and decrease in sympathetic
activity which increases the HRV. In case of smoker class RR triangular index was lower this
indicates that the less number of intervals of RR histogram divided by height of histogram so
there is an increase in sympathetic and decrease in parasympathetic activity which decreases the
HRV. The RR triangular index value of sedentary class lies between two classes hence the HRV
of sedentary class is more than the smoker class but less than athlete class.
The geometric measurement parameters TINN is the baseline width of the RR interval histogram
The TINN was higher in athlete class this indicates that the more variation in RR intervals. so
there is an increase in parasympathetic activity and decrease in sympathetic activity which
increase the HRV .In case of smoker class TINN was lower this indicates that the less variation
in RR intervals .so there is an increase in sympathetic and decrease in parasympathetic activity
which decreases the HRV. The TINN value of sedentary class lies between two classes hence the
HRV of sedentary class is more than the smoker class but less than athlete class.

35
Poincare plot parameter SD1 measures RR interval variability. The SD1 indicates short-term
heart rate variability. The SD1 was higher in athlete class this indicates that the more variation in
short-term heart rate variability. so there is an increase in parasympathetic activity and decrease
in sympathetic activity which increases the HRV .In case of smoker class SD1 was lower this
indicates that the less variation in short-term heart rate variability so there is an increase in
sympathetic and decrease in parasympathetic activity which decreases the HRV. The SD1 value
of sedentary class lies between two classes hence the HRV of sedentary is more than the smoker
class but less than athlete class.
Poincare plot parameter SD2 measures RR interval variability. The SD2 indicates long- term
heart rate variability. The SD2 was higher in sedentary class this indicates that the more
variation in short-term heart rate variability. so there is an increase in parasympathetic activity
and decrease in sympathetic activity which increases the HRV .In case of smoker class SD2 was
lower this indicates that the less variation in short-term heart rate variability .so there is an
increase in sympathetic and decrease in parasympathetic activity which decreases the HRV. The
SD2 value of athlete class lies between two classes hence the HRV of athlete is more than the
smoker class but less than sedentary class.
The HF power was higher in athlete class this indicates that the high power associates in higher
frequency. So there is an increase in parasympathetic activity and decrease in sympathetic
activity which increases the HRV .In case of smoker class HF power was lower this indicates
that the low power associates in higher frequency so there is an increase in sympathetic and
decrease in parasympathetic activity which decreases in HRV. The HF power of sedentary class
lies between two classes hence the HRV of sedentary class is more than the smoker class but less
than athlete class.
The LF power was higher in smoker class this indicates that the high power associates in low
frequency, so there is an increase in parasympathetic activity and decrease in sympathetic
activity as a result increase in HRV .In case of sedentary class LF power was lower this indicates
that the low power associates in low frequency, so there is an increase in sympathetic and
decrease in parasympathetic activity so decrease in HRV. The LF power of athlete class lies
between two classes hence the HRV of athlete class is more than the sedentary class but less than
smoker class.

36
The LF/HF was higher in athlete class so there is an increase in parasympathetic activity and
decrease in sympathetic activity which increases the HRV .In case of smoker class LF/HF was
lower so there is an increase in sympathetic and decrease in parasympathetic activity which
decreases the HRV. The LF/HF value of sedentary lies between two classes hence the HRV is
more than the smoker class but less than athlete class.
The HF peak was higher in sedentary class this indicates that the maximum peak occurs in high
frequency, so there is an increase in parasympathetic activity and decrease in sympathetic
activity which increases the HRV .In case of athlete class HF peak was lower minimum peak
occurs in high frequency, so there is an increase in sympathetic and decrease in parasympathetic
activity which decreases the HRV. The HF peak value of smoker class lies between two classes
hence the HRV is more than the athlete class but less than sedentary class.
4.2. AI BASED CLASSIFICATION USING HRV FEATURES
4.2.1. CART ANALYSIS
RRSTD HRSTD RMSSD SD1 LFPWR LFPWR LF/HF0
20
40
60
80
100
IMP
OR
TA
NC
E
HRV PARAMETERS
Figure 5: Important plot of HRV parameters in CART analysis

37
Table 3: Importance of HRV parameters in CART analysis
HRV
PARAMETERS
IMPORTANCE
RRSTD 100
HRSTD 93
RMSSD 94
SD1 94
LFPWR-FFT 91
LFPWR-AR 95
LF/HF-AR 91
Classification using CART helps to understand the important HRV variables during
classification of signals. The RRSTD was found to be the important HRV features, when
classified using CART analysis. The other important variables obtained from CART analysis
were HRSTD, RMSSD, SD1, LFPWR-FFT (low frequency power), LFPWR-AR (low frequency
power) and LF/HF-AR. These HRV features were used for probable pattern matching using
SVM (support vector machine) and ANN (artificial neural networks).
4.2.1a. . Result in artificial neural networks (ANN)
These seven important HRV features (RRSTD, HRSTD, RMSSD, SD1, LFPWR-FFT (low
frequency power), LFPWR-AR (low frequency power) and LF/HF-AR.) were used for pattern
matching using ANN. The performance of MLP (MLP 7-22-3) and RBF (7-14-3) classifier were
found 95% and 65%.the MLP network showed a training performance of 100% while the test
performance was found to be 75%.the network used Tanh as hidden activation function for
hidden layers. The output activation function was Softmax and network used Entropy as the error
function. The classification summary of MLP 7-22-3 has been shown in table 4.the RBF network
showed a training performance of 62.5% and a test performance of 75% using Gaussian as a
hidden activation function for hidden layer. The classification summary of RBF 7-14-3 has been
shown in table 5.

38
Table 4: Classification summary of RRSTD, HRSTD, RMSSD, SD1, LFPWR-FFT (low
frequency power), LFPWR-AR (low frequency power) and LF/HF-AR for MLP 7-22-3
Sedentary Athletes Smoker Total
Total 20 20 20 60
Correct 18 20 19 57
Incorrect 2 0 1 3
Correct
(%)
90.00 100.00 95.00 95
Incorrect
(%)
10.00 0.00 5.00 5
Table 5: Classification summary of RRSTD, HRSTD, RMSSD, SD1, LFPWR-FFT (low
frequency power), LFPWR-AR (low frequency power) and LF/HF-AR for RBF 7-14-3
Sedentary Athletes Smoker Total
Total 20 20 20 60
Correct 13 16 10 39
Incorrect 7 4 10 21
Correct
(%)
65.00 80.00 50.00 65
Incorrect
(%)
35.00 20.00 50.00 35

39
4.2.1. b. Result in Support Vector Machine (SVM)
These seven important HRV parameters (RRSTD, HRSTD, RMSSD, SD1, LFPWR-FFT (low
frequency power), LFPWR-AR (low frequency power) and LF/HF-AR.) were used as
independent parameters in the SVM, employing RBF kernel with capacity (c) =10000,
gamma=10000 and number of support vectors were 42, gives the overall accuracy 81.67%. The
training set was classified with an accuracy of 100% and test set was classified with an accuracy
of 26.67%.
Table 6: Classification Summary for RRSTD, HRSTD, RMSSD, SD1, LFPWR-FFT (low
frequency power), LFPWR-AR (low frequency power) and LF/HF-AR.) For RBF Kernel
with Capacity=10000, gamma=10000 And Number of Support Vectors=42
Sedentary Athletes Smoker Total
Total 20 20 20 60
Correct 20 14 15 49
Incorrect 0 6 5 11
Correct
(%)
100.00 70.00 75.00 81.67
Incorrect
(%)
0.00 30.00 25.00 18.33
4.3. BEST COMBINATION OF HRV PARAMETERS OBTAINED FROM C ART
ANALYSIS
4.3.1. Result in artificial neural networks (ANN)
The best combined HRV parameters (RMSSD, LFPWR-FFT, LFPWR-AR, and LH/HF-AR)
obtained from the CART analysis were used for pattern matching using ANN. The performance
of MLP 4-10-3 and RBF 4-17-3 classifier were found 91.67% and 58.33%. The MLP network
showed a training performance of 95.83% while the test performance was found to be 75%. The
network used Tanh as hidden activation function for hidden layers. The output activation
function was Softmax and the network used Entropy as the error function. The classification

40
summary of MLP 4-10-3 has been shown in table 7. The RBF network showed a training
performance of 83.33% and a test performance of 52.83 % using Gaussian as hidden activation
function for hidden layer. The classification summary of RBF 4-17-3 has been shown in table 8.
Table 7: Classification summary of RMSSD, LFPWR-FFT, LFPWR-AR, and LH/HF-AR
for MLP 4-10-3
Sedentary Athletes Smoker Total
Total 20 20 20 60
Correct 17 19 19 55
Incorrect 3 1 1 5
Correct
(%)
85.00 95.00 95.00 91.67
Incorrect
(%)
15.00 5.00 5.00 8.33
Table 8: Classification summary of RMSSD, LFPWR-FFT, LFPWR-AR, and LH/HF-AR
for RBF 4-17-3
Sedentary Athletes Smoker Total
Total 20 20 20 60
Correct 12 10 13 35
Incorrect 8 10 7 25
Correct
(%)
60.00 50.00 65.00 58.33
Incorrect
(%)
40.00 50.00 35.00 41.67

41
4.3.2. Result in Support Vector Machine (SVM)
The best combined HRV parameters (RMSSD, LFPWR-FFT, LFPWR-AR, LH/HF-AR)
obtained from the CART analysis were used as independent parameters in the SVM, employing
RBF kernel with capacity (c) =10, gamma=1000 and number of support vectors were 44, gives
the overall accuracy 80%. The training set was classified with an accuracy of 100% and test set
was classified with an accuracy of 20.00%.
Table 9: Classification summary of RMSSD, LFPWR-FFT, LFPWR-AR, LH/HF-AR for
SVM (RBF kernel) with capacity=10, gamma=1000 and number of support vectors=44
Sedentary Athletes Smoker Total
Total 20 20 20 60
Correct 20 14 14 48
Incorrect 0 6 6 12
Correct
(%)
100.00 70.00 70.00 80
Incorrect
(%)
0.00 30.00 30.00 20
4.4. AI BASED CLASSIFICATION USING HRV FEATURES
4.4.1. BT ANALYSIS
Classification using BT helps to understand the important HRV variables during classification of
signals. The HFPK-AR was found to be the important HRV feature, when classified using BT
analysis. The other important parameter obtained from BT analysis were HRSTD, VLF-FFT
(%), HF-FFT (%), LF-nu-FFT, QRSMN, QRSSTD and QTMN. These HRV features were used
for probable pattern matching using SVM and ANN.

42
HRSTD VLF(%) HF(%) LFnu HFPK QRSMNQRSSTD QTMN0
20
40
60
80
100
IMP
OR
TA
NC
E
HRV PARAMETERS
Figure 6: Important plots of HRV parameters in BT analysis
Table 10: the importance of HRV parameters in BT analysis
HRV PARAMETERS IMPORTANCE
HRSTD 91
VLF-FFT (%) 94
HF-FFT (%) 94
LF-nu-FFT 91
HFPK-AR 100
QRSMN 97
QRSDTD 97
QTMN 97

43
4.4.1. a. Result in artificial neural networks (ANN)
These eight important HRV parameters (HRSTD, VLF-FFT (%), HF-FFT (%), LF-nu-FFT,
HFPK-AR, QRSMN, QRSSTD and QTMN) were used for pattern matching using ANN. The
performance of MLP 8-8-3 and RBF 8-15-3 classifier were found 93.33% and 73.33%. The MLP
network showed a training performance of 95.83% while the test performance was found to be
83.33%. The network used Tanh as hidden activation function for hidden layers. The output
activation function was Softmax and network used Entropy as the error function. The
classification summary of MLP 8-8-3 has been shown in table 11. the RBF network showed a
training performance of 79.16% and a test performance of 75% using Gaussian as hidden
activation function for hidden layer. The classification summary of RBF 8-15-3 has been shown
in table 12.
Table 11: Classification summary of HRSTD, VLF-FFT (%), HF-FFT (%), LF-nu-FFT,
HFPK-AR, QRSMN, QRSSTD and QTMN for MLP 8-8-3
Sedentary Athletes Smoker Total
Total 20 20 20 60
Correct 18 19 19 56
Incorrect 2 1 1 4
Correct
(%)
90.00 95.00 95.00 93.33
Incorrect
(%)
10.00 5.00 5.00 6.67

44
Table 12: Classification summary of HRSTD, VLF-FFT (%), HF-FFT (%), LF-nu-FFT,
HFPK-AR, QRSMN, QRSSTD and QTMN for RBF 8-15 -3
Sedentary Athletes Smoker Total
Total 20 20 20 60
Correct 15 17 15 47
Incorrect 5 3 5 13
Correct
(%)
75.00 85.00 75.00 78.33
Incorrect
(%)
25.00 15.00 25.00 21.67
4.4.1. b. Result in Support Vector Machine (SVM)
These eight important HRV parameters (HRSTD,VLF-FFT(%),HF-FFT(%),LF-nu-FFT, HFPK-
AR,QRSMN,QRSSTD and QTMN) were used as independent parameters in the SVM,
employing RBF kernel with capacity (c) = 10, gamma = 100 and number of support vectors
were 45, gives the overall accuracy 80%.the training set was classified with an accuracy of
100% and test set was classified with an accuracy of 20.00%.
Table 13: classification summary of HRSTD, VLF-FFT (%), HF-FFT (%), LF-nu-FFT,
HFPK-AR, QRSMN, QRSSTD and QTMN for RBF Kernel with Capacity=10, gamma=100
And Number of Support Vectors=45.
Sedentary Athletes Smoker Total
Total 20 20 20 60
Correct 20 14 14 48
Incorrect 0 6 6 12
Correct
(%)
100.00 70.00 70.00 80
Incorrect
(%)
0.00 30.00 30.00 20

45
4.5. BEST COMBINATION OF HRV PARAMETERS OBTAINED FROM BT
ANALYSIS
4.5.1. Result in artificial neural networks (ANN)
The best combined HRV parameters (VLF (%)-FFT, HF (%)-FFT, LF-nu-FFT) obtained from
BT analysis were used for pattern matching using ANN. The performance of MLP 3-10-3 and
RBF 3-14-3 classifier were found 95% and 80%. The MLP network showed a training
performance of 95.83% while the test performance was found to be 91.67%. The network used
Tanh as hidden activation function for hidden layers. The output activation function was Softmax
and network used Entropy as the error function. The classification summary of MLP 3-10-3 has
been shown in table 14.the RBF network showed a training performance of 81.25% and a test
performance of 75% using Gaussian as hidden activation function for hidden layer. The
classification summary of RBF 3-14-3 has been shown in table 15.
Table 14: Classification summary of VLF (%)-FFT, HF (%)-FFT, LF-nu-FFT for MLP 3-
10-3
Sedentary Athletes Smoker Total
Total 20 20 20 60
Correct 20 19 18 57
Incorrect 0 1 2 3
Correct
(%)
100.00 95.00 90.00 95.00
Incorrect
(%)
0.00 5.00 10.00 5.00

46
Table 15: Classification summary of VLF (%)-FFT, HF (%)-FFT, LF-nu-FFT for RBF 3-
14-3
Sedentary Athletes Smoker Total
Total 20 20 20 60
Correct 19 15 14 48
Incorrect 1 5 6 12
Correct
(%)
95.00 75.00 70.00 80.00
Incorrect
(%)
5.00 25.00 30.00 20.00
4.5.2. Result in Support Vector Machine (SVM)
The best combined HRV parameters (VLF (%)-FFT, HF (%)-FFT, LF-nu-FFT) obtained from
BT analysis were used as independent parameters in the SVM, employing RBF kernel with
capacity(c) =100000, gamma=100 and number of support vectors were 45, gives the overall
accuracy 85%.the training set was classified with an accuracy of 100% and test set was classified
with an accuracy of 40.00%.
Table 16: Classification summary of VLF (%)-FFT, HF (%)-FFT, LF-nu-FFT for SVM
(RBF kernel) with capacity=100000, gamma=100 and number of support vectors=45
Sedentary Athletes Smoker Total
Total 20 20 20 60
Correct 19 16 16 51
Incorrect 1 4 4 9
Correct
(%)
95.00 80.00 80.00 85
Incorrect
(%)
5.00 20.00 20.00 15

47
4.6. ECG ANALYSIS
4.6.1. TIME DOMAIN ANALYSIS
Statistical parameters (e.g., AM, RMS, STD, VARIANCE, KURTOSIS, MEAN, MEDIAN,
MODE, SUMMATION AND SKEWNESS) for the ECG signals of volunteers were calculated
using LABVIEW 2010 software and were tabulated in the worksheet of STATISTICA 7
software. The parameters were classified and important parameters were predicted using CART
and BT analysis.
4.7. AI BASED CLASSIFICATION USING TIME DOMAIN FEATURES
4.7.1. CART ANALYSIS
CART algorithm suggested that the SKEWNESS was an important parameter in the
classification whose importance is 100%. This parameter was used for probable pattern matching
using SVM and ANN.
AM RMS STD VAR KURT MEDIAN MODE SUMTN SKWN0
20
40
60
80
100
IMP
OR
TA
NC
E
TIME DOMAIN PARAMETERS
Figure 7: Importance of time domain parameters in CART analysis

48
Table 17: the importance of Time Domain parameters in BT analysis
TIME DOMAIN
PARAMETERS
IMPORTANCE
AM 55
RMS 68
STD 68
VAR 68
KURT 75
MEDIAN 67
MODE 53
SUMTN 55
SKWN 100
4.7.1. a. Result in artificial neural networks (ANN)
The important parameter SKEWNESS was used for pattern matching using ANN. The
performance of MLP 1-31-3 and RBF 1-22-3 classifier were found 48.33 % and 66.67%.the
MLP network showed a training performance of 47.9 % while the test performance was found to
be 50%. The classification summary of MLP 1-31-3 has been shown in table 17. the RBF
network showed a training performance of 68.75% and a test performance of 58.33% using
Gaussian as hidden activation function for hidden layer. The classification summary of RBF 1-
22-3 has been shown in table 18.

49
Table 18: Classification summary of SKEWNESS for MLP 1-31-3
Sedentary Athletes Smoker Total
Total 20 20 20 60
Correct 0 14 15 29
Incorrect 20 6 5 31
Correct
(%)
0.00 70.00 75.00 48.33
Incorrect
(%)
100.00 30.00 25.00 51.67
Table 19: Classification summary of SKEWNESS for RBF 1-22-3
Sedentary Athletes Smoker Total
Total 20 20 20 60
Correct 16 11 13 40
Incorrect 4 9 7 20
Correct
(%)
80.00 55.00 65.00 66.67
Incorrect
(%)
20.00 45.00 35.00 33.33
4.7.1. b. RESULT IN SVM
The SKEWNESS, when used as independent parameter in support vector machine, employing
RBF kernel with capacity=10000, gamma=10000 and number of support vectors were 42 gives
overall accuracy of 86.67%. the training data was classified as 100% and test data was classifier
with 46.67%.

50
Table 20: classification summary for SKEWNESS for RBF Kernel with Capacity=10000,
gamma=10000 And Number of Support Vectors=42
Sedentary Athletes Smoker Total
Total 20 20 20 60
Correct 19 18 15 52
Incorrect 1 2 5 8
Correct
(%)
95.00 90.00 75.00 86.67
Incorrect
(%)
5.00 10.00 25.00 13.33
4.8. AI BASED CLASSIFICATION USING TIME DOMAIN FEATURES
4.8.1. BT ANALYSIS
AM RMS STD VAR KURT MEDIAN MODE SUMTN SKWN0
20
40
60
80
100
IMP
OR
TA
NC
E
TIME DOMAIN PARAMETERS
Figure 8: Importance of time domain parameters in BT analysis

51
BT algorithm suggested that the kurtosis was an important feature in the classification whose
importance is 100%. This feature was used for probable pattern matching using SVM and ANN.
Table 21: Importance of time domain parameters in BT analysis
TIME
DOMAIN
PARAMETERS
IMPORTANCE
AM 66
RMS 77
STD 77
VAR 77
KURT 100
MEDIAN 87
MODE 77
SUMTN 66
SKWN 82
4.8.1. a. Result in artificial neural networks (ANN)
The important parameter Kurtosis was used for pattern matching using ANN. The performance
of MLP 1-21-3 and RBF 1-23-3 classifier were found 53.33% and 58.33%.the MLP network
showed a training performance of 52.08% while the test performance was found to be
53.33%.the network used Exponential as hidden activation function for hidden layers. The
output activation function was Softmax and network used Entropy as the entropy function. The
classification summary of MLP 1-21-3 has been shown in table 21.the RBF network showed a
training performance of 58.33% and a test performance of 53.33% using Gaussian as hidden
activation function for hidden layer. The classification summary of RBF 1-23-3 has been shown
in table 22.

52
Table 22: Classification summary of KURTOSIS for MLP 1-21-3
Sedentary Athletes Smoker Total
Total 20 20 20 60
Correct 9 16 7 32
Incorrect 11 4 13 28
Correct
(%)
45.00 80.00 35.00 53.33
Incorrect
(%)
55.00 20.00 65.00 46.67
Table 23: Classification summary of KURTOSIS for RBF 1-23-3
Sedentary Athletes Smoker Total
Total 20 20 20 60
Correct 9 14 12 35
Incorrect 11 6 8 25
Correct
(%)
45.00 70.00 60.00 58.33
Incorrect
(%)
55.00 30.00 40.00 41.67
4.8.1. b. Result in SVM
The Kurtosis, when used as independent parameter in support vector machine, employing RBF
kernel with capacity=10000, gamma=100000 and number of support vectors were 43 gives
overall accuracy of 85%.the training data was classified as 97.77% and test data was classifier
with 46.67%

53
Table 24: classification summary for KURTOSIS for RBF Kernel with Capacity=10000,
gamma=100000 And Number of Support Vectors=43
Sedentary Athletes Smoker Total
Total 20 20 20 60
Correct 19 20 12 51
Incorrect 1 0 8 9
Correct
(%)
95.00 100.00 60.00 85
Incorrect
(%)
5.00 0.00 40.00 15
4.9. WAVELET RESSULT
The raw ECG signals of 60 volunteers were decomposed using Daubechies orthogonal wavelet
db06 at d1 to d8 level. The signal was reconstructed using a combination of d7 and d8
coefficients. The wavelet parameters like Arithmetic Mean (AM), Root mean square (RMS) ,
variance (VAR), Standard deviation (STD), kurtosis (KURT), median (MEDIAN), mode
(MODE), summation (SUMN) and skewness (SKWN) were calculated. The detail wavelet
decomposition of ECG signal of all classes is shown in figure 15, 16 and 17.

54
30 32 34 36
TIME(SEC)
d1
d2
d3
d4
d5
AM
PLI
TU
DE
(VO
LT)
d6
d7
d8
d7+d8
ECG
Figure 9: Detail 8 level wavelet decomposed ECG signal of sedentary class

55
30 32 34 36
TIME(SEC)
d1
d2
d3
d4
d5
AM
PLI
TU
DE
(VO
LT)
d6
d7
d8
d7+d8
ECG
Figure 10: Detail 8 level wavelet decomposed ECG signal of athlete class

56
30 32 34 36
TIME(SEC)
d1
d2
d3
d4
AM
PLI
TU
DE
(VO
LT)
d5
d6
d7
d8
d7+d8
ecg
Figure 11: Detail 8 level wavelet decomposed ECG signal of smoker class

57
4.10. AI BASED CLASSIFICATION USING WAVELET FEATURES
4.10.1. CART ANALYSIS
AM RMS STD VAR KURTMEDIANMODE SUMN SKWN0
20
40
60
80
100IM
PO
RT
AN
CE
WAVELET PARAMETERS
Figure 12: Important plot of CART analysis of wavelet reconstructed ECG signal
Table 25: importance of wavelet parameters in CART analysis
WAVELET
PARAMETERS
IMPORTANCE
AM 50
RMS 76
STD 76
VAR 76
KURT 100
MEDIAN 95
MODE 91
SUMTN 50
SKWN 88

58
Classification using CART helps to understand the important wavelet parameters during
classification of signals. The kurtosis (KURT) was found to be the important wavelet parameter
when classified using CART analysis. The other important parameter s obtained from the CART
analysis was MEDIAN and MODE. These wavelet parameters were used for probable pattern
matching using ANN and SVM.
4.10.1. a. Result in artificial neural networks (ANN)
These three important wavelet parameters (KURT, MEDIAN and MODE) were used for pattern
matching using ANN. The performance MLP 3-8-3 and RBF 3-13-3 classifier were found
83.33% and 78.33%. The MLP network showed a training performance of 83.33% while the test
performance was found to be 83.33%. The network used Tanh as hidden activation function for
hidden layers. The output activation function was Softmax and the network used entropy as the
Entropy function. The classification summary of MLP 3-8-3 has been shown in table 25.the RBF
network showed a training performance of 77.08% and a test performance of 83.33% using
Gaussian as hidden activation function for hidden layer. The classification summary of RBF 3-
13-3 has been shown in table 26.
Table 26: Classification summary of KURT, MEDIAN and MODE for MLP 3-8-3
Sedentary Athletes Smoker Total
Total 20 20 20 60
Correct 15 19 16 50
Incorrect 5 1 4 10
Correct
(%)
75.00 95.00 80.00 83.33
Incorrect
(%)
25.00 5.00 15.00 16.67

59
Table 27: Classification summary of KURT, MEDIAN and MODE for RBF 3-13-3
Sedentary Athletes Smoker Total
Total 20 20 20 60
Correct 15 18 14 47
Incorrect 5 2 6 13
Correct
(%)
75.00 90.00 70.00 78.33
Incorrect
(%)
25.00 10.00 30.00 21.67
4.10.3. b. Result in Support Vector Machine (SVM)
These three important parameters (KURT, MEDIAN and MODE) were used as independent
parameters in the SVM, employing RBF kernel with capacity (c) =10000, gamma=1000 and
number of support vectors =44, gives the overall accuracy 86.67%. The training set was
classified with an accuracy of 100% and test set was classified with an accuracy of 46.67%.
Table 28: Classification summary of KURT, MEDIAN and MODE for RBF Kernel with
Capacity=10000, gamma=1000 and Number of Support Vectors=44
Sedentary Athletes Smoker Total
Total 20 20 20 60
Correct 20 17 15 52
Incorrect 0 3 5 8
Correct
(%)
100.00 85.00 75.00 86.67
Incorrect
(%)
0.00 15.00 25.00 13.33

60
4.11. AI BASED CLASSIFICATION USINGWAVELET FEATURES
4.11.1. BT ANALYSIS
AM RMS STD VAR KURTMEDIANMODE SUMN SKWN0
20
40
60
80
100
IMP
OR
TA
NC
E
WAVELET PARAMETERS
Figure 13: Important plot of BT analysis of wavelet reconstructed ECG signal
Table 29: importance of wavelet parameters in BT analysis
WAVELET
PARAMETERS
IMPORTANCE
AM 75
RMS 98
STD 100
VAR 100
KURT 75
MEDIAN 82
MODE 70
SUMTN 75
SKWN 83

61
Classification using BT helps to understand the important wavelet parameters during
classification of signals. The STD and VAR were found to be the important wavelet parameters,
when classified using BT analysis. The other important parameter obtained from BT analysis
was RMS. These wavelet parameters were used for probable pattern matching using ANN and
SVM.
4.11.1. a. Result in artificial neural networks (ANN)
These three important wavelet parameters (STD, VAR and RMS) were used for pattern matching
using ANN. The performance of MLP 3-4-3 and RBF 3-13-3 classifier were found 56.67% and
48.33%. The MLP network showed a training performance of 53.33% while the test performance
was found to be 50%. The network used Tanh as hidden activation function for hidden layers.
The output activation function was Softmax and the network used Entropy as the entropy
function. The classification summary of MLP 3-4-3 has been shown in table 29.the RBF network
showed a training performance of 45% and a test performance of 75% using Gaussian as hidden
activation function for hidden layer. The classification summary of RBF 3-13-3 has been shown
in table 30.
Table 30: Classification summary of STD, VAR and RMS for MPL 3-4-3
Sedentary Athletes Smoker Total
Total 20 20 20 60
Correct 14 11 9 34
Incorrect 6 9 11 26
Correct
(%)
70.00 55.00 45.00 56.67
Incorrect
(%)
30.00 45.00 55.00 43.33

62
Table 31: Classification summary of STD, VAR and RMS for RBF 3-13-3
Sedentary Athletes Smoker Total
Total 20 20 20 60
Correct 15 5 11 31
Incorrect 5 15 9 29
Correct
(%)
75.00 25.00 55.00 48.33
Incorrect
(%)
25.00 75.00 45.00 16.67
4.11.1. b. Result in Support Vector Machine (SVM)
These three important wavelet parameters (STD, VAR and RMS) were used as independent
parameters in the SVM, employing RBF kernel with capacity (c) =10, gamma=1000 and number
of support vectors is 42, gives the overall accuracy 86.67%. The training set was classified with
an accuracy of 100% and test set was classified with an accuracy of 46.67%
.
Table 32: Classification summary for STD, VAR and RMS for RBF Kernel with
Capacity=10, gamma=1000 and Number of Support Vectors=42
Sedentary Athletes Smoker Total
Total 20 20 20 60
Correct 19 19 14 52
Incorrect 1 1 6 8
Correct
(%)
95.00 95.00 70.00 86.67
Incorrect
(%)
5.00 5.00 30.00 13.33

63
4.12. Discussions
4.12.1. Discussions
The important HRV, time domain and wavelet parameters were calculated. The important HRV
parameters obtained from CART were RRSTD, HRSTD, RMSSD, SD1, LFPWR-FFT (low
frequency power), LFPWR-AR (low frequency power) and LF/HF-AR. These important
parameters when fed into ANN (MLP 7-22-3), ANN (RBF 7-14-3) and SVM (RBF kernel) the
overall accuracy were founded to be 95%, 65% and 81.67% respectively. The best combined
parameters obtained from CART analysis of HRV features were RMSSD, LFPWR-FFT,
LFPWR-AR, and LH/HF-AR .these important parameters when fed into ANN (4-10-3) , ANN
(RBF 4-17-3) and SVM (RBF kernel) the overall accuracy were founded to be 91.67%,58.33%
and 80% respectively.
The important HRV parameters obtained from BT were HRSTD, VLF-FFT (%), HF-FFT (%),
LF-nu-FFT, HFPK-AR, QRSMN, QRSSTD and QTMN. These important parameters when fed
into ANN (MLP 8-8-3), ANN (RBF 8-15-3) and SVM (RBF kernel) the overall accuracy were
founded to be 93.33%, 78.33% and 80% respectively. The best combined HRV parameters
obtained from BT analysis were VLF (%)-FFT, HF (%)-FFT, LF-nu-FFT. these important
parameters when fed into ANN ( MLP 3-10-3) , ANN(RBF 3-14-3) and SVM (RBF kernel) the
overall accuracy were founded to be 95%,80% and 85% respectively. The wavelet based ECG
feature extraction was done using db06 wavelet. In the current study, a combination of d7 and d8
coefficients were used to reconstruct the ECG signals. The use of multi-resolution wavelet
analysis enables the signal representation in both large scale (low frequency) and small scale
(high frequency) components which help in the study of the dynamic range of the signals. The
important wavelet parameters obtained from CART were KURT, MEDIAN and MODE. These
important parameters when fed into ANN (MLP 3-8-3), ANN (RBF 3-13-3) and SVM (RBF
kernel) the overall accuracy were founded to be 83.33%, 78.33% and 86.67%. The important
wavelet parameters obtained from BT were STD, VAR and RMS. These important parameters
when fed into ANN (MLP 3-4-3), (RBF 3-13-3) and SVM (RBF kernel) the overall accuracy
were founded to be 56.67%, 48.33% and 86.67% respectively.

64
The important ECG time domain parameters obtained from CART was SKEWNESS. These
important parameters when fed into ANN (MLP 1-31-3), ANN (RBF 1-22-3) and SVM (RBF
kernel) the overall accuracy were founded to be 48.337%, 66.67% and 86.67% respectively.
The important ECG time domain parameters obtained from BT was Kurtosis. These important
features when fed into ANN (MLP 1-21-3), ANN (RBF 1-23-3) and SVM (RBF kernel) the
overall accuracy 53.33% ,58.337% and 85% respectively.

65
CHAPTER 5
CONCLUSION

66
5.1. CONCLUSION
The HRV study implied that the time domain parameters (RMSSD and PNN50), frequency
domain parameters (HF power and LF/HF peak), Poincare parameter (SD1) and geometric
parameters (RR triangular index and TINN) are higher in athlete class and lower in smoker class.
These HRV parameters of sedentary class were higher than smoker class but lower than athlete
class. The Higher values of HRV parameters indicate increase parasympathetic activity and
decrease sympathetic activity of the ANS. This indicates that the athlete class has better heath
and fewer chances of cardiovascular diseases as compared to the other two classes. These HRV
parameters of sedentary class were less than athlete class but more than smoker class. so less
chances of cardiovascular disease in sedentary class as compared to smoker class. The important
HRV, wavelet and time domain parameters obtained from BT, CART were fed to the artificial
neural network (ANN) and support vector machine (SVM) for signal classification. The best
HRV parameters obtained from the CART analysis were RMSSD, LFPWR-FFT, LFPWR-AR,
and LH/HF-AR. These important parameters when fed into ANN (4-10-3), ANN (RBF 4-17-3)
and SVM (RBF kernel) the overall accuracy were founded to be 91.67%, 58.33% and 80%
respectively
The best combined HRV parameters obtained from BT analysis were VLF (%) -FFT, HF (%) -
FFT, LF-nu-FFT. These important parameters when fed into ANN (MLP 3-10-3), ANN (RBF 3-
14-3) and SVM (RBF kernel) the overall accuracy were founded to be 95%, 80% and 85%
respectively. In both the CART and BT cases ANN (MLP) classifier gives better accuracy than
ANN (RBF) and SVM (RBF). So result shows that the ANN (MLP) is a better signal classifier
than MLP (RBF) and SVM (RBF). The result also shows that the accuracy of ANN (MLP) in BT
analysis gives better accuracy than ANN (MLP) in CART analysis. So BT is a better statistical
classifier than CART because BT uses more number of trees than CART so that the result is
optimized.

67
REFERENCES
1. De Backer, G., et al., European guidelines on cardiovascular disease prevention in clinical practice: third joint task force of European and other societies on cardiovascular disease prevention in clinical practice (constituted by representatives of eight societies and by invited experts). European Journal of Cardiovascular Prevention & Rehabilitation, 2003. 10(1 suppl): p. S1-S78.
2. Lopez, A.D. and C. Murray, The global burden of disease. Nat Med, 1998. 4(11): p. 1241-3.
3. Curioni, C., et al., The decline in mortality from circulatory diseases in Brazil. Revista panamericana de salud pública, 2009. 25(1): p. 9-15.
4. Kasapis, C. and P.D. Thompson, Sports cardiology. The Encyclopaedia of Sports Medicine An IOC Medical Commission Publication, The Olympic Textbook of Medicine in Sport, 2009. 14: p. 232.
5. Schillaci, G., et al., Influence of cigarette smoking on the electrocardiographic diagnosis of left ventricular hypertrophy in arterial hypertension. Giornale italiano di cardiologia, 1999. 29(1): p. 34.
6. Myers, G.A., et al., Power Spectral Analysis of Heart Rate Varability in Sudden Cardiac Death: Comparison to Other Methods. Biomedical Engineering, IEEE Transactions on, 1986(12): p. 1149-1156.
7. Akselrod, S., et al., Power spectrum analysis of heart rate fluctuation: a quantitative probe of beat-to-beat cardiovascular control. science, 1981. 213(4504): p. 220-222.
8. Pagani, M., et al., Power spectral analysis of heart rate and arterial pressure variabilities as a marker of sympatho-vagal interaction in man and conscious dog. Circulation research, 1986. 59(2): p. 178-193.
9. Malliani, A., et al., Cardiovascular neural regulation explored in the frequency domain. Circulation, 1991. 84(2): p. 482-492.
10. Hedman, A., et al., Effect of sympathetic modualtion and sympathovagal interaction on heart rate variability in anaesthetized dogs. Acta physiologica scandinavica, 1995. 155(2): p. 205-214.
11. Grossman, E., et al., Breathing-control lowers blood pressure. Journal of human hypertension, 2001. 15(4): p. 263-269.
12. Spicuzza, L., et al., Yoga and chemoreflex response to hypoxia and hypercapnia. The Lancet, 2000. 356(9240): p. 1495-1496.
13. De Boer, R., J. Karemaker, and J. Strackee, Relationships between short-term blood-pressure fluctuations and heart-rate variability in resting subjects I: a spectral analysis approach. Medical and Biological Engineering and Computing, 1985. 23(4): p. 352-358.
14. Carney, R.M., et al., Depression, heart rate variability, and acute myocardial infarction. Circulation, 2001. 104(17): p. 2024-2028.
15. Rothschild, M., A. Rothschild, and M. Pfeifer, Temporary decrease in cardiac parasympathetic tone after acute myocardial infarction. The American journal of cardiology, 1988. 62(9): p. 637-639.
16. Kudat, H., et al., Heart rate variability in diabetes patients. Journal of international medical research, 2006. 34(3): p. 291-296.

68
17. Howorka, K., et al., Effects of physical training on heart rate variability in diabetic patients with various degrees of cardiovascular autonomic neuropathy. Cardiovascular research, 1997. 34(1): p. 206-214.
18. Pfeifer, M.A., et al., Quantitative evaluation of cardiac parasympathetic activity in normal and diabetic man. Diabetes, 1982. 31(4): p. 339-345.
19. Jennings, R.J. and M.W. van der Molen, Cardiac timing and the central regulation of action. Psychological research, 2002. 66(4): p. 337-349.
20. Jennings, J.R., J.D. McKnight, and M. MOLEN, Phase‐sensitive interaction of cardiac and respiratory timing in humans. Psychophysiology, 1996. 33(5): p. 514-521.
21. Strauss‐Blasche, G., et al., Relative timing of inspiration and expiration affects respiratory sinus arrhythmia. Clinical and Experimental Pharmacology and Physiology, 2000. 27(8): p. 601-606.
22. Grossman, P., F. Wilhelm, and M. Spoerle, Respiratory sinus arrhythmia, cardiac vagal control, and daily activity. American Journal of Physiology-Heart and Circulatory Physiology, 2004. 287(2): p. H728-H734.
23. Hayano, J. and F. Yasuma, Hypothesis: respiratory sinus arrhythmia is an intrinsic resting function of cardiopulmonary system. Cardiovascular research, 2003. 58(1): p. 1-9.
24. Bonnemeier, H., et al., Circadian profile of cardiac autonomic nervous modulation in healthy subjects. Journal of cardiovascular electrophysiology, 2003. 14(8): p. 791-799.
25. Nagy, E., et al., Gender-related heart rate differences in human neonates. Pediatric research, 2000. 47(6): p. 778-780.
26. Jouanin, J.-C., et al., Analysis of heart rate variability after a ranger training course. Military medicine, 2004. 169(8): p. 583-587.
27. Minami, J., T. Ishimitsu, and H. Matsuoka, Effects of smoking cessation on blood pressure and heart rate variability in habitual smokers. Hypertension, 1999. 33(1): p. 586-590.
28. Barutcu, I., et al., Cigarette smoking and heart rate variability: dynamic influence of parasympathetic and sympathetic maneuvers. Annals of noninvasive electrocardiology, 2005. 10(3): p. 324-329.
29. Kohli, N. and N.K. Verma, Arrhythmia classification using SVM with selected features. International Journal of Engineering, Science and Technology, 2011. 3(8): p. 122-131.
30. Gholam Hosseini, H., K. Reynolds, and D. Powers. A multi-stage neural network classifier for ECG events. in Engineering in Medicine and Biology Society, 2001. Proceedings of the 23rd Annual International Conference of the IEEE. 2001: IEEE.
31. Tale, S. and T. Sontakke. Time-Frequency Analysis of Heart Rate Variability Signal in prognosis of Type 2 Diabetic Autonomic Neuropathy. in Proceedings of International Conference on Biomedical Engineering and Technology (ICBET 2011). 2011.
32. Ranjith, P., P. Baby, and P. Joseph, ECG analysis using wavelet transform: application to myocardial ischemia detection. ITBM-RBM, 2003. 24(1): p. 44-47.
33. Shin, K., et al. The power spectral analysis of heart rate variability in athletes during exercise. in Computers in Cardiology 1993, Proceedings. 1993: IEEE.
34. Güler, İ., ECG beat classifier designed by combined neural network model. Pattern recognition, 2005. 38(2): p. 199-208.
35. Thalange, A.V. and R.R. Mergu, HRV analysis of arrhythmias using linear–nonlinear parameters. International Journal of Computer Applications, 2010. 1(12).

69
36. Yoo, S.K., Support vector machine based arrhythmia classification using reduced features. International Journal of Control Automation and System, 2005. 3(4): p. 571-579.
37. Jadhav, S., S. Nalbalwar, and A. Ghatol. Artificial neural network based cardiac arrhythmia classification using ECG signal data. in Electronics and Information Engineering (ICEIE), 2010 International Conference On. 2010: IEEE.
38. Mahachandra, M., I.Z. Sutalaksana, and K. Suryadi. Sensitivity of heart rate variability as indicator of driver sleepiness. in Network of Ergonomics Societies Conference (SEANES), 2012 Southeast Asian. 2012: IEEE.
39. Banerjee, S., R. Gupta, and M. Mitra, Delineation of ECG characteristic features using multiresolution wavelet analysis method. Measurement, 2012. 45(3): p. 474-487.
40. Zadeh, A.E., A. Khazaee, and V. Ranaee, Classification of the electrocardiogram signals using supervised classifiers and efficient features. Computer methods and programs in biomedicine, 2010. 99(2): p. 179-194.
41. Saini, I., D. Singh, and A. Khosla, QRS detection using< i> K</i>-Nearest Neighbor algorithm (KNN) and evaluation on standard ECG databases. Journal of Advanced Research, 2012.
42. Pal, S. and M. Mitra, Detection of ECG characteristic points using multiresolution wavelet analysis based selective coefficient method. Measurement, 2010. 43(2): p. 255-261.
43. Acır, N., A support vector machine classifier algorithm based on a perturbation method and its application to ECG beat recognition systems. Expert Systems with Applications, 2006. 31(1): p. 150-158.
44. Gao, D., et al. Bayesian ANN classifier for ECG arrhythmia diagnostic system: A comparison study. in Neural Networks, 2005. IJCNN'05. Proceedings. 2005 IEEE International Joint Conference on. 2005: IEEE.
45. Chen, Y.-C., L.-H. Wang, and S.-M. Chen, Generating weighted fuzzy rules from training data for dealing with the Iris data classification problem. International Journal of Applied Science and Engineering, 2006. 4(1): p. 41-52.

70
APPENDIX-1
ARTIFICIAL INTELLIGENCE BASED ECG SIGNAL CLASSIFICATION OF SEDENTARY, SMOKERS
AND ATHLETES BIOMEDICAL INSTRUMENTATION LAB, NIT-
Rourkela, Odisha-769008
Instructions: This questionnaire attempts to discern patterns of heart rate variability as a result
of physical and respiratory stress. The research program is being conducted for a research thesis.
Please take your time to fill in the information accurately and to the best of your knowledge. The
information you have provided will be used only for the purposes of this project, and will be kept
strictly confidential. Thank you.
Volunteers History
NUMBER: Date:
1. General Information
1. Name (Mr./Ms/Mrs.)_______________________________________________________
2. Date Of Birth __________________________________________________Age_______
3. Address_________________________________________________________________
_________________________________________________________________
_________________________________________________________________
4. Contact No ____________________E-Mail ____________________________________
5. Body Weight (kg)__________Height (mt)__________BMI (kg/m2)_________________
2. Medical information
1. Medical History
a) None_________________________
b) Specify If Any__________________
2. Surgical History

71
a) None_________________________
b) Specify If Any__________________
3. Gynecological Problem
a) None _________________________
b) Specify If Any _________________
4. Drug History
a) None _________________________
b) Specify If Any__________________
5. Sleeping Disorder
a) None _____________________________
b) Specify If Any_______________________
6. Appetite
a) None______________________________
b) Specify If Any_______________________
7. Diet Habit
a) Vegetarian _________________________
b) Non-Vegetarian_____________________
c) Eggetarian_________________________

72
Declaration:
I Mr. /Miss. __________________________ hereby give my consent to Mr. Niraj Bagh and/or
Dr. Kunal Pal to utilize the information obtained from the study towards thesis writing/research
publication. I have been explained thoroughly with the experimental design and information to
be studied. I hereby declare that the particulars of information and facts stated above are true,
correct and complete to the best of my knowledge and belief.
………………………………… Signature of the participant with date
People in charge of administering the questionnaire
Dr. Kunal Pal
Asst Prof.
Dept of Biotechnology & Medical Engg
NIT‐Rourkela Phone # 9178812505 Email id: [email protected]
Niraj Bagh
M.Tech, 2nd
Year
Biomedical Instrumentation Lab, NIT‐Rourkela
Phone: #9861230655
E‐mail: [email protected]


![ECG Signal processing (2) ECE, UA. ECG signal processing - Case [1] Diagnosis of Cardiovascular Abnormalities From Compressed ECG: A Data Mining-Based.](https://static.fdocuments.in/doc/165x107/56649dbf5503460f94ab3016/ecg-signal-processing-2-ece-ua-ecg-signal-processing-case-1-diagnosis.jpg)