Artificial Intelligence and Mechanistic Modeling for ...
53
HAL Id: hal-02916941 https://hal.inria.fr/hal-02916941 Submitted on 18 Aug 2020 HAL is a multi-disciplinary open access archive for the deposit and dissemination of sci- entific research documents, whether they are pub- lished or not. The documents may come from teaching and research institutions in France or abroad, or from public or private research centers. L’archive ouverte pluridisciplinaire HAL, est destinée au dépôt et à la diffusion de documents scientifiques de niveau recherche, publiés ou non, émanant des établissements d’enseignement et de recherche français ou étrangers, des laboratoires publics ou privés. Artificial Intelligence and Mechanistic Modeling for Clinical Decision Making in Oncology Sébastien Benzekry To cite this version: Sébastien Benzekry. Artificial Intelligence and Mechanistic Modeling for Clinical Decision Making in Oncology. Clinical Pharmacology and Therapeutics, American Society for Clinical Pharmacology and Therapeutics, 2020, 10.1002/cpt.1951. hal-02916941
Transcript of Artificial Intelligence and Mechanistic Modeling for ...

HAL Id: hal-02916941https://hal.inria.fr/hal-02916941
Submitted on 18 Aug 2020
HAL is a multi-disciplinary open accessarchive for the deposit and dissemination of sci-entific research documents, whether they are pub-lished or not. The documents may come fromteaching and research institutions in France orabroad, or from public or private research centers.
L’archive ouverte pluridisciplinaire HAL, estdestinée au dépôt et à la diffusion de documentsscientifiques de niveau recherche, publiés ou non,émanant des établissements d’enseignement et derecherche français ou étrangers, des laboratoirespublics ou privés.
Artificial Intelligence and Mechanistic Modeling forClinical Decision Making in Oncology
Sébastien Benzekry
To cite this version:Sébastien Benzekry. Artificial Intelligence and Mechanistic Modeling for Clinical Decision Making inOncology. Clinical Pharmacology and Therapeutics, American Society for Clinical Pharmacology andTherapeutics, 2020, �10.1002/cpt.1951�. �hal-02916941�
Artificial intelligence and mechanistic modeling
for clinical decision making in oncology
S. Benzekry1,2,*
1 : MONC team, Inria Bordeaux Sud-Ouest, Talence, France.
2 : Institut de Mathématiques de Bordeaux, CNRS UMR 5251, Bordeaux University,
Talence, France.
* correspondence to Dr Sebastien Benzekry: [email protected]
The author declares no competing interest for this work.

2
Abstract
The amount of ‘big’ data generated in clinical oncology, whether from molecular,
imaging, pharmacological or biological origin, brings novel challenges. To mine
efficiently this source of information, mathematical models able to produce
predictive algorithms and simulations are required, with applications for
diagnosis, prognosis, drug development or prediction of the response to
therapy. Such mathematical and computational constructs can be subdivided
into two broad classes: biologically agnostic, statistical models using artificial
intelligence techniques, and physiologically-based, mechanistic models. In this
review, recent advances in the applications of such methods in clinical oncology
are outlined. These include machine learning applied to big data (omics, imaging
or electronic health records), pharmacometrics, quantitative systems
pharmacology, tumor size kinetics, and metastasis modeling. Focus is set on
studies with high potential of clinical translation, as well as applied to cancer
immunotherapy. Perspectives are given in terms of combinations of the two
approaches: ‘mechanistic learning’.
3
Introduction
Cancer diseases are a major health concern in the modern society. Taken
together, they were responsible for 9.6 million deaths in 2018, which represents
nearly 1 in 6 deaths 1. In face of such a public health challenge and considering
the “unreasonable effectiveness of mathematics in natural sciences” 2, one
might wonder: can mathematical models be of help in oncology?
Mathematical constructs have long been confined to the representation,
understanding and prediction of physical systems. The first reported use of a
mathematical model in the life sciences is an epidemiological model by D.
Bernoulli in 1760 who aimed to study the impact of “vaccination” (inoculation of
a small amount of the disease) against smallpox on age distributions and life
expectancy 3. His calculations predicted that “vaccination” would result in a net
life expectancy gain of 3 years.
With the modern development of novel measurement methods (especially from
molecular biology and imaging), accumulation of biological and clinical data is
currently driving oncology towards a quantitative science, which raises the
challenge of inferring general patterns and structures as well as extracting most
information from these. Meanwhile, the number of mathematical models
developed by theoreticians in the field of so-called “mathematical oncology” 4
has been exponentially growing in the last decades 5,6. However, these formal
constructs have often remained confined to qualitative conclusions and rarely
been confronted to observations. Two possible aims can be conceived for
mathematical modeling in oncology:
- better understand. By allowing the simulation (or analysis) of the
implications of biological hypotheses, mathematical and computational models
provide a way to test them against experimental data. This improves our
understanding of the biology by discriminating theories that are able to describe
the data and, perhaps more importantly, reject theories that are not.

4
- better predict. In this case, even if the model is biologically-agnostic
(relying on no a priori biological knowledge), if its predictive power is properly
validated, it can provide a powerful numerical tool for clinical applications. These
can be divided into: (a) diagnosis, (b) prognosis/prediction of response, (c) drug
development and (d) personalized medicine (see examples in Tables 1 and 2).
In this review, we will only deal with models with the second aim. Such models
can be broadly divided into two categories: artificial intelligence and mechanistic
models (Figure 1). The first category implements biologically-agnostic statistical
learning algorithms while the second deals with the modeling and simulation of
actual physiological processes, in order to make predictions in a second phase.
5
Artificial intelligence for clinical oncology
Artificial intelligence (AI) is a sub-discipline of computer sciences that aims at
reproducing, by means of algorithms (implemented in computers, i.e.,
machines), processes that usually require human intelligence (e.g. vision or
language). A sub-branch of AI, termed machine learning (ML), refers to those
algorithms that are largely built from data, in opposition to being explicitly
programmed according to a set of predefined, static, rules. ML is an extension
of traditional statistical techniques, with varying degree of human intervention
along a continuous spectrum. ML algorithms relevant to clinical application can
be divided into unsupervised and supervised learning. Unsupervised learning
deals with the process of finding patterns from a given set of input data only
(e.g., define a relevant classification of cancer from molecular expression data),
while supervised learning tries to predict outcomes (e.g., benign versus
malignant) from the input data (e.g., lesion images). It does so by learning the
relationships between input and output from training sets, with the hope of being
generalizable to other data unseen before. Classical approaches of ML
comprise linear and logistic regression, decision trees, random forests, support
vector machines and artificial neural networks, among others 7. In several
instances relevant to clinical oncology, outputs to be predicted are time-to-event
– thus censored – data, e.g. disease-free, progression-free or overall survival
(OS). Consequently, these require adaptation of the ML algorithms for handling
censoring. To deal with high-dimensional data, LASSO (i.e., L1 penalization) or
ridge (L2 penalization) have been combined with classical Cox regression 8. In
the past few years, the field of machine learning has seen dramatic advances
driven by impressive successes of deep learning (DL) 9,10. DL algorithms are
artificial neural networks with multiple hidden layers. In a given layer, the output
of a neuron is made of the composition of a linear map of the outputs from the
previous layer, and a nonlinear activation function (e.g., sigmoid). This nonlinear
structure allows DL to capture complex mathematical relationships between the
6
input data and the output. DL models can have millions of parameters and thus
require massive amounts of data to be trained. The advent of ‘big data’ in
contemporary years, combined with the increase and accessibility of computing
power, has unleashed powerful applications of DL 10. In clinical oncology, such
‘big data’ come primarily from three sources: omics, images and electronic
health records.
Omics data
Empowered by the public availability of large-scale, multi-omics cancer
databases (e.g. The Cancer Genome Atlas (TCGA,
https://www.cancer.gov/tcga) or Gene Expression Omnibus (GEO) 11), ML
analyses have the potential to drive omics-based precision medicine. The first
ML studies implemented classification tasks. Given high-throughput molecular
data (e.g., gene expression), ML methods have been applied to distinguish
between myeloid and lymphoblastic acute leukemia 12, determine cancer type
13, establish a molecular classification of breast cancers 14 or define gene
expression signatures predictive of survival or metastatic relapse, for instance
in breast 15, lung 16, colorectal 17 or central nervous system 18 cancers. This was
achieved using methods from unsupervised learning such as hierarchical
clustering 19, principal component analysis (PCA)-based clustering 20, k-means
clustering or, more recently, t-distributed Stochastic Neighbor Embedding (t-
SNE) 21.
For tasks such as personal prediction of outcome (e.g., survival, or metastasis-
free survival) from a patient's molecular profile, supervised learning has been
employed, first using traditional ML techniques 7. For instance, Listgarten et al.
found that a support vector machines algorithm performed best at predicting
breast cancer presence from single nucleotide polymorphisms data 22. Then,
fueled by the success of deep learning in handling high dimensional data, recent
studies have applied deep artificial neural networks with omics data as input 23.
For instance, Ching et al. proposed Cox-nnet, an artificial neural network for
7
prediction of survival from transcriptomic data 24. The model is composed of two
layers: one hidden, fully connected layer and one Cox regression layer. The
model was found to exhibit same or better predictive accuracy compared to Cox-
LASSO, Cox-ridge, or random survival forests. Other examples include survival
prognosis from multi-omics data in hepatocellular carcinoma 25, breast cancer
26, or multiple data sets from the TCGA 27. In order to deal with the "curse of
dimensionality" inherent to the very high number of features (consider that gene
expression data can span approximately 20,000 genes), investigators have
implemented various feature selection strategies to reduce dimensionality 26,
including using neural networks themselves 24. Of note, DL methods have been
shown able to integrate multi-omics data spanning RNA and miRNA
sequencing, methylation data and copy number alterations 25,26.
Imaging data
AI is arguably most proficient in leveraging high-dimensional data provided by
images (high number of pixels/voxels). This is due to the successful application
of a particular type of DL termed convolutional neural networks (CNN) to
computer vision tasks. One emblematic success of AI in oncology in recent
years has been to reach dermatologist-level performances for classification of
skin cancer and diagnosis of melanoma from a photograph of the lesion 28.
However, the two main sources of images in clinical oncology are from digital
pathology and radiological images.
Digital pathology
Applied to digital pathology slides, CNNs have been able to reach great success
for the detection of the presence of lymph node metastases in breast cancer,
with area under the roc curve (AUC) as high as 0.996 in an external validation
set and a sensitivity of 91% at 1 false-positive per patient 29. Going further, such
work led to the development of an augmented-reality microscope with real-time
indication of susceptible areas 30. Pushing the concept and using DL to “see”
better in digital pathology, Kather et al. trained a CNN to classify the stromal
8
components (such as lymphocytes, adipose tissue, smooth muscle, etc.) in
colorectal cancer histopathological slides, using 100,000 image patches 31. The
CNN showed excellent accuracy (99% on training, 94% on test set) and formed
the basis of a “deep stroma score” (combination of mean activations of the
output neurons defining the classes (i.e., tissue type)) that showed prognostic
significance for OS and relapse-free survival, both in Cox univariate analysis
and multivariate analysis with classical factors. The same authors further
showed that DL could predict microsatellite instability (a critical predictive
biomarker of response to immunotherapy) from hematoxylin and eosin histology
in gastrointestinal cancer 32, a finding similar to another study where a DL
algorithm was used for classification of lung cancer histological subtypes 33.
Others also used DL for prediction of survival from histology in malignant
mesothelioma and found a critical role of the stroma 34, similar to Kather and
colleagues 31.
AI for diagnosis and segmentation from radiological images
Another important source of high-dimensional data to feed AI algorithms is
provided by radiological images, including radiography, computed tomography
(CT), magnetic resonance imaging (MRI) and functional imaging (e.g. positron
emission tomography (PET)). These can be used either for diagnosis (i.e.,
detecting the presence of a cancer), automatic segmentation (delineation of a
tumor in an image) or prognosis/predictive (e.g., predicting response to therapy)
purpose. In breast cancer, following the generalization of mammography
screening, an important challenge is to be able to detect the presence of cancer
lesions in the images. This task usually requires trained experts and can be
time-consuming. To address this issue, recent advances have been made
whereby AI systems (deep CNNs) have been shown able of superior predictive
power than human experts, in large (>20,000 subjects) databases 35,36. Similar
results have been obtained for reducing false positive and false negative rates
in lung cancer screening, with an area under the ROC curve of 0.944 37.

9
For segmentation tasks, multiple studies used a technique called transfer
learning, that is, the adaptation to their purpose of a previously developed CNN
for another (computer vision) task 38. For instance, the U-Net model architecture,
initially developed for segmentation of neuronal structures from microscopy
images, has been successfully applied to the segmentation of pulmonary
nodules from CT 39, or the segmentation of liver metastases from colon cancer
40. Other methods – still relying on deep CNNs – have been used for the
segmentation of brain tumors from MRI 41.
Radiomics
Fueled by the availability of open source libraries such as PyRadiomics 42 and
free software 43, the number of studies relying on radiological images as a
source of data and applying computational medical imaging (radiomics)
methods has been growing exponentially in recent years, since the introduction
of the term ‘radiomics’ in 2012 44. In such works, quantitative features are
computed from the images to serve as biomarkers. These can either be
handcrafted – i.e. metrics related to the shape, intensity or heterogeneity of
some region of interest –, or automatically extracted from the image, for instance
from some layers of an artificial neural network 45. Several radiomics studies
have been conducted in lung cancer by the group of Aerts for either prediction
of distant metastasis 46, genetic mutations (EGFR and KRAS) 47 or gene
expression profiles 48. In sarcomas, Crombé et al. have established a delta-
radiomics (i.e. difference of radiomic features between two time points)
signature for prediction of response to neo-adjuvant chemotherapy 49.
The first radiomic study for prediction of response to immunotherapy was
provided by Sun et al. 50. Using radiomic features from both the tumor center
and peripheral area, in combination with clinical features, the authors developed
a signature on an internal dataset and validated it in 3 external cohorts: 1) a
TCGA dataset, which confirmed association of the radiomics signature and
RNA-seq based quantification of CD8 T cells infiltration, 2) a histology dataset

10
with direct assessment of immune infiltration and 3) a third dataset with phase I
patients treated with immunotherapy (for predictive value). However, a closer
examination of the results reveals that most of the predictive power was driven
by non-radiomics variables (e.g. tumor location, or imaging machine setup) and
not by the radiomics features themselves 50. Similar observations have been
made whereby radiomics signature has been found not to contain much
additional value than the mere tumor volume 51. Thus the added value of
radiomics should always be adjusted for possible confounding factors included
in simpler variables.
A few radiomics studies have been published using DL and radiological images
for prognosis or prediction of response to therapy. In these, DL models are
applied directly on the images without pre-engineering of the image into well-
defined features, as done in classical radiomics approaches. This allows an
easier application of the algorithms, since it does not require fastidious
segmentation of the area of interest. In addition, the AI analyzes the entire image
which might contain informative patterns rather than the tumor itself (e.g.
surrounding tumor stroma). Applications include prediction of disease-free or
overall survival in nasopharyngeal cancer 52 from PET/CT images, in non-small
cell lung carcinoma (NSCLC) from CT images 53, and in glioblastoma from MRI
54. The models are often used to derive a large number of DL-based features,
subsequently plugged into a LASSO-Cox proportional hazard model.
Interestingly, in contrast to several reports of the superiority of DL in imaging in
general 45, in several comparative studies in oncology, investigators found no
difference between DL and classical radiomics 55,56. For the highly agnostic DL
models, using a single image – especially from non-functional, anatomical
imaging such as CT-scans – can have limited prognosis value 57. In such cases,
exploiting the information contained in longitudinal images can bring added
value 57.
11
Electronic health records
Even though yielding promising results, the applications of AI mentioned above
have not yet reached the maturity to be transposed to the clinic, and only a
handful of AI algorithms have been approved by the American food and drug
administration 10. Meanwhile, the digitalization of health records also provides a
source of massive, mineable data. Probably the most clinically advanced tool in
the analysis of such data is IBM’s cognitive decision-support system, Watson
for health. Relying heavily on literature data (processed automatically using
natural language processing) and expert knowledge (mostly from oncologists at
the Memorial Sloan Kettering Cancer Center), IBM’s tool aims at providing
guidance in individualized treatment decisions. Although no prospective,
randomized clinical study has been reported yet, IBM Watson has been
deployed in multiple clinical institutions over the world. Testing concordance with
actual clinical decisions, results have been contrasted, some reporting high
concordance (93%) in breast cancer 58, while others found a low concordance
(48.9%) in colon cancer 59. Overall, application of Watson has led to
disappointing results so far, in terms of individual treatment planning with
existing strategies as well as with potentially innovative treatments 60.
Explanations have been proposed in that it mostly reflects the decisions of the
experts who trained it 60.

12
Mechanistic modeling
As seen above, AI has been very proficient at mining high-throughput data. In
particular, the most impressive successes have been in imaging. This can be
interpreted as a consequence of the actual structure of DL models, which
mimicks actual neurons in the brain, directly involved in tasks such as vision.
However, despite this “physiologically-inspired” structure, AI algorithms suffer
multiple limitations such as their lack of interpretability 45 or the requirement of
very large annotated and properly curated data sets. Moreover, AI algorithms
have so far been able to reach human performances but rarely outperformed
them. For other tasks than vision such as clinical decision making and
therapeutic management (e.g., predict the impact of a given change of dose or
scheduling of a drug), AI has yet to demonstrate its applicability. Limitations in
terms of interpretability of AI algorithms calls for incorporation of biological
knowledge into the models, also called “visible” machine learning 61. In contrast
to biologically-agnostic AI models, mechanistic approaches develop
physiologically relevant models able not only to link input and output, but also to
simulate the kinetics of oncogenic processes and treatment (Figure 1). They are
thus linked to the type of relevant data amenable to quantification. The main
categories of such data are pharmacological data (e.g., plasma drug
concentrations) and tumor size (from radiological techniques). Figure 2
recapitulates the classes of mechanistic models relevant to oncology. In recent
years, cancer research and clinical oncology have focused on cancer
immunotherapy, in particular with the advent of immune-checkpoint inhibitors
(ICI) 62. Consequently, mathematical modeling studies have addressed relevant
issues relating to immune-oncology drug development or for clinical care.

13
Modeling in (immune-)onco-pharmacology
Pharmacometrics
Historically, population pharmacokinetics (PK) modeling has been initiated by
the pioneering work of L. Sheiner in the 1970’s 63. The aim of such quantitative
approach is twofold. First, to translate the actual PK physiological processes
into simplified, abstract mathematical constructs (the structural model, e.g. a
compartmental model). Second, to capture inter-individual variability into
statistical distributions of the parameters of the structural model, and to quantify
the impact of covariates on such physiologically-inspired parameters (e.g.
clearance or volume of distribution). Individual predictions from sparse data can
further be obtained using empirical Bayesian estimation.
Population PK studies for ICI (monoclonal antibodies) have been performed
over the last 6 years and have found that two-compartmental models were often
appropriate for description of the concentration time course of these drugs. They
have revealed large inter-individual variability and low, possibly time-varying 64–
66, clearance. Studies have been conducted for ipilimumab 67, nivolumab (alone
64 or in combination with ipilimumab 68), pembrolizumab 69, atezolizumab 70 and
durvalumab 71, in multiple tumor types. These studies allowed simulation of
varying dosing regimens, and were generally supportive of similar PK exposures
between weight-based and flat-dosing regimens. Nevertheless, due to the large
inter-individual variability, the use of therapeutic drug monitoring to personally
adapt the dose of monoclonal antibodies has been proposed, although not
clinically applied so far 72.
Downstream the dose-concentration-exposure relationship, exposure-response
(ER) studies aim at quantifying the dependency of efficacy (e.g., overall
survival) on exposure metrics (e.g., AUC), see Figure 2. As with other
monoclonal antibodies used in oncology, the ER relationship is complex, in
particular due to 1) confounding baseline factors on clearance (better prognostic
associated with lower clearance) and 2) for ICI at least, time-dependent

14
clearance due to variable clearance with disease status 65,66. Adjustment to
baseline prognostic in ER models is needed (to address 1) and use of early
exposure metrics (first cycle) is for now the best approach to mitigate for 2) 65.
ER modeling has been performed for ipilimumab 73, nivolumab 74,75,
pembrolizumab 76 or atezolizumab 77. For example, Feng et al. 75 used several
model-derived individual PK parameters (e.g. the average drug concentration
during the first cycle, to mitigate for 2) as measures of exposure and a
multivariate Cox model (to adjust for 1) to relate them to OS. Overall response
and adverse events were modeled using logistic regression. Baseline clearance
was a proxy for unobserved baseline prognostic factors (e.g., disease status).
They concluded that the ER relationship for nivolumab was flat (a conclusion
shared with others 74,77), which further supported the subsequent label change
for nivolumab from 3 mg/kg Q2W to flat dosing, first 240 mg Q2W and then 480
mg Q4W based only on in silico simulations 78. However, as stated above the
ER relationship for ICI and further mechanistic modeling warranted to address,
e.g. the circular relationship between clearance and disease status/cachexia
75,76.
Quantitative systems pharmacology in immunotherapy
Quantitative systems pharmacology (QSP) studies in oncology investigate the
complex mechanisms of action of anti-cancer agents, in order to determine, for
instance, safe and effective doses for first-in-human studies 79. Such QSP study
of the PK/pharmacodynamics (PD) of pembrolizumab was performed by
Lindauer et al. 80. The authors combined compartmental PK for systemic
distribution of the drug, physiologically-based (PB) PK for tumor-site distribution,
a model of binding of pembrolizumab to its target PD1 and a tumor growth
inhibition model for efficacy of anti-cancer agents in experimental systems
(without the transit compartments that were found insignificant). The model was
developed to predict the minimally effective dose maximizing the probability of
at least 30% growth reduction. Validation was conducted in animals with several
doses and measurements of receptor occupancy in the blood and at the tumor.

15
Translation to human was performed leveraging the PBPK components as well
as replacing the compartmental PK module by a human one and using
allometric scaling for some remaining PD parameters. The results suggested 2
mg/kg Q3W as the minimal dose, with no further improvements in the range 2-
10 mg/kg. Interestingly, this flatness of the dose-response relationship was
confirmed in the modeling analysis of the clinical studies 81. Optimal dosing of
another anti-cancer agent using an immunocytokine was investigated by Ribba
et al. 82. Since their drug is able to bind to immune cells, the authors had to
develop an advanced target-mediated drug disposition mathematical model,
which they used to predict tumor uptake retrieved from imaging data. They found
that a dose-dense schedule could improve the biodistribution of the drug and
showed how their model could be used to individualize treatment plans.
Despite the important success of ICI treatments, long-term efficacy is only
limited to a minority of patients 83. Therefore, combining ICI with other
therapeutic modalities is an appealing strategy to harness anti-tumor immunity.
In an elegant study, Palmer et al. demonstrated that in several cases of drug
combinations (including ICI combinations), the population-level benefit over
monotherapies observed in clinical trials could be explained by the concept of
drug independence whereby there is no actual synergy or additivity at the
individual-level but rather population-level superiority solely due to individual
patients responding to the drugs they are most responsive to, with no added
benefits from other drugs 84 3. Meanwhile, mechanistic modeling could play an
important role in determining the best modes of combination between ICI and
established treatments (surgery, radiotherapy, chemotherapy, targeted therapy)
85,86. Modeling immunotherapy has recently been stretched to gain insights on
optimal modalities for combinations with radiotherapy (RT) 87,88. Based on the
rationale that local radiotherapy increases systemic activation of the immune
system through the release of neo-antigens – the ‘abscopal effect’ – these
studies have translated the cancer-immune interplay into mathematical
constructs to predict the impact of different therapeutic schemes. Based on a

16
thorough understanding of immunological mechanisms, Kosinsky et al. used
multiple experimental groups (of a murine colon carcinoma model), spanning
different combination schedules, for development and validation of a detailed
QSP model incorporating radiotherapy and anti-PD(L)1 therapies 88. It included
multiple processes such as immunogenic cell death and dendritic cell
maturation, time course of PDL1 expression and Treg:CD8+ ratio. Despite its
complexity, the model parameters were either found in the literature or
identifiable from fitting the experimental data, and validation was carefully
conducted in independent datasets. The model gave interesting insights about
responders and non-responders, classified so from the only source of inter-
animal variability in the model, a parameter responsible for T cell infiltration into
the tumor tissue. Simulation of various alternative combination regimens were
conducted and suggested that optimal efficacy was obtained when anti-PD1
treatment was administered prior, or concomitant to the radiotherapy, using
hypo-fractionated schemes. Such predictions could have value to guide clinical
trials among a vast range of combination possibilities. Others proposed a simple
model calculating an ‘immunologically effective dose (IED)’ proposed for
radiotherapy fractionation schemes 89. Relying only on two additional
parameters to the classical ! and " of radiobiology – two physiological time
constants that were derived from the literature – the model could reproduce
preclinical data and gives a valuable tool for in silico exploration of
immunogenicity of RT regimens (see online calculator
www.smartcalculators.online/ied). For instance, the scheduling used in the
PACIFIC study 90 (i.e., 5x2 Gy for 6 weeks) was predicted to have only modest
IED efficacy (12%), whereas another scheduling with same biologically
equivalent dose would increase IED efficacy (i.e., 74% with 3x8 Gy for 6 weeks).
This suggests that algorithmic strategies could lead to higher immunogenicity
and achieve synergism between RT and ICI.
More generally, the question of the optimal combination between different anti-
cancer agents with different modes of action is well-adapted for mathematical

17
modeling 85. For instance, several studies have investigated the combination of
anti-angiogenics with chemotherapy 91,92. The biological rationale is that anti-
angiogenic agents such as bevacizumab induce a transient amelioration of the
tortuous and poorly functional blood vessel network of a tumor, in a process
called vascular normalization. In turn, this could improve the delivery of
chemotherapy, which is always administered in combination with bevacizumab.
Whereas clinical use is to give both drugs concomitantly, these observations
suggest possible value to sequential administration, but an open question
remains the optimal time interval between the two administrations. Imbs et al.
used a first set of experiments to calibrate a model for this synergistic effect,
and then demonstrated that the model predictions – an optimal time interval of
3 days between administration of bevacizumab and the chemotherapy doublet
pemetrexed-cisplatin – were concordant with a second, validation experiment
92.
Design of early-phase clinical trials
Historical concepts
Historically, several concepts of clinical and pharmacological oncology have
been developed in connection with mathematical models 93. For instance, the
Maximum Tolerated Dose (MTD) paradigm emerged following the work of
Skipper, Schabel and Wilcox in the 1960s 94. Working on leukemic cell lines,
they observed exponential growth of the cell populations. In addition, they found
that given concentrations of cytotoxic drugs (including 6-mercaptopurine, 5-
fluoruracil and vinblastine), instead of killing given amount of cells, were killing
a constant fraction of cells, the so-called log-kill effect 94. This pharmacodynamic
relationship between exposure and effect was further substantiated by Jusko 95
based on the premise of an irreversible reaction between the drug and the cells
receptors, and possibly accounting for two cell subpopulations (sensitive and
resistant) 96. Following the further realization that the presence of as little as one
single leukemic cell was sufficient to lead to the host death, they argued that the

18
goal of the therapy should be to achieve complete cure of the disease, i.e.
eradication of all malignant cells. In this context, they demonstrated that a large-
dose/short time (single administration) schedule was superior to a chronic (daily)
low-dose schedule (with similar or larger total dose).
Later, Norton and Simon revised both the growth model and, consequently, the
action of chemotherapy on tumor kinetics 97. Arguing that for solid tumors (e.g.,
breast), there is a mechanical stress constraining growth, they favored a model
of tumor growth exhibiting slowdown, for instance the Gompertz model 98. Going
further, since this consideration suggested a non-constant fraction of
proliferative cells in the tumor, and considering that chemotherapy action is
mostly based on anti-mitotic agents, they proposed and validated the Norton-
Simon hypothesis, which consists in applying the killing term only to the actively
proliferating fraction. Importantly, this theoretical concept suggested that
densified regimen would achieve higher probability of cure, an idea that was
further successfully tested clinically for adjuvant therapy in breast cancer 99.
Recent studies
Beyond the classical MTD paradigm, mathematical models have started to be
applied to help the design of early-phase clinical trials. The first concern in such
trials is safety, in particular controlling life-threatening hematological toxicities in
the context of aggressive regimen such as the dose-dense schedules
mentioned above. In this context, an opportunity for mechanistic modeling is
given by the fact that dynamics of neutrophil counts and myelosuppression can
be quantified 100. To control severe neutropenia and make dose-dense regimen
clinically safe, Meille et al. developed a combined PK-PD model incorporating
both efficacy and toxicity 101. This model was clinically applied in the MODEL1
trial (NCT02392845), to optimize the administration of a combinatorial regimen
of docetaxel and epirubicin in breast cancer 102. The algorithm was used to find
the repartition of the two drugs during the densification process (from three to
two weeks) that would ensure minimal tumor size while respecting toxicity
19
constraints. Resulting from the optimization was a non-trivial schedule, which
was also possible to be adapted individually, using measurements from the first
cycle(s) and empirical Bayesian estimation. This study resulted in a successful
densification of the protocol, with much lower hematological toxicity and higher
efficacy than reported in other studies with standard dosing 102. A similar
strategy – although with a different underlying structural model – was employed
to design the MetroVino trial (NCT02555007) for administration of metronomic
vinorelbine in lung cancer 5,103. However, it remains unclear how to articulate the
relative benefits of dose intensification and metronomic administration.
The previous models did not account for relapse/resistance to therapy, a
phenomenon widely observed in the treatment of advanced cancers. This is due
to intra- (and inter-) tumor clonal heterogeneity 104. A tumor is composed of
multiple clones with varying degrees of sensitivity to a given drug, either pre-
existing at the beginning of therapy or emerging during the course of treatment,
which is only effective against the sensitive cells. It is thus a tempting avenue to
hypothesize that different dosing regimens impact differently on the appearance
of resistance. In particular, the classical MTD paradigm might not be best
adapted since it might lead to eradication of all sensitive cells, thus leaving
space and nutrients available for resistant clones. This eco-evolutionary view of
tumor growth has led several investigators to design mathematical models
aiming at controlling resistance phenomena, from early studies by Goldie and
Coldman 105 to more recent works by Michor 106,107 or Gatenby 108. The Michor
group for instance has transposed biological principles of cancer evolutionary
dynamics into mathematical models relying on stochastic processes to
understand and predict the onset of resistance to anti-EGFR therapies in lung
cancer 109. Using models of polyclonal tumor growth in which each cell can
randomly divide (with or without mutation), live or die, and preclinical data to
calibrate their model, an alternative dosing strategy for erlotinib in the treatment
of EGFR-positive patients with NSCLC was proposed 106. The strategy was
based on a combination of pulse dose twice weekly and daily low-dose. It was
20
further tested in a phase I clinical trial where it unfortunately did not outperform
the standard scheme, but nevertheless was well tolerated and prevented
progression of central nervous system metastases 107. Although basic PK
modeling was considered, no extensive pharmacometrics (incorporating mixed-
effects statistical learning) was included. This feature could have helped control
variability in peak serum concentrations, which was proposed by the authors as
a likely explanation of the modest results obtained 107.
Using similar eco-evolutionary principles for tumor heterogeneity, the concept
of ‘adaptive therapy’ was proposed by Gatenby 110. Arguing that sensitive cells
compete with resistant cells within the tumor, it suggests to treat only upon
progression, on a patient-by-patient basis. After confirmation of the superiority
of this strategy over classical MTD or metronomic schedules in animal
experiments 111, ‘adaptive therapy’ was successfully transposed at the bedside
in metastatic castrate-resistant prostate cancer patients 112.
Tumor size kinetics
Tumor growth inhibition modeling
The generalization of computerized tomography for imaging tumor lesions
allows to collect, non-invasively, quantitative measurements of lesions sizes at
multiple time points. These radiologic measures are employed to evaluate
response to therapy during follow-up by means of the Response Evaluation
Criteria In Solid Tumors (RECIST) 113, used nowadays to make go/no-go
decisions at the end of phase II trials. RECIST consists in following target
lesions defined at baseline, and computing variations of the sum of their largest
diameters to categorize response (progression, stable disease, complete or
partial response). By doing so, longitudinal and continuous information about
the response to treatment is lost. Consequently, RECIST-derived metrics such
as overall response rate (ORR) and progression-free survival (PFS) are only
modest surrogates of the gold standard for evaluating efficacy of a treatment,
i.e. OS. Indeed, OS results can differ, even though PFS and ORR are not

21
different (e.g., between 3 mg/kg and 10 mg/kg for ipilimumab 114). Therefore,
strategies aiming at modeling the full time course of response are appealing,
and might provide better predictors of OS. Such tumor kinetics models (also
called tumor growth inhibition – TGI – models) have now been widely used since
their initial introduction by Tham et al. 115, Wang et al. 116, Claret et al. 117 and
Stein et al. 118. They are often coupled to parametric or semi-parametric
proportional hazard survival models for description and prediction of OS from
model-derived covariates 116,117.
While TGI modeling is now more than a decade-old 119, with models of
increasing complexity to describe advanced growth processes related to, e.g.,
prolonged response from chemotherapy or radiotherapy in gliomas 120, recent
works have focused on applying the methodology to data from clinical trials
involving ICI. Patterns of response to immunotherapy may often differ from
those observed with more classical anti-cancer agents. Response to ICI may
exhibit long term stabilization of disease or response, or conversely different
patterns of progression (i.e. pseudo/hyper-progression). Although this can be
tackled using more complex models, e.g. with second-order kinetics 121, biphasic
zero/first-order kinetics models have been successfully adapted to the ICI
context 81,114,122–124.
TGI modeling for immunotherapy
To address the heterogeneity of response patterns to ICI, mixture models –
whereby some parameters are considered to depend on a latent variable
defining multiple classes – have been considered, for instance for
pembrolizumab 81 and ipilimumab 114, in advanced melanoma. This approach
allows to account for multiple groups (e.g. fast, intermediate and no growth).
Going further, Chatterjee et al. also proposed a single model with no mixture
component that was able to describe the entire population 81. The model is an
extension of the Stein biexponential model 118 and writes:

22
#(%) = #()*+,-.+ /(1 − 2)3456789:⋅< + 23>4?@A9:⋅max(E,<>G+,)H)I, (1)
where 2is a parameter controlling the fraction affected by the shrinking effect
and K3LMN is a time lag allowing to describe delayed response. The link with
exposure was provided by a dependence of the parameter OG+)<P on the
individual area under the concentration curve. Contrasting implications about
the dosing of ICI antibodies have been obtained from these dose/exposure-
response models. While Chatterjee et al. concluded to no difference between 1
mg/kg and 10 mg/kg Q3W 81, Feng et al. found that the dose was associated
with the mixture subpopulation, thus the response 114.
Analyzing trial data of atezolizumab compared to docetaxel in the treatment of
NSCLC, Claret et al. demonstrated the applicability of TGI models to forecast
the outcome of phase III trials 122. Using only data from a phase II trial for
calibration of their TGI-OS model (a sum of two exponentials, #(%) = 3>G< +3Q< − 1 similar to 118, linked to a lognormal survival model), they identified the
growth rate R as a highly significant covariate of OS and were able to predict
the results (hazard ratios) of an independent phase III study, from the data of
the size kinetics. They also demonstrated that such prediction could be achieved
as soon as 40 weeks after study initiation, which corresponded to 30 weeks
before what could be concluded from the observed data only. In addition, their
analysis underscores the added value of TGI-OS models compared to RECIST
alone, because the significant OS difference between the two arms was not
detectable in ORR or PFS only.
In the context of complex tumor-immune interactions, tumor size is not the only
relevant longitudinal biomarker of response to therapy. With the development of
immune-monitoring techniques, cellular and molecular players are amenable to
quantification and it is thus appealing to design more advanced mechanistic
models. In the first such study, Netterberg et al. selected interleukin (IL) 18 as
having the most significant variation among 95 plasma biomarkers initially
23
considered 123. They further built a mechanistic model integrating 1) PK of the
drug (atezolizumab), 2) kinetics of IL18 (indirect response model) and 3) tumor
size kinetics (similar to Claret et al. 117 but with a zero order growth term). Their
analysis unraveled the effects of exposure (area under the curve) on the
magnitude of the response and those of relative change in IL18 on response
duration, emphasizing the utility of immune-monitoring to predict response.
However, a subsequent study demonstrated that IL18 had no significant impact
on OS 125.
Joint models
TGI-OS models estimate the TGI and OS model parameters sequentially. This
can be prone to bias because the survival time can be informative of the tumor
kinetics (patients relapsing fast have a more aggressive disease) 126. On the
other hand, joint models propose to estimate simultaneously the parameters of
the entire model, by defining and maximizing the likelihood of the full data set
(longitudinal measurements + survival) in a single step. This joint modeling
approach has recently flourished in oncology to analyze tumor size (or
biomarker) kinetics and overall or disease-free survival 124,127,128. Tardivon et al.
developed the first model of this kind for cancer immunotherapy (atezolizumab
in urothelial carcinoma) 124. Using a similar model as equation (1) for tumor size
kinetics, the authors identified two model-derived metrics as significantly
associated with OS (time to growth and current SLD slope). Importantly, their
model demonstrated good predictive ability of individual death times in an
external validation data set, with time-dependent areas under the ROC curve all
above 0.75, significantly higher than when the kinetic model metrics were not
included in the model. Król et al. added an important supplemental layer to joint
modeling of size kinetics and survival: the appearance of non-target lesion
(recurrent event) 127. This event is indeed a criterion for progression in the
RECIST criteria and has an impact on survival, which is neglected in classical
TGI-OS models. Using a link between the two types of time-to-event-data

24
(=frailty), the authors demonstrated the utility of this approach to individually
predict probability of death from on-treatment data.
Modeling metastasis
Inter-lesion heterogeneity
The vast majority of tumor size kinetics models describe the main quantitative
output underlying RECIST: the sum of largest diameters of target lesions.
However, modeling this sum as a single mass prevents a truly mechanistic
modeling of the disease growth, because the actual processes happen at the
tumor level. As soon as the model is nonlinear, kinetics of the sum differ from
the sum of the kinetics (e.g. the sum of two exponentials with different rates is
not an exponential). Moreover, interactions between established tumors – a
phenomenon termed ‘concomitant resistance’ – might blur the picture when
modeling the total cancer burden 129. Therefore, the question of modeling inter-
lesion variability (ILV) within the same host is of important relevance and has
started to attract the attention of mathematical modelers in recent years 130–133.
In a model including a hierarchical layer for ILV for the kinetics of standard
uptake values (SUV) from positron emission tomography (PET) imaging in
sunitinib-treated gastrointestinal stromal tumors, Schindler et al. found a
significant ILV for the drug effect, although smaller than inter-patient variability
134. This finding was also observed in another study modeling ILV and
comparing the OS predictive power of model metrics (time-to-growth) derived
from either diameters or volumes (computed from semi-automated tumor
segmentation) in 918 metastatic colorectal cancer patients 130. Inter-lesion
heterogeneity was further analyzed by Mistry et al., by means of mechanistic
models of resistance (either de novo or acquired), leveraging multiple phase III
trial data 131.
Dynamics of metastastic birth
A cancer disease is not limited to growth processes. In the context of a
population of multiple tumor lesions, the appearance of new tumors is a crucial

25
step. While this process can be modeled using joint modeling as mentioned
above 127, mechanistic approaches have also been proposed 135–137. These
could address a critical clinical challenge for cancers diagnosed at early stages:
who should receive adjuvant therapy in addition to surgery, and how much?
In a landmark paper, Iwata et al. proposed a structured partial differential
equation model for the size distribution of regional metastases from an
hepatocellular carcinoma 135. Using a Gompertz growth law and a dissemination
rate proportional to the tumor surface (i.e. ST/V if S is the tumor volume), they
were able to accurately describe clinical data of visible metastases in one
patient. Critically, their model is able to make inference about the number and
size of invisible metastases, from the observations of the visible ones only. It
has been further validated using mixed-effect techniques for inter-animal
variability in nonsurgical 138 and surgical 139 animal models of metastasis. In the
latter, the model was simplified: secondary metastases (metastases from
metastases) were neglected and the dissemination rate was assumed to be
proportional to the tumor volume. The model was also able to fit the probability
of metastatic relapse as a function of primary tumor size in 2,648 breast cancer
patients, with inter-patient variability captured in the statistical distribution of only
one parameter 139. Similar metastatic modeling was applied to clinical data of
brain metastases in NSCLC 137, where it suggested periods of dormancy of the
order of 5 months and demonstrated how prediction of metastasis could help to
guide clinical decision for whole brain radiation therapy (Figure 3).
Mathematical modeling has also been used to shed light on a neglected, but
nevertheless critical aspect of metastatic dynamics: post-surgery metastatic
acceleration. Analyzing the patterns of relapse hazards following breast cancer
surgery, Retsky et al. noticed a bimodal distribution that could be explained
using a computational model incorporating surgery-driven acceleration 140.
Growth suppression by the primary tumor – subsequently leading to post-
surgery acceleration – was also mathematically inferred in another study by

26
Hanin et al. analyzing data of 55 lung metastases from a kidney cancer patient
141.
Metastatic appearance and growth has also been studied through the lens of
clonal evolution 136. In such models, each cell has, for a given time unit, a
probability to mutate and acquire metastatic ability, and then a probability to
leave the primary tumor and establish a distant metastatic colony. Haeno et al.
136 applied their model to comprehensive data of pancreatic cancer patients and
found that metastases were likely to be present at diagnosis. The model
predictions also suggested that chemotherapy alone was better than surgery
alone to maximize survival.
27
Perspectives for combining AI and mathematical 1
modeling: mechanistic learning 2
While both dealing with relevant applications in clinical oncology, it is manifest 3
that the works described within the two classes of mathematical modeling used 4
above (AI and mechanistic modeling) have been performed by multiple 5
communities (AI/ML, pharmacometrics, statistics, mathematicians) that have 6
independently made progress but have remained partitioned. Bridging the gaps 7
between disciplines would surely lead to more powerful methods able to improve 8
the design of clinical trials and cancer patient care 142. On one hand, the lack of 9
interpretability of AI algorithms calls to “open the black box” and incorporate 10
expert knowledge to design more biologically-informed models. On the other 11
hand, most of mechanistic modeling studies have thus far dealt with variables 12
in relatively low dimension but nevertheless face an increase in the amount of 13
quantitative data produced. Therefore, they could benefit from AI techniques to 14
integrate high-throughput data (e.g. omics or imaging data, beyond the mere 15
size or volume of the lesions). For instance, instead of relying almost exclusively 16
on linear covariate models (up to a transformation), highly nonlinear ML 17
algorithms could be used to relate covariates and parameters of the structural 18
model 143,144. Another valuable approach is to derive quantitative metrics from 19
simulation outputs of mechanistic modeling and use them as ML inputs for 20
predictive purposes 145. We propose to name such hybrid approaches 21
combining big data and machine learning with mechanistic modeling 22
“mechanistic learning” 85 (Figure 4). 23
An example of such mechanistic learning study was recently published for the 24
prediction of metastatic relapse in early stage breast cancer 146. Instead of using 25
a biologically agnostic model for survival analysis (e.g. Cox or random survival 26
forest), Nicolò et al. derived a mechanistic model for the actual time of relapse. 27

28
Moreover, in order to deal with the relatively large number of covariates (21), 28
the authors relied on ML for feature selection. Comparison with classical or ML 29
survival analysis revealed similar predictive power among the methods. 30
However, the mechanistic approach presents the advantage to yield simulations 31
of the patient’s metastatic state. 32
Furthermore, the dimension of longitudinal data is increasing. While imaging 33
data start to be analyzed longitudinally with techniques from AI (e.g., recurrent 34
neural networks) 57, the advent of measurements from circulating tumor DNA 35
provide an additional source of longitudinal high-dimensional data. So far, it 36
remains an open question to design mechanistic models able to integrate such 37
data. With the revolution of immunotherapy, increasing attention is given to 38
molecular and cellular immune players. Data gathered from immune-monitoring 39
(flow cytometry and seric markers) generate a large number (> 500) of 40
quantitative variables measurable directly from blood samples, thus in a 41
minimally-invasive manner that can be repeated. For instance, the PIONeeR 42
project is a large-scale clinical study aiming at explaining primary or adaptive 43
resistance to PD-1 inhibitors 147. Such immune-monitoring data will be collected 44
at multiple time points in patients during treatment. This data will further be 45
modeled using a mechanistic learning approach in the QUANTIC project 147. 46
The objective is to build predictive tools able to leverage this high-dimensional 47
data for personal predictions of the kinetics of response to treatment. 48
For efficient translation to the clinic, current mathematical modeling faces 49
multiple challenges. First, it is highly dependent on data and requires large-scale 50
curated databases. Molecular data are usually made publicly available upon 51
publication of the results in online repositories such as the TCGA or GEO. 52
Imaging data are also increasingly shared in similar repositories (see the TCIA 53
148 for radiological images or The Digital Slide Archive 149 for pathology images). 54
However, individual-level data from clinical trials such as longitudinal lesion 55
sizes, PK or biomarkers have limited availability, which is limiting the power of 56
statistical and mechanistic modeling studies. Extending initiatives such as the 57
29
data sphere project 150 or Vivli (vivli.org), which proposes to share data from past 58
clinical trials, would surely be very beneficial. Second, data sharing brings two 59
issues: ethical and practical. The necessary ethical regulatory dispositions that 60
have been introduced in the US (HIPAA) and Europe (GDPR) preserve patient 61
privacy but also limit data sharing. Novel infrastructures enabling the 62
development and testing of the models while ensuring security of the data have 63
to be created 45. Finally, while the wide arsenal of available anti-cancer therapies 64
brings opportunities in terms of applications of mathematical modeling to 65
optimize the design of combinatorial clinical trials, a current challenge is to 66
develop mathematical models not only for clinical trials, but also for personalized 67
therapy (Figure 3). To achieve this, structured and unstructured real-world data 68
from routine management should be collected, organized, analyzed and made 69
available to researchers, not only by private companies (e.g. Flatiron Health), 70
but also public institutions 151. Indeed, mathematical modeling is now well 71
established for applications drug development, but further advances are needed 72
to translate the use of the models at bedside. 73
74
75
76

30
Conclusion
Two hundred and sixty years after Bernoulli’s model for vaccination, medicine,
and particularly oncology, has never been closer to a quantitative science.
Mathematical modeling, either purely statistical (AI), or mechanistic, has
demonstrated that it is able to provide clinically relevant tools, whether for the
improvement of clinical trials or personalized medicine. Hopefully, today’s
mathematical models will have a better future than Bernoulli’s and an increasing
number of these will be implemented into clinically actionable softwares for
better patient care at bedside.

31
Application Data Method Aim Ref
Diagnosis Single nucleotide polymorphisms
(breast)
Support vector machines Prediction of breast cancer 22
Diagnosis Mammography (breast) Deep learning Breast cancer screening 35
Prognosis Gene expression (breast) Hierarchical clustering Prediction of metastatic relapse 15
Prognosis Pathology digital slides (colon) Deep learning Prediction of overall survival 31
Prediction of
response
CT scans (multiple types) Radiomics Prediction of response to
immunotherapy
50
Personalized
medicine
Electronic health records Natural language processing Guide treatment decision at
bedside
(-)
Table 1 : Case studies of artificial intelligence in clinical oncology
0

32
Application Data Method Aim Ref
Drug development Preclinical QSP Determination of dose in FIH study 80
Drug development Preclinical QSP Combination of radiotherapy and
immune-checkpoint inhibition
88
Drug development/
Personalized medicine
Neutrophil counts PK/PD Design of clinical trial 101
Drug development Tumor size and survival (lung) TGI-OS Prediction of phase III from phase II for
Go/no-go decision
122
Prediction of response Circulating biomarkers PK/PD Prediction of response to immunotherapy 123
Personalized medicine Tumor size and survival (bladder) Joint model Individual prediction of survival 124
Prognosis Clinico-pathologic biomarkers and
metastasis-free survival (breast)
Metastasis model Prediction of metastatic relapse 146
Table 2 : Case studies of mechanistic modeling in clinical oncology 1
FIH: first in human. PK: pharmacokinetics. PD: pharmacodynamics. TGI: tumor growth inhibition. OS: overall survival2

33
Figure legends
Figure 1 : Artificial intelligence versus mechanistic modeling. Artificial
intelligence algorithms act as poorly interpretable black boxes that process
input ‘big’ data to generate predictive outputs, e.g for classification between
high and low risk of survival or probability of response to therapy. In contrast,
mechanistic models usually deal with lower-dimensional data (e.g., tumor size),
but can provide simulations in addition to pure predictions. These include
exploration of possible scenarii, for instance the impact of alternative
scheduling regimen or the predicted amount of invisible metastases at time of
diagnosis. TX = treatment.
Figure 2 : Overview of mechanistic methods in oncology. Departing from
the dose (known), such models accommodate for four main types of
quantitative data: drug concentrations, efficacy (e.g., tumor size), safety (e.g.
neutrophil counts) and survival data. Mathematical tools developed to mine
these data have varying degree of complexity, from elementary statistical
analysis tools (e.g. logistic or Cox proportional hazard regression) in
dose/exposure-response modeling, to advanced dynamic models based on
differential equations in quantitative systems pharmacology.
POP PK: population pharmacokinetics. TGI: tumor growth inhibition.
Figure 3: Mechanistic modeling of brain metastasis in NSCLC 137. (A) A
mathematical model describing gompertzian primary tumor growth (two
parameters), response to treatment through a tumor growth inhibition model
(three parameters) and metastatic apparition and growth (two additional
parameters) was able to describe longitudinal data on number and size of
visible brain metastases from a patient with NSCLC. Time unit is months from

34
diagnosis. (B) Inferred size distributions of the total metastatic burden (visible
+ invisible) at time of primary tumor diagnosis. (C) Inferred size distributions of
the total metastatic burden (visible + invisible) at time of first brain metastatic
relapse.
PT = primary tumor. BM = brain metastasis. T0 = time of first cancer cell. T1 =
time of diagnosis. T2 = time of first brain metastatic relapse.
Figure 4 : Mechanistic learning. To account for the increasing dimension of
the quantitative data able to feed mechanistic models, we propose to combine
methods from machine learning (ML) and mechanistic modeling. The link
between high-dimensional baseline data (demographic, clinical, pathological,
molecular or biological variables) and model parameters could be achieved with
ML algorithms. Longitudinal data (e.g. tumor size measurements,
pharmacokinetics, immune-monitoring, seric biomarkers or circulating DNA),
possibly in large dimension as well, are incorporated using mixed-effects
modeling. Time-to-event data (e.g., progression-free or overall survival) could
also be modeled with a mechanistic basis (instead of biologically-agnostic
survival analysis based on, e.g., Cox regression). Once calibrated, the
mechanistic model can be used to simulate the impact of candidate scheduling
regimen to guide clinical trials, or help treatment individualization.

35
References
1. Bray, F. et al. Global cancer statistics 2018: GLOBOCAN estimates of incidence
and mortality worldwide for 36 cancers in 185 countries. CA: A Cancer Journal for
Clinicians 68, 394–424 (2018).
2. Wigner, E. P. The unreasonable effectiveness of mathematics in the natural
sciences. Richard courant lecture in mathematical sciences delivered at New York
University, May 11, 1959. Communications on Pure and Applied Mathematics 13, 1–
14 (1960).
3. Bernoulli, D. Essai d’une nouvelle analyse de la mortalité causée par la petite
vérole, et des avantages de l’inoculation pour la prévenir. Histoire de l’Acad., Roy.
Sci.(Paris) avec Mem 1–45 (1760).
4. Gatenby, R. A. & Maini, P. K. Mathematical oncology: cancer summed up.
Nature 421, 321–321 (2003).
5. Barbolosi, D., Ciccolini, J., Lacarelle, B., Barlési, F. & André, N. Computational
oncology—mathematical modelling of drug regimens for precision medicine. Nature
reviews Clinical oncology 13, 242 (2016).
6. Altrock, P. M., Liu, L. L. & Michor, F. The mathematics of cancer: integrating
quantitative models. Nat Rev Cancer 15, 730–745 (2015).
7. Kourou, K., Exarchos, T. P., Exarchos, K. P., Karamouzis, M. V. & Fotiadis, D.
I. Machine learning applications in cancer prognosis and prediction. Comput Struct
Biotechnol J 13, 8–17 (2015).
8. Simon, N., Friedman, J., Hastie, T. & Tibshirani, R. Regularization Paths for
Cox’s Proportional Hazards Model via Coordinate Descent. J. Stat. Soft. 39, (2011).
9. LeCun, Y., Bengio, Y. & Hinton, G. Deep learning. Nature 521, 436–444 (2015).
10. Topol, E. J. High-performance medicine: the convergence of human and
artificial intelligence. Nat Med 25, 44 (2019).

36
11. Barrett, T. et al. NCBI GEO: archive for functional genomics data sets—update.
Nucleic Acids Res 41, D991–D995 (2013).
12. Golub, T. R. et al. Molecular classification of cancer: class discovery and class
prediction by gene expression monitoring. Science 286, 531–537 (1999).
13. Ramaswamy, S. et al. Multiclass cancer diagnosis using tumor gene expression
signatures. Proc Natl Acad Sci USA 98, 15149–15154 (2001).
14. Perou, C. M. et al. Molecular portraits of human breast tumours. Nature 406,
747–752 (2000).
15. Veer, L. J. van ’t et al. Gene expression profiling predicts clinical outcome of
breast cancer. Nature 415, 530–536 (2002).
16. Shedden, K. et al. Gene expression–based survival prediction in lung
adenocarcinoma: a multi-site, blinded validation study. Nat Med 14, 822–827 (2008).
17. Guinney, J. et al. The consensus molecular subtypes of colorectal cancer. Nat.
Med. 21, 1350–1356 (2015).
18. Capper, D. et al. DNA methylation-based classification of central nervous
system tumours. Nature 555, 469–474 (2018).
19. Eisen, M. B., Spellman, P. T., Brown, P. O. & Botstein, D. Cluster analysis and
display of genome-wide expression patterns. Proc Natl Acad Sci USA 95, 14863–14868
(1998).
20. Alexe, G., Dalgin, G. S., Ganesan, S., Delisi, C. & Bhanot, G. Analysis of breast
cancer progression using principal component analysis and clustering. J. Biosci. 32,
1027–1039 (2007).
21. IJzendoorn, D. G. P. van et al. Machine learning analysis of gene expression data
reveals novel diagnostic and prognostic biomarkers and identifies therapeutic targets for
soft tissue sarcomas. PLoS Comput Biol 15, e1006826 (2019).
22. Listgarten, J. et al. Predictive Models for Breast Cancer Susceptibility from
Multiple Single Nucleotide Polymorphisms. Clin Cancer Res 10, 2725–2737 (2004).

37
23. Zhu, W., Xie, L., Han, J. & Guo, X. The Application of Deep Learning in Cancer
Prognosis Prediction. Cancers 12, 603 (2020).
24. Ching, T., Zhu, X. & Garmire, L. X. Cox-nnet: An artificial neural network
method for prognosis prediction of high-throughput omics data. PLoS Comput Biol 14,
e1006076 (2018).
25. Chaudhary, K., Poirion, O. B., Lu, L. & Garmire, L. X. Deep Learning-Based
Multi-Omics Integration Robustly Predicts Survival in Liver Cancer. Clin. Cancer Res.
24, 1248–1259 (2018).
26. Huang, Z. et al. SALMON: Survival Analysis Learning With Multi-Omics
Neural Networks on Breast Cancer. Front Genet 10, 166 (2019).
27. Yousefi, S. et al. Predicting clinical outcomes from large scale cancer genomic
profiles with deep survival models. Sci Rep 7, 1–11 (2017).
28. Esteva, A. et al. Dermatologist-level classification of skin cancer with deep
neural networks. Nature 542, 115–118 (2017).
29. Liu, Y. et al. Artificial Intelligence-Based Breast Cancer Nodal Metastasis
Detection: Insights Into the Black Box for Pathologists. Arch. Pathol. Lab. Med. 143,
859–868 (2019).
30. Chen, P.-H. C. et al. An augmented reality microscope with real-time artificial
intelligence integration for cancer diagnosis. Nature Medicine 25, 1453–1457 (2019).
31. Kather, J. N. et al. Predicting survival from colorectal cancer histology slides
using deep learning: A retrospective multicenter study. PLOS Medicine 16, e1002730
(2019).
32. Kather, J. N. et al. Deep learning can predict microsatellite instability directly
from histology in gastrointestinal cancer. Nat. Med. 25, 1054–1056 (2019).
33. Coudray, N. et al. Classification and mutation prediction from non-small cell
lung cancer histopathology images using deep learning. Nat. Med. 24, 1559–1567
(2018).

38
34. Courtiol, P. et al. Deep learning-based classification of mesothelioma improves
prediction of patient outcome. Nature Medicine 25, 1519–1525 (2019).
35. McKinney, S. M. et al. International evaluation of an AI system for breast cancer
screening. Nature 577, 89–94 (2020).
36. Wu, N. et al. Deep Neural Networks Improve Radiologists’ Performance in
Breast Cancer Screening. IEEE Trans Med Imaging 1–1
(2019).doi:10.1109/TMI.2019.2945514
37. Ardila, D. et al. End-to-end lung cancer screening with three-dimensional deep
learning on low-dose chest computed tomography. Nature Medicine 25, 954–961
(2019).
38. Shin, H.-C. et al. Deep Convolutional Neural Networks for Computer-Aided
Detection: CNN Architectures, Dataset Characteristics and Transfer Learning. IEEE
Trans Med Imaging 35, 1285–1298 (2016).
39. Setio, A. A. A. et al. Validation, comparison, and combination of algorithms for
automatic detection of pulmonary nodules in computed tomography images: The
LUNA16 challenge. Medical Image Analysis 42, 1–13 (2017).
40. Vorontsov, E. et al. Deep Learning for Automated Segmentation of Liver
Lesions at CT in Patients with Colorectal Cancer Liver Metastases.
Radiology: Artificial Intelligence 1, 180014 (2019).
41. Pereira, S., Pinto, A., Alves, V. & Silva, C. A. Brain Tumor Segmentation Using
Convolutional Neural Networks in MRI Images. IEEE Transactions on Medical
Imaging 35, 1240–1251 (2016).
42. Griethuysen, J. J. M. van et al. Computational Radiomics System to Decode the
Radiographic Phenotype. Cancer Res 77, e104–e107 (2017).
43. Nioche, C. et al. LIFEx: a freeware for radiomic feature calculation in
multimodality imaging to accelerate advances in the characterization of tumor
heterogeneity. Cancer Res 78, canres.0125.2018-4789 (2018).

39
44. Lambin, P. et al. Radiomics: extracting more information from medical images
using advanced feature analysis. Eur J Cancer 48, 441–446 (2012).
45. Hosny, A., Parmar, C., Quackenbush, J., Schwartz, L. H. & Aerts, H. J. W. L.
Artificial intelligence in radiology. Nature Reviews Cancer 18, 500–510 (2018).
46. Coroller, T. P. et al. CT-based radiomic signature predicts distant metastasis in
lung adenocarcinoma. Radiotherapy and Oncology 114, 345–350 (2015).
47. Velazquez, E. R. et al. Somatic Mutations Drive Distinct Imaging Phenotypes in
Lung Cancer. Cancer Res 77, 3922–3930 (2017).
48. Grossmann, P. et al. Defining the biological basis of radiomic phenotypes in lung
cancer. Elife 6, (2017).
49. Crombé, A. et al. T2 -based MRI Delta-radiomics improve response prediction
in soft-tissue sarcomas treated by neoadjuvant chemotherapy. J Magn Reson Imaging
50, 497–510 (2019).
50. Sun, R. et al. A radiomics approach to assess tumour-infiltrating CD8 cells and
response to anti-PD-1 or anti-PD-L1 immunotherapy: an imaging biomarker,
retrospective multicohort study. Lancet Oncol 19, 1180–1191 (2018).
51. Welch, M. L. et al. Vulnerabilities of radiomic signature development: The need
for safeguards. Radiother Oncol 130, 2–9 (2019).
52. Peng, H. et al. Prognostic Value of Deep Learning PET/CT-based Radiomics:
Potential Role for Future Individual Induction Chemotherapy in Advanced
Nasopharyngeal Carcinoma. Clin Cancer Res (2019).doi:10.1158/1078-0432.CCR-18-
3065
53. Hosny, A. et al. Deep learning for lung cancer prognostication: A retrospective
multi-cohort radiomics study. PLoS Med 15, (2018).
54. Lao, J. et al. A Deep Learning-Based Radiomics Model for Prediction of
Survival in Glioblastoma Multiforme. Sci Rep 7, 10353 (2017).
55. Wang, H. et al. Comparison of machine learning methods for classifying

40
mediastinal lymph node metastasis of non-small cell lung cancer from 18F-FDG
PET/CT images. EJNMMI Research 7, 11 (2017).
56. Cha, K. H. et al. Bladder Cancer Treatment Response Assessment in CT using
Radiomics with Deep-Learning. Sci Rep 7, 8738 (2017).
57. Xu, Y. et al. Deep Learning Predicts Lung Cancer Treatment Response from
Serial Medical Imaging. Clin Cancer Res 25, 3266–3275 (2019).
58. Somashekhar, S. P. et al. Watson for Oncology and breast cancer treatment
recommendations: agreement with an expert multidisciplinary tumor board. Ann Oncol
29, 418–423 (2018).
59. Lee, W.-S. et al. Assessing Concordance With Watson for Oncology, a
Cognitive Computing Decision Support System for Colon Cancer Treatment in Korea.
JCO Clin Cancer Inform 2, 1–8 (2018).
60. IBM pitched Watson as a revolution in cancer care. It’s nowhere close. STAT
(2017).at <https://www.statnews.com/2017/09/05/watson-ibm-cancer/>
61. Yu, M. K. et al. Visible Machine Learning for Biomedicine. Cell 173, 1562–
1565 (2018).
62. Tang, J., Shalabi, A. & Hubbard-Lucey, V. M. Comprehensive analysis of the
clinical immuno-oncology landscape. Ann Oncol 29, 84–91 (2018).
63. Sheiner, L. B., Rosenberg, B. & Melmon, K. L. Modelling of individual
pharmacokinetics for computer-aided drug dosage. Computers and Biomedical
Research 5, 441–459 (1972).
64. Bajaj, G. et al. Model-Based Population Pharmacokinetic Analysis of
Nivolumab in Patients With Solid Tumors. CPT Pharmacometrics Syst Pharmacol 6,
58–66 (2017).
65. Liu, C. et al. Association of time-varying clearance of nivolumab with disease
dynamics and its implications on exposure response analysis. Clin. Pharmacol. Ther.
101, 657–666 (2017).

41
66. Li, H. et al. Time dependent pharmacokinetics of pembrolizumab in patients
with solid tumor and its correlation with best overall response. J Pharmacokinet
Pharmacodyn 44, 403–414 (2017).
67. Feng, Y. et al. Model-based clinical pharmacology profiling of ipilimumab in
patients with advanced melanoma. Br J Clin Pharmacol 78, 106–117 (2014).
68. Sanghavi, K. et al. Population Pharmacokinetics of Ipilimumab in Combination
With Nivolumab in Patients With Advanced Solid Tumors. CPT: Pharmacometrics &
Systems Pharmacology 9, 29–39 (2020).
69. Ahamadi, M. et al. Model-Based Characterization of the Pharmacokinetics of
Pembrolizumab: A Humanized Anti-PD-1 Monoclonal Antibody in Advanced Solid
Tumors. CPT Pharmacometrics Syst Pharmacol 6, 49–57 (2017).
70. Stroh, M. et al. Clinical Pharmacokinetics and Pharmacodynamics of
Atezolizumab in Metastatic Urothelial Carcinoma. Clin. Pharmacol. Ther. 102, 305–
312 (2017).
71. Baverel, P. G. et al. Population Pharmacokinetics of Durvalumab in Cancer
Patients and Association With Longitudinal Biomarkers of Disease Status. Clin.
Pharmacol. Ther. 103, 631–642 (2018).
72. Ratain, M. J. & Goldstein, D. A. Time Is Money: Optimizing the Scheduling of
Nivolumab. J Clin Oncol JCO.18.00045-4 (2018).doi:10.1200/JCO.18.00045
73. Feng, Y. et al. Exposure–response relationships of the efficacy and safety of
ipilimumab in patients with advanced melanoma. Clin Cancer Res 19, 3977–3986
(2013).
74. Wang, X. et al. Quantitative Characterization of the Exposure-Response
Relationship for Cancer Immunotherapy: A Case Study of Nivolumab in Patients With
Advanced Melanoma. CPT Pharmacometrics Syst Pharmacol 6, 40–48 (2017).
75. Feng, Y. et al. Nivolumab Exposure–Response Analyses of Efficacy and Safety
in Previously Treated Squamous or Nonsquamous Non–Small Cell Lung Cancer. Clin
Cancer Res 23, 5394–5405 (2017).
42
76. Turner, D. C. et al. Pembrolizumab Exposure–Response Assessments
Challenged by Association of Cancer Cachexia and Catabolic Clearance. Clin Cancer
Res (2018).doi:10.1158/1078-0432.CCR-18-0415
77. Morrissey, K. M. et al. Alternative dosing regimens for atezolizumab: an
example of model-informed drug development in the postmarketing setting. Cancer
Chemother Pharmacol 84, 1257–1267 (2019).
78. Long, G. V. et al. Assessment of nivolumab exposure and clinical safety of 480
mg every 4 weeks flat-dosing schedule in patients with cancer. Ann Oncol 29, 2208–
2213 (2018).
79. Zhao, X., Wang, X., Feng, Y., Agrawal, S. & Shah, D. K. Application of PK-PD
Modeling and Simulation Approaches for Immuno-Oncology Drugs. In Development of
Antibody-Based Therapeutics 4, 207–222 (Adis, Singapore, Singapore, 2018).
80. Lindauer, A. et al. Translational pharmacokinetic/pharmacodynamic modeling
of tumor growth inhibition supports dose-range selection of the anti–PD-1 antibody
pembrolizumab. CPT Pharmacometrics Syst Pharmacol 6, 11–20 (2017).
81. Chatterjee, M. S. et al. Population Pharmacokinetic/Pharmacodynamic
Modeling of Tumor Size Dynamics in Pembrolizumab-Treated Advanced Melanoma.
CPT Pharmacometrics Syst Pharmacol 6, 29–39 (2017).
82. Ribba, B. et al. Prediction of the Optimal Dosing Regimen Using a Mathematical
Model of Tumor Uptake for Immunocytokine-Based Cancer Immunotherapy. Clin
Cancer Res 24, 3325–3333 (2018).
83. Sharma, P., Hu-Lieskovan, S., Wargo, J. A. & Ribas, A. Primary, Adaptive, and
Acquired Resistance to Cancer Immunotherapy. Cell 168, 707–723 (2017).
84. Palmer, A. C. & Sorger, P. K. Combination Cancer Therapy Can Confer Benefit
via Patient-to-Patient Variability without Drug Additivity or Synergy. Cell 171, 1678-
1691.e13 (2017).
85. Ciccolini, J., Barbolosi, D., André, N., Barlesi, F. & Benzekry, S. Mechanistic
Learning for Combinatorial Strategies With Immuno-oncology Drugs: Can Model-

43
Informed Designs Help Investigators? JCO Precision Oncology 486–491
(2020).doi:10.1200/PO.19.00381
86. Milberg, O. et al. A QSP Model for Predicting Clinical Responses to
Monotherapy, Combination and Sequential Therapy Following CTLA-4, PD-1, and PD-
L1 Checkpoint Blockade. Scientific Reports 9, 11286 (2019).
87. Serre, R. et al. Mathematical Modeling of Cancer Immunotherapy and Its
Synergy with Radiotherapy. Cancer Res 76, 4931–4940 (2016).
88. Kosinsky, Y. et al. Radiation and PD-(L)1 treatment combinations: immune
response and dose optimization via a predictive systems model. J Immunother Cancer
6, 17 (2018).
89. Serre, R., Barlesi, F., Muracciole, X. & Barbolosi, D. Immunologically effective
dose: a practical model for immuno-radiotherapy. Oncotarget 9, 31812–31819 (2018).
90. Antonia, S. J. et al. Durvalumab after Chemoradiotherapy in Stage III Non–
Small-Cell Lung Cancer. N Engl J Med 377, 1919–1929 (2017).
91. Wilson, S. et al. Modeling and predicting optimal treatment scheduling between
the antiangiogenic drug sunitinib and irinotecan in preclinical settings. CPT
Pharmacometrics Syst. Pharmacol. 4, 720–727 (2015).
92. Imbs, D.-C. et al. Revisiting Bevacizumab + Cytotoxics Scheduling Using
Mathematical Modeling: Proof of Concept Study in Experimental Non-Small Cell Lung
Carcinoma. CPT Pharmacometrics Syst Pharmacol 7, 42–50 (2018).
93. Benzekry, S. et al. Metronomic reloaded: Theoretical models bringing
chemotherapy into the era of precision medicine. Semin Cancer Biol 35, 53–61 (2015).
94. Skipper, H. E., Schabel, F. M. & Wilcox, W. S. Experimental evaluation of
potential anticancer agents XIII. On the criteria and kinetics associated with ‘curability’
of experimental leukemia. Cancer Chemother Rep 35, 1–111 (1964).
95. Jusko, W. J. Pharmacodynamics of Chemotherapeutic Effects: Dose-Time-
Response Relationships for Phase-Nonspecific Agents. JPharmSci 60, 892–895 (1971).

44
96. Jusko, W. J. A pharmacodynamic model for cell-cycle-specific
chemotherapeutic agents. Journal of Pharmacokinetics and Biopharmaceutics 1, 175–
200 (1973).
97. Norton, L. & Simon, R. Tumor size, sensitivity to therapy, and design of
treatment schedules. Cancer Treat Rep 61, 1307–1317 (1977).
98. Norton, L. A Gompertzian model of human breast cancer growth. Cancer Res
48, 7067–7071 (1988).
99. Citron, M. L. et al. Randomized trial of dose-dense versus conventionally
scheduled and sequential versus concurrent combination chemotherapy as postoperative
adjuvant treatment of node-positive primary breast cancer: first report of Intergroup
Trial C9741/Cancer and Leukemia Group B Trial 9741. J Clin Oncol 21, 1431–1439
(2003).
100. Friberg, L. E., Henningsson, A., Maas, H., Nguyen, L. & Karlsson, M. O. Model
of chemotherapy-induced myelosuppression with parameter consistency across drugs.
J. Clin. Oncol. 20, 4713–4721 (2002).
101. Meille, C., Barbolosi, D., Ciccolini, J., Freyer, G. & Iliadis, A. Revisiting Dosing
Regimen Using Pharmacokinetic/Pharmacodynamic Mathematical Modeling:
Densification and Intensification of Combination Cancer Therapy. Clin Pharmacokinet
55, 1015–1025 (2016).
102. Hénin, E. et al. Revisiting dosing regimen using PK/PD modeling: the MODEL1
phase I/II trial of docetaxel plus epirubicin in metastatic breast cancer patients. Breast
Cancer Res Treat 156, 331–341 (2016).
103. Barlesi, F. et al. Mathematical modeling for Phase I cancer trials: A study of
metronomic vinorelbine for advanced non-small cell lung cancer (NSCLC) and
mesothelioma patients. Oncotarget 8, 47161–47166 (2017).
104. Gerlinger, M. et al. Intratumor heterogeneity and branched evolution revealed
by multiregion sequencing. N. Engl. J. Med. 366, 883–892 (2012).
105. Goldie, J. H. & Coldman, a J. A mathematic model for relating the drug

45
sensitivity of tumors to their spontaneous mutation rate. Cancer Treat Rep 63, 1727–
1733 (1979).
106. Chmielecki, J. et al. Optimization of dosing for EGFR-mutant non-small cell
lung cancer with evolutionary cancer modeling. Sci Transl Med 3, 90ra59-90ra59
(2011).
107. Yu, H. A. et al. Phase 1 study of twice weekly pulse dose and daily low-dose
erlotinib as initial treatment for patients with EGFR-mutant lung cancers. Ann Oncol 28,
278–284 (2017).
108. Gatenby, R. A. A change of strategy in the war on cancer. Nature 459, 508–509
(2009).
109. Foo, J. & Michor, F. Evolution of resistance to targeted anti-cancer therapies
during continuous and pulsed administration strategies. PLoS Comput Biol 5, e1000557
(2009).
110. Gatenby, R. a, Silva, A. S., Gillies, R. J. & Frieden, B. R. Adaptive therapy.
Cancer Res 69, 4894–4903 (2009).
111. Enriquez-Navas, P. M. et al. Exploiting evolutionary principles to prolong tumor
control in preclinical models of breast cancer. Sci Transl Med 8, 327ra24 (2016).
112. Zhang, J., Cunningham, J. J., Brown, J. S. & Gatenby, R. a Integrating
evolutionary dynamics into treatment of metastatic castrate-resistant prostate cancer.
Nature Communications 8, 1816 (2017).
113. Eisenhauer, E. A. et al. New response evaluation criteria in solid tumours:
Revised RECIST guideline (version 1.1). European Journal of Cancer 45, 228–247
(2009).
114. Feng, Y., Wang, X., Suryawanshi, S., Bello, A. & Roy, A. Linking Tumor
Growth Dynamics to Survival in Ipilimumab-Treated Patients With Advanced
Melanoma Using Mixture Tumor Growth Dynamic Modeling. CPT Pharmacometrics
Syst Pharmacol 8, 825–834 (2019).

46
115. Tham, L.-S. et al. A Pharmacodynamic Model for the Time Course of Tumor
Shrinkage by Gemcitabine + Carboplatin in Non–Small Cell Lung Cancer Patients. Clin
Cancer Res 14, 4213–4218 (2008).
116. Wang, Y. et al. Elucidation of relationship between tumor size and survival in
non-small-cell lung cancer patients can aid early decision making in clinical drug
development. Clin Pharmacol Ther 86, 167–174 (2009).
117. Claret, L. et al. Model-based prediction of phase III overall survival in colorectal
cancer on the basis of phase II tumor dynamics. J Clin Oncol 27, 4103–4108 (2009).
118. Stein, W. D. et al. Tumor growth rates derived from data for patients in a clinical
trial correlate strongly with patient survival: a novel strategy for evaluation of clinical
trial data. The Oncologist 13, 1046–1054 (2008).
119. Bruno, R. et al. Progress and Opportunities to Advance Clinical Cancer
Therapeutics Using Tumor Dynamic Models. Clin Cancer Res 1–22
(2019).doi:10.1158/1078-0432.CCR-19-0287
120. Ribba, B. et al. A tumor growth inhibition model for low-grade glioma treated
with chemotherapy or radiotherapy. Clin Cancer Res 18, 5071–80 (2012).
121. Zheng, Y. et al. Population Modeling of Tumor Kinetics and Overall Survival to
Identify Prognostic and Predictive Biomarkers of Efficacy for Durvalumab in Patients
With Urothelial Carcinoma. Clin Pharmacol Ther 103, 643–652 (2018).
122. Claret, L. et al. A Model of Overall Survival Predicts Treatment Outcomes with
Atezolizumab versus Chemotherapy in Non-Small Cell Lung Cancer Based on Early
Tumor Kinetics. Clin Cancer Res 24, 3292–3298 (2018).
123. Netterberg, I. et al. A PK/PDAnalysis of Circulating Biomarkers and Their
Relationship to Tumor Response in Atezolizumab-Treated non-small Cell Lung Cancer
Patients. Clin Pharmacol Ther 105, 486–495 (2018).
124. Tardivon, C. et al. Association Between Tumor Size Kinetics and Survival in
Patients With Urothelial Carcinoma Treated With Atezolizumab: Implication for Patient
Follow-Up. Clin Pharmacol Ther 106, 810–820 (2019).

47
125. Netterberg, I. et al. Tumor Time-Course Predicts Overall Survival in Non-Small
Cell Lung Cancer Patients Treated with Atezolizumab: Dependency on Follow-Up
Time. CPT Pharmacometrics Syst Pharmacol psp4.12489
(2020).doi:10.1002/psp4.12489
126. Desmée, S., Mentré, F., Veyrat-Follet, C. & Guedj, J. Nonlinear Mixed-Effect
Models for Prostate-Specific Antigen Kinetics and Link with Survival in the Context of
Metastatic Prostate Cancer: a Comparison by Simulation of Two-Stage and Joint
Approaches. AAPS J 17, 691–699 (2015).
127. Król, A., Tournigand, C., Michiels, S. & Rondeau, V. Multivariate joint frailty
model for the analysis of nonlinear tumor kinetics and dynamic predictions of death.
Stat Med 37, 2148–2161 (2018).
128. Proust-Lima, C. & Taylor, J. M. G. Development and validation of a dynamic
prognostic tool for prostate cancer recurrence using repeated measures of posttreatment
PSA: a joint modeling approach. Biostatistics 10, 535–549 (2009).
129. Benzekry, S., Lamont, C., Barbolosi, D., Hlatky, L. & Hahnfeldt, P.
Mathematical Modeling of Tumor-Tumor Distant Interactions Supports a Systemic
Control of Tumor Growth. Cancer Res 77, 5183–5193 (2017).
130. Claret, L. et al. Comparison of tumor size assessments in tumor growth
inhibition-overall survival models with second-line colorectal cancer data from the
VELOUR study. Cancer Chemother Pharmacol 82, 49–54 (2018).
131. Mistry, H. B., Helmlinger, G., Al-Huniti, N., Vishwanathan, K. & Yates, J.
Resistance models to EGFR inhibition and chemotherapy in non-small cell lung cancer
via analysis of tumour size dynamics. Cancer Chemother Pharmacol
(2019).doi:10.1007/s00280-019-03840-3
132. Hartung, N. et al. Study of metastatic kinetics in metastatic melanoma treated
with B-RAF inhibitors: Introducing mathematical modelling of kinetics into the
therapeutic decision. PLoS ONE 12, e0176080 (2017).
133. Schindler, E. et al. Pharmacometric Modeling of Liver Metastases’ Diameter,

48
Volume, and Density and Their Relation to Clinical Outcome in Imatinib-Treated
Patients With Gastrointestinal Stromal Tumors. CPT: Pharmacometrics & Systems
Pharmacology 6, 449–457 (2017).
134. Schindler, E., Amantea, M. A., Karlsson, M. O. & Friberg, L. E. PK-PD
modeling of individual lesion FDG-PET response to predict overall survival in patients
with sunitinib-treated gastrointestinal stromal tumor. CPT: Pharmacometrics & Systems
Pharmacology 5, 173–181 (2016).
135. Iwata, K., Kawasaki, K. & Shigesada, N. A Dynamical Model for the Growth
and Size Distribution of Multiple Metastatic Tumors. J Theor Biol 203, 177–186 (2000).
136. Haeno, H. et al. Computational Modeling of Pancreatic Cancer Reveals Kinetics
of Metastasis Suggesting Optimum Treatment Strategies. Cell 148, 362–375 (2012).
137. Bilous, M. et al. Quantitative mathematical modeling of clinical brain metastasis
dynamics in non-small cell lung cancer. Sci Rep 9, 13018 (2019).
138. Hartung, N. et al. Mathematical modeling of tumor growth and metastatic
spreading: validation in tumor-bearing mice. Cancer Res 74, 6397–6407 (2014).
139. Benzekry, S. et al. Modeling Spontaneous Metastasis following Surgery: An In
Vivo-In Silico Approach. Cancer Res 76, 535–547 (2016).
140. Retsky, M. W. et al. Computer simulation of a breast cancer metastasis model.
Breast Cancer Res Treat 45, 193–202 (1997).
141. Hanin, L., Seidel, K. & Stoevesandt, D. A “universal” model of metastatic
cancer, its parametric forms and their identification: what can be learned from site-
specific volumes of metastases. J Math Biol 72, 1633–1662 (2016).
142. Mentré, F. et al. Pharmacometrics and Systems Pharmacology 2030. Clinical
Pharmacology & Therapeutics 107, 76–78 (2020).
143. Lai, T. L., Shih, M.-C. & Wong, S. P. A new approach to modeling covariate
effects and individualization in population pharmacokinetics-pharmacodynamics. J
Pharmacokinet Pharmacodyn 33, 49–74 (2006).

49
144. Knights, J. et al. Vertical Integration of Pharmacogenetics in Population PK/PD
Modeling: A Novel Information Theoretic Method. CPT: Pharmacometrics & Systems
Pharmacology 2, 25 (2013).
145. Lancaster, M. C. & Sobie, E. A. Improved Prediction of Drug-Induced Torsades
de Pointes Through Simulations of Dynamics and Machine Learning Algorithms. Clin.
Pharmacol. Ther. 100, 371–379 (2016).
146. Nicolò, C. et al. Machine Learning and Mechanistic Modeling for Prediction of
Metastatic Relapse in Early-Stage Breast Cancer. JCO Clin Cancer Inform 4, 259–274
(2020).
147. Ciccolini, J., Benzekry, S. & Barlesi, F. Deciphering response and resistance to
immunecheckpoint inhibitors in lung cancer with artificial intelligence-based analysis:
the PIONeeR and QUANTIC projects. British Journal of Cancer under review, (2020).
148. Clark, K. et al. The Cancer Imaging Archive (TCIA): Maintaining and Operating
a Public Information Repository. J Digit Imaging 26, 1045–1057 (2013).
149. Gutman, D. A. et al. The Digital Slide Archive: A Software Platform for
Management, Integration, and Analysis of Histology for Cancer Research. Cancer Res.
77, e75–e78 (2017).
150. Hede, K. Project Data Sphere to Make Cancer Clinical Trial Data Publicly
Available. J Natl Cancer Inst 105, 1159–1160 (2013).
151. NCI Cancer Research Data Commons | CBIIT. at
<https://datascience.cancer.gov/data-commons>

MOLECULAR DATA (OMICS)
IMAGING DATA
ARTIFICIAL INTELLIGENCECLINICAL DATA
MECHANISTIC MODEL
SIMULATION
PREDICTION
PREDICTION
97
99
101
103
0 25 50 75 100Time (days)
Tu
mo
r s
ize
(m
m)
Scheduling 1Scheduling 2
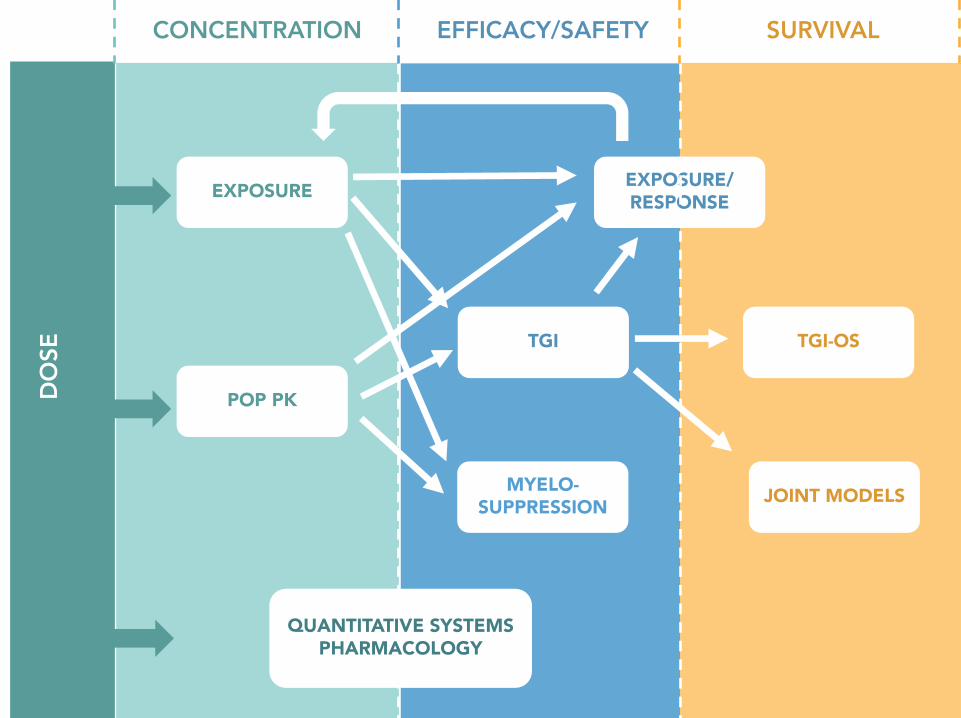
EXPOSURE
POP PK
TGI
EXPOSURE/
RESPONSE
TGI-OS
JOINT MODELS
CONCENTRATION EFFICACY/SAFETY SURVIVALDOSE
QUANTITATIVE SYSTEMS
PHARMACOLOGY
MYELO-
SUPPRESSION
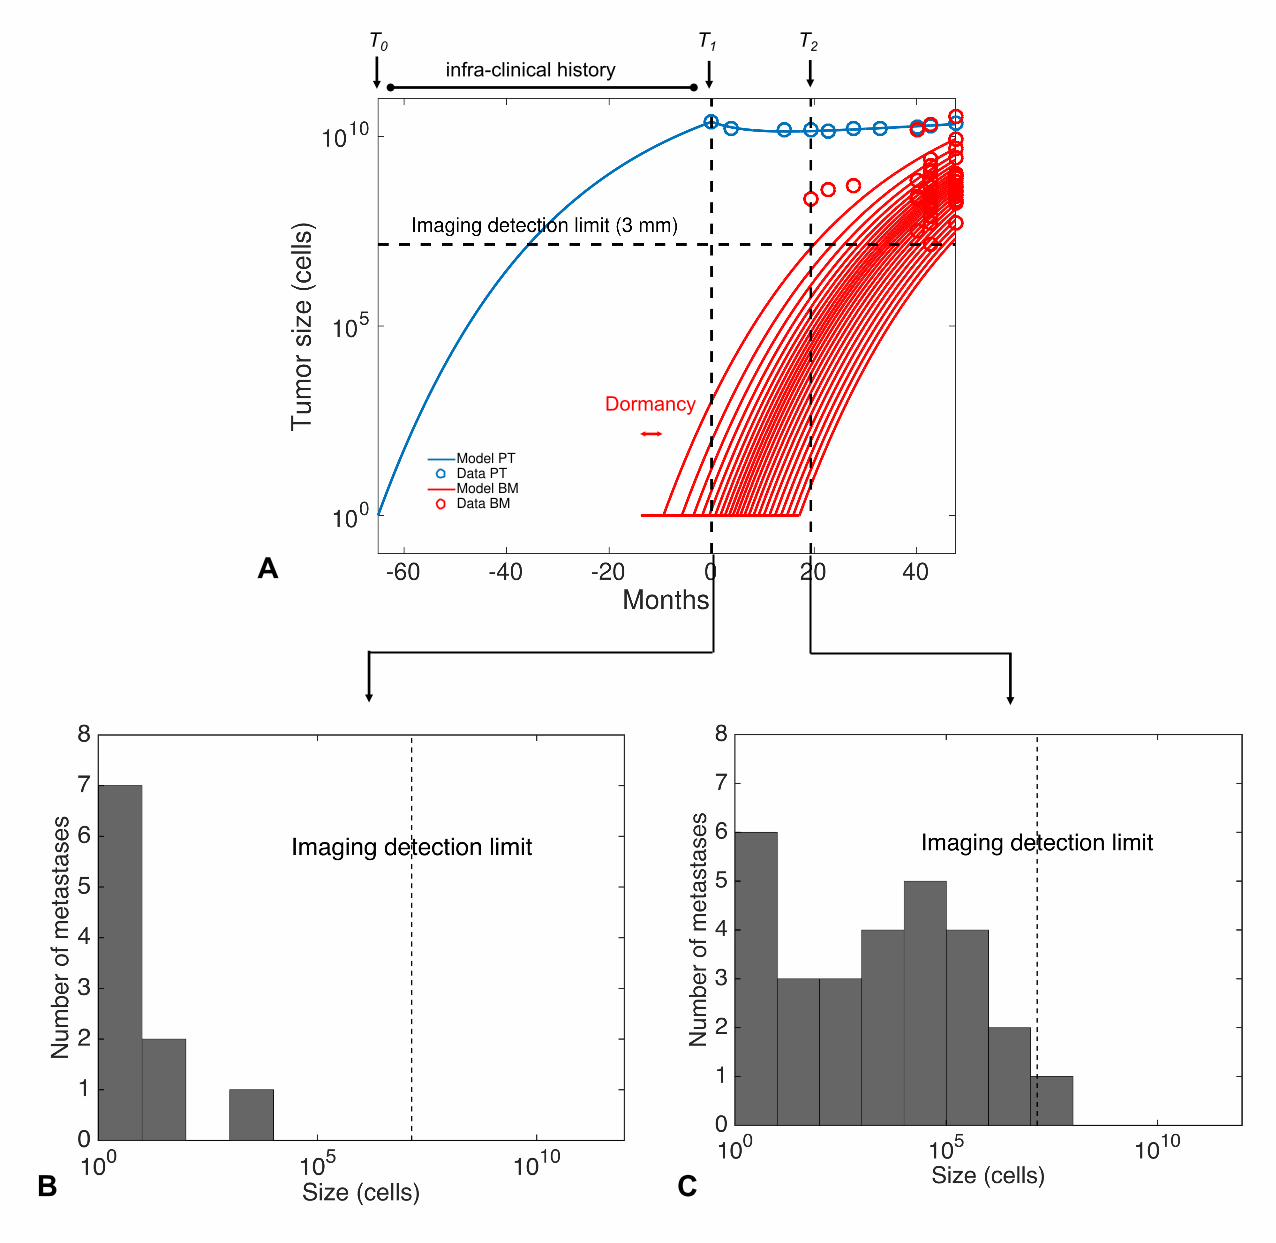
Dormancy
Model PT
Data PT
Model BM
Data BM
infra-clinical history
T0
A
B C
T1 T2