Artifact 2: Exploring graphs of power functions using the...
34
Artifact 2: Exploring graphs of power functions using the TI-nspire Statement of Exploration This exploration examines graphs of power functions. Exploration 1 is in three mains parts. The first part explores the effects of parameter changes on the graph of a power function. The second part examines families of power functions with a given property. The third part looks at the 3D plot of a graph of a power function and the effects of parameter changes. Exploration 1 Part 1: Exploration of the effect of parameter changes on the graph of a parabola 1. Slider Exploration
Transcript of Artifact 2: Exploring graphs of power functions using the...

Artifact 2: Exploring graphs of power functions using the TI-nspire
Statement of Exploration
This exploration examines graphs of power functions. Exploration 1 is in three mains parts. The
first part explores the effects of parameter changes on the graph of a power function. The
second part examines families of power functions with a given property. The third part looks at
the 3D plot of a graph of a power function and the effects of parameter changes.
Exploration 1
Part 1: Exploration of the effect of parameter changes on the graph of a parabola
1. Slider Exploration

The parameter a makes the graph wider or narrower – wider if |a|>1 and narrower if |a|<1. If
a is negative, it flips the graph over the x-axis.


The parameter b controls the type of function that is graphed. For example, if b is 2 then the
graph is that of a quadratic function, a parabola; if b is three then the graph is that of a cubic
function. If b is one, then it is a linear function; if b is less than -1 then the graph is a hyperbola.


The parameter c shifts the graph up if c>0 and down if c<0.
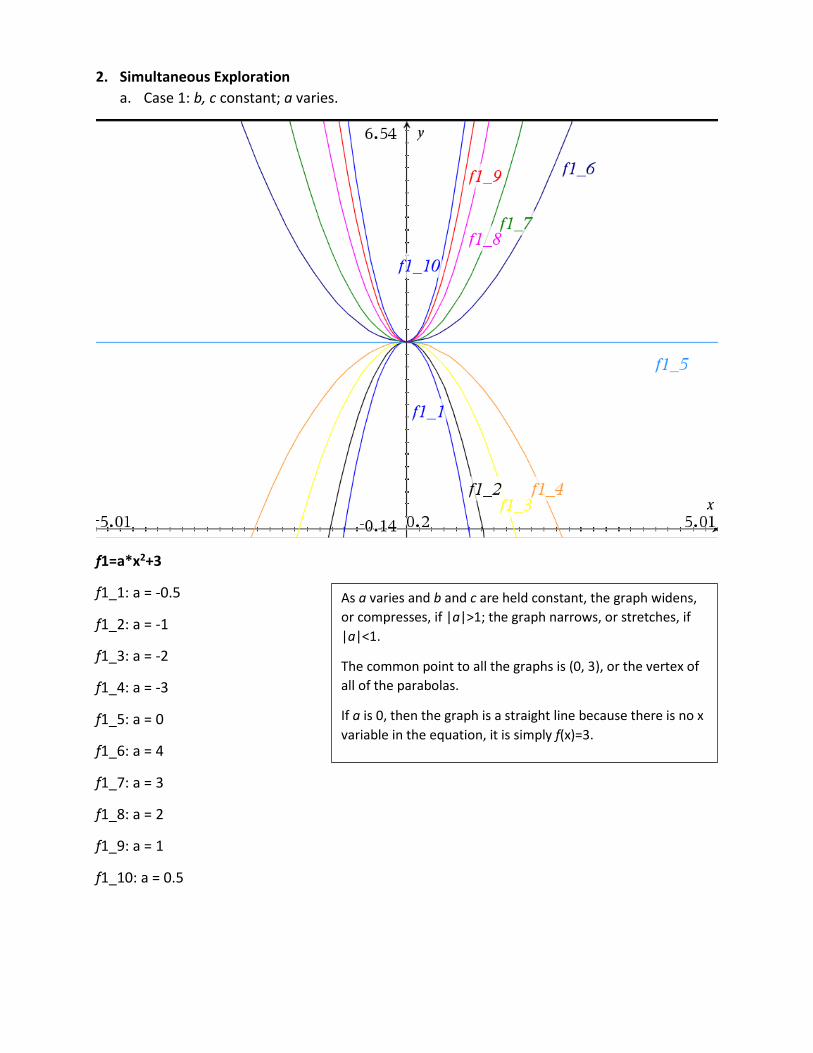
2. Simultaneous Exploration
a. Case 1: b, c constant; a varies.
f1=a*x2+3
f1_1: a = -0.5
f1_2: a = -1
f1_3: a = -2
f1_4: a = -3
f1_5: a = 0
f1_6: a = 4
f1_7: a = 3
f1_8: a = 2
f1_9: a = 1
f1_10: a = 0.5
As a varies and b and c are held constant, the graph widens,
or compresses, if |a|>1; the graph narrows, or stretches, if
|a|<1.
The common point to all the graphs is (0, 3), or the vertex of
all of the parabolas.
If a is 0, then the graph is a straight line because there is no x
variable in the equation, it is simply f(x)=3.

b. Case 2: a, c constant; b varies
f1=2*xb-1
f1_1: b = -3
f1_2: b = -2
f1_3: b = -1
f1_4: b = -0.5
f1_5: b = 0
f1_6: b = 0.5
f1_7: b = 1
f1_8: b = 2
f1_9: b = 3
As b varies and a and c are held constant, the graph changes
from even to odd functions if b>0; if b<0 then the graph is a
hyperbola.
All of the graphs pass through (2, 2).
When b=0, then f(x)=1 since x0=1. This graph is a horizontal line.
When b is a positive fraction, it a “root” function; i.e. if b=0.5
then the graph is that of a square root. If b is a negative fraction,
then the graph is a hyperbola.

c. Case 3: a, b constant; c varies
f1=1*x3+c
f1_1: c = -4
f1_2: c = -3
f1_3: c = -2
f1_4: c = -1
f1_5: c = 0
f1_6: c = 1
f1_7: c = 2
f1_8: c = 3
f1_9: c = 4
When a and b are held constant, and c varies the graph
shifts up and down. When c is positive the graph is shifted
up, when c is negative, the graph is shifted down.
There is no common point to all the graphs.
When c=0, the graph’s “vertex” is at the origin.

Part 2: Exploration of graphs of families of power functions with a given property
1. Roots Exploration

f1(x)=2x-4
f2(x)=x2-4
f3(x)=x3+4x2-19x+14
f4(x)=x2-5x+6
f5(x)=(1/2)x-1
f6(x)=10x-20
f7(x)=x4-7x3-12x2+28x+32
f8(x)=x3-3x2+2x
f9(x)=x4-5x2+4
f10(x)=x3-9x2+26x-24
f11(x)=−x+2
f12(x)=x4-12x3+44x2-48x
f13(x)=x-2
f14(x)=x3-7x2+14x-8
f15(x)=x3+3x2-6x-8
All 15 graphs have the root x=2 in common, thus they all have the same x-intercept (2, 0).
Other than this x-intersect, graphs 3, 8, 9, and 14 have the point (1, 0) in common. Graphs 4
and 10 have the point (3, 0) in common; graphs 10, 12, 14 also have the point (4, 0) in common;
graphs 8 and 12 share the point (0, 0); graphs 7, 9, and 15 share the point (-1, 0); and graphs 2,
7, and 9 have the point (-2, 0) in common. All of these common points are zeros of their
respective functions. There is no specific orientation or position of the graphs.

Part 3: 3D plot of a graph of a power function
Function: ax2+bx+c

If b and c are held constant, then when |a|>1 the graph is narrower. When |a|<1 the graph is
wider. If a is negative then the graph is reflected over the x-axis. When a = 0 the graph is a flat
plane.


Changing b translates the graph along a downwards-facing parabola. When b=0 the vertex of
the graph is at the vertex of the downwards-facing parabola. When b is positive it is translated

to the right, and when b is negative the graph is translated to the left along the downwards-
facing parabola.

When a and b are held constant, c causes the graph to shift up or down. If c is positive the
graph is shifted upwards; if c is negative the graph is shifted downwards.

Exploration 2
Since we have looked at the standard form of a quadratic, f(x)=ax2+bx+c, now we are going to
investigate the vertex form of a quadratic equation. Vertex form is f(x)=a(x-h)2+k
1. When h,k are constant, how does a affect the graph?
→ If |a|>1 then a makes the parabola narrower. If |a|<1 then the parabola is wider than
the parent function. If a<0 the graph is flipped over the x-axis.


2. When a,k are held constant such that a≠0, how does h affect the graph?
→ h shifts the graph left and right. If h<0 (x+h) then the graph is shifted to the left. If h>0
(x-h) then the graph is shifted to the right.

3. When a,h are held constant such that a≠0, how does k affect the graph?
→ k shifts the graph up and down. If k<0 then the graph is shifted down. If k>0 then the
graph is shifted up.

4. What relationships do you notice?
→ (h, k) is the vertex of the parabola.
→ a has the same affect in vertex form as it does in standard form

IDP (INSTRUCTIONAL DESIGN PROJECT)
Content.
Describe: content here. (COMMON CORE STANDARDS)
CCSS.MATH.CONTENT.HAS- F-IF.8 Write a function defined by an expression in different but equivalent forms to reveal and explain different properties of the function.
Describe: Standards of mathematical Practice
CCSS.MATH.PRACTICE.MP2 Reason abstractly and quantitatively
CCSS.MATH.PRACTICE.MP3 Construct viable arguments and critique the reasoning of others
CCSS.MATH.PRACTICE.MP5 Use appropriate tools strategically
Pedagogy.
Pedagogy includes both what the teacher does and what the student does. It includes where, what, and how learning takes place. It is about what works best for a particular content with the needs of the learner.
1. Describe instructional strategy (method) appropriate for the content, the learning environment, and students. This is what the teacher will plan and implement.
This lesson will be based on an investigation into vertex form where students work either in groups of two to three or on their own.
The teacher will first answer any homework questions, and then will do a brief review of linear functions and their graphs.
Then the teacher will do a mini-lesson on quadratics.
The teacher will introduce the investigation in the form of a worksheet that allows the use of TI-Nspire.
At the end of the class the teacher will assign homework and have short class discussion on what was learned.
2. Describe what learner will be able to do, say, write, calculate, or solve as the learning objective. This is what the student does.
Students will be expected to complete everything in TI-Nspire and a word document.
Students will be able to construct a parabola in vertex form using sliders; explain their thinking; and make a conjecture.
The students will explain a being the vertical stretch/compression, and (h, k) being the vertex with h as the horizontal shift and k as the vertical shift, with regards to vertex form. Students will also be able to give and describe standard form of a quadratic.
3. Describe how 21st Century Skill is addressed.
[Learning and Innovation Skills] During the investigation, one must use critical thinking and problem-solving skills in order to effectively analyze and evaluate one’s claim as to

what the parameters are. It is also important to interpret information and draw conclusions based on how each parameter affects the graph.
[Learning and Innovation Skills] During the lesson, students must articulate their thoughts and ideas, and communicate effectively in order to reach a consensus. This implies an ability to work well with peers and a shared responsibility for their work.
[Information, Media and Technology Skills] It is imperative for information to be evaluated critically and competently in order to understand what is being asked. Students will also need to use computers (TI-Nspire and MS Word) to evaluate and communicate information and findings.
[Life and Career Skills] Students must adapt to different roles while completing the lesson. It would be beneficial for students to be able to deal positively with setbacks and criticism from group mates and/or the teacher. They must also manage their time in order to complete the task.
Technology. 1. Describe the technology
TI-Nspire is a computer software similar to the TI-Nspire calculators developed by Texas Instruments. It allows the user to create, edit and save documents, as well as use all of the functions available on the graphing calculator at a faster speed. One can graph functions; compute simple problems, algebraic functions such as a differential equation solver, and calculus functions including limits, derivatives and integrals; create lists and spreadsheets; type up notes; construct and explore geometric figures; analyze data and statistics using various methods; and much more.
2. Describe how the technology enhances the lesson, transforms content, and/or supports pedagogy.
By using TI-Nspire, students will be able to accurately construct a parabola in vertex form using sliders with ease. Using sliders will enhance students’ conceptual understanding of vertex form of a quadratic equation. TI-Nspire allows students to check their conjectures by changing the values attached to the sliders and carefully examining the effect it has on the graph. Students’ reasoning and problem-solving skills will be developed by creating visual representations of the problem.
3. Describe how the technology affects student’s thinking processes.
By using TI-Nspire, students will not be thinking of how to construct a parabola or anything too technical. Students will be able to focus more on their investigation, how to reach a conclusion, and how to communicate their thinking. I believe this will enhance the learning process and students’ understanding.

Quadratics 6-Point Lesson Plan
Subject: Algebra (Math II) Topic: Quadratics
CCSS-M Objective: HAS- F-IF.8 - Write a function defined by an expression in different but
equivalent forms to reveal and explain different properties of the function.
Practice Objectives: Construct viable arguments and critique the reasoning of others; use
appropriate tools strategically.
Activity Description of Activities and
Setting
Materials and Time
I. Focus and Review
(Establish prior
knowledge)
Answer a few homework
questions; review what linear
functions are and how they are
graphed (y=mx+b; m=slope, b=y-
intercept – shifts function up and
down).
Students: homework, pencil,
paper
Teacher: expo markers,
whiteboard
Time: 10-15 min.
II. Statement (Inform
student of objectives)
Inform students that today’s
focus is investigating vertex form
of quadratic equations
2-5 min.
III. Teacher Input
(Present tasks,
information, and
guidance)
Mini-lesson on quadratics and
how they look graphically. Show
and define the vertex.
Students: pencil, paper
Teacher: expo markers,
whiteboard
Time: 20-25 min.
IV. Guided Practice (Elicit
performance, provide
assessment and feedback)
Vertex Form of a Quadratic
worksheet; review worksheet
Students: pencil, worksheet,
computers (TI-Nspire)
Teacher: worksheet and key,
expo markers, whiteboard
Time: 25-30 min.
V. Independent Practice -
- Seatwork and
Homework (Retention
and transfer)
Assign homework Students: pencil, planner
Teacher: expo marker,
whiteboard
Time: 2-5 min.
VI. Closure (Plan for
maintenance)
Bring class together and
review/discuss what was learned
Time: 10-15 min.

Lesson: Quadratic Equations
An example of a Quadratic Equation: 𝑓(𝑥) = 5𝑥2 − 3𝑥 + 3
Quadratic Equations make nice curves called parabolas, like this one:
The name quadratic comes from “quad” meaning square, because the variable gets squared
(𝑥2). It has a degree of two because the x is raised to the second power.
Standard Form:
The standard form of a quadratic equation is 𝑓(𝑥) = 𝑎𝑥2 + 𝑏𝑥 + 𝑐 where a, b and c are
constants and a≠0.
Some examples:
1. 𝑓(𝑥) = −2𝑥2 + 5𝑥 + 3
2. 𝑓(𝑥) = 𝑥2 − 3𝑥
The red point here is called the vertex.
If the parabola opens up, it is the
absolute minimum value of the
function. If the parabola opens down,
like the previous example, the vertex
is an absolute maximum.
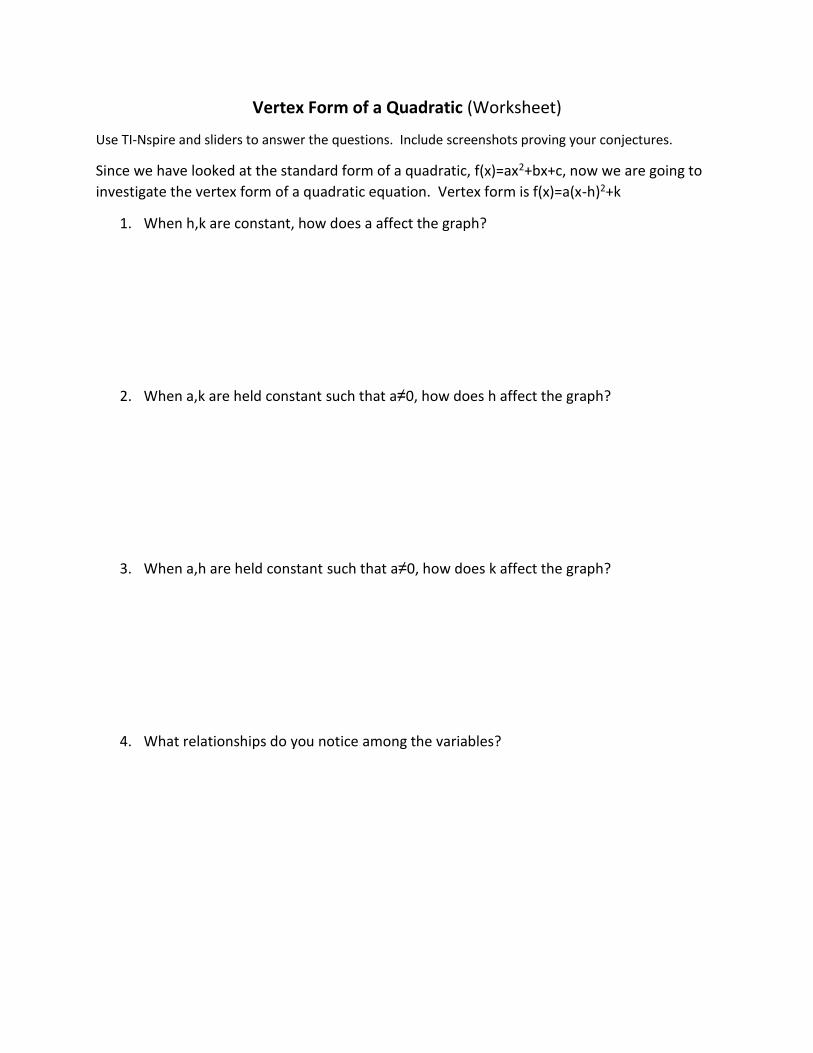
Vertex Form of a Quadratic (Worksheet)
Use TI-Nspire and sliders to answer the questions. Include screenshots proving your conjectures.
Since we have looked at the standard form of a quadratic, f(x)=ax2+bx+c, now we are going to
investigate the vertex form of a quadratic equation. Vertex form is f(x)=a(x-h)2+k
1. When h,k are constant, how does a affect the graph?
2. When a,k are held constant such that a≠0, how does h affect the graph?
3. When a,h are held constant such that a≠0, how does k affect the graph?
4. What relationships do you notice among the variables?

Vertex Form of a Quadratic (Worksheet Key)
*Screenshots may vary
1. When h,k are constant, how does a affect the graph?
→ If |a|>1 then a makes the parabola narrower. If |a|<1 then the parabola is wider than
the parent function. If a<0 the graph is flipped over the x-axis.

2. When a,k are held constant such that a≠0, how does h affect the graph?
→ h shifts the graph left and right. If h<0 (x+h) then the graph is shifted to the left. If h>0
(x-h) then the graph is shifted to the right.

3. When a,h are held constant such that a≠0, how does k affect the graph?
→ k shifts the graph up and down. If k<0 then the graph is shifted down. If k>0 then the
graph is shifted up.

4. What relationships do you notice?
→ (h, k) is the vertex of the parabola.
→ a has the same affect in vertex form as it does in standard form

Reflection
Using TI-Nspire only helped my conceptual thinking in my investigation. By using sliders,
I was able to clearly see how the graph was affected by the changes of the parameters. For
example, when investigating 3D plots of graphs of power functions, I was able to use sliders to
see the effect of a, b, and c. This would have been made extremely more difficult if I would
have had to construct 3D plots by hand. Using TI-Nspire did not hinder my conceptual
understanding.
I believe that students’ understanding will be improved by the use of TI-Nspire to
complete the lesson. Since most students are not very proficient or accurate with graphing,
using the technology will enhance their understanding of vertex form and how the different
parameters transfer onto the graph of the parabola. For example, by changing the value of a
students could easily see that it stretched or compressed the graph. This was a lot more time-
efficient and accurate than graphing by hand using traditional tools and having to construct at
least three graphs by hand per parameter to examine their effects. The use of sliders will allow
students to accurately see how changing the parameters affects the graph since step size can
be chosen, thus enhancing their conceptual understanding of the vertex form of a quadratic.
They will also be able to see that the parameter a has the same effect on the graph in standard
and vertex form, thus making it easier for them in the future to move between both forms.