ARTICLE IN PRESS - University of Tokyowindeng.t.u-tokyo.ac.jp/ishihara/paper/2009-3.pdf ·...
12
Numerical study of aerodynamic characteristics of a square prism in a uniform flow Shinichi Oka a , Takeshi Ishihara b, a C&I, Inc., 7-6-7, Hikarigaoka, Nerima-ku, Tokyo 179-0072, Japan b The University of Tokyo, 7-3-1, Hongou, Bunkyo-ku, Tokyo 113-8656, Japan article info Article history: Received 16 May 2008 Received in revised form 3 August 2009 Accepted 11 August 2009 Keywords: LES Square prism Aerodynamic coefficients Power spectrum Spanwise sensitivity abstract Aerodynamic characteristics of a square prism in a uniform flow for various angles of attack have been investigated using LES turbulence model. The results show that mean aerodynamic coefficients, surface pressures, and flow patterns for all angles of attack agree favorably with experiments. In addition, spanwise length of computational domain is found to slightly influence the mean aerodynamic coefficients whereas it shows strong impacts on fluctuating aerodynamic coefficients, which motivates a development of grid-independent estimation method for quantitative evaluations of fluctuations. The predicted power spectral densities for fluctuating aerodynamic coefficients are in good agreements with experiments in primary frequencies, which can be explained by the flow patterns. Strouhal numbers obtained from the simulations also agree well with experiments and acute change observed around 141 is successfully captured. Finally, a method for estimating grid-independent fluctuating aerodynamic coefficients is proposed by using a systematic elongation of spanwise length and is validated by the numerical tests. & 2009 Elsevier Ltd. All rights reserved. 1. Introduction Aerodynamics of rectangular cylinders, typically used in tall buildings, handrails, pylons, and towers, is essential in evaluations of flow induced vibration and noise problems. Mean aerodynamic coefficients are important for gust response evaluation. Negative gradient of mean lift coefficients could cause negative damping resulting in galloping (Parkinson, 1971; Shimizu et al., 2004), and fluctuating lift coefficient is a key to an evaluation of flow induced noise problems (Lighthill, 1952; Curle, 1955; Kato et al., 1993). Square prism is a typical cross section of rectangular cylinders, and numerous experimental studies have been carried out previously (Vickery, 1966; Otsuki et al., 1978; Ohya et al., 1980; Mizota and Okajima, 1981; Bearman and Obasaju, 1982; Igarash, 1984; Nishimura and Taniike, 2000). It is well known that flow patterns can be classified into two types, perfect separation type where angles of attack is less than 141 and reattachment type where angle of attack is larger than 141. In the perfect separation type, negative gradient of lift coefficients is observed that could result in galloping phenomenon. On the other hand, in reattach- ment type flows, shear layer separating at the leading edge reattaches to the body that could cause a fluttering phenomenon. At angle of attack around 141, reattachment occurs intermittently. It is well known that aerodynamic coefficients change drastically at this point, i.e. mean drag coefficient becomes minimum and magnitude of the lift coefficient reaches maximum. Minimum fluctuating coefficients and maximum Strouhal number are observed in the vicinity of 141 attack angle (Vickery, 1966; Mizota and Okajima, 1981). Nishimura and Taniike (2000) have shown that power spectral density of fluctuating aerodynamic coeffi- cients vary with angles of attack in which primary frequencies are closely related to vortex shedding in the wake. Recently, many numerical studies have been conducted (Tamura et al., 1990; Bosch and Rodi, 1998; Taylor and Vezza, 1999; Hayashi and Ohya, 2000; Shimada and Ishihara, 2001; Hirano et al., 2002). In order to predict flow induced vibrations and noise, a numerical approach should accurately predict the following key aerodynamic characteristics: (1) Variation of mean aerodynamic coefficients and negative gradient of lift coefficient in the range of angles of attack smaller than 141, which is the critical angles range. (2) Fluctuating aerodynamic coefficients vary with angles of attack. (3) Acute change of Strouhal number observed at angle of attack around 141 that is related to change in vortex shedding patterns, and normalized power spectral densities of fluctuat- ing coefficients, which have close relationship with vortex formation in the wake. ARTICLE IN PRESS Contents lists available at ScienceDirect journal homepage: www.elsevier.com/locate/jweia Journal of Wind Engineering and Industrial Aerodynamics 0167-6105/$ - see front matter & 2009 Elsevier Ltd. All rights reserved. doi:10.1016/j.jweia.2009.08.006 Corresponding author. Tel.: +81358411145; fax: +81358411147. E-mail address: [email protected] (T. Ishihara). Please cite this article as: Oka, S., Ishihara, T., Numerical study of aerodynamic characteristics of a square prism in a uniform flow. J. Wind Eng. Ind. Aerodyn. (2009), doi:10.1016/j.jweia.2009.08.006 J. Wind Eng. Ind. Aerodyn. ] (]]]]) ]]]–]]]
Transcript of ARTICLE IN PRESS - University of Tokyowindeng.t.u-tokyo.ac.jp/ishihara/paper/2009-3.pdf ·...

ARTICLE IN PRESS
J. Wind Eng. Ind. Aerodyn. ] (]]]]) ]]]–]]]
Contents lists available at ScienceDirect
Journal of Wind Engineeringand Industrial Aerodynamics
0167-61
doi:10.1
� Corr
E-m
PleasWind
journal homepage: www.elsevier.com/locate/jweia
Numerical study of aerodynamic characteristics of a square prism in auniform flow
Shinichi Oka a, Takeshi Ishihara b,�
a C&I, Inc., 7-6-7, Hikarigaoka, Nerima-ku, Tokyo 179-0072, Japanb The University of Tokyo, 7-3-1, Hongou, Bunkyo-ku, Tokyo 113-8656, Japan
a r t i c l e i n f o
Article history:
Received 16 May 2008
Received in revised form
3 August 2009
Accepted 11 August 2009
Keywords:
LES
Square prism
Aerodynamic coefficients
Power spectrum
Spanwise sensitivity
05/$ - see front matter & 2009 Elsevier Ltd. A
016/j.jweia.2009.08.006
esponding author. Tel.: +81358411145; fax: +
ail address: [email protected] (T
e cite this article as: Oka, S., IshiharEng. Ind. Aerodyn. (2009), doi:10.1
a b s t r a c t
Aerodynamic characteristics of a square prism in a uniform flow for various angles of attack have been
investigated using LES turbulence model. The results show that mean aerodynamic coefficients, surface
pressures, and flow patterns for all angles of attack agree favorably with experiments. In addition,
spanwise length of computational domain is found to slightly influence the mean aerodynamic
coefficients whereas it shows strong impacts on fluctuating aerodynamic coefficients, which motivates
a development of grid-independent estimation method for quantitative evaluations of fluctuations. The
predicted power spectral densities for fluctuating aerodynamic coefficients are in good agreements with
experiments in primary frequencies, which can be explained by the flow patterns. Strouhal numbers
obtained from the simulations also agree well with experiments and acute change observed around 141
is successfully captured. Finally, a method for estimating grid-independent fluctuating aerodynamic
coefficients is proposed by using a systematic elongation of spanwise length and is validated by the
numerical tests.
& 2009 Elsevier Ltd. All rights reserved.
1. Introduction
Aerodynamics of rectangular cylinders, typically used in tallbuildings, handrails, pylons, and towers, is essential in evaluationsof flow induced vibration and noise problems. Mean aerodynamiccoefficients are important for gust response evaluation. Negativegradient of mean lift coefficients could cause negative dampingresulting in galloping (Parkinson, 1971; Shimizu et al., 2004), andfluctuating lift coefficient is a key to an evaluation of flow inducednoise problems (Lighthill, 1952; Curle, 1955; Kato et al., 1993).
Square prism is a typical cross section of rectangular cylinders,and numerous experimental studies have been carried outpreviously (Vickery, 1966; Otsuki et al., 1978; Ohya et al., 1980;Mizota and Okajima, 1981; Bearman and Obasaju, 1982; Igarash,1984; Nishimura and Taniike, 2000). It is well known that flowpatterns can be classified into two types, perfect separation typewhere angles of attack is less than 141 and reattachment typewhere angle of attack is larger than 141. In the perfect separationtype, negative gradient of lift coefficients is observed that couldresult in galloping phenomenon. On the other hand, in reattach-ment type flows, shear layer separating at the leading edgereattaches to the body that could cause a fluttering phenomenon.At angle of attack around 141, reattachment occurs intermittently.
ll rights reserved.
81358411147.
. Ishihara).
a, T., Numerical study of ae016/j.jweia.2009.08.006
It is well known that aerodynamic coefficients change drasticallyat this point, i.e. mean drag coefficient becomes minimum andmagnitude of the lift coefficient reaches maximum. Minimumfluctuating coefficients and maximum Strouhal number areobserved in the vicinity of 141 attack angle (Vickery, 1966; Mizotaand Okajima, 1981). Nishimura and Taniike (2000) have shownthat power spectral density of fluctuating aerodynamic coeffi-cients vary with angles of attack in which primary frequencies areclosely related to vortex shedding in the wake.
Recently, many numerical studies have been conducted(Tamura et al., 1990; Bosch and Rodi, 1998; Taylor and Vezza,1999; Hayashi and Ohya, 2000; Shimada and Ishihara, 2001;Hirano et al., 2002). In order to predict flow induced vibrationsand noise, a numerical approach should accurately predict thefollowing key aerodynamic characteristics:
(1)
rody
Variation of mean aerodynamic coefficients and negativegradient of lift coefficient in the range of angles of attacksmaller than 141, which is the critical angles range.
(2)
Fluctuating aerodynamic coefficients vary with angles ofattack.(3)
Acute change of Strouhal number observed at angle of attackaround 141 that is related to change in vortex sheddingpatterns, and normalized power spectral densities of fluctuat-ing coefficients, which have close relationship with vortexformation in the wake.namic characteristics of a square prism in a uniform flow. J.

ARTICLE IN PRESS
S. Oka, T. Ishihara / J. Wind Eng. Ind. Aerodyn. ] (]]]]) ]]]–]]]2
Among previous numerical studies, three major approachesmay be classified as follows:
The first approach is based on URANS (unsteady Reynoldsaveraged Navier Stokes) model. Shimada and Ishihara (2001)presented 2D analyzes for various section ratio rectangle cylindersusing k2e model in which predictions of mean aerodynamiccoefficients and Strouhal numbers are in good agreement withexperiments. For B/D ratio 1:1 where flow is categorized in theperfect separation type, fluctuating aerodynamic coefficients favor-ably agree with experiments, because periodic components offluctuating aerodynamic forces generated by Karman vortex shed-ding are dominant in this type. However, for reattachment type, thepredictions do not quantitatively match with the experiments,indicating that RANS models are not suitable for reattachment typeflows, because RANS is incapable of capturing stochastic componentof fluctuating pressure (Bosch and Rodi, 1998).
The second approach is DNS (direct numerical simulation).Tamura et al. (1990) has predicted variation of mean aerodynamiccoefficients of a square prism with various angles of attack usingDNS in which third order upwind scheme is adopted. Predictionsof both mean drag and lift coefficients are reported in goodagreement with the experiments, however, there is no informa-tion about the fluctuating aerodynamic components in this study.
Hayashi and Ohya (2000) presented impact of spanwise lengthon fluctuating aerodynamic coefficients of 1:0.6 rectangle cylinderat 01 angle of attack, and found that accuracy of fluctuations canbe improved by increasing spanwise length. This fact indicatesthat capturing three dimensionality of vortexes is important toobtain accurate prediction of fluctuating aerodynamic coeffi-cients. Rodi (1997) has also indicated that spanwise length shouldbe more than four times longer than edge length of the rectanglecylinder. A sufficient length of computational domain in spanwisedirection is required for accurate predictions of fluctuatingaerodynamic forces. However, use of large spanwise lengthrequires huge amount of computational costs.
The third approach is LES (large eddy simulation) in which largeeddies are directly resolved while subgrid size small eddies aremodeled. The advantage of this turbulence model is that itaddresses stochastic components of turbulence fluctuations, threedimensionality of vortex, and high Reynolds number flows. Hiranoet al. (2002) conducted a numerical study of flow around 2:1rectangular cylinder using LES. The predicted results were reportedto have good agreement with the experiments for mean drag and liftcoefficients as well as Strouhal number. However, fluctuatingaerodynamic coefficients are not compared with an experiment.
In this study, mean and fluctuating aerodynamic characteristicsof square prism in a uniform flow are investigated using LES modelto shed light on the predictions of fluctuating aerodynamics. Section2 describes the numerical model and boundary conditions used inthe present study. Section 3 presents variation of mean aerodynamiccoefficients, pressure coefficients, flow patterns, and relationshipsbetween them. Section 4 focuses on fluctuating aerodynamiccoefficients, Strouhal number, and power spectral analysis forvarious angles of attacks. The relationship between flow patternsand primary frequencies of power spectral is presented. In Section 5,a method of predicting grid-independent fluctuating aerodynamiccoefficients is proposed using systematic elongation of spanwiselength, and is validated by the numerical tests. The cost perfor-mance of the proposed method is also analyzed.
2. Numerical model and boundary conditions
2.1. Governing equations
The governing equations employed in LES model are obtainedby filtering the time-dependent Navier–Stokes equations
Please cite this article as: Oka, S., Ishihara, T., Numerical study of aeWind Eng. Ind. Aerodyn. (2009), doi:10.1016/j.jweia.2009.08.006
as follows:
@r ~ui
@xi¼ 0 ð1Þ
@
@tðr ~uiÞ þ
@
@xjðr ~ui ~ujÞ ¼
@
@xjm @
~ui
@xj
� ��@ ~P
@xi�@tij
@xj; ð2Þ
where ~uj and ~p are filtered mean velocity and filtered pressurerespectively. r is density and tij is subgrid-scale stress defined by:
tij � rui uj � ruiuj ð3Þ
The subgrid-scale stresses resulting from the filtering opera-tions are unknown, and modeled as follows:
tij ¼ �2mt~Sij þ
13tkkdij; ð4Þ
where mt is subgrid-scale turbulent viscosity, and ~Sij is the rate-of-strain tensor for the resolved scale defined by:
~Sij �1
2
@ ~ui
@xjþ@ ~uj
@xi
� �: ð5Þ
2.2. Smagorinsky model
Smagorinsky model (Smagorinsky, 1963) is used for thesubgrid-scale turbulent viscosity, mt .
mt ¼ rL2s j~Sj ¼ rLs
ffiffiffiffiffiffiffiffiffiffiffiffiffi2 ~Sij
~S ij
q; ð6Þ
where Ls is the mixing length for subgrid-scales, and defined as:
Ls ¼ minðkd;CsV1=3Þ: ð7Þ
where k is the von Karman constant, 0.42, Cs is Smagorinskyconstant, d is the distance to the closest wall, and V is the volumeof a computational cell.
In general, Cs ¼ 0.1 is widely used in the simulation by finitevolume/difference methods. Most of them employed explicitdiscritization scheme for unsteady term in which negativenumerical diffusions are inherently contained. On the other hand,no numerical diffusion schemes such as spectral method usesmall value for Cs. In this study, the second order implicitdiscritization scheme is utilized, in which numerical diffusionsare small and positive. In order to determine Cs used in this study,systematic study was conducted for the flow around a circularcylinder in advance. The aerodynamic coefficients obtained byusing Cs of 0.032 are closest to those by the spectral method(Ma et al., 2000).
2.3. Boundary conditions
When a wall-adjacent cell is in the laminar sublayer, the wallshear stress is obtained from the laminar stress–strain relation-ship as follows:
~u
ut¼ruty
m ; ð8Þ
If the mesh cannot resolve the laminar sublayer, it is assumed thatthe centroid of the wall-adjacent cells falls within the logarithmicregion of the boundary layer, and the law-of-the-wall is employed.
~u
utt¼
1
k ln Eruty
m
� �ð9Þ
where ~u is filtered velocity that is tangential to the wall, ut isfriction velocity, k is von K�arm�an constant, and constant E is 9.8.Uniform velocity condition is specified at inlet boundary, and zerodiffusive conditions is used at the outlet boundary. Symmetryconditions are given for both sides and upper/lower boundaries.
rodynamic characteristics of a square prism in a uniform flow. J.

ARTICLE IN PRESS
Table 1Parameters used in this study.
Reynolds number UD=n 104
Non-dimensional time step size tU=D 0.04
Spanwise length L 1D 6D
Curvature of the corner r D/100 D/100
The number of mesh in spanwise direction N 10 60
The number of the mesh 175,000 1,050,000
Table 2System configurations of the PC cluster used in this study.
CPU Athlon 64 Processor 3200, 2.01 GHz
Number of nodes 20
Network Gigabit Ethernet
OS CentOS 4.0
CPU time for the case of L ¼ 6D 125 h with 6 nodes
S. Oka, T. Ishihara / J. Wind Eng. Ind. Aerodyn. ] (]]]]) ]]]–]]] 3
2.4. Numerical method
Finite volume method and unstructured collocated mesh areused for the present simulations. The second order centraldifference scheme is used for the convective and viscosity term,and the second order implicit scheme for the unsteady term.SIMPLE (semi-implicit pressure linked equations) algorithmis employed for solving the discritized equations (Ferziger andPeric, 2002).
2.5. Modeling conditions and system configurations
Fig. 1 shows a computational domain and mesh used in thepresent study. The computational domain is square as shown inFig. 1(a), and length of each side of the domain is 60D. Meshdensity is higher at the corners and total 62 grids are distributedin an edge as shown in Fig. 1(b). LES requires a uniform grid intheory. However, it is impossible for the simulation of boundarylayer and non-uniform grids are widely used in practice. Asystematic study by changing aspect ratio of grid size in thevicinity of the square prism was conducted and it was noticed thatthe present non-uniform mesh does not affect the results. Thecorners of the square prism are rounded, as shown in Fig. 1(c),such that the radius of curvature is D/100 after Tamura et al.(1990). Each mesh size is D/10 in the spanwise direction. Uniformvelocity, U ¼ 15 m/s, is specified at flow inlet boundary condition,an edge length, D, of the square prism is 1 cm.
Parameters used in this study are shown in Table 1. The 12angles of attack cases, 01, 21, 61, 81, 121, 131, 141, 161, 201, 301, and451, were simulated with 1D spanwise length model, andrepresentative four angles of attack, 01, 141, 201, and 451, wereperformed with 6D spanwise length model. In addition, for 201angle of attack, 2D, 3D, and 4D spanwise length models were usedto validate the proposed method of estimating grid-independent
60 D
Fig. 1. Computational domain and mesh: (a) computational domain;
Please cite this article as: Oka, S., Ishihara, T., Numerical study of aeWind Eng. Ind. Aerodyn. (2009), doi:10.1016/j.jweia.2009.08.006
fluctuating aerodynamic coefficients in Section 5. Table 2 showssystem configurations of the PC cluster used in this study.
2.6. Definitions of aerodynamic coefficients
2.6.1. Pressure coefficients
Mean pressure coefficient, C p, and fluctuating pressure coeffi-cient, Cp
0 , are respectively defined as follows:
C p ¼p� pref
12rU2
;Cp0 ¼
ffiffiffiffiffiffiffiffiffiffiffiffiffiffiffiffiffiffiffiffiffiffiðCp � C pÞ
2q
: ð10Þ
where pref is the reference pressure located at mid point inspanwise direction of the lowest corner of the inlet boundary.Reference density r is 1.225 kg/m3, and reference velocity U is
r = D/100
(b) mesh near the prism; (c) mesh in the vicinity of the corner.
rodynamic characteristics of a square prism in a uniform flow. J.
ARTICLE IN PRESS
S. Oka, T. Ishihara / J. Wind Eng. Ind. Aerodyn. ] (]]]]) ]]]–]]]4
same as inflow velocity. A mean pressure coefficient is obtainedby calculating time average over non-dimensional time, tU=D,from 100 to 600 at each cell, then average of the cells in spanwisedirection was taken. Similarly, aerodynamic coefficients areobtained.
A stationary condition can be achieved by evaluating relativeerrors of mean drag coefficient and deviations of drag and liftcoefficients, except for mean lift coefficient to avoid divisionby zero. The representative four angles of attack was simulatedwith 600 non-dimensional time period and the first 100 non-dimensional time data were removed to eliminate the transit data.The relative errors decrease with increase in non-dimensionaltime period. For 600 non-dimensional time period, the relativeerror of mean drag coefficient becomes less than 1% and thoseof deviations of drag and lift coefficients remain less than 3% forall cases.
2.6.2. Drag and lift coefficients
The definitions of aerodynamic forces and angle of attack areshown in Fig. 2. As shown in the figure, angle of attack is definedso that front surface of the square prism is normal to the winddirection for a ¼ 01, and clockwise direction denotes a positiveangles of attack. Mean drag coefficient, CD, mean lift coefficient, CL,fluctuating drag coefficient, CD, and fluctuating lift coefficient, CL,are defined as follows.
CD ¼X
i
C piAi cosbi=A;CL ¼X
i
C piAi sinbi=A; ð11Þ
CD0 ¼
ffiffiffiffiffiffiffiffiffiffiffiffiffiffiffiffiffiffiffiffiffiffiffiffiffiffiffiffiffiffiffiffiffiffiffiffiffiffiffiffiffiffiffiffiffiffiffiffiffiffiffiffiffiffiffiffiffiffiffi�Xi
ðCpi � C piÞAi cosbi=A�2
vuut ;CL0
¼
ffiffiffiffiffiffiffiffiffiffiffiffiffiffiffiffiffiffiffiffiffiffiffiffiffiffiffiffiffiffiffiffiffiffiffiffiffiffiffiffiffiffiffiffiffiffiffiffiffiffiffiffiffiffiffiffiffiffiffi�Xi
ðCpi � C piÞAi sinbi=A�2
vuut ð12Þ
where Ai is the area of the ith cell surface. Reference area, A, is aproduct of D and L. bi, is angle between normal to the surfaceof ith cell and wind direction. In this study, contribution ofshear stresses, which is estimated less than 0.2% by testcalculations, are ignored.
αDC
LC
U
pbC
pcC0
1
2
3
Fig. 2. Definitions of aerodynamic forces and angle of attack.
Table 3Experimental conditions.
Side dimension (cm) Reynolds
Nishimura and Taniike 6 4�104
Otsuki et al. 8 6.5�104
Igarashi 3 3.85�10
Please cite this article as: Oka, S., Ishihara, T., Numerical study of aeWind Eng. Ind. Aerodyn. (2009), doi:10.1016/j.jweia.2009.08.006
2.7. Experimental data for validation
In this study, experimental results of previous studies, Otsukiet al. (1978), Igarashi (1984), and Nishimura and Taniike (2000),are utilized for the validations purpose. Table 3 shows thedescriptions of experiment conditions. Nishimura and Tannike’sexperiment was conducted in a well designed wind tunnel test,and satisfied the criteria of wind tunnel testing, such as highReynolds number (410 000) and low blockage (o5%). In addition,this reference provides highly qualified and comprehensivedatabase, including not only mean and fluctuating aerodynamiccoefficients but also surface pressure coefficients, Strouhalnumber, and power spectral.
3. Mean aerodynamics
Mean aerodynamic coefficients are the most important para-meters in evaluation of dynamic response and galloping problems.This section shows performance and accuracy of the presentnumerical approach to simulate mean aerodynamics. First, meanaerodynamic coefficients for a range of angles of attack arepredicted, and the effect of spanwise length is examined. Then,the mean pressures for the representative angles of attack arediscussed to examine the relationship between mean aerody-namic forces and pressures. Finally, mean flow patterns are shownto clarify relationship between flow patterns and vortex forma-tions in the wake.
3.1. Mean aerodynamic coefficients
Fig. 3 shows variations of mean drag and lift coefficientswith angles of attack ranging from a ¼ 01 to 451. The predictedmean drag coefficients moderately decrease with the increase inangle of attack from a ¼ 01 to 121, and takes minimum valuearound a ¼ 141, and then increases with increase in a. Thepredicted mean lift coefficients show negative gradient bet-ween a ¼ 01 and 121 as observed in the experiments. Fromattack angle of a ¼ 141, mean lift coefficients increase withincrease in a, and shows a flat curve in the range, larger thana ¼ 301. The acute change of mean lift coefficients around a ¼ 141,as observed in the experiments, is well captured by the presentnumerical approach.
To give a quantitative assessment of the results, the devi-ations of difference between simulations and experimentsare examined. Assuming the experimental data by Otsukias baseline, shown in Table 4, deviations of predictions aresmaller than those of experiments by Otsuki and Nishimura,indicating that predicted mean aerodynamic coefficients aresatisfactory.
Regarding the effect of spanwise length on mean drag and liftcoefficients, no significant difference is observed for 1D and 6D,thus indicating that 1D spanwise length is fairly good forpredicting mean aerodynamic forces. Further discussion on theeffect of spanwise length on fluctuating aerodynamic coefficientswill be presented in Section 4.1.
number Turbulence intensity (%) Blockage (%)
0.1 1.5
–7.6�104 2 5.44–7.7�104 0.5 20
rodynamic characteristics of a square prism in a uniform flow. J.

ARTICLE IN PRESS
CD CL
NishimuraOtsukietal.present (L=1D)present (L=6D)
Nishimura & TaniikeOtsuki et al.present (L=1D)present (L=6D)
Angle of attack (deg.)
3.0
2.5
2.0
1.5
1.0
0.5
0.0
-0.5
-1.0
-1.5
0 10 20 30 40
Angle of attack (deg.)
0 10 20 30 40
Fig. 3. Variations of mean drag and lift coefficients with angles of attack: (a) mean drag coefficients; (b) mean lift coefficients.
Table 4The deviations of differences between simulations and experiments.
a CD CL
Difference between Otuski
and predictions
Difference between Otuski
and Nishimura
Difference between Otuski
and predictions
Difference between Otuski
and Nishimura
0 0.038 �0.238 0.075 0.092
14 �0.114 �0.199 0.041 0.072
20 �0.125 0.032 �0.043 0.093
45 �0.099 0.066 0.029 0.057
Deviation 0.076 0.156 0.050 0.017
S. Oka, T. Ishihara / J. Wind Eng. Ind. Aerodyn. ] (]]]]) ]]]–]]] 5
3.2. Mean pressure coefficients
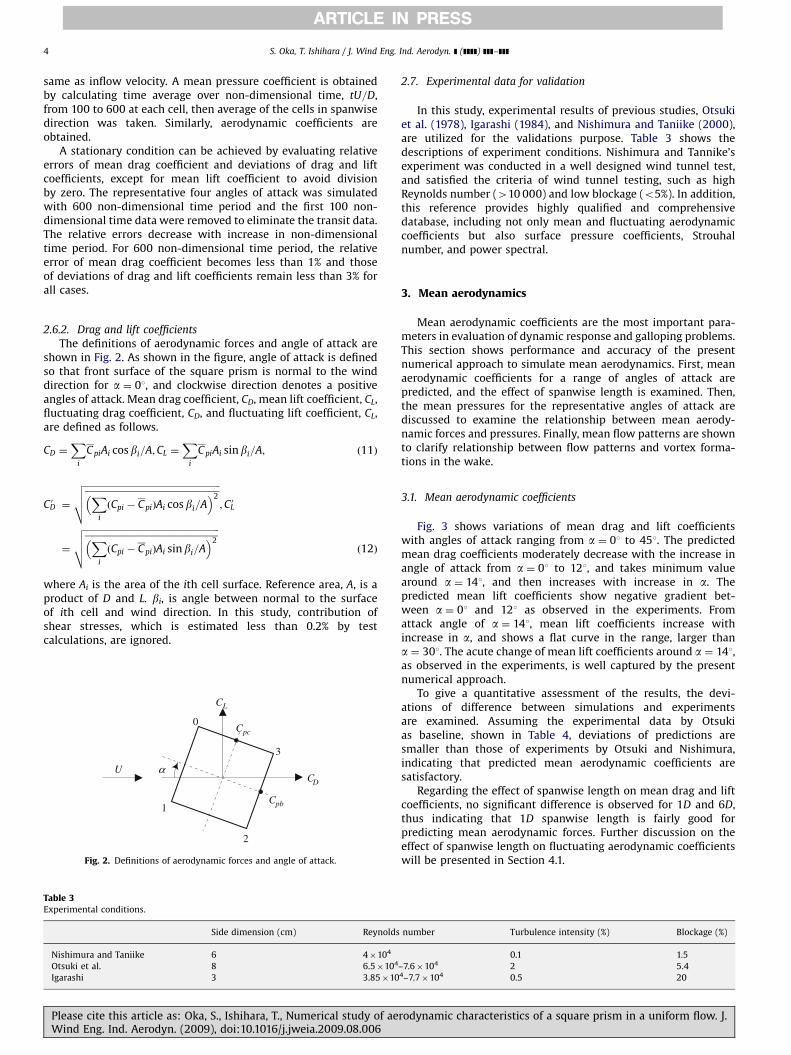
Variations of mean pressures coefficients along the peripheralof square prism with angles attack are shown in Fig. 4. Thepredicted pressure coefficients, at a ¼ 01, are negative on theupper and lower faces which corresponds to the flow pattern ofperfect separation type. Pressure coefficients at the rear face(x/B ¼ 2 to 3) are slightly overestimated compared to thoseobtained by the experiments. This is the reason why predicteddrag coefficients are underestimated compared to Nishimura andTaniike (2000) as presented in the previous section.
Pressure recovery is observed in the vicinity of the trailing edgeof lower face (x/B ¼ 1 to 2) at a ¼ 141 where the intermittentreattachment of flow occurred as shown in Fig. 4(b). The predictedpressure coefficients of lower face before the pressure recoveryregion are smaller than those of a ¼ 01, and matches theexperiment. In contrast to the pressure distributions on the lowerface at a ¼ 01 and 141, a peak in the pressure coefficients ata ¼ 201 can be observed near trailing edge of lower face as shownin Fig. 4(c). It indicates that reattachment of the shear layeroccurred in this region continuously. Fig. 4(d) shows predictedpressure coefficients at a ¼ 451. Front face pressures are in goodagreement with those from the experiment by Nishimura andTaniike (2000) while those of the rear face are slightly under-estimated. This is why the mean drag coefficients at a ¼ 451 areslightly overestimated.
The difference of the forces between front and lower facescontributes negative lift force at a ¼ 141, and is larger than that ata ¼ 201, which results the minimum mean lift coefficient arounda ¼ 141 as shown in Fig. 3(b). On the other hand, the differenceof the forces between upper and lower faces at a ¼ 01 and those
Please cite this article as: Oka, S., Ishihara, T., Numerical study of aeWind Eng. Ind. Aerodyn. (2009), doi:10.1016/j.jweia.2009.08.006
between front plus upper faces and lower plus rear faces ata ¼ 451 are canceled out, resulting the mean lift coefficients thatare nearly zero as shown in Fig. 3(b).
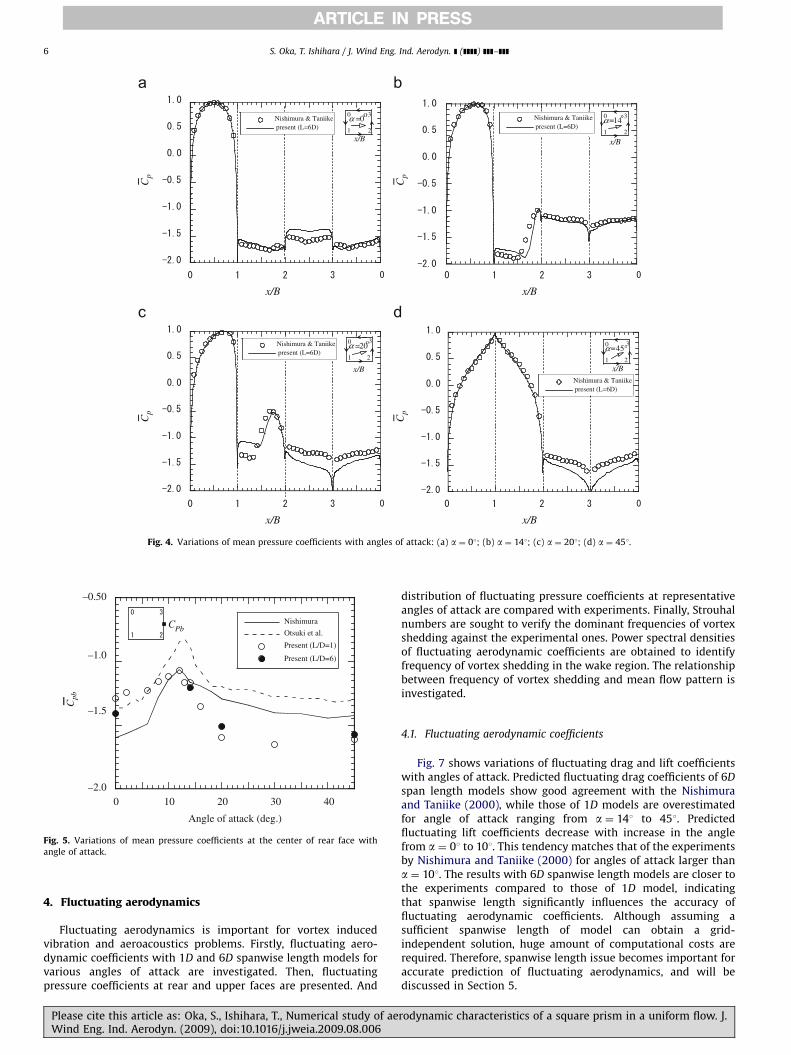
Fig. 5 shows variations of mean pressure coefficients at thecenter of rear face with various angles of attack. Predicted meanpressure coefficients are smaller than those of experiments fora ¼ 201–451 range. The behavior of the shear layer and the cornercurvature of the model might give rise to these underestimations.The corner curvature of the model used in present simulations isD/100, which is the same as that utilized by Tamura et al. (1990).However, no information about the corner curvature ofexperimental model shown in Table 3 is available, which mayresult in discrepancies between experiments and simulations.
3.3. Flow patterns
Fig. 6 shows mean streamlines for representative angles ofattack. Shear layer forms a perfect separation type flow at a ¼ 01where no reattachment of flow to the lower face is observed, andtwo large vortexes are formed in the wake as shown in Fig. 6(a). Ata ¼ 141, separated flow at front edge intermittently reattaches tothe lower face in the vicinity of trailing edge, and a large singlevortex is formed in the wake region as shown in Fig. 6(b). Theshear layer for a ¼ 201 case clearly shows reattachment near thetrailing edge region as shown in Fig. 6(c). The area of separationbubble, generated at front edge of the lower face, becomes smallercompared to that at a ¼ 141, and single vortex is also formed inthe wake region. This implies that the frequencies of vortexshedding at a ¼ 141 and 201 might be different from thoseobtained at a ¼ 01 and 451.
rodynamic characteristics of a square prism in a uniform flow. J.
ARTICLE IN PRESS
Cp
Cp
Cp
Cp
0
1
3
2
α =0o 0
1
3
2
α=14
0
1
3
2
α =20o 0
1
3
2
α=45°
x/B x/B
x/B x/B
x/B
Nishimura & Taniikepresent (L=6D)
Nishimura & Taniikepresent (L=6D)
Nishimura & Taniikepresent (L=6D)
Nishimura & Taniikepresent (L=6D)
x/B
°
x/B
x/B
Fig. 4. Variations of mean pressure coefficients with angles of attack: (a) a ¼ 01; (b) a ¼ 141; (c) a ¼ 201; (d) a ¼ 451.
Cpb
CPb
–0.50
–1.0
–1.5
–2.00 10 20 30 40
Angle of attack (deg.)
Nishimura
Otsuki et al.
Present (L/D=1)
Present (L/D=6)
Fig. 5. Variations of mean pressure coefficients at the center of rear face with
angle of attack.
S. Oka, T. Ishihara / J. Wind Eng. Ind. Aerodyn. ] (]]]]) ]]]–]]]6
4. Fluctuating aerodynamics
Fluctuating aerodynamics is important for vortex inducedvibration and aeroacoustics problems. Firstly, fluctuating aero-dynamic coefficients with 1D and 6D spanwise length models forvarious angles of attack are investigated. Then, fluctuatingpressure coefficients at rear and upper faces are presented. And
Please cite this article as: Oka, S., Ishihara, T., Numerical study of aeWind Eng. Ind. Aerodyn. (2009), doi:10.1016/j.jweia.2009.08.006
distribution of fluctuating pressure coefficients at representativeangles of attack are compared with experiments. Finally, Strouhalnumbers are sought to verify the dominant frequencies of vortexshedding against the experimental ones. Power spectral densitiesof fluctuating aerodynamic coefficients are obtained to identifyfrequency of vortex shedding in the wake region. The relationshipbetween frequency of vortex shedding and mean flow pattern isinvestigated.
4.1. Fluctuating aerodynamic coefficients
Fig. 7 shows variations of fluctuating drag and lift coefficientswith angles of attack. Predicted fluctuating drag coefficients of 6D
span length models show good agreement with the Nishimuraand Taniike (2000), while those of 1D models are overestimatedfor angle of attack ranging from a ¼ 141 to 451. Predictedfluctuating lift coefficients decrease with increase in the anglefrom a ¼ 01 to 101. This tendency matches that of the experimentsby Nishimura and Taniike (2000) for angles of attack larger thana ¼ 101. The results with 6D spanwise length models are closer tothe experiments compared to those of 1D model, indicatingthat spanwise length significantly influences the accuracy offluctuating aerodynamic coefficients. Although assuming asufficient spanwise length of model can obtain a grid-independent solution, huge amount of computational costs arerequired. Therefore, spanwise length issue becomes important foraccurate prediction of fluctuating aerodynamics, and will bediscussed in Section 5.
rodynamic characteristics of a square prism in a uniform flow. J.

ARTICLE IN PRESS
Fig. 6. Variations of mean streamlines with angles of attack: (a) a ¼ 01; (b) a ¼ 141; (c) a ¼ 201; (d) a ¼ 451.
C' D
C' L
Nishimura & TaniikeOtsuki et al.
Angle of attack (deg.)
1.5
1.0
0.5
0.0
1.5
1.0
0.5
0.00 10 20 30 40
Angle of attack (deg.)
0 10 20 30 40
Nishimura & TaniikeOtsuki et al.present (L=1D)present (L=6D)
present (L=1D)present (L=6D)
Fig. 7. Variations of fluctuating coefficients with angles of attack: (a) fluctuating drag coefficients; (b) fluctuating lift coefficients.
C' p
b
C' p
c
C'pb
C'pc
Angle of attack (deg.)
1.0
0.8
0.6
0.4
0.2
0.0
1.0
0.8
0.6
0.4
0.2
0.00 10 20 30 40
Angle of attack (deg.)
0 10 20 30 40
Nishimura & TaniikeOtsuki et al.Igarashipresent (L=6D)
Nishimura & TaniikeOtsuki et al.Igarashipresent (L=6D)
Fig. 8. Variations of fluctuating pressure coefficients with angles of attack: (a) at rear face center; (b) at upper face center.
S. Oka, T. Ishihara / J. Wind Eng. Ind. Aerodyn. ] (]]]]) ]]]–]]] 7
4.2. Fluctuating pressure coefficients
Variations of fluctuating pressure coefficients at rear and upperface centers with change in angles of attack are shown in Fig. 8(a)and (b), and good agreement is found with Igarashi (1984) for allangles of attack. However, these are overestimated compared tothe experiments by Nishimura and Taniike (2000) and Otsukiet al. (1978) at angles larger than a ¼ 201. These discrepancies
Please cite this article as: Oka, S., Ishihara, T., Numerical study of aeWind Eng. Ind. Aerodyn. (2009), doi:10.1016/j.jweia.2009.08.006
may be caused by corner curvature of models and turbulence ofthe incoming inflow.
Fig. 9 shows fluctuating pressure coefficients normalized bythe pressure coefficient of upper face center for the comparison.The predicted fluctuating pressure coefficients are in goodagreement with the Nishimura and Taniike (2000) at a ¼ 01 asshown in Fig. 9(a), except for those at trailing edge of the upperand the lower surfaces where reversed flow reattaches
rodynamic characteristics of a square prism in a uniform flow. J.

ARTICLE IN PRESS
2.0
1.5
1.0
0.5
0.0
0 1 2 3 0
x/B
C' p
/C' p
c
2.0
1.5
1.0
0.5
0.0
0 1 2 3 0
x/B
C' p
/C' p
c
2.0
1.5
1.0
0.5
0.0
0 1 2 3 0
x/B
C' p
/C' p
c
2.0
1.5
1.0
0.5
0.0
0 1 2 3 0
x/B
C' p
/C' p
c
0
1
3
2
α =0°
x/B
0
1
3
2
α =14°
0
1
3
2
α =20° 0
1
3
2
α=45°
Nishimura & Taniikepresent (L=6D)
x/B x/B
x/B
Nishimura & Taniikepresent (L=6D)
Nishimura & Taniikepresent (L=6D)
Nishimura & Taniike
present (L=6D)
Fig. 9. Fluctuating pressure coefficients normalized by the pressure coefficient at upper face center: (a) a ¼ 01; (b) a ¼ 141; (c) a ¼ 201; (d) a ¼ 451.
S t
0.17
0.16
0.15
0.14
0.13
Nishimura & TaniikeOtsuki et al.Igarashipresent (L=6D)present (L=1D)
S. Oka, T. Ishihara / J. Wind Eng. Ind. Aerodyn. ] (]]]]) ]]]–]]]8
intermittently. The difference between prediction and experimentappear near corners 1 and 2 at a ¼ 141. This flow pattern mightbe sensitive to the angle of attack around a ¼ 141 and smalldifference in angle could cause significant change of fluctuatingpressure. At a ¼ 201, predicted fluctuating pressure coefficients atthe lower face as shown in Fig. 9(c), shows a local maximum nearcenter of lower face and takes local minimum value in thedownstream region where reattachments are supposed tooccur continuously. Although the predicted pressure coefficientsat a ¼ 201 are slightly overestimated on the rear face, thepredictions at a ¼ 451 are found in good agreement withexperiment on all faces.
Angle of attack (deg.)
0.12
0.110 10 20 30 40
Fig. 10. Variation of Strouhal number with angles of attack.
4.3. Power spectral of fluctuating aerodynamic forces
It is well known that frequency of vortex shedding of a perfectseparation type flow is closely related to interference betweenseparation shear layer and wake, whereas frequency of vortexshedding of a reattachment type flow is determined by inter-ference between separation shear layer and trailing edge (Igarashi,1984).
Fig. 10 shows variation of Strouhal number, St , with angles ofattack, which is defined by fsD=U and fs is a dominant frequency offluctuating lift force. The predicted Strouhal numbers arequalitatively in good agreement with experiments for both typesof flows, that is, perfect separation and reattachment types. Thesimulated results capture the acute change at a ¼ 141, where the
Please cite this article as: Oka, S., Ishihara, T., Numerical study of aeWind Eng. Ind. Aerodyn. (2009), doi:10.1016/j.jweia.2009.08.006
flow pattern is sensitive to the angle of attack and small differenceof angle could cause significant difference in fluctuating pressureas discussed in previous section. This indicates that the numericalsimulation can quantitatively predict vortex shedding of squareprism for various angles of attack.
Normalized power spectral densities of fluctuating aerody-namic forces have close relationship with vortex formation in the
rodynamic characteristics of a square prism in a uniform flow. J.

ARTICLE IN PRESS
S. Oka, T. Ishihara / J. Wind Eng. Ind. Aerodyn. ] (]]]]) ]]]–]]] 9
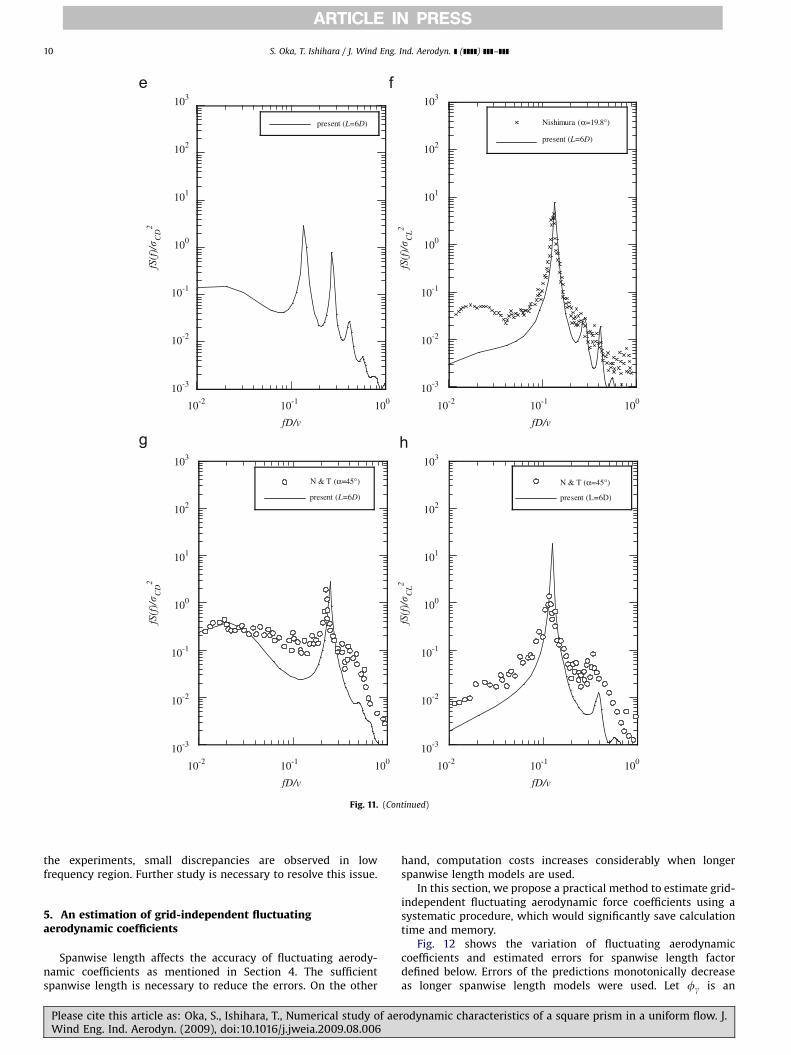
wake. As shown in Fig. 11(a), (b), (g), and (h), the primaryfrequencies of fluctuating drag forces are two times higherthan corresponding fluctuating lift forces at a ¼ 01 and 451, andshow fairly good agreement with Nishimura and Taniike (2000),denoted by open circle, and Nishimura (2001). However, there is amoderate peak for predicted drag that does not exist in themeasured fluctuating drag in the low frequency range for case ofa ¼ 01. Pressure with the vortex may be reflected at the sideboundaries. Alternating vortex shedding from upper and lowerside of the square prism is associated with the primary frequencyof drag that is twice the primary frequency of lift. The drag force
fS(f
)/σ C
D
2
fD/v
10-3
10-2
10-2
10-1
10-1
100
100
101
102
103
fS(f
)/σ C
D
2
fD/v
10-3
10-2
10-2
10-1
10-1
100
100
101
102
103
N & T (α=0°)
present (L=6D)
N & T (α=15°)
present (L=6D)
Fig. 11. Normalized power spectral densities of fluctuating aerodynamic forces: (a) drag
lift coefficients at a ¼ 141; (e) drag coefficients at a ¼ 201; (f) lift coefficients at a ¼ 20
Please cite this article as: Oka, S., Ishihara, T., Numerical study of aeWind Eng. Ind. Aerodyn. (2009), doi:10.1016/j.jweia.2009.08.006
has one maximum and one minimum during the growth andshedding of each vortex, while the sign of the lift force changeswhen vortex is shedding from upper or lower side of square prism.At a ¼ 141 and 201, the primary frequencies of fluctuating dragforces are coincident with those of fluctuating lift forces as shownin Fig. 11(c)–(f). The change of the primary frequency is associatedwith the transition of the flow pattern in the wake region, inwhich the pattern of vortex shedding has changed from alternatevortex shedding to a single large vortex shedding as shown inFig. 6(b) and (c). Though the predicted spectral power densities offluctuating aerodynamic forces are fairly in good agreement with
fS(f
)/σ C
L
2
fD/v
10-3
10-2
10-2
10-1
10-1
100
100
101
102
103
fS(f
)/σ C
L
2
fD/v
10-3
10-2
10-2
10-1
10-1
100
100
101
102
103
N & T (α=0°)
Nishimura (α=0°)
present (L=6D)
N & T (α=15°)
Nishimura (α=14.4°)
present (L=6D)
coefficients at a ¼ 01; (b) lift coefficients at a ¼ 01; (c) drag coefficients a ¼ 141; (d)
1; (g) drag coefficients at a ¼ 451; (h) lift coefficient at a ¼ 451.
rodynamic characteristics of a square prism in a uniform flow. J.
ARTICLE IN PRESS
fS(f
)/� C
D2
fS(f
)/� C
D2
fS(f
)/� C
L2
fS(f
)/� C
L2
fD/v
10-3
10-2
10-2
10-1
10-1
100
100
101
102
103
fD/v
10-3
10-2
10-2
10-1
10-1
100
100
101
102
103
fD/v
10-3
10-2
10-2
10-1
10-1
100
100
101
102
103
fD/v
10-3
10-2
10-2
10-1
10-1
100
100
101
102
103
present (L=6D) Nishimura (α=19.8°)
present (L=6D)
N & T (α=45°)
present (L=6D)
N & T (α=45°)
present (L=6D)
Fig. 11. (Continued)
S. Oka, T. Ishihara / J. Wind Eng. Ind. Aerodyn. ] (]]]]) ]]]–]]]10
the experiments, small discrepancies are observed in lowfrequency region. Further study is necessary to resolve this issue.
5. An estimation of grid-independent fluctuatingaerodynamic coefficients
Spanwise length affects the accuracy of fluctuating aerody-namic coefficients as mentioned in Section 4. The sufficientspanwise length is necessary to reduce the errors. On the other
Please cite this article as: Oka, S., Ishihara, T., Numerical study of aeWind Eng. Ind. Aerodyn. (2009), doi:10.1016/j.jweia.2009.08.006
hand, computation costs increases considerably when longerspanwise length models are used.
In this section, we propose a practical method to estimate grid-independent fluctuating aerodynamic force coefficients using asystematic procedure, which would significantly save calculationtime and memory.
Fig. 12 shows the variation of fluctuating aerodynamiccoefficients and estimated errors for spanwise length factordefined below. Errors of the predictions monotonically decreaseas longer spanwise length models were used. Let fg is an
rodynamic characteristics of a square prism in a uniform flow. J.

ARTICLE IN PRESS
εC'D
Eq.(14)
εC'L
Eq.(14)
estimate-present(C'D)estimate-present(C'L)asymptote
ε C'D
, ε C
'L
C' D
, C
' L
γ
Estimated C'L
Estimated C'D
C'DC'L
1.0
0.0
–0.2
–0.4
0.8
0.6
0.4
0.2
0.01 3 5 7 9
γ0 5 10 15 20
Fig. 12. Variation of fluctuating aerodynamic coefficients and estimated errors with spanwise length factors: (a) fluctuating aerodynamic coefficients; (b) estimated errors.
Table 5Evaluations of cost performance.
(a) Proposed method
(L ¼ 2D, 3D, 4D)
(b) Conventional approach
(L ¼ 20D)
Cost performance (b)/(a) Network
Case 1 9(2, 3, 4) 20 2.2 Ideal condition
Case 2 10.6(2.2, 3.5, 4.9) 42.4 4.0 Gigabit Ethernet
S. Oka, T. Ishihara / J. Wind Eng. Ind. Aerodyn. ] (]]]]) ]]]–]]] 11
aerodynamic coefficient obtained by using a spanwise length,L ¼ gD, where g is the spanwise length factor that is an arbitrarypositive integer other than zero. By defining eg as an error for theresponding spanwise length model, a grid-independent aero-dynamic coefficient, F, is expressed as:
F ¼ fg þ eg; ð13Þ
Suppose that if predicted error monotony decreases as g increases,the prediction error can be approximated by an exponentialfunction.
eg ¼ be�cg; ð14Þ
where c is a decay factor and b is a proportionality coefficient. Thegrid-independent aerodynamic coefficients can be estimated by:
F ¼ fg þ be�cg; ð15Þ
Since the grid-independent aerodynamic coefficients may beexpressed as:
F ¼ fg þ be�cg ¼ fgþ1 þ be�cðgþ1Þ ¼ fgþ2 þ be�cðgþ2Þ; ð16Þ
the b and c may be estimated as follows:
b ¼fgþ1 �fg
1� e�cecg; ð17Þ
c ¼ lnfgþ1 � fg
fgþ2 � fgþ1
: ð18Þ
Similar approach was used in Richardson extrapolation inwhich discretization errors of partial differential equations areestimated using power function (Richardson, 1910; Roache, 1994).The reason why we use exponential function rather than powerfunction employed by Richardson (1910) is that the longer
Please cite this article as: Oka, S., Ishihara, T., Numerical study of aeWind Eng. Ind. Aerodyn. (2009), doi:10.1016/j.jweia.2009.08.006
spanwise length of models, the exponentially smaller theturbulence correlation factor (Wooton and Scruton, 1971).
Estimated fluctuating aerodynamic coefficients for shorterspanwise length models of 2D, 3D, and 4D are used to verify theproposed method as shown in Fig. 12(a). It is noticed thatfluctuating aerodynamic coefficients are plotted closer to theasymptotes as the spanwise length of model increases. Fig. 12(b)shows variation of estimated errors with spanwise length factor.Estimated errors decrease with increase in spanwise length factor.Accuracy obtained by the proposed method is of the same level asthat is obtained by conventional approach in which the spanwiselength of 20D was used, as shown in Fig. 12(b).
When parallel computers and distributed memory were usedfor speeding up the simulation, efficiency of parallel computing isusually reduced with increase in number of processors for a givenmesh. Total efficiency, Etot
n , can be expressed as:
Etotn ¼ Emun
n Eparn Elb
n ; ð19Þ
where, Enumn is numerical efficiency, Epar
n is parallel efficiency, Elbn is
load balancing efficiency, as shown by Ferziger and Peric (2002).The cost performance of a PC cluster with Gigabit Ethernet
used in this study is evaluated by assuming that the numericalefficiency and load balancing efficiency are 1, because a multigridsolver is used and the solution domain is subdivided into the samesize.
Table 5 shows the cost performance of the proposed method.Case 1 shows the cost for ideal condition of the network and case2 shows that of the PC cluster. The cost of the proposed method is1/4 of the conventional approach and the speedup ratio is about8.7 when Gigabit Ethernet Network is used. It should be notedthat the efficiency of parallel computing differs from system to
rodynamic characteristics of a square prism in a uniform flow. J.

ARTICLE IN PRESS
S. Oka, T. Ishihara / J. Wind Eng. Ind. Aerodyn. ] (]]]]) ]]]–]]]12
system, so the cost performance evaluation should be performedfor each system.
6. Conclusions
Aerodynamic characteristics of square prism in a uniform flowwith various angles of attack have been investigated using LES model.Following summarizes the findings and conclusions of this study:
(1)
PlW
The predicted mean aerodynamic coefficients for variousangles of attack show good agreements with experimentsand the peak near the 141 attack angle is well captured. Meanpressure coefficients are in good agreement with experimentsand mean flow patterns closely related to vortex formations inthe wake are well revealed.
(2)
The predicted fluctuating aerodynamic coefficients as well asthe fluctuating pressure coefficients for various angles ofattack are compared with experiments and a satisfactoryagreement is obtained. The predicted Strouhal numbers alsoagree with the experiments and well capture the peak arounda ¼ 141. The primary and secondary frequencies in thepredicted power spectral densities of fluctuating aerodynamicforces coincide with the experiments and match the vortexformations in the wake region.(3)
The spanwise length of computational domain slightlyinfluences mean aerodynamic coefficients whereas it givesstrong impact on fluctuating aerodynamic coefficients. It isfound that the spanwise length of 1D is practically enough forthe predictions of mean values.(4)
A method for estimating grid-independent fluctuating aero-dynamic coefficients is proposed to improve accuracy of thepredicted fluctuation obtained by using smaller spanwise length,which is in turn reduces cost and memory for the simulations. Itis noticed that a numerical model with spanwise length of 4D issufficient for the proposed method, whereas 20D is ideallyrequired for the conventional approach.Acknowledgment
Authors would like to thank Dr. Akihiro Nishimura to providehis valuable experiments data for this study.
References
Bearman, P.W., Obasaju, E.D., 1982. An experimental study of pressure fluctuationson fixed and oscillating square-section cylinders. J. Fluid Mech. 119, 297–321.
ease cite this article as: Oka, S., Ishihara, T., Numerical study of aeind Eng. Ind. Aerodyn. (2009), doi:10.1016/j.jweia.2009.08.006
Bosch, G., Rodi, W., 1998. Simulation of vortex shedding past a square cylinder withdifferent turbulence models. Int. J. Numer. Meth. Fluids 28, 601–616.
Curle, N., 1955. The influence of solid boundaries upon aerodynamic sound. Proc. R.Soc. A 231, 505–514.
Ferziger, J., Peric, M., 2002. Computational Method for Fluid Dynamics, third ed.Springer, Berlin.
Hayashi, K., Ohya, Y., 2000. A numerical study of the flow around a rectangularcylinder with critical depth. In: Proceedings of 16th National Symposium onWind Engineering, pp. 179–184 (in Japanese).
Hirano, H., Maruoka, A., Watanabe, S., 2002. Calculations of aerodynamicproperties of rectangular cylinder with slenderness ratio of 2:1 under variousangles of attack. J. Struct. Eng. 48A, 971–978 (in Japanese).
Igarashi, T., 1984. Characteristics of the flow around a square prism. Bull. JSME 27,231 1858–1865.
Kato, C., Iida, A., Ikegawa, M., 1993. Numerical simulation of aerodynamic soundradiated from low mach number turbulent wakes. AIAA 93-0145.
Lighthill, M.J., 1952. On sound generated aerodynamically; I general theory. Proc. R.Soc. A 211, 564–587.
Ma, X., Karamanos, G.S., Karniadakis, G.E., 2000. Dynamics and low-dimensionalityof a turbulent near wake. J. Fluid Mech. 410, 29–65.
Mizota, T., Okajima, A., 1981. Experimental studies of the mean flows aroundrectangular prisms. Trans. Jpn. Soc. Civ. Eng. 13, 79–81.
Nishimura, A., Taniike, Y., 2000. Fluctuating wind forces of a stationary two dim.square prism. In: Proceedings of 16th National Symposium on WindEngineering, pp. 255–260 (in Japanese).
Nishimura, A., 2001. Fundamental study of bluff body aerodynamics. Ph.D. Thesis,Kyoto University, in Japanese.
Ohya, A., Washizu, K., Fujii, K., Otsuki, Y., 1980. Wind tunnel experiments onaerodynamic forces and pressure distributions of rectangular cylinders in auniform flow (part 2). Proc. Nat. Symp. Wind Eng. , 153–160 (in Japanese).
Otsuki, Y., Fujii, K., Washizu, K., Ohya, A., 1978. Wind tunnel experiments onaerodynamic forces and pressure distributions of rectangular cylinders in auniform flow. In: Proceedings of the Fifth Symposium on Wind Effects onStructures, pp. 169–176 (in Japanese).
Parkinson, G.V., 1971. Wind-induced instability of structure. Philos. Trans. R. Soc.London, Ser. A 269, 395–409.
Richardson, L.F., 1910. The approximate arithmetical solution by finite differencesof physical problems involving differential equations with an application to thestresses in a masonry dam. Trans. R. Soc. London, Ser. A 210, 307–357.
Roache, P.J., 1994. Perspective: a method for uniform reporting of grid refinementstudies. ASME J. Fluid Eng. 116, 405–413.
Rodi, W., 1997. Comparison of LES and RANS calculations of the flow around bluffbodies. J. Wind Eng. Ind. Aerodyn. 69–71, 55–75.
Shimada, K., Ishihara, T., 2001. Application of a modified k–e model to theprediction of aerodynamic characteristics of rectangular cross-section cylin-ders. J. fluids Struc. 16 (4), 465–485.
Shimizu, M., Ishihara, T., Phuc, V., 2004. A wind tunnel study on aerodynamiccharacteristics of ice accreted transmission lines. In: Fifth InternationalColloquim on Bluff Body Aerodynamics and Applications, Summary Papers,pp. 369–372.
Smagorinsky, J., 1963. General circulation experiments with the primitiveequations. I. The basic experiment. Month. Wea. Rev. 91, 99–164.
Tamura, T., Ohta, I., Kuwahara, K., 1990. On the reliability of two-dimensionalsimulation for unsteady flows around a cylinder-type. J. Wind Eng. Ind.Aerodyn. 35, 275–298.
Taylor, I., Vezza, M., 1999. Calculation of the flow field around a square sectioncylinder undergoing forced transverse oscillations using a discrete vortex.J. Wind Eng. Ind. Aerodyn. 82, 271–291.
Vickery, B.J., 1966. Fluctuating lift and drag on a long cylinder of square cross-section in a smooth and in a turbulent stream. J. Fluid Mech. 25, 481–494.
Wooton, L.R., Scruton, C., 1971. Aerodynamic stability. The modern design of wind-sensitive structures, CIRIA seminar.
rodynamic characteristics of a square prism in a uniform flow. J.