ARTICLE IN PRESS - University of Southern...
13
Genome-wide analysis reveals novel genes influencing temporal lobe structure with relevance to neurodegeneration in Alzheimer's disease Jason L. Stein a , Xue Hua a , Jonathan H. Morra a , Suh Lee a , Derrek P. Hibar a , April J. Ho a , Alex D. Leow a,b , Arthur W. Toga a , Jae Hoon Sul c , Hyun Min Kang d , Eleazar Eskin c,e , Andrew J. Saykin f,g , Li Shen f , Tatiana Foroud g , Nathan Pankratz g , Matthew J. Huentelman h , David W. Craig h , Jill D. Gerber h , April N. Allen h , Jason J. Corneveaux h , Dietrich A. Stephan p , Jennifer Webster h , Bryan M. DeChairo i , Steven G. Potkin j , Clifford R. Jack Jr. k , Michael W. Weiner l, m, n,o , Paul M. Thompson a, ⁎ and the Alzheimer's Disease Neuroimaging Initiative 1 a Laboratory of Neuro Imaging, Department of Neurology, UCLA School of Medicine, Neuroscience Research Building 225E, 635 Charles Young Drive, Los Angeles, CA 90095-1769, USA b University of Illinois School of Medicine, Chicago, IL USA, and Community Psychiatry Associates, Sacramento, CA, USA c Department of Computer Science, UCLA, Los Angeles, CA, USA d Department of Biostatistics, University of Michigan, Ann Arbor, Michigan, USA e Department of Human Genetics, UCLA, Los Angeles, CA, USA f Center for Neuroimaging, Department of Radiology and Imaging Sciences, Indiana University School of Medicine, Indianapolis, IN, USA g Department of Medical and Molecular Genetics, Indiana University School of Medicine, Indianapolis, IN, USA h The Translational Genomics Research Institute, Phoenix, AZ, USA i Neuroscience, Molecular Medicine, Pfizer Global R&D, New London, CT, USA j Department of Psychiatry and Human Behavior, University of California, Irvine, Irvine, CA, USA k Mayo Clinic, Rochester, MN, USA l Department of Radiology, UC San Francisco, San Francisco, CA, USA m Department of Medicine, UC San Francisco, San Francisco, CA, USA n Department of Psychiatry, UC San Francisco, San Francisco, CA, USA o Department of Veterans Affairs Medical Center, San Francisco, CA, USA p IGNITE Institute for Individualized Health, Fairfax, VA, USA abstract article info Article history: Received 22 October 2009 Revised 15 January 2010 Accepted 22 February 2010 Available online xxxx In a genome-wide association study of structural brain degeneration, we mapped the 3D profile of temporal lobe volume differences in 742 brain MRI scans of Alzheimer's disease patients, mildly impaired, and healthy elderly subjects. After searching 546,314 genomic markers, 2 single nucleotide polymorphisms (SNPs) were associated with bilateral temporal lobe volume (P b 5×10 −7 ). One SNP, rs10845840, is located in the GRIN2B gene which encodes the N-methyl-D-aspartate (NMDA) glutamate receptor NR2B subunit. This protein – involved in learning and memory, and excitotoxic cell death – has age-dependent prevalence in the synapse and is already a therapeutic target in Alzheimer's disease. Risk alleles for lower temporal lobe volume at this SNP were significantly over-represented in AD and MCI subjects vs. controls (odds ratio = 1.273; P = 0.039) and were associated with mini-mental state exam scores (MMSE; t =−2.114; P = 0.035) demonstrating a negative effect on global cognitive function. Voxelwise maps of genetic association of this SNP with regional brain volumes, revealed intense temporal lobe effects (FDR correction at q = 0.05; critical P = 0.0257). This study uses large-scale brain mapping for gene discovery with implications for Alzheimer's disease. © 2010 Elsevier Inc. All rights reserved. Introduction The quest to identify genes that influence brain integrity or de- generation has been greatly accelerated by large-scale scanning and genotyping of subjects with Alzheimer's disease (AD) and those at risk with amnestic mild cognitive impairment (MCI). Here we developed a high-resolution mapping approach to associate 546,314 genomic markers with regional volumetric differences in the brain MRI scans of NeuroImage xxx (2010) xxx–xxx ⁎ Corresponding author. Fax: +1 310 206 5518. E-mail address: [email protected] (P.M. Thompson). 1 Data used in the preparation of this article were obtained from the Alzheimer's Disease Neuroimaging Initiative (ADNI) database (www.loni.ucla.edu/ADNI). As such, the investigators within the ADNI contributed to the design and implementation of ADNI and/or provided data but did not participate in analysis or writing of this report. ADNI investigators include (complete listing available at http://www.loni.ucla.edu/ ADNI/Collaboration/ADNI_Manuscript_Citations.pdf). YNIMG-07104; No. of pages: 13; 4C: 1053-8119/$ – see front matter © 2010 Elsevier Inc. All rights reserved. doi:10.1016/j.neuroimage.2010.02.068 Contents lists available at ScienceDirect NeuroImage journal homepage: www.elsevier.com/locate/ynimg ARTICLE IN PRESS Please cite this article as: Stein, J.L., et al., Genome-wide analysis reveals novel genes influencing temporal lobe structure with relevance to neurodegeneration in Alzheimer's disease, NeuroImage (2010), doi:10.1016/j.neuroimage.2010.02.068
-
Upload
dangkhuong -
Category
Documents
-
view
218 -
download
4
Transcript of ARTICLE IN PRESS - University of Southern...

NeuroImage xxx (2010) xxx–xxx
YNIMG-07104; No. of pages: 13; 4C:
Contents lists available at ScienceDirect
NeuroImage
j ourna l homepage: www.e lsev ie r.com/ locate /yn img
ARTICLE IN PRESS
Genome-wide analysis reveals novel genes influencing temporal lobe structure withrelevance to neurodegeneration in Alzheimer's disease
Jason L. Stein a, Xue Hua a, Jonathan H. Morra a, Suh Lee a, Derrek P. Hibar a, April J. Ho a, Alex D. Leow a,b,Arthur W. Toga a, Jae Hoon Sul c, Hyun Min Kang d, Eleazar Eskin c,e, Andrew J. Saykin f,g, Li Shen f,Tatiana Foroud g, Nathan Pankratz g, Matthew J. Huentelman h, David W. Craig h, Jill D. Gerber h,April N. Allen h, Jason J. Corneveaux h, Dietrich A. Stephan p, Jennifer Webster h, Bryan M. DeChairo i,Steven G. Potkin j, Clifford R. Jack Jr. k, Michael W. Weiner l,m,n,o, Paul M. Thompson a,⁎and the Alzheimer's Disease Neuroimaging Initiative 1
a Laboratory of Neuro Imaging, Department of Neurology, UCLA School of Medicine, Neuroscience Research Building 225E, 635 Charles Young Drive, Los Angeles, CA 90095-1769, USAb University of Illinois School of Medicine, Chicago, IL USA, and Community Psychiatry Associates, Sacramento, CA, USAc Department of Computer Science, UCLA, Los Angeles, CA, USAd Department of Biostatistics, University of Michigan, Ann Arbor, Michigan, USAe Department of Human Genetics, UCLA, Los Angeles, CA, USAf Center for Neuroimaging, Department of Radiology and Imaging Sciences, Indiana University School of Medicine, Indianapolis, IN, USAg Department of Medical and Molecular Genetics, Indiana University School of Medicine, Indianapolis, IN, USAh The Translational Genomics Research Institute, Phoenix, AZ, USAi Neuroscience, Molecular Medicine, Pfizer Global R&D, New London, CT, USAj Department of Psychiatry and Human Behavior, University of California, Irvine, Irvine, CA, USAkMayo Clinic, Rochester, MN, USAl Department of Radiology, UC San Francisco, San Francisco, CA, USAmDepartment of Medicine, UC San Francisco, San Francisco, CA, USAn Department of Psychiatry, UC San Francisco, San Francisco, CA, USAo Department of Veterans Affairs Medical Center, San Francisco, CA, USAp IGNITE Institute for Individualized Health, Fairfax, VA, USA
⁎ Corresponding author. Fax: +1 310 206 5518.E-mail address: [email protected] (P.M. Thom
1 Data used in the preparation of this article were oDisease Neuroimaging Initiative (ADNI) database (wwwthe investigators within the ADNI contributed to the dADNI and/or provided data but did not participate in anADNI investigators include (complete listing availableADNI/Collaboration/ADNI_Manuscript_Citations.pdf).
1053-8119/$ – see front matter © 2010 Elsevier Inc. Aldoi:10.1016/j.neuroimage.2010.02.068
Please cite this article as: Stein, J.L., et al., Gneurodegeneration in Alzheimer's disease,
a b s t r a c t
a r t i c l e i n f oArticle history:Received 22 October 2009Revised 15 January 2010Accepted 22 February 2010Available online xxxx
In a genome-wide association study of structural brain degeneration, we mapped the 3D profile of temporallobe volume differences in 742 brain MRI scans of Alzheimer's disease patients, mildly impaired, and healthyelderly subjects. After searching 546,314 genomic markers, 2 single nucleotide polymorphisms (SNPs) wereassociated with bilateral temporal lobe volume (Pb5×10−7). One SNP, rs10845840, is located in the GRIN2Bgene which encodes the N-methyl-D-aspartate (NMDA) glutamate receptor NR2B subunit. This protein –
involved in learning and memory, and excitotoxic cell death – has age-dependent prevalence in the synapseand is already a therapeutic target in Alzheimer's disease. Risk alleles for lower temporal lobe volume at thisSNP were significantly over-represented in AD and MCI subjects vs. controls (odds ratio=1.273; P=0.039)and were associated with mini-mental state exam scores (MMSE; t=−2.114; P=0.035) demonstrating anegative effect on global cognitive function. Voxelwise maps of genetic association of this SNP with regionalbrain volumes, revealed intense temporal lobe effects (FDR correction at q=0.05; critical P=0.0257). Thisstudy uses large-scale brain mapping for gene discovery with implications for Alzheimer's disease.
pson).btained from the Alzheimer's.loni.ucla.edu/ADNI). As such,esign and implementation ofalysis or writing of this report.at http://www.loni.ucla.edu/
l rights reserved.
enome-wide analysis reveals novel genes inflNeuroImage (2010), doi:10.1016/j.neuroimag
© 2010 Elsevier Inc. All rights reserved.
Introduction
The quest to identify genes that influence brain integrity or de-generation has been greatly accelerated by large-scale scanning andgenotyping of subjects with Alzheimer's disease (AD) and those at riskwith amnestic mild cognitive impairment (MCI). Here we developed ahigh-resolution mapping approach to associate 546,314 genomicmarkers with regional volumetric differences in the brainMRI scans of
uencing temporal lobe structure with relevance toe.2010.02.068

2 J.L. Stein et al. / NeuroImage xxx (2010) xxx–xxx
ARTICLE IN PRESS
742 subjects. The resulting study is the largest brain mapping to datethat has used genome-wide scans, which we applied to create point-by-point maps of genetic association. We found that lower temporallobe volumes were most associated with a common variant in theglutamate receptor gene, GRIN2B. In addition, this risk allele wasstatistically over-represented in AD and MCI vs. elderly controlsubjects.
Structural brain degeneration is a characteristic of AD and MCI (Duet al., 2001; Apostolova et al., 2007; Thompson et al., 2007), a conditionwith 5-fold increased risk for subsequent development of AD (Petersenet al., 1999; Petersen, 2000). In AD, the hippocampus and entorhinalcortex of the temporal lobes are typically the first structures todegenerate (Braak and Braak, 1991; Thompson et al., 2003). Temporallobe volume differences are detectable on structural brain MRI throughdelineation of the hippocampus (Morra et al., 2009) or by tensor-basedmorphometry (Hua et al., 2008), which plots the 3D profile of volumeloss or gain relative to a template. Lower temporal lobe volume is a wellknown biological marker and risk factor for AD and MCI (Hua et al.,2008), and reflects both cellular atrophy (shrinkage) and overt neuronalloss (Brun and Englund, 1981). In young healthy adults, twin studiesattribute∼50% of the temporal lobe volume variation (Brun et al., 2008)and 40–69% of hippocampal volume variation (Peper et al., 2007) togenetic influences.
Late-onset AD is genetically complex; most likely, many geneswith small effects contribute to the overall disease phenotype (Tanzi,1999; Waring and Rosenberg, 2008). Several genetic variants areknown to increase the risk for late-onset AD including those in the CLUand PICALM genes (Harold et al., 2009; Lambert et al., 2009) and mostnotably the ε4 allele of the APOE gene (Farrer et al., 1997); however,the ε4 allele is found in only around 38% of those with AD (relative to14% of healthy subjects), and these genetic variants do not account forthe full genetic risk for late-onset AD (Farrer et al., 1997; Bertramet al., 2007). Risk alleles for AD have been verified by comparing allelefrequencies of common polymorphisms between AD patients andhealthy controls (Bertram et al., 2007). Here, instead of firstcomparing the incidence of genetic polymorphisms between diag-nostic categories, we ask a distinct but related question: whichcommon genetic polymorphisms influence brain structure in patho-logical aging? Progressive temporal lobe and hippocampal atrophymay mediate the link between genes and behavioral deficits, so anygenes associated with structural degeneration may be a morepowerful way to identify mechanisms of disease onset and cognitivedecline. In addition, the gene products identified may become futuretherapeutic targets.
Prior genome-wide analysis using quantitative traits relevantto disease or brain function has been successful, and will likely helpin better understanding the etiology of these processes. Geneticvariants in the KIBRA gene were identified using association tomemory performance (Papassotiropoulos et al., 2006) and othergenetic variants worthy of further study were implicated throughstudying activation during fMRI tasks of working memory (Potkinet al., 2009a).
In a large-scale genetic analysis of 742 subjects, we set out toidentify common genetic polymorphisms that influence brain struc-ture in the elderly. By enforcing a genome-wide statistical threshold toavoid false positives, and incorporating prior knowledge of geneticmechanisms in biochemical pathways relevant to aging and AD, weidentified 2 regions on the genome that are strongly associated withtemporal lobe structure. The structure-modifying genetic variantswere further assessed by comparing allele frequencies between ADpatients and healthy controls, a common method to validate acandidate risk gene (Bertram et al., 2007). The function of the moststrongly associated gene, already known from prior studies ofglutamate receptors, is highly relevant to learning and memory, andrelates to current therapeutic strategies for AD (i.e., memantine drugtreatment) (Parsons et al., 2007).
Please cite this article as: Stein, J.L., et al., Genome-wide analysis revealneurodegeneration in Alzheimer's disease, NeuroImage (2010), doi:10.
Materials and methods
Sample
Neuroimaging and genetic data were acquired from 818 subjects aspart of the Alzheimer's Disease Neuroimaging Initiative (ADNI), a largefive-year study launched in 2004 by the National Institute on Aging(NIA), the National Institute of Biomedical Imaging and Bioengineering(NIBIB), the Food and Drug Administration (FDA), private pharmaceu-tical companies, and non-profit organizations, as a $60 million, public–private partnership. Thegoal of theADNI study is to determinebiologicalmarkers of Alzheimer's disease through neuroimaging, genetics,neuropsychological tests and other measures in order to develop newtreatments and monitor their effectiveness, and lessen the time ofclinical trials. Subjects were recruited from 58 sites in the United States.The study was conducted according to the Good Clinical Practiceguidelines, the Declaration of Helsinki, and U.S. 21 CFR Part 50 —
Protection ofHumanSubjects, andPart 56— Institutional ReviewBoards.Written informed consent was obtained from all participants beforeprotocol-specific procedures were performed. All data acquired as partof this study are publicly available (http://www.loni.ucla.edu/ADNI/).
All subjects underwent thorough clinical and cognitive assessmentat the time of scan acquisition to determine diagnosis. The mini-mentalstate exam (MMSE) was administered to provide a global measure ofmental status (Cockrell and Folstein, 1988). The clinical dementia rating(CDR) was used to assess dementia severity (Morris, 1993). Healthyvolunteer statuswasdetermined throughMMSE scores between24 and30 (inclusive), a CDR of 0, non-depressed, non-MCI, and non-demented.MCI diagnosis was determined by MMSE scores between 24 and 30(inclusive), a memory complaint, objective memory loss measured byeducation adjusted scores on the Wechsler Memory Scale LogicalMemory II, a CDR of 0.5, absence of significant levels of impairment inother cognitive domains, essentially preserved activities of daily living,and an absence of dementia. Diagnosis of AD was made according toNINCDS-ADRDA criteria for probable AD (McKhann et al., 1984), MMSEscores between 20 and 26 (inclusive), and CDR of 0.5 or 1.0. Definitiveautopsy-based diagnosis of AD was not possible.
DNA isolation and SNP genotyping methods
DNAwas isolated fromB lymphocyte cells taken fromblood (Neitzel,1986) and extracted (Lahiri et al., 1992) using standard procedures.Genomic DNA samples were analyzed on the Human610-QuadBeadChip (Illumina, Inc. San Diego, CA) according to themanufacturer'sprotocols (InfiniumHDAssay; Super Protocol Guide; Rev. A May 2008).Before the initiation of the assay, 50 ng of genomic DNA from eachsample was examined qualitatively on a 1% Tris-acetate-EDTA agarosegel for visual signs of degradation. Any degraded DNA samples wereexcluded from further analysis. Samples were quantitated in triplicatewith PicoGreen® reagent (Invitrogen, Carlsbad, CA) and diluted to50 ng/µl in Tris-EDTA buffer (10 mM Tris, 1 mM EDTA, pH 8.0). 200 ngof DNAwas then denatured, neutralized, and amplified for 22 h at 37 °C(this is termed the MSA1 plate). The MSA1 plate was then fragmentedwith FMS reagent (Illumina) at 37 °C for 1 h and then precipitated with2-propanol and incubated at 4 °C for 30 min. The resulting blueprecipitate was then resuspended in RA1 reagent (Illumina) at 48 °Cfor 1 h. The samples were then denatured (95 °C for 20 min) andimmediately hybridized onto BeadChips at 48 °C for 20 h. BeadChipswere then washed and subjected to single base extension and staining.Finally, the BeadChips were coated with XC4 reagent (Illumina),dessicated, and imaged on the BeadArray Reader (Illumina).
Genetic analysis
Genome-wide genotype information was collected at 620,901markers. Multiple types of genetic variants were genotyped, but only
s novel genes influencing temporal lobe structure with relevance to1016/j.neuroimage.2010.02.068

3J.L. Stein et al. / NeuroImage xxx (2010) xxx–xxx
ARTICLE IN PRESS
Single Nucleotide Polymorphisms (SNPs) were included in thisanalysis. Alleles on the forward strand are reported. Individualmarkers were excluded from the analysis that did not satisfy thefollowing quality criteria based on previous genome-wide associationstudies (Wellcome Trust Case Control Consortium, 2007): genotypecall rate b95% (42,680 SNPs removed), significant deviation fromHardy–Weinberg equilibrium Pb5.7×10−7 (873 markers removed),minor allele frequency b0.01 (60,867 SNPs removed), and a platform-specific recommended quality control score of b0.15 (variablenumber of SNPs removed across subjects). 546,314 SNPs remainedfor analysis after quality control. Association was conducted using thePlink software package (Purcell et al., 2007) (version 1.05; http://pngu.mgh.harvard.edu/purcell/plink/) to conduct a regression ateach SNP with the number of minor alleles, age, and sex as the in-dependent variables and the quantitative phenotype (temporal lobeor hippocampal volume) as the dependent variable, assuming an ad-ditive genetic model.
In addition to a standard regression analysis, a permutation testwas conducted to give P-values corrected for multiple comparisonsacross all the SNPs assessed for potential association. First, the effectsof age and sex were regressed on the phenotype. The residuals of thisregression formed age and sex adjusted phenotypes. Phenotypes (i.e.image data) were randomly swapped between subjects withoutrestriction, and the linear regression analysis without covariates wasperformed again for each marker and the t-statistic of association wassaved. This process was repeated 10,000 times to obtain a non-parametric null distribution for the best SNP. We note that this is quitea conservative approach, as the SNP's P-value is not merely comparedto its own association P-value in null data (which would beappropriate if it was the only SNP examined). Instead, it is comparedwith the best (most strongly associated) SNP's P-value at eachrandomization. To assign a corrected P-value to a SNP, the t-value forassociation when the data were correctly assigned is compared to themaximum of all the permuted statistics at each iteration.
Genes and ESTs in close proximity to significant SNPs werelocalized through the UCSC genome browser (Kent et al., 2002)(http://genome.ucsc.edu/) and are shown in Table 1. Results werevisualized and linkage disequilibrium (LD) patterns with putativecausative mutations in the general population were explored usingHaploview (Barrett et al., 2005) (version 4.1; http://www.broad.mit.edu/mpg/haploview/) using allele frequency information from aEuropean population (CEU) derived from the HapMap project (Frazeret al., 2007) (Release 22; http://www.hapmap.org/). Additionally,gene functions and known associations with disease were reviewedusing the Online Mendelian Inheritance in Man database (OMIM;http://www.ncbi.nlm.nih.gov/sites/entrez?db=omim) and gene on-
Table 1All SNPs surviving the Pb1×10−5 threshold for genome-wide association with temporal lobthreshold are underlined and italicized. Genes are boldedwhen a SNP falls directlywithin themallele, after controlling for age and sex. P-values in parentheses give the association of SNPs whreceptor, ionotropic, N-methyl-D-aspartate 2B; KIAA0743: neurexin 3; ZNF326: zinc finger pro
Chromosome Gene within ±50 kb SNP P-value
Temporal lobe atrophy3p22.1 rs9832461 3.723×10⁻⁶ (1.441×10−
3p22.1 rs1527566 2.323×10⁻⁶ (3.261×10−
3p22.1 rs9878556 2.899×10⁻⁶ (7.988×10−
4p15.1 rs1448284 1.963×10⁻⁶ (1.318×10−
12p13.1 GRIN2B rs11055612 2.809×10⁻⁶ (1.590×10−
12p13.1 GRIN2B rs10845840 1.260×10⁻⁷ (4.033×10−
14q24.3 KIAA0743 rs7155434 7.818×10⁻⁶ (7.945×10−
15q22.2 rs2456930 3.142×10⁻⁷ (1.500×10−
Hippocampal volume1p22.2 ZNF326 rs2813746 1.719×10⁻⁶ (1.054×10−
10p12.33 rs16917919 7.666×10⁻⁶ (8.684×10−
12q23.2 UTP20 rs2290720 2.839×10⁻⁶ (1.463×10−
16q21 rs8056650 1.471×10⁻⁶ (3.167×10−
Please cite this article as: Stein, J.L., et al., Genome-wide analysis revealneurodegeneration in Alzheimer's disease, NeuroImage (2010), doi:10.
tology information from the Entrez Gene (http://www.ncbi.nlm.nih.gov/sites/entrez?db=gene) database.
Within-group permutation to control for effects of diagnostic status
To ensure that diagnosis did not confound the analyses, empiricalP-values were generated using the “–within” flag in Plink. Thispermutation algorithm randomly swaps phenotypes between indivi-duals, but only within specified subgroups — in this case diagnosisgroup (AD, MCI, controls). Any effect of group is then built into thenull (reference) distribution formed by permutation tests. The linearregression analysis without covariates was performed again for eachmarker and the t-statistic for eachmarker was saved. This process wasadaptively repeated to ensure stable P-values (up to 100 millionreplicates). SNPs that proved unlikely to become significant after asmall number of permutations were no longer swapped forcomputational efficiency as high precision for non-associated (high)P-values is not desirable here. The number of times a test statistic metor exceeded the observed test statistic was divided by the totalnumber of permutations performed for that SNP. The effect ofdiagnosis is therefore preserved in each permuted dataset. In thisway, we were able to control for diagnosis in the analyses without theloss of power and multiple testing issues related to analyzing eachgroup separately.
Association controlling for population structure
To control for population substructure, an additional analysis wasperformed which controls for genetic relatedness. First, a kinshipmatrix was estimated from the identity-by-state relationship of eachsubject to each other. A linear mixed effects model was then used toestimate the significance of each SNP to the phenotype of interestcontrolling for any population structure and also controlling for ageand sex according to the formula
y = Xβ + Zu + e ð1Þ
where y is a vector representing the phenotype; X is a matrix of fixedeffects containing the additive genetic effect of a SNP, age, sex, and aconstant term; β is a vector representing thefixed effect regression co-efficients; Z is an identitymatrix; u is the random effect with Var(u)=σ2
gK, where K is the kinship matrix; and e is a matrix of residualeffects with Var(e)=σ2
eI. This analysis was implemented using theEfficient Mixed-Model Association (EMMA; http://mouse.cs.ucla.edu/emma/) (Kang et al., 2008).
e atrophy and hippocampal volumes. The two SNPs that survive genome-wide evidence. MAF is theminor allele frequency.β values give the additive genetic effect from themajoren controlling for diagnostic group using permutations within group. GRIN2B: glutamatetein 326; UTP20: UTP20, small subunit (SSU) processome component, homolog (yeast).
MAF Minor allele Major allele Position β
5) 0.2369 G A 39724597 3765.66) 0.2530 C T 39747455 3757.86) 0.2365 T G 39771730 3794.36) 0.0302 C T 32756050 9939.95) 0.4980 T C 13814595 −3371.67) 0.4416 T C 13822124 −3802.26) 0.2749 C A 77845059 3643.07) 0.3790 A G 60474631 3843.9
5) 0.4550 A C 90312352 148.15) 0.3737 G A 19200035 147.65) 0.4303 A G 100211174 −148.15) 0.0698 A G 58448199 −302.5
s novel genes influencing temporal lobe structure with relevance to1016/j.neuroimage.2010.02.068

4 J.L. Stein et al. / NeuroImage xxx (2010) xxx–xxx
ARTICLE IN PRESS
MRI analysis methods
Three-dimensional T1-weighted baseline brain MRI scans wereanalyzed using tensor-based morphometry (TBM) and an automatedhippocampal recognition algorithm as detailed in previous studies (Huaet al., 2008; Morra et al., 2008). Briefly, high-resolution structural brainMRI scanswere acquired at 58ADNI siteswith 1.5 TMRI scanners using asagittal 3D MP-RAGE sequence developed for consistency across sites(Jack et al., 2008) (TR=2400 ms, TE=1000 ms, flip angle=8°, field ofview=24 cm, final reconstructed voxel resolution=0.9375×0.9375×1.2 mm3). Images were calibrated with phantom-based geometriccorrections to ensure consistency across scanners. Additional imagecorrections included (Jack et al., 2008): (1) correction of geometricdistortions due to gradient nonlinearity, (2) adjustment for imageintensity inhomogeneity due to B1field non-uniformity using calibrationscans, (3) reducing residual intensity homogeneity, and (4) geometricscaling according to a phantom scan acquired for each subject to adjustfor scanner- and session-specific calibration errors. Images were linearlyregistered with 9 parameters to the International Consortium for BrainImaging template (ICBM-53) (Mazziotta et al., 2001) to adjust fordifferences in brain position and scaling.
For TBM analysis, the protocol was identical to that of a prior studyanalyzing the clinical correlates of temporal lobe volume differences(Hua et al., 2008) in a smaller population; since then, genome-widegenotype data was collected. First, a minimal deformation template(MDT) was created for the healthy elderly group to serve as anunbiased average template image to which all other images werewarped using a non-linear inverse-consistent elastic intensity-basedregistration algorithm (Leow et al., 2005; Hua et al., 2008). Volumetrictissue differences were assessed in all individuals by averaging thedeterminant of the Jacobian matrix of deformation in a bilateraltemporal lobe region of interest, manually delineated on the MDT(Fig. 2a). The average of the determinant of the Jacobian matrixmultiplied by the volume of the temporal lobe delineated on thetemplate gives the volume of the temporal lobe in each subject. Thisvolumetric difference relative to a population-based brain templateserved as the temporal lobe volume measure.
For thehippocampal volume analysis, theprotocol is identical to thatof a prior study assessing hippocampal volume (Morra et al., 2008). Twoindependent raters reliably delineated the hippocampus in 21 subjects(7 AD, 7MCI, and 7 healthy elderly). The auto contextmodel, a machinelearning algorithmbasedonAdaBoost (Freundand Schapire, 1997),wasused to create a model based on the most predictive features from theimages in one of the rater's training sets (Morra et al., 2008). Themodelwas thenapplied to all other scans in the sample, generatinga3Doutlineof the hippocampus in the full set of images (Fig. 2b). The averagebilateral hippocampal volume served as the hippocampal volumephenotype. To reduce effects of any segmentation errors on thehippocampal volume estimates, we eliminated some subjects withvolumes in theextreme lowest andhighestpercentiles of the full sample(40 lying more than 2 standard deviations below the mean and 1subjects lying more than 2 standard deviations above the mean).
As expected, the two phenotypes of temporal lobe volume andhippocampal volume were moderately correlated (r2=0.079, P=1.02×10⁻¹³). The quantitative phenotypes are partially dependent,as both hippocampal and temporal lobe volume reduction occur withnormal aging and Alzheimer's disease, but the variance in oneexplained by the other is low.
Results
Population stratification
Population stratification is a known problem in genetic associationanalyses, which can produce false-positive or false-negative results(McCarthy et al., 2008). When multiple subpopulations are present in
Please cite this article as: Stein, J.L., et al., Genome-wide analysis revealneurodegeneration in Alzheimer's disease, NeuroImage (2010), doi:10.
the data (population stratification), spurious associations (or lack ofassociations) can result from allele frequency differences betweenpopulations rather than associations with the phenotype (Lander andSchork, 1994). Self-declared Caucasian (non-Hispanic) subjectsrepresented the vast majority of the genetic data in the Alzheimer'sDisease Neuroimaging Initiative sample (91%), so only these subjects(N=745) were included to reduce population stratification effects. Itis possible that self-declared ethnicity does not match with trueethnicity, and that substructure exists even within the Caucasiangroup. To examine this, multi-dimensional scaling (MDS) was used toproject the identity-by-state (IBS) relationship of each subject inrelation to other subjects to a 2-dimensional space. Substructures inthe data, showing genetically more or less related groups, can then beeasily visualized (Fig. 1). The MDS results showed that all self-identified Caucasians fell within the same genotypic cluster, confirm-ing the self-report and providing evidence for using only Caucasiansubjects to reduce the effects of population stratification (Fig. 1, left).Additionally, the MDS plot identified 2 pairs of subjects as siblingswithin the Caucasian group (Fig. 1, middle) and otherwise showedsome substructure within the data (Fig. 1, right).
Temporal lobe volume in diagnostic groups
Two partially independent phenotypes were analyzed: temporallobe volume and hippocampal volume, each with a slightly differentpopulation sample. Temporal lobe volume was assessed in 173 ADpatients (78 female/95 male; mean age±standard deviation=75.54±7.66), 361 MCI subjects (130 female/231 male; 75.16±7.29), and 208healthy elderly subjects (95 female/113 male; 76.07±4.95). Age wasnot significantly different between groups (F2,739=1.172; P=0.3103),but gender was (χ2(2)=6.787, P=0.0334). Hippocampal volume wasassessed in 162 ADpatients (73 female/89male; 75.17±7.57), 343MCIsubjects (128 female/215 male; 74.94±7.26), and 193 healthy elderly(91 female/102 male; 76.11±4.97). Age was not significantly differentbetween groups (F2,695=1.892; P=0.1516), but there was a trend ingender differences between the groups (χ2(2)=5.810, P=0.0547).
The profile of temporal lobe volume differences was assessed withtensor-based morphometry (TBM; Fig. 2a) which plots, in 3D, thepattern of differences in regional brain volumes, for each brain, relativeto a minimal deformation template (MDT) of healthy elderly subjectsfrom this study (Hua et al., 2008). The volume difference for all voxels ina bilateral temporal lobe region of interest was averaged and used as aquantitative phenotype for genomic association, as a summarymeasureof temporal lobe volume. Hippocampal volume was assessed with anautomated recognition program(Fig. 2b) thatwas trained on 21manualdelineations of the hippocampus by a reliable rater (Morra et al., 2008).The average bilateral hippocampal volume was also used as a quanti-tative phenotype for genomic association.
As expected, an initial comparison of temporal lobe volume betweendiagnostic groups showed significant differences between both AD vs.healthy elderly (mean temporal lobe volume in mm3±s.d. 255,483±13,927vs. 264,405±11,827; t379=−6.76;P=5.19×10⁻¹¹) andMCIvs.healthy elderly (259,501±13,886 vs. 264,405±11,827; t567=−4.27;P=2.22×10⁻⁵). A comparison of hippocampal volume between diag-nostic groups also showed significant differences, as expected, betweenboth AD vs. healthy elderly (mean hippocampal volume in mm3±s.d. 2,713.2±555.4 vs. 3,417.6±531.0; t353=−12.19; P=2.2×10⁻¹⁶)and MCI vs. healthy elderly (3,001.6±574.2 vs. 3,417.6±531.0; t534=−8.27; P=1.1×10⁻¹⁵).
Genome-wide association
Genome-wide association analysis at 546,314 SNPs using temporallobe and hippocampal volume as quantitative phenotypes, aftercontrolling for age and sex, revealed two SNPs that survived thegenome-wide evidence threshold (Wellcome Trust Case Control
s novel genes influencing temporal lobe structure with relevance to1016/j.neuroimage.2010.02.068

Fig. 1. Multi-dimensional scaling shown in three groups of subjects. Each dot represents a subject, and the distance between dots represents overall genetic similarity. Dots closetogether represent genetically more similar subjects. Left: MDS for all subjects genotyped as part of the ADNI dataset. Self-declared Caucasians (blue) group together very closely,whereas non-Caucasians (black) do not. Middle: MDS for Caucasian subjects only. Four outliers are seen which represent two sibling pairs. Right: MDS for Caucasian subjects onlyrandomly excluding one person from each of the two sibling pairs. Some substructure is evident. (For interpretation of the references to color in this figure legend, the reader isreferred to the web version of this article.)
5J.L. Stein et al. / NeuroImage xxx (2010) xxx–xxx
ARTICLE IN PRESS
Consortium, 2007; Sabatti et al., 2009) of Pb5×10−7 (Fig. 3a).Information on SNPs surviving a more liberal threshold of Pb1×10−5
and their closest genes (within ±50 kb) is presented in Table 1.To assess the corrected significance level of these findings, we
constructed a quantile–quantile plot of sorted P-values based on alog10 scale (McCarthy et al., 2008) (Fig. 3b). No inflation of observedvs. expected P-values (black line) was found, as shown through theseplots and by calculation of variance inflation factors (Bacanu et al.,2000), λ, which do not differ greatly from 1 (temporal lobe volumeλ=1.021, hippocampal volume λ=1.013). This demonstrates thatthe data generally follow the null hypothesis of no association and
Fig. 2. Temporal lobe and hippocampal volume measures. (a) An unthresholded color-coded map shows the average percent volume reduction of AD patients (N=173)relative to a standard mean brain image based on identically scanned healthy subjects,in a temporal lobe region of interest overlaid on the population-based template. Herethe temporal lobe is ∼10% smaller in red regions than the average volume in matchedcontrols. The average bilateral temporal lobe volume was used as a quantitativephenotype for the genomic association analysis, prior to fine-scale voxel-based geneticassociation mapping. (b) Automatic delineation of the hippocampus in a representativehealthy elderly subject (the hippocampal boundary is shown in green). The average ofthe left and right hemisphere hippocampal volumes was used as a quantitativephenotype for the genomic association analysis. (For interpretation of the references tocolor in this figure legend, the reader is referred to the web version of this article.)
Please cite this article as: Stein, J.L., et al., Genome-wide analysis revealneurodegeneration in Alzheimer's disease, NeuroImage (2010), doi:10.
only deviate in the far tails of the distribution. Population stratificationis therefore again unlikely to account for the results.
Both SNPs that survived the genome-wide evidence thresholdwere found using the temporal lobe volume phenotype. One SNP,rs10845840 (P=1.260×10⁻⁷), is located on chromosome 12 withinan intron of the GRIN2B gene, which encodes for the regulatorysubunit 2B (NR2B) of the NMDA glutamate receptor. An additionalSNP, rs11055612, strongly associated with the temporal lobe volumephenotype (P=2.809×10⁻⁶) is also located in an intron of theGRIN2B gene and in high LD with rs10845840 (r2=0.872). The otherSNP which survived the genome-wide evidence threshold, rs2456930(P=3.142×10⁻⁷), lies in an intergenic region of chromosome 15.Upon randomly removing two subjects, one from each of the siblingpairs identified above, the results were changed very little and stillsurvived the genome-wide evidence threshold (P=1.715×10⁻⁷ forrs10845840; P=2.191×10⁻⁷ for rs2456930; N=740). Additionally,because some population substructure was identified (Fig. 1, right) ananalysis was conducted using a mixed-model approach that controlsfor genetic relatedness (Kang et al., 2008). The two SNPs identifiedhere remained significant in this analysis (P=1.463×10⁻⁷ forrs10845840; P=3.762×10⁻⁷ for rs2456930; N=742) clearly show-ing that population substructure is not accounting for the results.These findings also survive the genome-wide evidence threshold aftercontrolling for diagnostic group by permuting phenotype valueswithin each of the three diagnostic categories (P=4.033×10⁻⁷ forrs10845840 and P=1.500×10⁻⁷ for rs2456930; N=742). Aftercorrection for multiple comparisons using permutation testing, bothSNPs have trend-level association (corrected P=0.05419 forrs10845840 and corrected P=0.1369 for rs2456930; N=742).
Other genes of interest (Table 1) were identified with both thetemporal lobe volume and hippocampal volume phenotypes at amoreliberal threshold of Pb1×10−5. These genes include RNF220, UTP20,and KIAA0743. RNF220 and UTP20 are largely unstudied, but they fallinto functional groups of metal binding (RNF220) and suppression ofcell proliferation (Schwirzke et al., 1998) (UTP20). KIAA0743 is alsoknown asNRXN3 (neurexin 3) and is involvedwith axon guidance andcell adhesion (Ushkaryov et al., 1992). Additionally, SNP rs1448284 islocated on chromosome 4 within an expressed sequence tag (EST;GenBank accession DA204899) showing expression in the brain(Kimura et al., 2006); however, it is not in LD with any RefSeq(a curated Reference Sequence database) gene. Additional interestingSNPs were identified in intergenic regions which were not close togenes or ESTs.
To determine how the different genotypes of the most associatedSNPs affected brain volumes, boxplots were created for each of theseSNPs (Fig. 4). As expected, an additive genetic effect is clearly evident
s novel genes influencing temporal lobe structure with relevance to1016/j.neuroimage.2010.02.068

Fig. 3.Association of 546,314 SNPs to temporal lobeandhippocampal volume inN=742 andN=698 subjects, respectively. (a) The x-axismoves along eachbase pair of each chromosome(identified in color in the key) and the y-axis gives the−log10 of the P-value for association. The red line corresponds to the genome-wide evidence value of P=5×10⁻⁷; all points abovethis line represent SNPs that are strongly associated with the phenotype. The two SNPs which survive the genome-wide evidence threshold are rs10845840 on chromosome 12 andrs2456930 on chromosome 15. The blue line corresponds to a more liberal threshold identifying genes of interest (P=1×10⁻⁵). (b) A quantile–quantile plot shows the distribution ofP-values in this sample vs. the P-values expected under the null hypothesis of no association (blue dots). The black line and grey shading shows 95% confidence intervals of the expecteddistribution. (For interpretation of the references to color in this figure legend, the reader is referred to the web version of this article.)
6 J.L. Stein et al. / NeuroImage xxx (2010) xxx–xxx
ARTICLE IN PRESS
with the lowest phenotype value resembling a risk genotype (T allelefor rs10845840 and G allele for rs2456930).
Presence of risk alleles in diagnostic groups and association to cognitivetesting
After detecting their effect on brain structure, we tested if theallele frequencies for the two most associated SNPs identified in this
Please cite this article as: Stein, J.L., et al., Genome-wide analysis revealneurodegeneration in Alzheimer's disease, NeuroImage (2010), doi:10.
study were over-represented in impaired vs. healthy subjects (AD andMCI vs. healthy elderly) in all 745 Caucasian (non-Hispanic) subjectswith genomic data. Intriguingly, the adverse genotype of the SNPwithin rs10845840 (in the glutamate receptor GRIN2B gene) wassignificantly over-represented in MCI and AD (χ2=4.242; OR=1.273; P=0.039). The allele frequency of the other SNP, rs2456930,was not significantly different between diagnostic groups (χ2=0.760; OR=0.902; P=0.383). Additionally, MMSE scores were
s novel genes influencing temporal lobe structure with relevance to1016/j.neuroimage.2010.02.068

Fig. 4. Box plots of temporal lobe volume grouped by genotype at most associated SNPs.Box plots show the median value (horizontal line), first and third quartiles (box), 1.5multiplied by the interquartile range (whiskers), and outliers beyond that range (opendots) for each genotype group. Each box plot is in the order homozygous minor allele(TT or AA), heterozygous (TC or AG), homozygous major allele (CC or GG) at each SNP.The frequencies of each genotype are 12.96%, 49.53%, 37.52% for rs2456930, and 18.73%,50.67%, 30.59% for rs10845840. Red numbers show the difference between the meanphenotype value of the higher-volume genotype group vs. themean phenotype value ofeach other genotype group. (For interpretation of the references to color in this figurelegend, the reader is referred to the web version of this article.)
7J.L. Stein et al. / NeuroImage xxx (2010) xxx–xxx
ARTICLE IN PRESS
associated with the adverse genotype of the GRIN2B SNP rs10845840(t=−2.114; P=0.035) showing that risk alleles are associatedwith anegative effect on global cognitive function. However, MMSE scoreswere not associated with rs2456930 (t=−0.3373; P=0.736).
Linkage disequilibrium patterns with putative causative genetic variants
The polymorphisms identified here could serve as proxies forassociation tests to causative SNPs not directly genotyped in thisexperiment. The HapMap database gives the linkage disequilibrium,or correlation between the presence of two alleles in a population, for
Please cite this article as: Stein, J.L., et al., Genome-wide analysis revealneurodegeneration in Alzheimer's disease, NeuroImage (2010), doi:10.
many more SNPs across the genome than were genotyped in thisexperiment. We identified three functional SNPs within the GRIN2Bgene (including adjacent regulatory regions) that were also geno-typed in a European population in the HapMap database. FunctionalSNPs were defined as SNPs in untranslated regions with potential toaffect transcription (3′ or 5′ UTR), SNPs in exons that change theamino acid or prematurely end translation of the protein (coding non-synonymous), and SNPs in splice sites. The SNP in the GRIN2B geneidentified here (rs10845840) had low correlation to three SNPs in the5′ UTR of the GRIN2B gene: rs1805502 (r2=0.0060), rs1805476(r2=0.096), rs890 (r2=0.1). Other functional SNPs exist within theGRIN2B gene but are not available from the HapMap database versionused here (Release 22).
Estimation of sample size needed for replication
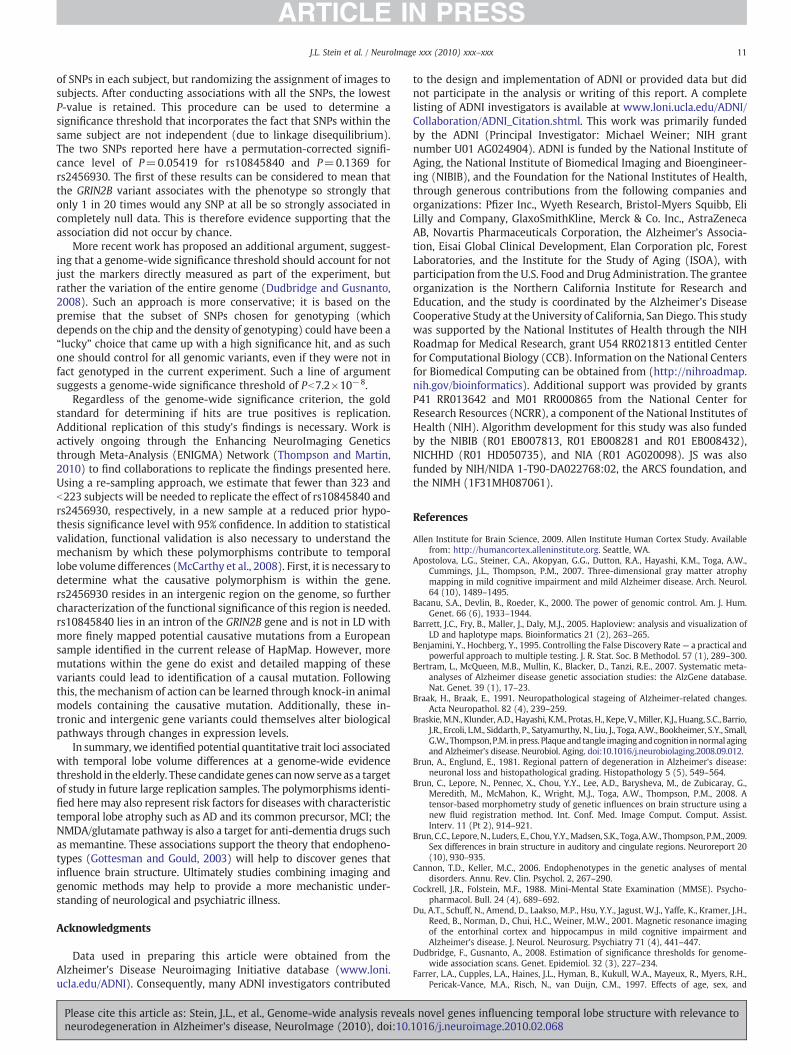
To estimate how many subjects would be needed to replicate thefinding, conditional on the dataset used, that these genetic variantsare associated with temporal lobe structure, we took a resamplingapproach. Three subjects, one from each diagnostic category (AD,MCI,and healthy control), were randomly picked and removed from theanalysis and the P-value for each of the most associated SNPs wascalculated. The process was repeated until no more subjects remainedin the diagnostic category with the least number of subjects (173 ADsubjects). To estimate confidence intervals for this estimate, theresampling was repeated 1000 times. 95% confidence intervals werebased on the 2.5th and 97.5th percentiles of the resampleddistribution (Fig. 5). Fewer than 323 and b223 subjects would berequired to replicate the effect of rs10845840 and rs2456930,respectively, with 95% confidence in a new sample at a significancelevel of Pb0.025 (a nominal Pb0.05, Bonferroni corrected for twoindependent tests). We note that the standard Pb0.05 level ratherthan the genome-wide threshold would be applicable to a replicationsample, as a prior hypothesis regarding the specific gene exists.
Voxel-based genetic mapping localizes the effect of SNP rs10845840within the temporal lobes
The phenotype used initially for the genome-wide search was theoverall bilateral volume of the temporal lobes. This phenotype proveduseful for finding genomic markers highly associated with thetemporal lobe; however, it does not provide the spatial localizationof the SNP's effect on the temporal lobe volume. To further investigatethis, the difference in temporal lobe volume relative to a standardtemplate was assessed at every voxel in the temporal lobe throughTBM, a widely-used method for mapping the 3D profile of brainvolumetric differences in human populations (Hua et al., 2008).Temporal lobe volume differences at each voxel were regressed on thenumber of minor alleles at SNP rs10845840, after adjusting forsimultaneous effects of age, and sex, at all voxels, across all subjects.The P-value of the genetic association to rs10845840 for each voxelwas then plotted, and is shown in Fig. 6. To correct for multiplecomparisons across voxels, a False Discovery Rate (Benjamini andHochberg, 1995; Genovese et al., 2002) correction of q=0.05 wasused to establish a critical P-value threshold of 0.0257. With thisapproach, on average, only 5% of the suprathreshold voxels in amap ofthis kind will be false positives; in other words, it is expected that thevoxel-by-voxel genetic associations are true associations at 95% of thesuprathreshold voxels shown. The SNP has wide ranging effects acrossthe temporal lobe, but the strongest effects are on the bilateraltemporal poles and in the medial temporal lobes, bilaterally.
It is also of interest to know if the genetic association between theGRIN2B glutamate receptor gene variant and brain volumes can befound within each diagnostic group: controls, MCI, and AD patients.We computed 3 separate maps of the genetic association between theGRIN2B glutamate receptor gene variant and brain volumes in healthy
s novel genes influencing temporal lobe structure with relevance to1016/j.neuroimage.2010.02.068

Fig. 5. The minimal number of subjects needed to detect the effect of the most significant SNPs was estimated with a resampling approach. Subjects were randomly removed fromeach of the diagnostic categories until none was left in a category, and the association P-value of the SNP was calculated. This process was repeated 1000 times, to estimate 95%confidence intervals (red lines). The median P-value of the repetitions for each number of subjects removed is shown as the solid black line. The dashed black line represents thegenome-wide evidence level (P=5×10⁻⁷). The dashed blue line represents the replication significance threshold (P=0.025). The dotted blue line shows the estimated minimumsample size that would be required to detect a replication of the finding with 95% confidence (N=323 and b223 for rs10845840 and rs2456930, respectively). The dotted black lineshows the median sample size needed for genome-wide support (N=670 and 706 for rs10845840 and rs2456930, respectively). (For interpretation of the references to color in thisfigure legend, the reader is referred to the web version of this article.)
8 J.L. Stein et al. / NeuroImage xxx (2010) xxx–xxx
ARTICLE IN PRESS
elderly controls, MCI, and AD patients, separately. For all 3 groups, acumulative distribution function plot of the observed P-values in eachof the diagnostic groups is shown in Fig. 7. This figure shows the
Fig. 6. A voxelwise representation of significant influences of the SNP rs10845840, a genetictemporal lobe. Indicated in color are brain regions where volumes are statistically associatedspecific template. Using a convention that is standard in brain mapping, the map was threshosignificant after correction for multiple spatial comparisons, and controls the expected numbat 5% of the total. Z-coordinates in MNI space are shown for each axial slice going from inferiolobes are at the bottom. The images are in radiological convention (left of the image is the rrepresenting more significant influence of the SNP on regional temporal lobe volume. (For inweb version of this article.)
Please cite this article as: Stein, J.L., et al., Genome-wide analysis revealneurodegeneration in Alzheimer's disease, NeuroImage (2010), doi:10.
cumulative distribution of P-values in the temporal lobe (see Fig. 6)for all AD, MCI, and healthy elderly subjects separately. In these plots,the curves that rise more sharply than the reference curve (y=20x)
polymorphism of the glutamate receptor GRIN2B gene, on volumetric differences in thewith variants in the glutamate receptor gene, in 742 subjects, overlaid on a populationlded at an FDR q-value of 0.05 across voxels of the temporal lobe, and the overall map iser of suprathreshold false positive voxels (i.e., voxels where the association is spurious)r to superior every 4 mm. The frontal lobes are at the top of each panel and the occipitalight side of the subject). Significance is shown as − log10(P-value), with warmer colorsterpretation of the references to color in this figure legend, the reader is referred to the
s novel genes influencing temporal lobe structure with relevance to1016/j.neuroimage.2010.02.068

Fig. 7. The cumulative distribution function of P-values in the voxelwise genetic associationmap of SNP rs10845840 (genetic variation in the glutamate receptor)within diagnostic groupsand localization of significance in the MCI group. Left: The diagnostic groups here are distinguished according to the color of the line. The black line represents the threshold that curvesmust cross, to control the false discovery rate at 5%. Themapsof genetic association are considered to be significant in theMCI sample because the curve passes above the y=20xblack line.Thismeans that false positives in themaps of genetic association are likely to be occurring at less than 5% of the suprathreshold voxels shown.Middle and right: The voxelwise associationoverlaid on a subject specific template in both axial (middle; MNI Z-coordinate shown) and coronal (right; MNI X-coordinate shown) views thresholded to only show significant voxels.(For interpretation of the references to color in this figure legend, the reader is referred to the web version of this article.)
9J.L. Stein et al. / NeuroImage xxx (2010) xxx–xxx
ARTICLE IN PRESS
are considered to show significant effects after the conventionalcorrection for multiple spatial comparisons, because they findassociations at a rate that is at least 20 times the rate that would beexpected by chance if all genomic data were null and showed noassociation. As shown, only the MCI group passes the FDR threshold ofq=0.05 with a critical P-value threshold of 0.0053. The MCI groupalso has the greatest number of subjects.
Interactions with apolipoprotein E (APOE) ε4 allele
The ε4 allele of the APOE gene is a well-validated genetic risk factorfor AD (Farrer et al., 1997), and we and others have previously foundthat this allele is associated with temporal lobe atrophy (Hua et al.,2008) and with the rate of hippocampal atrophy (Morra et al., 2009).Excluding all APOE ε2 allele carriers, we tested the additive geneticeffect of carrying an APOE ε4 allele (controlling for age and sex) ontemporal lobe structure using a voxelwise approach. As expected, thiswas significant after correcting for multiple comparisons through FDR(critical P=0.000431; q=0.05; N=619). We then tested whetherthere was a significant interaction between (1) the additive effect ofthe risk allele at SNP rs10845840 in the GRIN2B gene, and (2) theadditive effect of the APOE ε4 allele, in terms of their statistical effecton temporal lobe volume differences. A multiple regression modelpredicting temporal lobe volume differences based on the rs10845840genotype, APOE ε4 genotype, and the interaction of the two(controlling for age and sex) did not survive multiple comparisonscorrection using FDR at q=0.05, suggesting that epistatic interactionsbetween APOE ε4 and GRIN2B do not account for our findings.
Discussion
We have identified here two common polymorphisms that areassociatedwith temporal lobe volumewith genome-wide support in alarge cohort of elderly subjects, assessed with brain imaging andgenome-wide scanning.We also identified several potential candidategenes associated with both temporal lobe and hippocampal volume.We identified one SNPwithin an intergenic region on chromosome 15which is strongly associated with temporal lobe volume. The moststrongly associated polymorphism was within the GRIN2B gene,which encodes the NR2B subunit of the NMDA receptor, and is apromising functional candidate considering the prior evidence of itsinvolvement in learning and memory, structural plasticity of thebrain, and in characteristic features of AD and neurodegeneration,
Please cite this article as: Stein, J.L., et al., Genome-wide analysis revealneurodegeneration in Alzheimer's disease, NeuroImage (2010), doi:10.
including as a therapeutic target receptor. NMDA receptors have longbeen implicated in long-term potentiation, a key process in learningand memory, and over-expression of the GRIN2B glutamate receptorgene enhances learning and memory in mice (Tang et al., 1999).Synaptic plasticity mediated through NMDA receptors also causesstructural remodeling of neurons, which reinforces these connections(Lamprecht and LeDoux, 2004). Pharmaceutical blockade of NMDAreceptor channels can limit cell death induced by excitotoxicity(Kemp and McKernan, 2002; Parsons et al., 2007). In addition, therelative prevalence and location of the NR2B subunit within thesynapse is age-dependent. In early postnatal development, there isgreater prevalence of the NR2B subunit, and its distribution shiftstoward extrasynaptic locations with aging (Yashiro and Philpot,2008).
In addition, we performed fine-scale voxel-by-voxel mapping ofassociations between this genetic polymorphism and brain structure.The genes identified here were found based on gross summaries ofanatomy, and stringent genome-wide evidence. However, we subse-quently used a voxel-based mapping method to assess, at each point inthe brain, the statistical association between rs10845840 and variationsin brain structure. This clarified the anatomical specificity and localiza-tion of the gene effects, revealing strong effects in the bilateral temporalpoles and bilateral medial temporal lobes. In situ hybridization in post-mortem human brain has revealed high expression of GRIN2B mRNAwithin pyramidal cells of the temporal cortex and hippocampus (Schitoet al., 1997; Allen Institute for Brain Science, 2009), consistent with thisSNP having effects in these regions.
These findings may add another piece to the multifactorial geneticpuzzle of late-onset AD. Late-onset AD is hypothesized to be influencedbymany genes, eachwith a relatively small effect (Tanzi, 1999; Waringand Rosenberg, 2008). Difficulties in finding these genesmay arise fromthe heterogeneous nature of the disease, which can lead to groups ofsubjects with the same diagnosis but with different genetic architec-tures. Here, we use a different approach by studying a phenotype that isbiologically based and is strongly associated with the disease. We notethat the risk allele identified in the GRIN2B gene is over-represented inpatientswith AD andMCI. It passes the genome-wide support thresholdfor association with temporal lobe volume deficits, which are a knownrisk factor for AD. The polymorphisms identified here also haverelatively small effect: rs2456930 decreases temporal lobe volume, onaverage, by 1.473% per risk allele, and rs10845840 decreases temporallobe volume by 1.457% per risk allele. Each of these genetic variationsmay contribute somewhat to the as yet unmodeled sources of
s novel genes influencing temporal lobe structure with relevance to1016/j.neuroimage.2010.02.068

10 J.L. Stein et al. / NeuroImage xxx (2010) xxx–xxx
ARTICLE IN PRESS
heritability of Alzheimer's disease beyond the currently accepted riskalleles, such as APOE ε4 (Maher, 2008; McCarthy et al., 2008). Acombined approach of studying genetic risk for AD through diagnosis,neuroimaging and structural endophenotypesmay result in progress indiscovering genetic contributors to late-onset AD.
The image pre-processing conducted here used a 9 parameterlinear registration step that matches the position and scales the size ofeach brain to the MDT. In general, we use 9 parameter registration inour cross-sectional studies of Alzheimer's disease because head sizeand brain size vary so widely across subjects; the temporal lobe tendsto be more vulnerable to atrophy than the rest of the brain, so there isstill substantial residual atrophy in AD vs. controls even afteradjusting for brain size. Because of this, temporal lobe atrophy istypically easier to detect after controlling for overall brain volume,because the effects of wide variations in head size have been largelyremoved. In addition, work by Paling et al. (2004) has advocated theuse of 9 parameter linear registration, especially in multi-site imagingstudies, as it can correct for scanner voxel size variations in largestudies involving multiple sites, scanners, and acquisition sequences,such as this one (these are typically mild and may result in variationsof 1–3% in brain volume, but they add to measurement error).
Even so, as we have noted in our prior studies (Brun et al., 2009),there is however some evidence for non-proportional scaling of brainsubregions relative to the overall size of the brain (Toro et al., 2008).In all stereotaxic studies (e.g., those producing voxelwise maps), thismay confound the interpretation of apparently localized braindifferences between groups. Put another way, the fraction of thebrain that a specific brain substructure is expected to occupy may belarger (or smaller) in a smaller brain. Such an effect can bemodeled byincluding brain volume as a regressor in the scaled Jacobian maps,perhaps after logarithmic transformation of both variables. For a fullanalysis of this effect, please see Jancke et al. (1997), Thompson et al.(2002) and Brun et al. (2009). This power law effect is relevant to allmorphometric studies as regional brain volume is always somewhataffected by the overall size of the brain, and it cannot be ruled out thatSNPs influencing subregional volumes do so because they influencethe overall size of the brain, if the relative volumes of the brainsubstructures follow a (nonlinear) power law.
Hippocampal volumes proved to be a less informative phenotypethan temporal lobe volume. Hippocampal volumes, though widelystudied in a genetic context (Seshadri et al., 2007), are onlymoderately heritable (Peper et al., 2007) most likely due to thelarge environmental influence as the hippocampus is a highly plasticstructure— responsive to individual experiences. Additionally, thoughwe have used new and reliable delineation methods for automaticallydelineating the hippocampus in the MRI scans (Morra et al., 2009), itremains one of themost difficult structures to accurately model due tothe resolution of the MRI scans and the small intensity differencesbetween the structure and surrounding tissue.
One previous genome-wide association study of brain structure(Seshadri et al., 2007) found that SNPs with associations withtemporal brain volume and hippocampal volume, but its power waslimited as it examined related individuals, had few hippocampalvolumes, and low genomic coverage. Those temporal lobe SNPsidentified in the Seshadri study were either not identified or notreplicated here. rs5028798 was not directly genotyped in our sampleand no good proxy in HapMap was identified; rs2143881 was neitherdirectly genotyped in our sample nor in HapMap; rs2793772 was notdirectly genotyped in our sample but was genotyped in HapMap witha good proxy rs1104973 (r2=1) but was not replicated (P=0.6964);rs10497352 was directly genotyped in our sample but was notreplicated (P=0.6476); rs1433527 was directly genotyped in oursample but was not replicated (P=0.9804). Those hippocampal SNPsidentified in the Seshadri study were not identified here. rs9293140and rs1963442 were neither directly genotyped in our sample or inHapMap.
Please cite this article as: Stein, J.L., et al., Genome-wide analysis revealneurodegeneration in Alzheimer's disease, NeuroImage (2010), doi:10.
The sample sizes examined here are extremely large for animaging study (this is one of the largest brain imaging studies to date),but are smaller than other genome-wide association studies that havenot used brain scanning (Wellcome Trust Case Control Consortium,2007). Several factors empower the design. Scans of 742 healthyelderly control, MCI, and AD subjects allowed accurate structuralmeasurements across a broad phenotypic range. The genome-wideanalyses were not split within diagnostic groups as the goal was topresent as broad a phenotypic continuum (Petersen, 2000) aspossible. Though it is possible that diagnostic groups representdistinct genetic backgrounds and may therefore confound theinterpretation of our results, here we operate under the hypothesisthat associations are evident regardless of diagnostic group, but maybe more pronounced in disease (Gottesman and Gould, 2003; Cannonand Keller, 2006). In interpreting findings in this mixed cohort, itcannot be ruled out that the SNP effects are influencing the normalaging process independently of AD pathology. In fact, the SNP effectsmay even be present in young adults, prior to substantial brain aging.Conversely, it cannot be ruled out that such associations are driven bythe presence of different diagnostic categories, and might not befound if only normal subjects were examined. In the future, when thesample sizes are greatly increased as more imaging and genetic dataare collected, it should be possible to further stratify the imagedatabase to understand (1) which specific subpopulations show adetectable SNP effect, and (2) which processes (AD, aging, earlydevelopment, or all of them) are influenced by the SNPs of interest. Atpresent we have a more restricted goal of finding SNPs that influencebrain structure in a mixed cohort of healthy and ill subjects, includingthose with AD and those who are healthy. Treating this cohort as acontinuum is arguably more defensible than (for example) studying amixed cohort of subjects with a Mendelian genetic illness (such asFragile X) and controls. This is because for Alzheimer's disease, acontinuum is arguably evident in that some of cellular processescharacteristic of AD (e.g., increased cerebral amyloid load) aretypically present to some degree in those not yet diagnosed (Braskieet al., in press; Frisoni et al., 2010). For example, healthy elderlysubjects often show some hallmarks of AD pathology at a subclinicallevel (amyloid plaques and tau neurofibrillary tangles) that can bedetected on imaging and negatively correlate with cognitive status(Braskie et al., in press; Small et al., 2009). As such, the effect ofpathology on the SNP associations cannot be disentangled easily byfocusing only on controls, as many harbor pathology at a subclinicallevel. Additionally, the boundary between MCI and AD is based oncognitive tests and observations of daily living that are easy to assessclinically, not biologically based boundaries (Petersen, 2000). Thecontinuum from healthy aging to mild impairment to disease givesthe broadest phenotypic range and therefore the highest power todetect the genetic determinants of brain volume in old age, includingvariants that may have relevance to AD. Therefore splitting betweendiagnostic groups is likely to reduce power through both fewersubjects and a smaller phenotypic range (Cannon and Keller, 2006).Even so, using a permutation algorithm we found that the findingsexist regardless of diagnostic group. Additionally, the use of con-tinuous traits (instead of discrete diagnostic categories) may alsobetter reflect the underlying biology than clinical diagnosis alone(Potkin et al., 2009b).
In this study we used a genome-wide evidence threshold ofPb5×10−7 as in other genome-wide association studies (WellcomeTrust Case Control Consortium, 2007; Sabatti et al., 2009) queryingmultiple phenotypes.We refer in this paper to genome-wide evidenceor support rather than genome-wide significance because there is notyet a universal consensus on how to define an appropriatesignificance threshold. We used permutation testing in which theimaging data is permuted across subjects and all SNPs are tested toestimate the probability that so high a P-value for association couldhave occurred by chance. This is determined by keeping the same set
s novel genes influencing temporal lobe structure with relevance to1016/j.neuroimage.2010.02.068
11J.L. Stein et al. / NeuroImage xxx (2010) xxx–xxx
ARTICLE IN PRESS
of SNPs in each subject, but randomizing the assignment of images tosubjects. After conducting associations with all the SNPs, the lowestP-value is retained. This procedure can be used to determine asignificance threshold that incorporates the fact that SNPs within thesame subject are not independent (due to linkage disequilibrium).The two SNPs reported here have a permutation-corrected signifi-cance level of P=0.05419 for rs10845840 and P=0.1369 forrs2456930. The first of these results can be considered to mean thatthe GRIN2B variant associates with the phenotype so strongly thatonly 1 in 20 times would any SNP at all be so strongly associated incompletely null data. This is therefore evidence supporting that theassociation did not occur by chance.
More recent work has proposed an additional argument, suggest-ing that a genome-wide significance threshold should account for notjust the markers directly measured as part of the experiment, butrather the variation of the entire genome (Dudbridge and Gusnanto,2008). Such an approach is more conservative; it is based on thepremise that the subset of SNPs chosen for genotyping (whichdepends on the chip and the density of genotyping) could have been a“lucky” choice that came up with a high significance hit, and as suchone should control for all genomic variants, even if they were not infact genotyped in the current experiment. Such a line of argumentsuggests a genome-wide significance threshold of Pb7.2×10−8.
Regardless of the genome-wide significance criterion, the goldstandard for determining if hits are true positives is replication.Additional replication of this study's findings is necessary. Work isactively ongoing through the Enhancing NeuroImaging Geneticsthrough Meta-Analysis (ENIGMA) Network (Thompson and Martin,2010) to find collaborations to replicate the findings presented here.Using a re-sampling approach, we estimate that fewer than 323 andb223 subjects will be needed to replicate the effect of rs10845840 andrs2456930, respectively, in a new sample at a reduced prior hypo-thesis significance level with 95% confidence. In addition to statisticalvalidation, functional validation is also necessary to understand themechanism by which these polymorphisms contribute to temporallobe volume differences (McCarthy et al., 2008). First, it is necessary todetermine what the causative polymorphism is within the gene.rs2456930 resides in an intergenic region on the genome, so furthercharacterization of the functional significance of this region is needed.rs10845840 lies in an intron of the GRIN2B gene and is not in LD withmore finely mapped potential causative mutations from a Europeansample identified in the current release of HapMap. However, moremutations within the gene do exist and detailed mapping of thesevariants could lead to identification of a causal mutation. Followingthis, the mechanism of action can be learned through knock-in animalmodels containing the causative mutation. Additionally, these in-tronic and intergenic gene variants could themselves alter biologicalpathways through changes in expression levels.
In summary, we identified potential quantitative trait loci associatedwith temporal lobe volume differences at a genome-wide evidencethreshold in the elderly. These candidate genes cannowserve as a targetof study in future large replication samples. The polymorphisms identi-fied here may also represent risk factors for diseases with characteristictemporal lobe atrophy such as AD and its common precursor, MCI; theNMDA/glutamate pathway is also a target for anti-dementia drugs suchas memantine. These associations support the theory that endopheno-types (Gottesman and Gould, 2003) will help to discover genes thatinfluence brain structure. Ultimately studies combining imaging andgenomic methods may help to provide a more mechanistic under-standing of neurological and psychiatric illness.
Acknowledgments
Data used in preparing this article were obtained from theAlzheimer's Disease Neuroimaging Initiative database (www.loni.ucla.edu/ADNI). Consequently, many ADNI investigators contributed
Please cite this article as: Stein, J.L., et al., Genome-wide analysis revealneurodegeneration in Alzheimer's disease, NeuroImage (2010), doi:10.
to the design and implementation of ADNI or provided data but didnot participate in the analysis or writing of this report. A completelisting of ADNI investigators is available at www.loni.ucla.edu/ADNI/Collaboration/ADNI_Citation.shtml. This work was primarily fundedby the ADNI (Principal Investigator: Michael Weiner; NIH grantnumber U01 AG024904). ADNI is funded by the National Institute ofAging, the National Institute of Biomedical Imaging and Bioengineer-ing (NIBIB), and the Foundation for the National Institutes of Health,through generous contributions from the following companies andorganizations: Pfizer Inc., Wyeth Research, Bristol-Myers Squibb, EliLilly and Company, GlaxoSmithKline, Merck & Co. Inc., AstraZenecaAB, Novartis Pharmaceuticals Corporation, the Alzheimer's Associa-tion, Eisai Global Clinical Development, Elan Corporation plc, ForestLaboratories, and the Institute for the Study of Aging (ISOA), withparticipation from the U.S. Food and Drug Administration. The granteeorganization is the Northern California Institute for Research andEducation, and the study is coordinated by the Alzheimer's DiseaseCooperative Study at the University of California, San Diego. This studywas supported by the National Institutes of Health through the NIHRoadmap for Medical Research, grant U54 RR021813 entitled Centerfor Computational Biology (CCB). Information on the National Centersfor Biomedical Computing can be obtained from (http://nihroadmap.nih.gov/bioinformatics). Additional support was provided by grantsP41 RR013642 and M01 RR000865 from the National Center forResearch Resources (NCRR), a component of the National Institutes ofHealth (NIH). Algorithm development for this study was also fundedby the NIBIB (R01 EB007813, R01 EB008281 and R01 EB008432),NICHHD (R01 HD050735), and NIA (R01 AG020098). JS was alsofunded by NIH/NIDA 1-T90-DA022768:02, the ARCS foundation, andthe NIMH (1F31MH087061).
References
Allen Institute for Brain Science, 2009. Allen Institute Human Cortex Study. Availablefrom: http://humancortex.alleninstitute.org. Seattle, WA.
Apostolova, L.G., Steiner, C.A., Akopyan, G.G., Dutton, R.A., Hayashi, K.M., Toga, A.W.,Cummings, J.L., Thompson, P.M., 2007. Three-dimensional gray matter atrophymapping in mild cognitive impairment and mild Alzheimer disease. Arch. Neurol.64 (10), 1489–1495.
Bacanu, S.A., Devlin, B., Roeder, K., 2000. The power of genomic control. Am. J. Hum.Genet. 66 (6), 1933–1944.
Barrett, J.C., Fry, B., Maller, J., Daly, M.J., 2005. Haploview: analysis and visualization ofLD and haplotype maps. Bioinformatics 21 (2), 263–265.
Benjamini, Y., Hochberg, Y., 1995. Controlling the False Discovery Rate— a practical andpowerful approach to multiple testing. J. R. Stat. Soc. B Methodol. 57 (1), 289–300.
Bertram, L., McQueen, M.B., Mullin, K., Blacker, D., Tanzi, R.E., 2007. Systematic meta-analyses of Alzheimer disease genetic association studies: the AlzGene database.Nat. Genet. 39 (1), 17–23.
Braak, H., Braak, E., 1991. Neuropathological stageing of Alzheimer-related changes.Acta Neuropathol. 82 (4), 239–259.
Braskie,M.N., Klunder, A.D., Hayashi, K.M., Protas, H., Kepe, V.,Miller, K.J., Huang, S.C., Barrio,J.R., Ercoli, L.M., Siddarth, P., Satyamurthy, N., Liu, J., Toga, A.W., Bookheimer, S.Y., Small,G.W., Thompson,P.M. inpress. Plaqueand tangle imagingandcognition innormal agingand Alzheimer's disease. Neurobiol. Aging. doi:10.1016/j.neurobiolaging.2008.09.012.
Brun, A., Englund, E., 1981. Regional pattern of degeneration in Alzheimer's disease:neuronal loss and histopathological grading. Histopathology 5 (5), 549–564.
Brun, C., Lepore, N., Pennec, X., Chou, Y.Y., Lee, A.D., Barysheva, M., de Zubicaray, G.,Meredith, M., McMahon, K., Wright, M.J., Toga, A.W., Thompson, P.M., 2008. Atensor-based morphometry study of genetic influences on brain structure using anew fluid registration method. Int. Conf. Med. Image Comput. Comput. Assist.Interv. 11 (Pt 2), 914–921.
Brun, C.C., Lepore, N., Luders, E., Chou, Y.Y.,Madsen, S.K., Toga, A.W., Thompson, P.M., 2009.Sex differences in brain structure in auditory and cingulate regions. Neuroreport 20(10), 930–935.
Cannon, T.D., Keller, M.C., 2006. Endophenotypes in the genetic analyses of mentaldisorders. Annu. Rev. Clin. Psychol. 2, 267–290.
Cockrell, J.R., Folstein, M.F., 1988. Mini-Mental State Examination (MMSE). Psycho-pharmacol. Bull. 24 (4), 689–692.
Du, A.T., Schuff, N., Amend, D., Laakso, M.P., Hsu, Y.Y., Jagust, W.J., Yaffe, K., Kramer, J.H.,Reed, B., Norman, D., Chui, H.C., Weiner, M.W., 2001. Magnetic resonance imagingof the entorhinal cortex and hippocampus in mild cognitive impairment andAlzheimer's disease. J. Neurol. Neurosurg. Psychiatry 71 (4), 441–447.
Dudbridge, F., Gusnanto, A., 2008. Estimation of significance thresholds for genome-wide association scans. Genet. Epidemiol. 32 (3), 227–234.
Farrer, L.A., Cupples, L.A., Haines, J.L., Hyman, B., Kukull, W.A., Mayeux, R., Myers, R.H.,Pericak-Vance, M.A., Risch, N., van Duijn, C.M., 1997. Effects of age, sex, and
s novel genes influencing temporal lobe structure with relevance to1016/j.neuroimage.2010.02.068

12 J.L. Stein et al. / NeuroImage xxx (2010) xxx–xxx
ARTICLE IN PRESS
ethnicity on the association between apolipoprotein E genotype and Alzheimerdisease. A meta-analysis. APOE and Alzheimer Disease Meta Analysis Consortium.JAMA 278 (16), 1349–1356.
Frazer, K.A., Ballinger, D.G., Cox, D.R., Hinds, D.A., Stuve, L.L., Gibbs, R.A., Belmont, J.W.,Boudreau, A., Hardenbol, P., Leal, S.M., Pasternak, S., Wheeler, D.A., Willis, T.D., Yu,F., Yang, H., Zeng, C., Gao, Y., Hu, H., Hu, W., Li, C., Lin, W., Liu, S., Pan, H., Tang, X.,Wang, J., Wang, W., Yu, J., Zhang, B., Zhang, Q., Zhao, H., Zhou, J., Gabriel, S.B., Barry,R., Blumenstiel, B., Camargo, A., Defelice, M., Faggart, M., Goyette, M., Gupta, S.,Moore, J., Nguyen, H., Onofrio, R.C., Parkin, M., Roy, J., Stahl, E., Winchester, E.,Ziaugra, L., Altshuler, D., Shen, Y., Yao, Z., Huang, W., Chu, X., He, Y., Jin, L., Liu, Y.,Sun, W., Wang, H., Wang, Y., Xiong, X., Xu, L., Waye, M.M., Tsui, S.K., Xue, H., Wong,J.T., Galver, L.M., Fan, J.B., Gunderson, K., Murray, S.S., Oliphant, A.R., Chee, M.S.,Montpetit, A., Chagnon, F., Ferretti, V., Leboeuf, M., Olivier, J.F., Phillips, M.S., Roumy,S., Sallee, C., Verner, A., Hudson, T.J., Kwok, P.Y., Cai, D., Koboldt, D.C., Miller, R.D.,Pawlikowska, L., Taillon-Miller, P., Xiao, M., Tsui, L.C., Mak, W., Song, Y.Q., Tam, P.K.,Nakamura, Y., Kawaguchi, T., Kitamoto, T., Morizono, T., Nagashima, A., Ohnishi, Y.,Sekine, A., Tanaka, T., Tsunoda, T., Deloukas, P., Bird, C.P., Delgado, M., Dermitzakis,E.T., Gwilliam, R., Hunt, S., Morrison, J., Powell, D., Stranger, B.E., Whittaker, P.,Bentley, D.R., Daly, M.J., de Bakker, P.I., Barrett, J., Chretien, Y.R., Maller, J., McCarroll,S., Patterson, N., Pe'er, I., Price, A., Purcell, S., Richter, D.J., Sabeti, P., Saxena, R.,Schaffner, S.F., Sham, P.C., Varilly, P., Stein, L.D., Krishnan, L., Smith, A.V., Tello-Ruiz,M.K., Thorisson, G.A., Chakravarti, A., Chen, P.E., Cutler, D.J., Kashuk, C.S., Lin, S.,Abecasis, G.R., Guan, W., Li, Y., Munro, H.M., Qin, Z.S., Thomas, D.J., McVean, G.,Auton, A., Bottolo, L., Cardin, N., Eyheramendy, S., Freeman, C., Marchini, J., Myers,S., Spencer, C., Stephens, M., Donnelly, P., Cardon, L.R., Clarke, G., Evans, D.M.,Morris, A.P., Weir, B.S., Mullikin, J.C., Sherry, S.T., Feolo, M., Skol, A., Zhang, H.,Matsuda, I., Fukushima, Y., Macer, D.R., Suda, E., Rotimi, C.N., Adebamowo, C.A.,Ajayi, I., Aniagwu, T., Marshall, P.A., Nkwodimmah, C., Royal, C.D., Leppert, M.F.,Dixon, M., Peiffer, A., Qiu, R., Kent, A., Kato, K., Niikawa, N., Adewole, I.F., Knoppers,B.M., Foster, M.W., Clayton, E.W., Watkin, J., Muzny, D., Nazareth, L., Sodergren, E.,Weinstock, G.M., Yakub, I., Birren, B.W., Wilson, R.K., Fulton, L.L., Rogers, J., Burton,J., Carter, N.P., Clee, C.M., Griffiths, M., Jones, M.C., McLay, K., Plumb, R.W., Ross, M.T.,Sims, S.K., Willey, D.L., Chen, Z., Han, H., Kang, L., Godbout, M., Wallenburg, J.C.,L'Archeveque, P., Bellemare, G., Saeki, K., An, D., Fu, H., Li, Q., Wang, Z., Wang, R.,Holden, A.L., Brooks, L.D., McEwen, J.E., Guyer, M.S., Wang, V.O., Peterson, J.L., Shi,M., Spiegel, J., Sung, L.M., Zacharia, L.F., Collins, F.S., Kennedy, K., Jamieson, R.,Stewart, J., 2007. A second generation human haplotype map of over 3.1 millionSNPs. Nature 449 (7164), 851–861.
Freund, Y., Schapire, R.E., 1997. A decision-theoretic generalization of on-line learningand an application to boosting. J. Comput. Sys. Sci. 55 (1), 119–139.
Frisoni, G.B., Fox, N.C., Jack Jr., C.R., Scheltens, P., Thompson, P.M., 2010. The clinical useof structural MRI in Alzheimer's disease. Nat. Rev. Neurol. 6 (2), 67–77.
Genovese, C.R., Lazar, N.A., Nichols, T., 2002. Thresholding of statistical maps in functionalneuroimaging using the false discovery rate. Neuroimage 15 (4), 870–878.
Gottesman, I.I., Gould, T.D., 2003. The endophenotype concept in psychiatry: etymologyand strategic intentions. Am. J. Psychiatry 160 (4), 636–645.
Harold, D., Abraham, R., Hollingworth, P., Sims, R., Gerrish, A., Hamshere, M.L., Pahwa, J.S.,Moskvina, V., Dowzell, K., Williams, A., Jones, N., Thomas, C., Stretton, A., Morgan, A.R.,Lovestone, S., Powell, J., Proitsi, P., Lupton, M.K., Brayne, C., Rubinsztein, D.C., Gill, M.,Lawlor, B., Lynch, A., Morgan, K., Brown, K.S., Passmore, P.A., Craig, D., McGuinness, B.,Todd, S., Holmes, C., Mann, D., Smith, A.D., Love, S., Kehoe, P.G., Hardy, J., Mead, S., Fox,N., Rossor, M., Collinge, J., Maier, W., Jessen, F., Schurmann, B., van den Bussche, H.,Heuser, I., Kornhuber, J., Wiltfang, J., Dichgans, M., Frolich, L., Hampel, H., Hull, M.,Rujescu, D., Goate, A.M., Kauwe, J.S., Cruchaga, C., Nowotny, P., Morris, J.C., Mayo, K.,Sleegers,K., Bettens, K., Engelborghs, S., DeDeyn, P.P., VanBroeckhoven,C., Livingston,G.,Bass, N.J., Gurling, H., McQuillin, A., Gwilliam, R., Deloukas, P., Al-Chalabi, A., Shaw, C.E.,Tsolaki, M., Singleton, A.B., Guerreiro, R., Muhleisen, T.W., Nothen, M.M., Moebus, S.,Jockel, K.H., Klopp, N., Wichmann, H.E., Carrasquillo, M.M., Pankratz, V.S., Younkin, S.G.,Holmans, P.A., O'Donovan, M., Owen, M.J., Williams, J., 2009. Genome-wide associationstudy identifies variants at CLU and PICALM associated with Alzheimer's disease. Nat.Genet. 41 (10), 1088–1093.
Hua, X., Leow, A.D., Parikshak, N., Lee, S., Chiang, M.C., Toga, A.W., Jack Jr., C.R., Weiner, M.W.,Thompson, P.M., 2008. Tensor-based morphometry as a neuroimaging biomarker forAlzheimer's disease: anMRI study of 676 AD, MCI, and normal subjects. Neuroimage 43(3), 458–469.
Jack Jr., C.R., Bernstein, M.A., Fox, N.C., Thompson, P., Alexander, G., Harvey, D.,Borowski, B., Britson, P.J., J.L.W., Ward, C., Dale, A.M., Felmlee, J.P., Gunter, J.L., Hill,D.L., Killiany, R., Schuff, N., Fox-Bosetti, S., Lin, C., Studholme, C., DeCarli, C.S.,Krueger, G., Ward, H.A., Metzger, G.J., Scott, K.T., Mallozzi, R., Blezek, D., Levy, J.,Debbins, J.P., Fleisher, A.S., Albert, M., Green, R., Bartzokis, G., Glover, G., Mugler, J.,Weiner, M.W., 2008. The Alzheimer's Disease Neuroimaging Initiative (ADNI): MRImethods. J. Magn. Reson. Imaging 27 (4), 685–691.
Jancke, L., Staiger, J.F., Schlaug, G., Huang, Y., Steinmetz, H., 1997. The relationshipbetween corpus callosum size and forebrain volume. Cereb. Cortex 7 (1), 48–56.
Kang, H.M., Zaitlen, N.A., Wade, C.M., Kirby, A., Heckerman, D., Daly, M.J., Eskin, E., 2008.Efficient control of population structure in model organism association mapping.Genetics 178 (3), 1709–1723.
Kemp, J.A.,McKernan, R.M., 2002. NMDA receptor pathways as drug targets. Nat. Neurosci.5 (Suppl), 1039–1042.
Kent, W.J., Sugnet, C.W., Furey, T.S., Roskin, K.M., Pringle, T.H., Zahler, A.M., Haussler, D.,2002. The human genome browser at UCSC. Genome Res. 12 (6), 996–1006.
Kimura, K., Wakamatsu, A., Suzuki, Y., Ota, T., Nishikawa, T., Yamashita, R., Yamamoto, J.,Sekine, M., Tsuritani, K., Wakaguri, H., Ishii, S., Sugiyama, T., Saito, K., Isono, Y., Irie,R., Kushida, N., Yoneyama, T., Otsuka, R., Kanda, K., Yokoi, T., Kondo, H., Wagatsuma,M., Murakawa, K., Ishida, S., Ishibashi, T., Takahashi-Fujii, A., Tanase, T., Nagai, K.,Kikuchi, H., Nakai, K., Isogai, T., Sugano, S., 2006. Diversification of transcriptional
Please cite this article as: Stein, J.L., et al., Genome-wide analysis revealneurodegeneration in Alzheimer's disease, NeuroImage (2010), doi:10.
modulation: large-scale identification and characterization of putative alternativepromoters of human genes. Genome Res. 16 (1), 55–65.
Lahiri, D.K., Bye, S., Nurnberger Jr., J.I., Hodes, M.E., Crisp, M., 1992. A non-organic andnon-enzymatic extractionmethod gives higher yields of genomic DNA fromwhole-blood samples than do nine other methods tested. J. Biochem. Biophys. Methods 25(4), 193–205.
Lambert, J.C., Heath, S., Even, G., Campion, D., Sleegers, K., Hiltunen, M., Combarros, O.,Zelenika, D., Bullido, M.J., Tavernier, B., Letenneur, L., Bettens, K., Berr, C., Pasquier,F., Fievet, N., Barberger-Gateau, P., Engelborghs, S., De Deyn, P., Mateo, I., Franck, A.,Helisalmi, S., Porcellini, E., Hanon, O., de Pancorbo, M.M., Lendon, C., Dufouil, C.,Jaillard, C., Leveillard, T., Alvarez, V., Bosco, P., Mancuso, M., Panza, F., Nacmias, B.,Bossu, P., Piccardi, P., Annoni, G., Seripa, D., Galimberti, D., Hannequin, D., Licastro,F., Soininen, H., Ritchie, K., Blanche, H., Dartigues, J.F., Tzourio, C., Gut, I., VanBroeckhoven, C., Alperovitch, A., Lathrop, M., Amouyel, P., 2009. Genome-wideassociation study identifies variants at CLU and CR1 associated with Alzheimer'sdisease. Nat. Genet. 41 (10), 1094–1099.
Lamprecht, R., LeDoux, J., 2004. Structural plasticity and memory. Nat. Rev. Neurosci. 5(1), 45–54.
Lander, E.S., Schork, N.J., 1994. Genetic dissection of complex traits. Science 265 (5181),2037–2048.
Leow, A., Huang, S.C., Geng, A., Becker, J., Davis, S., Toga, A., Thompson, P., 2005. Inverseconsistentmapping in 3Ddeformable image registration: its construction and statisticalproperties. Inf. Process. Med. Imaging 19, 493–503.
Maher, B., 2008. Personal genomes: the case of themissing heritability. Nature 456 (7218),18–21.
Mazziotta, J., Toga, A., Evans, A., Fox, P., Lancaster, J., Zilles, K., Woods, R., Paus, T.,Simpson, G., Pike, B., Holmes, C., Collins, L., Thompson, P., MacDonald, D., Iacoboni,M., Schormann, T., Amunts, K., Palomero-Gallagher, N., Geyer, S., Parsons, L., Narr,K., Kabani, N., Le Goualher, G., Boomsma, D., Cannon, T., Kawashima, R., Mazoyer, B.,2001. A probabilistic atlas and reference system for the human brain: InternationalConsortium for Brain Mapping (ICBM). Philos. Trans. R. Soc. Lond. B Biol. Sci. 356(1412), 1293–1322.
McCarthy,M.I., Abecasis, G.R., Cardon, L.R., Goldstein,D.B., Little, J., Ioannidis, J.P.,Hirschhorn,J.N., 2008. Genome-wide association studies for complex traits: consensus, uncertaintyand challenges. Nat. Rev. Genet. 9 (5), 356–369.
McKhann, G., Drachman, D., Folstein, M., Katzman, R., Price, D., Stadlan, E.M., 1984.Clinical diagnosis of Alzheimer's disease: report of the NINCDS-ADRDA WorkGroup under the auspices of Department of Health and Human Services Task Forceon Alzheimer's Disease. Neurology 34 (7), 939–944.
Morra, J.H., Tu, Z., Apostolova, L.G., Green, A.E., Avedissian, C., Madsen, S.K., Parikshak, N., Hua,X., Toga, A.W., Jack Jr., C.R., Weiner, M.W., Thompson, P.M., 2008. Validation of a fullyautomated 3D hippocampal segmentation method using subjects with Alzheimer'sdisease mild cognitive impairment, and elderly controls. Neuroimage 43 (1), 59–68.
Morra, J.H., Tu, Z., Apostolova, L.G., Green, A.E., Avedissian, C., Madsen, S.K., Parikshak,N., Hua, X., Toga, A.W., Jack Jr., C.R., Schuff, N., Weiner, M.W., Thompson, P.M., 2009.Automated 3D mapping of hippocampal atrophy and its clinical correlates in 400subjects with Alzheimer's disease, mild cognitive impairment, and elderly controls.Hum. Brain Mapp. 30 (9), 2766–2788.
Morris, J.C., 1993. The Clinical Dementia Rating (CDR): current version and scoring rules.Neurology 43 (11), 2412–2414.
Neitzel, H., 1986. A routine method for the establishment of permanent growing lymph-oblastoid cell lines. Hum. Genet. 73 (4), 320–326.
Paling, S.M., Williams, E.D., Barber, R., Burton, E.J., Crum, W.R., Fox, N.C., O'Brien, J.T.,2004. The application of serial MRI analysis techniques to the study of cerebralatrophy in late-onset dementia. Med. Image Anal. 8 (1), 69–79.
Papassotiropoulos, A., Stephan, D.A., Huentelman, M.J., Hoerndli, F.J., Craig, D.W.,Pearson, J.V., Huynh, K.D., Brunner, F., Corneveaux, J., Osborne, D., Wollmer, M.A.,Aerni, A., Coluccia, D., Hanggi, J., Mondadori, C.R., Buchmann, A., Reiman, E.M.,Caselli, R.J., Henke, K., de Quervain, D.J., 2006. Common Kibra alleles are associatedwith human memory performance. Science 314 (5798), 475–478.
Parsons, C.G., Stoffler, A., Danysz, W., 2007. Memantine: a NMDA receptor antagonist thatimproves memory by restoration of homeostasis in the glutamatergic system—toolittle activation is bad, toomuch is evenworse. Neuropharmacology 53 (6), 699–723.
Peper, J.S., Brouwer, R.M., Boomsma, D.I., Kahn, R.S., Hulshoff Pol, H.E., 2007. Geneticinfluences on human brain structure: a review of brain imaging studies in twins.Hum. Brain Mapp. 28 (6), 464–473.
Petersen, R.C., 2000. Aging, mild cognitive impairment, and Alzheimer's disease. Neurol.Clin. 18 (4), 789–806.
Petersen, R.C., Smith, G.E., Waring, S.C., Ivnik, R.J., Tangalos, E.G., Kokmen, E., 1999. Mild cog-nitive impairment: clinical characterization and outcome. Arch. Neurol. 56 (3), 303–308.
Potkin, S.G., Turner, J.A., Fallon, J.A., Lakatos, A., Keator, D.B., Guffanti, G., Macciardi, F.,2009a. Gene discovery through imaging genetics: identification of two novel genesassociated with schizophrenia. Mol. Psychiatry 14 (4), 416–428.
Potkin, S.G., Turner, J.A., Guffanti, G., Lakatos, A., Torri, F., Keator, D.B., Macciardi, F.,2009b. Genome-wide strategies for discovering genetic influences on cognition andcognitive disorders: methodological considerations. Cognit. Neuropsychiatry 14(4–5), 391–418.
Purcell, S.,Neale, B., Todd-Brown,K., Thomas, L., Ferreira,M.A., Bender,D.,Maller, J., Sklar, P., deBakker, P.I., Daly, M.J., Sham, P.C., 2007. PLINK: a tool set for whole-genome associationand population-based linkage analyses. Am. J. Hum. Genet. 81 (3), 559–575.
Sabatti, C., Service, S.K., Hartikainen, A.L., Pouta, A., Ripatti, S., Brodsky, J., Jones, C.G.,Zaitlen, N.A., Varilo, T., Kaakinen, M., Sovio, U., Ruokonen, A., Laitinen, J., Jakkula, E.,Coin, L., Hoggart, C., Collins, A., Turunen, H., Gabriel, S., Elliot, P., McCarthy, M.I.,Daly, M.J., Jarvelin, M.R., Freimer, N.B., Peltonen, L., 2009. Genome-wide associationanalysis of metabolic traits in a birth cohort from a founder population. Nat. Genet.41 (1), 35–46.
s novel genes influencing temporal lobe structure with relevance to1016/j.neuroimage.2010.02.068

13J.L. Stein et al. / NeuroImage xxx (2010) xxx–xxx
ARTICLE IN PRESS
Schito, A.M., Pizzuti, A., Di Maria, E., Schenone, A., Ratti, A., Defferrari, R., Bellone, E.,Mancardi, G.L., Ajmar, F., Mandich, P., 1997. mRNA distribution in adult humanbrain of GRIN2B, a N-methyl-D-aspartate (NMDA) receptor subunit. Neurosci. Lett.239 (1), 49–53.
Schwirzke, M., Gnirke, A., Bork, P., Tarin, D., Weidle, U.H., 1998. Differential geneexpression in mammary carcinoma cell lines: identification of DRIM, a new genedown-regulated in metastasis. Anticancer Res. 18 (3A), 1409–1421.
Seshadri, S., DeStefano, A.L., Au, R., Massaro, J.M., Beiser, A.S., Kelly-Hayes, M., Kase, C.S.,D'Agostino Sr., R.B., Decarli, C., Atwood, L.D., Wolf, P.A., 2007. Genetic correlates ofbrain aging on MRI and cognitive test measures: a genome-wide association andlinkage analysis in the Framingham Study. BMC Med. Genet. 8 (Suppl 1), S15.
Small, G.W., Siddarth, P., Burggren, A.C., Kepe, V., Ercoli, L.M., Miller, K.J., Lavretsky, H.,Thompson, P.M., Cole, G.M., Huang, S.C., Phelps, M.E., Bookheimer, S.Y., Barrio, J.R.,2009. Influence of cognitive status, age, and APOE-4 genetic risk on brain FDDNPpositron-emission tomography imaging in persons without dementia. Arch. Gen.Psychiatry 66 (1), 81–87.
Tang, Y.P., Shimizu, E., Dube,G.R., Rampon, C., Kerchner,G.A., Zhuo,M., Liu, G., Tsien, J.Z., 1999.Genetic enhancement of learning and memory in mice. Nature 401 (6748), 63–69.
Tanzi, R.E., 1999. A genetic dichotomy model for the inheritance of Alzheimer's diseaseand common age-related disorders. J. Clin. Invest. 104 (9), 1175–1179.
Thompson, P.M., Martin, N.G., 2010. The ENIGMA Network. URL: http://enigma.loni.ucla.edu.
Thompson, P.M., Narr, K.L., Blanton, R.E., Toga, A.W., 2002. Mapping structuralalterations of the corpus callosum during brain development and degeneration.In: Zaidel, E., Iacoboni, M. (Eds.), The Parallel Brain: the Cognitive Neuroscience ofthe Corpus Callosum. MIT Press.
Thompson, P.M., Hayashi, K.M., de Zubicaray, G., Janke, A.L., Rose, S.E., Semple, J.,Herman, D., Hong, M.S., Dittmer, S.S., Doddrell, D.M., Toga, A.W., 2003.Dynamics of gray matter loss in Alzheimer's disease. J. Neurosci. 23 (3),994–1005.
Please cite this article as: Stein, J.L., et al., Genome-wide analysis revealneurodegeneration in Alzheimer's disease, NeuroImage (2010), doi:10.
Thompson, P.M., Hayashi, K.M., Dutton, R.A., Chiang, M.C., Leow, A.D., Sowell, E.R., DeZubicaray, G., Becker, J.T., Lopez, O.L., Aizenstein, H.J., Toga, A.W., 2007. TrackingAlzheimer's disease. Ann. N. Y. Acad. Sci. 1097, 183–214.
Toro, R., Perron, M., Pike, B., Richer, L., Veillette, S., Pausova, Z., Paus, T., 2008. Brain sizeand folding of the human cerebral cortex. Cereb. Cortex 18 (10), 2352–2357.
Ushkaryov, Y.A., Petrenko, A.G., Geppert, M., Sudhof, T.C., 1992. Neurexins: synaptic cellsurface proteins related to the alpha-latrotoxin receptor and laminin. Science 257(5066), 50–56.
Waring, S.C., Rosenberg, R.N., 2008. Genome-wide association studies in Alzheimerdisease. Arch. Neurol. 65 (3), 329–334.
Wellcome Trust Case Control Consortium, 2007. Genome-wide association study of 14,000cases of seven commondiseases and 3,000 shared controls. Nature 447 (7145), 661–678.
Yashiro, K., Philpot, B.D., 2008. Regulation of NMDA receptor subunit expression and itsimplications for LTD, LTP, andmetaplasticity. Neuropharmacology 55 (7), 1081–1094.
Glossary
TBM: tensor-based morphometryMDT: minimal deformation templateAD: Alzheimer's diseaseMCI: mild cognitive impairmentADNI: Alzheimer's Disease Neuroimaging InitiativeSNP: single nucleotide polymorphismsNMDA receptor: N-methyl-D-aspartate glutamate receptorLD: linkage disequilibriumOR: odds ratioFDR: false discovery rateEST: expressed sequence tag
s novel genes influencing temporal lobe structure with relevance to1016/j.neuroimage.2010.02.068