ARTICLE IN PRESS - Northwestern University
18
Please cite this article in press as: Farid, S. S. et al., Modelling biopharmaceutical manufacture: Design and implementation of SimBiopharma, Computers and Chemical Engineering (2006), doi:10.1016/j.compchemeng.2006.10.020 ARTICLE IN PRESS +Model CACE-3348; No. of Pages 18 Computers and Chemical Engineering xxx (2006) xxx–xxx Modelling biopharmaceutical manufacture: Design and implementation of SimBiopharma Suzanne S. Farid a,∗ , John Washbrook b , Nigel J. Titchener-Hooker a a The Advanced Centre for Biochemical Engineering, Department of Biochemical Engineering, University College London, Torrington Place, London WC1E 7JE, UK b Department of Computer Science, University College London, Gower Street, London WC1E 6BT, UK Received 7 December 2004; received in revised form 21 July 2006; accepted 12 October 2006 Abstract This paper presents the implementation of a conceptual framework, for modelling a biopharmaceutical manufacturing plant, into a prototype decision-support tool, SimBiopharma. The tool’s scope covers the ability to evaluate manufacturing alternatives in terms of cost, time, yield, resource utilisation and risk. Incorporating uncertainty means that investment appraisal can be based on both the expected outputs and the likelihood of achieving them. A hierarchical approach to represent the key activities in a manufacturing process is introduced. Emphasis is placed on how a closer integration of bioprocess and business process modelling can be achieved by capturing common information in an object-oriented environment, G2 (Gensym Corporation, Cambridge, MA). The key features of SimBiopharma are highlighted; these include interactive graphics, task-oriented representation and dynamic simulation which create a much more flexible environment for modelling processes. Examples of typical outputs generated by SimBiopharma, when addressing the impact of manufacturing options on strategic operational and financial indicators, are given. © 2006 Elsevier Ltd. All rights reserved. Keywords: Object-oriented; Decision-support tool; Computer-aided simulation; Biopharmaceutical batch manufacture; Costs; Uncertainty 1. Introduction As the number of protein therapeutics in clinical evalua- tion continues to rise, more efficient manufacturing strategies are being sought to cope with the increasing demands (Pisano, & Wheelwright, 1995; Byrom, 2000; Kelley, 2001; Chadd & Chamow, 2001). However, selecting an effective manufactur- ing strategy requires exploring the balance between striving for improved operational efficiencies and the subsequent implica- tions on cost, time and risk. Unless the technical and financial aspects are addressed explicitly, a company risks making deci- sions that are not best-suited to achieve all goals. Simulation tools can be used to enhance the understanding of manufactur- ing systems and act as a test bed for their evaluation. The design of such a tool provided the motivation for this research. Historically, attractive returns have made companies empha- sise speed to market rather than focus on improving process ∗ Corresponding author. Tel.: +44 20 7679 4415; fax: +44 20 7209 0703. E-mail address: [email protected] (S.S. Farid). economics (Sadana, & Beelaram, 1994). The financial squeeze on biopharmaceutical companies has triggered renewed interest in manufacturing and its contribution to business performance. Hence, emphasis on estimating and improving manufacturing costs is growing. However, at present no software package allows both process modelling and effective decision-support that relates bioprocess decisions to all the following strategic business issues: costing, resource management and risk. In this paper, a conceptual framework to facilitate the eval- uation of manufacturing alternatives, and its implementation into a software tool, designated SimBiopharma, are presented. The proposed framework aims to bridge the gap between the process and business perspectives of manufacturing, as well as incorporating risk analysis. For the implementation into the decision-making software tool, emphasis is placed on how a closer integration of bioprocess and business process modelling can be achieved by capturing common information in an object- oriented environment. The aim is to provide a platform for rapid evaluation of biopharmaceutical manufacturing alternatives in terms of cost, time, yield, resource utilisation and risk. Consequently the trade-off between financial and operational 0098-1354/$ – see front matter © 2006 Elsevier Ltd. All rights reserved. doi:10.1016/j.compchemeng.2006.10.020
Transcript of ARTICLE IN PRESS - Northwestern University

C
A
duaiGrg©
K
1
ta&Ciitastio
s
0d
ARTICLE IN PRESS+ModelACE-3348; No. of Pages 18
Computers and Chemical Engineering xxx (2006) xxx–xxx
Modelling biopharmaceutical manufacture: Design andimplementation of SimBiopharma
Suzanne S. Farid a,∗, John Washbrook b, Nigel J. Titchener-Hooker a
a The Advanced Centre for Biochemical Engineering, Department of Biochemical Engineering,University College London, Torrington Place, London WC1E 7JE, UK
b Department of Computer Science, University College London, Gower Street, London WC1E 6BT, UK
Received 7 December 2004; received in revised form 21 July 2006; accepted 12 October 2006
bstract
This paper presents the implementation of a conceptual framework, for modelling a biopharmaceutical manufacturing plant, into a prototypeecision-support tool, SimBiopharma. The tool’s scope covers the ability to evaluate manufacturing alternatives in terms of cost, time, yield, resourcetilisation and risk. Incorporating uncertainty means that investment appraisal can be based on both the expected outputs and the likelihood ofchieving them. A hierarchical approach to represent the key activities in a manufacturing process is introduced. Emphasis is placed on how a closerntegration of bioprocess and business process modelling can be achieved by capturing common information in an object-oriented environment,
2 (Gensym Corporation, Cambridge, MA). The key features of SimBiopharma are highlighted; these include interactive graphics, task-orientedepresentation and dynamic simulation which create a much more flexible environment for modelling processes. Examples of typical outputsenerated by SimBiopharma, when addressing the impact of manufacturing options on strategic operational and financial indicators, are given.
2006 Elsevier Ltd. All rights reserved.
; Biop
eoiHcatb
uiTpa
eywords: Object-oriented; Decision-support tool; Computer-aided simulation
. Introduction
As the number of protein therapeutics in clinical evalua-ion continues to rise, more efficient manufacturing strategiesre being sought to cope with the increasing demands (Pisano,
Wheelwright, 1995; Byrom, 2000; Kelley, 2001; Chadd &hamow, 2001). However, selecting an effective manufactur-
ng strategy requires exploring the balance between striving formproved operational efficiencies and the subsequent implica-ions on cost, time and risk. Unless the technical and financialspects are addressed explicitly, a company risks making deci-ions that are not best-suited to achieve all goals. Simulationools can be used to enhance the understanding of manufactur-ng systems and act as a test bed for their evaluation. The design
Please cite this article in press as: Farid, S. S. et al., Modelling biopharmacComputers and Chemical Engineering (2006), doi:10.1016/j.compchemen
f such a tool provided the motivation for this research.Historically, attractive returns have made companies empha-
ise speed to market rather than focus on improving process
∗ Corresponding author. Tel.: +44 20 7679 4415; fax: +44 20 7209 0703.E-mail address: [email protected] (S.S. Farid).
dccoeiC
098-1354/$ – see front matter © 2006 Elsevier Ltd. All rights reserved.oi:10.1016/j.compchemeng.2006.10.020
harmaceutical batch manufacture; Costs; Uncertainty
conomics (Sadana, & Beelaram, 1994). The financial squeezen biopharmaceutical companies has triggered renewed interestn manufacturing and its contribution to business performance.ence, emphasis on estimating and improving manufacturing
osts is growing. However, at present no software packagellows both process modelling and effective decision-supporthat relates bioprocess decisions to all the following strategicusiness issues: costing, resource management and risk.
In this paper, a conceptual framework to facilitate the eval-ation of manufacturing alternatives, and its implementationnto a software tool, designated SimBiopharma, are presented.he proposed framework aims to bridge the gap between therocess and business perspectives of manufacturing, as wells incorporating risk analysis. For the implementation into theecision-making software tool, emphasis is placed on how aloser integration of bioprocess and business process modellingan be achieved by capturing common information in an object-
eutical manufacture: Design and implementation of SimBiopharma,g.2006.10.020
riented environment. The aim is to provide a platform for rapidvaluation of biopharmaceutical manufacturing alternativesn terms of cost, time, yield, resource utilisation and risk.onsequently the trade-off between financial and operational
IN+ModelC
2 emic
prr
2
pdfsd(upt&pmvaAbe2cm(
buptppoirbtscter
tlfpaaoey(a
tiarcaid
3
drdoc
3
t(cisa&thitbder1cbfst
pPdhtduZHs
ARTICLEACE-3348; No. of Pages 18
S.S. Farid et al. / Computers and Ch
arameters can be examined explicitly, the ramifications ofesource delays captured and the impact of uncertainties on theobustness of the solutions can be ascertained.
. Domain description
Prior to commercial manufacture, the production of a bio-harmaceutical drug candidate will be required at several stagesuring its development cycle. Manufacturing issues must there-ore be addressed early in the development process to ensureufficient supplies are produced to the correct standard, enablingeadlines for clinical trials and product launch to be metClemento, 1999; Byrom, 2000; Savage, 2000). Bulk drug man-facture must also support additional critical steps, such asrocess and assay development, stability programs, pre-clinicalesting and registration samples (Clemento, 1999; Bernstein
Hamrell, 2000). Manufacturing decisions are further com-licated by the need to comply with stringent current goodanufacturing practices (cGMP), as well as the unique process
alidation requirements of biotech facilities. These regulationsre critical for controlling the quality and safety of biologics.lthough manufacturers of all drugs must adhere to cGMPs,iologic drugs suffer more serious consequences if failures inngineering and procedural controls occur (Copmann et al.,001). These can lead to contamination or product alteration,ompromising product safety for clinical use. Extensive docu-entation must be provided to comply with these requirements
Gregersen, 1995).Manufacturing of biopharmaceutical products is primarily by
atch processes. As an illustration, one might consider the man-facture of biopharmaceuticals derived from mammalian-basedrocesses. Here each batch is produced by a series of opera-ions that proceed from fermentation (cell culture) through toroduct recovery (e.g. centrifugation, microfiltration) and finallyurification (e.g. chromatography, ultrafiltration), in a trainf vessels. Additional manufacturing operations are involvedndirectly in the production of a batch. These include the prepa-ation of intermediate materials, such as fermentation media anduffer solutions. Equipment used to produce a batch also needo be prepared; examples include cleaning-in-place (CIP) andterilising-in-place (SIP) operations, as well as chromatographyolumn preparation activities. Further support functions includehe essential quality control activities, such as product assays,quipment and process validation, and the documentationequired to complete each batch record for regulatory purposes.
Successful operation of a production facility requires both aechnical understanding of the process and a command of theogistics of operations affecting the business. On the processront, improvements in technical performance, such as higherroduct yields, can be achieved by adapting the sequence of oper-tions, the equipment specifications and operating conditionsnd examining the effects on the properties and compositionf the process and the batch cycle time. On the business front,
Please cite this article in press as: Farid, S. S. et al., Modelling biopharmacComputers and Chemical Engineering (2006), doi:10.1016/j.compchemen
nhancements in the management of operations require an anal-sis of the scheduling of operations, the utilisation of resourcessuch as personnel, equipment, materials and utilities), the over-ll productivity, the cost of goods and profitability. In addition,
fLpe
PRESSal Engineering xxx (2006) xxx–xxx
here are uncertainties in biopharmaceutical manufacture thatmpact on product throughput, costs and delivery time. Thesere associated with factors, such as yields, processing times,esource costs, product demands, contamination rates and suc-ess in clinical trials. A computer-aided tool capable of capturingnd integrating these process and business needs, as well asncorporating risks, can help provide a rational basis for confi-ent decision-making in manufacturing.
. Modelling biopharmaceutical manufacture
In the past, process modelling (e.g. mass balances, plantesign, capacity management) has usually been treated sepa-ately from the modelling of business issues (e.g. investmentecisions, production planning, risk assessment). A briefverview of process and business simulation efforts for biopro-esses is described below.
.1. Process simulation
Computer-aided process simulation has become a standardool to plan, design, optimise and evaluate chemical processesGritsis & Titchener-Hooker, 1989). However, the application ofomputer simulation has been slower in the biopharmaceuticalndustry and the reasons for this have been highlighted byeveral authors (Gritsis, & Titchener-Hooker, 1989; Bogle etl., 1996; Petrides, Calandranis, & Cooney, 1995; Polakovic
Mandenius, 1996; Gosling, 1996). Despite these problems,he potential benefits of computer-aided process design toolsave been gaining increasing recognition in the bioprocessingndustry which is confronted with limited finances and pressingimelines. It is now widely acknowledged that such tools cane used to help reduce process development times by allowingifferent process sequences and operating conditions to bexamined inexpensively via modelling, thus saving time andeducing costly pilot–scale trials (Gritsis, & Titchener-Hooker,989; Petrides, & Sapidou, 1997). The advantage of such aomputer-based tool is that it permits bioprocess decisions toe better placed in the context of business processes and thiseature is gaining increased recognition. The remainder of thisection provides examples of the approaches adopted to addresshese two types of modelling in the bioprocessing industries.
The development of computer-aided design tools for bio-rocessing began in the mid 1980s (Petrides et al., 1995).ublished work in this area indicates that two main routes foreveloping bioprocess simulators have been pursued. The firstas concentrated on adapting existing process simulators fromhe chemical sector (e.g. AspenTech’s BPS). The second haseveloped detailed models of individual unit operations verifiedsing experimental data (e.g. Gritsis, & Titchener-Hooker, 1989;hou, Holwill, & Titchener-Hooker, 1997; Varga, Titchener-ooker, & Dunnill, 2001). In addition there has been work
pecifically targeted at batch processes but primarily developed
eutical manufacture: Design and implementation of SimBiopharma,g.2006.10.020
or chemical process development (e.g. Stephanopoulos, Ali,inninger, & Salomone, 2000). However, little work has beenresented that allows modelling of complete bioprocesses whilstncompassing the process performance as well as the accom-

IN+ModelC
emic
pabTfia
3
MmiCtpTrfiiim&opN
3
n‘sbuiadstdo(w(
4
tbcd
•
•
•
b
•
•
•
5
5
kes1EctTHit
atduoccrpuewfci
beep
ARTICLEACE-3348; No. of Pages 18
S.S. Farid et al. / Computers and Ch
anying capital investment, operating costs, resource utilisationnd uncertainties. This paper investigates the possibility of com-ining process, cost and risk modelling in a single framework.his should permit investment appraisal to be based on bothnancial and operational metrics as well as the likelihood ofchieving certain threshold values.
.2. Cost modelling
The biochemical engineering textbook by Atkinson andavituna (1991) provides complete examples of how to esti-ate the production costs for different traditional processes,
ncluding intracellular enzyme and penicillin production. Datar,artwright, and Rosen (1993) illustrated how the expression sys-
em could have a major impact on the total number of requiredrocessing steps and hence the economic viability of a product.hey compared the costs of producing the recombinant protein,
tPA, in E. coli and CHO cells. Detailed attempts at deriving costsor transgenic expression technologies are also starting to appearn the literature, anticipating ton-scale production of antibod-es (e.g. Mison, & Curling, 2000). The remaining contributionsn the literature tend to focus primarily on the cost of chro-
atographic separations rather than whole processes (e.g. Sofer,Hagel, 1997). In addition to assessing the production costs
f biopharmaceuticals, certain publications have also assessedrofitability using standard discounted cash flow techniques (e.g.ovais, Titchener-Hooker, & Hoare, 2001).
.3. Risk modelling
Traditional process modelling and investment analysis tech-iques assume all outputs occur with certainty and hence they areno-risk’ performance measures. However, manufacturing deci-ions are often made in an uncertain environment characterisedy technical and market-related risks. For example, commonncertainties in manufacturing systems include yields, process-ng times, set-up times and batch failures (Banks, 1998), as wells the amount of investment required, the cost of inputs into pro-uction and product demands. Formal methods of incorporatinguch risks require a subjective assessment of the probability dis-ributions of all the key variables, typically based on historicalata or through soliciting advice from industrial experts. Twof the methods for using this information are ‘risk adjustment’Moilanen, & Martin, 1996) and ‘Monte Carlo simulation’,hich has been used increasingly in various business situations
Hayes, & Wheelwright, 1984).
. Scope of framework
Defining the scope of the modelling effort was a key ini-ial stage required to focus simulation efforts and to ensure thereadth of the analysis was not too wide that it became too
Please cite this article in press as: Farid, S. S. et al., Modelling biopharmacComputers and Chemical Engineering (2006), doi:10.1016/j.compchemen
omplex to handle. The scope of the modelling framework wasefined as follows:
To prototype manufacturing operations in a multi-productbiopharmaceutical facility, operating on a campaign basis,
cimcp
PRESSal Engineering xxx (2006) xxx–xxx 3
To investigate supply-and-demand issues of drugs for clinicaltrials or commercial manufacture,To evaluate manufacturing alternatives in terms of cost, time,yield, resource utilisation and risk.
Manufacturing alternatives that the simulation model shoulde able to address were:
Facility decisions – e.g. the use of a stainless steel versus adisposables-based facility,Process decisions – e.g. the use of expanded bed chromatog-raphy versus conventional product recovery techniques,Capacity decisions – e.g. selecting the optimum downstreamcapacity for a potentially successful new drug.
. Modelling approach
.1. Hierarchical framework
The framework used a hierarchical approach to represent theey activities in a manufacturing process through a series of lev-ls. Such approaches have often been applied to systems in otherectors (Manivannan, 1998; Lakshmanan, & Stephanopoulos,998; Subrahmanyan, Pekny, & Reklaitis, 1996; Puigjaner, &spuna, 1998; Johnsson, & Arzen, 1998). More recently hierar-hical decompositions have also been employed by researcherso represent all the phases of drug development (Karri, Davies,itchener-Hooker, & Washbrook 2001; Rajapakse, Titchener-ooker, & Farid, 2005). The hierarchical framework presented
n this paper focuses specifically on the manufacturing opera-ions.
The hierarchical framework was modular and extensiblellowing further levels of detail to be added as required. Hence,he procedure to manufacture a product could be represented atifferent abstraction levels according to the desired goals of theser. Modelling high-level activities helped provide an overviewf the process and a summary of the key operational and finan-ial parameters. With more information, each high-level activityould be broken down into sub-tasks that generated more accu-ate estimates of the key parameters. The use of sub-tasks alsoermitted parameters, not considered at higher levels (e.g. steamsage), to be modelled. This hierarchical approach to modellingnabled selected activities to be examined in great detail. Thisas a computationally efficient approach and also reflected the
act that process data is often sparse. An example of the hierar-hical levels used to describe product manufacture is illustratedn Fig. 1.
Each manufacturing campaign was composed of a set ofatches to meet the product demand. As indicated in Fig. 1,ach batch was defined by a set of recipes, which interact withach other to produce a single batch. Each recipe comprised arocedure and its resource requirements. Each recipe procedureould then be specified, in a hierarchical structure, in terms of
eutical manufacture: Design and implementation of SimBiopharma,g.2006.10.020
ts unit procedures, and/or operations, and/or phases. Hence, aodel could be considered complete at any level of the hierar-
hical framework; the level of detail adopted is dictated by theurpose of the simulation and the information available.

ARTICLE IN PRESS+ModelCACE-3348; No. of Pages 18
4 S.S. Farid et al. / Computers and Chemical Engineering xxx (2006) xxx–xxx
F l planw by th
sTiocsmqlaerp
pfrmbarsr(
eFcarcspscc
fwnHw
lo
5
stscmcmddpat
5
All the features described in the previous section had inputand output parameters, or attributes. The following measureswere considered critical for assessing the capabilities and lim-itations of a manufacturing strategy: cost, time product mass
Table 1Summary of typical outputs from each level
Level Outputs
Campaign Total number of campaignsTotal cost of goodsTotal fixed capital investmentSummary of recipe direct costsCumulative duration of campaignsCumulative product mass supplied
Batch recipe procedure Total number of batches per campaignRecipe direct costRecipe durationProduct mass supplied per batch & campaign
ig. 1. Hierarchical representation of manufacturing tasks in a biopharmaceuticaith each other to produce a single batch. The level of detail adopted is dictated
A closer examination of the hierarchical framework proposedpecifically for biopharmaceutical manufacture is given below.he domain description highlighted the multiple types of activ-
ties required to manufacture a product. Performing all theseperations within a single recipe can be inefficient and compli-ated to modify. The hierarchy was therefore configured to useeparate recipes to manufacture the product, prepare the equip-ent, prepare the intermediate materials and to perform support
uality control activities. This is indicated in the “batch-recipe”evel in Fig. 1. This provides greater flexibility than grouping allctivities together within a single recipe considering that oftenquipment, media and buffer are prepared prior to, or concur-ent with, the activities that directly handle the batch of finalroduct.
The ancillary recipes could be scheduled for use by the mainroduct manufacture recipe. For example, the product manu-acture recipe could acquire equipment for processing use andelease it after use for cleaning by another recipe. This per-its dirty equipment to be cleaned by a CIP recipe which can
e applied as often as is necessary. Another advantage of thepproach is that certain ancillary activities, such as the prepa-ation of intermediate materials, are not always dedicated to apecific campaign. Similar separation of product recipes fromecipes performing ancillary tasks can be found in Bastiaan1998) and Crowl (1997).
As illustrated in Fig. 1, each recipe procedure could be mod-lled in greater detail in terms of its constituent unit procedures.or example, the product manufacture recipe procedure couldomprise unit procedures, such as “fermentation”, “filtration”nd “chromatography”. Similarly the equipment preparationecipes could be modelled as unit procedures that are specific toertain equipment, e.g. “CIP fermenter”. Under certain circum-tances it may be desirable to define each unit procedure morerecisely in terms of its individual operations. For example, theequence of product-handling operations in a fermentation taskould be “agitate”, “heat”, “react”, “feed addition” and “dis-harge”.
All the hierarchical views of the activities in a manufacturingacility needed to be reconciled with the top-level view. This
Please cite this article in press as: Farid, S. S. et al., Modelling biopharmacComputers and Chemical Engineering (2006), doi:10.1016/j.compchemen
as made possible through the use of common parameters run-ing through all the levels, namely cost, time and product mass.owever, lower-level views also provided valuable outputs andere therefore of use in their own right, e.g. the unit operation
U
t. Each manufacturing campaign is composed of a set of recipes, which interacte purpose of the simulation and the information available.
evel was used to obtain resource utilisation profiles. A summaryf the typical outputs from each level is shown in Table 1.
.2. Key features
To satisfy both process and business applications each levelpecified the manufacturing process in terms of the manufac-uring tasks, the resources within the plant, and the processtreams that flow between material-handling tasks. Outside theseore knowledge requirements existed characteristics that wereore specific to each individual application. For process appli-
ations, examples include mass balance data and associatedathematical procedures. Business applications require cost
ata and knowledge of resource availability and utilisation. Theeveloped framework permits the user to investigate differentroduction strategies in terms of the process efficiency, massnd project throughput, resource demands and bottlenecks, andhe cost of goods.
.3. Key parameters
eutical manufacture: Design and implementation of SimBiopharma,g.2006.10.020
nit procedure/ operation Task direct costTask durationProcess stream compositionsResource utilisation profiles

IN+ModelC
emic
aptr
5
uttltractCrsalmciHr
6
6
mwtwtwco
tatE
6
tmtmtb
6
Li(i1actsst
6
becii
TB
U
FC
M
D
D
C
ARTICLEACE-3348; No. of Pages 18
S.S. Farid et al. / Computers and Ch
nd risk. These are closely interrelated; the ideal manufacturinglant should operate within a timeframe that maximises the masshroughput rate while being cost-effective and with acceptableisk.
.4. Stochastic simulation
Integral to this study has been the incorporation of risk andncertainty so that investment appraisal could be based on bothhe expected outputs and the likelihood of achieving certainhreshold values. Relying solely on deterministic results couldead to the risk of incorrect conclusions that could be damagingo a company’s overall economic performance. To measure theisk of a proposed investment, probability distributions could bessigned to all the key uncertain variables. While historical dataould be used to identify suitable distributions, most uncertain-ies were subjective estimates from informed experts. The Montearlo simulation technique would then be used to determine the
esulting frequency distributions of the output summary mea-ures. Consequently several possible outcomes are simulatednd their impact on the outputs measured as well as their like-ihood of occurrence. This facilitates choosing the most robust
anufacturing option and allows questions, such as “what is thehance of exceeding the cost budget?” and “what is the probabil-ty of failing to meet our desired plant output?” to be answered.ence, incorporating uncertainties also provides a more realistic
anking of manufacturing alternatives.
. Process and cost models
.1. Process models
The process models were selected primarily to describe aanufacturing process based on mammalian cell culture. Careas taken to construct or select models that described outputs
hat facilitated rapid assessment of manufacturing alternatives,ithout requiring data inputs that were complex or that necessi-
Please cite this article in press as: Farid, S. S. et al., Modelling biopharmacComputers and Chemical Engineering (2006), doi:10.1016/j.compchemen
ated specially designed experiments for their estimation. Thisas key to enable facility, process or capacity decisions that
onsidered both the technical performance and the implicationsn resources and costs to be made at early design stages.
Cwpm
able 2asis of process models
nit operation Basis – simple models Key
ermentation Stoichiometry; Extent of reaction Brotentrifugation Solids carry-over; Solids volume-fraction in
sedimentSedi
icro-/ultra-filtration Flux; Rejection coefficients Permfacto
iafiltration Flux; Rejection coefficients; Number ofdiafiltration volumes or Contaminantremoval-fraction
Permfactorem
ead-end filtration Flux; Rejected particle-fraction; Particlevolume-fraction in retentate
Perm
hromatography Flowrates; Yields Prodvolu
PRESSal Engineering xxx (2006) xxx–xxx 5
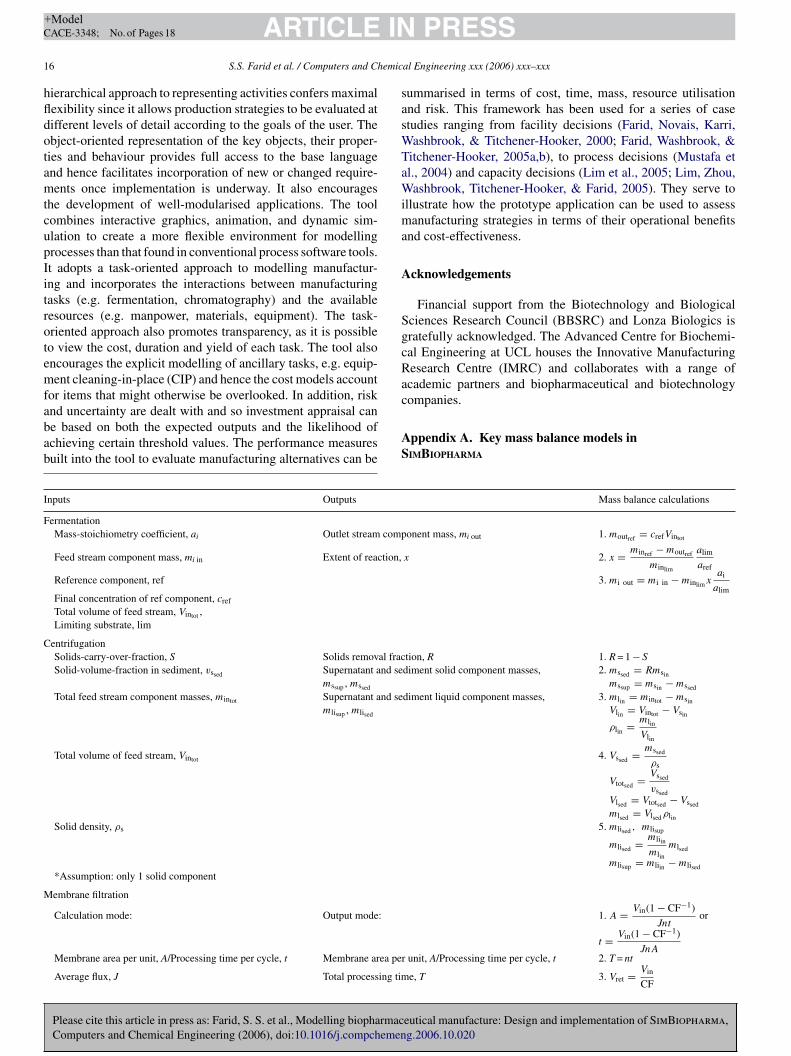
The process models comprised a combination of design equa-ions, which reflected design constraints arising from the processnd equipment, and mass balances taken over material-handlingasks. The basis of each process model is summarised in Table 2.xamples of the equations are given in Appendix A.
.2. Cost models
Fixed capital investment and the cost of goods were usedo compare different production strategies, are the. Simple cost
odels were initially proposed to provide rapid estimates ofhese metrics. The open architecture of the framework permits
ore detailed and accurate models to be added to complementhese as and when additional data becomes available from theiopharmaceutical industry.
.2.1. Fixed capital investmentThe fixed capital investment was approximated using the
ang factorial method (Lang, 1948). For chemical engineer-ng facilities, values in the range of 3–5 are often recommendedSinnott, 1993; Peters, & Timmerhaus, 1991). Examples of cap-tal cost breakdowns in the literature (Osborne, 1997; Hamers,993; Nelson, 1998) have suggested factors in the range of 6–7s more typical for biopharmaceutical plants. In addition, dis-ussions with industrial experts have indicated that factors inhe range of 4–7 are more suitable for the biopharmaceuticalector (A. Sinclair, BioPharm Services, Bucks, England, per-onal communication). These provide default input values forhe model.
.2.2. Cost of goods (COG)The cost of goods comprised both the direct costs accrued
ased on resource utilisation and indirect manufacturing costs,.g. maintenance, that are incorporated as investment-relatedosts. The duration of campaigns and the mass throughput alsonfluenced the operating costs. The tool employed the modelndicated in Table 3 to calculate the cost of goods (COG). The
eutical manufacture: Design and implementation of SimBiopharma,g.2006.10.020
OG model was adapted to reflect the extra costs associatedith current good manufacturing practices (cGMP) for bio-harmaceutical plants. The cost of goods was defined as theanufacturing cost, thus excluding general expenses, such as
outputs
h compositionment composition; Supernatant composition
eate composition; Retentate composition; Membrane area or Concentrationr or Processing timeeate composition; Retentate composition; Membrane area or Concentrationr or Processing time; Number of diafiltration volumes or Contaminant
oval-fractioneate composition; Retentate composition; Membrane area or Processing time
uct stream composition; Waste stream composition; Processing time; Buffermes

ARTICLE IN+ModelCACE-3348; No. of Pages 18
6 S.S. Farid et al. / Computers and Chemic
Table 3Cost of goods model
Cost category Value
Direct Direct raw materials f (utilisation)Miscellaneous materials 0.5 × Direct raw materialsDirect utilities f (utilisation)Operating labour f (utilisation)Supervisors 0.2 × Operating labourQCQA 1.0 × Operating labourGeneral management 1.0 × Operating labour
Indirect Maintenance 0.1 × Capitalinvestment × Project duration
Local taxes 0.02 × Capitalinvestment × Project duration
Insurance 0.01 × Capitalinvestment × Project duration
Depreciation Capitalinvestment/Depreciationperiod × Project duration
General utilities Cost per unit area peryear × Facility size × Projectduration
T
*
scsdfwubffaemtotMmsp
edcofp(fiec&
toTfWKtdteqiUosfTfllfa
bcooe
7
erveiscprfvi
8
twdtt
otal Cost of goods
QCQA = Quality Control & Quality Assurance.
ales and administration costs. The direct (variable) costs wereomputed based on the utilisation of the material, utilities andtaff resources. The indirect costs (fixed overheads) were mostlyerived from the capital investment. Since the tool was intendedor evaluating the effects of different production strategies itas found to be more useful to base the staff costs on theirtilisation rather than considering them as a fixed annual salary-ased cost. Monitoring the direct utilities cost does not accountor the ongoing utility charges for running the manufacturingacility. For example, HVAC systems are critical to controllingirborne particulate levels and pressure differentials in differ-nt rooms so as to prevent contamination and securely containicro-organisms used for production. An extra cost category
ermed “general utilities” was added to account for this. Advicen a suitable correlation for this category was sought from indus-rial experts (A. Sinclair, Biopharm Services, Bucks, England;
. Sawyer, Lonza Biologics, Portsmouth, NH, personal com-unication). The cost was derived as a function of the facility
ize or floor area. The fixed overhead costs were allocated to aroject based on its occupancy time in the manufacturing plant.
Apart from the direct resource costs, the remaining cost cat-gories were each estimated as a function of other costs. Theefault values for the factors used in these functions are indi-ated in Table 3; they provide a rapid estimate of the distributionf costs in a biopharmaceutical plant. These values were derivedrom literature or expert sources as indicated below. Pugh (1998)rovides estimates of the miscellaneous (indirect) material costse.g. safety clothing) as 33–67% of the direct raw material costsor cell culture facilities. A value of 50% was taken as the
Please cite this article in press as: Farid, S. S. et al., Modelling biopharmacComputers and Chemical Engineering (2006), doi:10.1016/j.compchemen
nitial default value. The staff for supervision, quality and gen-ral management were estimated based on the operating labourost as suggested in chemical engineering textbooks (Peters,
Timmerhaus, 1991). However, the actual value of the fac-
8
t
PRESSal Engineering xxx (2006) xxx–xxx
or for quality staff was increased to reflect the higher burdenn quality control activities in the biopharmaceutical industry.he new value for the factor was derived after soliciting advice
rom industrial experts. Some (C. van Hoorn, Merck & Co.,est Point, PA; N. Henschel, Boehringer Ingelheim PharmaG, Germany, personal communication) suggested that rela-
ive to a chemical pharmaceutical facility, the quality assuranceemands would be similar in a biopharmaceutical plant, whereashe quality control staff would be two to three times greater. Oth-rs have suggested that for every operator, there should be twouality control staff. In chemical engineering textbooks, qual-ty costs are estimated as one-fifth of the operating labour cost.sing the advice from industrial experts suggests that a factorf 0.4–2 would be more appropriate. A default value of 1 waselected. When quality operations are modelled explicitly thisactor can be reduced or removed to avoid duplications of costs.he default value for the annual cost of general utilities per unitoor area was assumed to be $300/m2 (M. Sawyer, Lonza Bio-
ogics, Portsmouth, NH, personal communication). The factorsor the remaining fixed overheads, such as maintenance weressumed to be similar to those for process engineering facilities.
In addition to calculating the cost of goods on a cost categoryasis, the framework also permitted the calculation of the directost of goods on a task basis, as mentioned earlier. Viewing costsn a unit operation basis can be more useful to a process devel-pment team since it highlights where to focus cost reductionfforts.
. Data collection
As highlighted in the previous section, parameters in the mod-ls within the framework have default values obtained from aange of sources: industrial experts, historical data, literature andendors. Data collection involved a series of discussions withxperts (J. Birch, D. Sherwood, J. Bonnerjea at Lonza Biolog-cs, Slough, England). In addition, these experts were consultedo as to validate the structural model assumptions through dis-ussions of the manufacturing operations in biopharmaceuticallants. The experts were also called upon to validate whether theesults of the simulation model were reasonable. Default valuesor parameters in the process and cost models, such as linearelocities in a chromatography step and cost factors, were builtnto the models with the flexibility to modify them.
. Selecting a software platform for implementation
It was necessary to summarise the required capabilities ofhe software platform(s) and assess which of several platformsould be best-suited to implement both the logistical models,escribing the interactions between tasks and resources overime, and the mathematical process models, used to determinehe composition of the process streams.
eutical manufacture: Design and implementation of SimBiopharma,g.2006.10.020
.1. Requirements specification
The conceptual framework identified the key features, e.g.asks, and parameters, such as cost required to represent the

ARTICLE IN+ModelCACE-3348; No. of Pages 18
S.S. Farid et al. / Computers and Chemic
Table 4Requirements specification for the tool
Requirement type Specification
Representation ofdeclarative andprocedural knowledge
Tasks and their characteristics
Resources and their characteristicsMaterial flow and its characteristicsRelationships between tasks, resources andmaterial flowSequences of tasksResource requirements for each taskCalculation procedures for mass balances andcostingVariables for the calculation proceduresTimeHierarchical views of the tasksRisk/uncertainty: stochastic variables definedusing probability distributions
Dynamic simulation Dynamic simulation of task sequencesDynamic allocation of resources to tasksDynamic invocation of calculation procedures tocompute compositions and costsDynamic invocation of procedures to computeresource utilisation statisticsMonte Carlo simulationSingle-threaded, multi-threaded and parallelprocessing
Flexible developmentenvironment
Graphical user-interface
pbmst
Sutfiianttitsai“fhbe
eptliifmsmgc(u
8a
stb
arcooakaawukia1pcb
arafaRcpuptwould monitor the cost and time outputs. The advantage of this
ModularExtensible
rocess and business perspectives of manufacturing processes ofiopharmaceuticals. This permitted the development and refine-ent of a “requirements specification” that describes what the
oftware platform should be able to accomplish. A summary ofhe requirements specification is shown in Table 4.
The possibility of using SuperPro Designer (Intelligen,cotch Plains, NJ), a commercially available bioprocess sim-lation package was investigated. Key advantages were foundo be that it was relatively simple and fast to set up a flowsheetor an entire process. It also had default values for many of thenput data required for simulation that could be used when exper-mental data were not readily available or as a reference to checkgainst. However, one of the key disadvantages was that it couldot capture the desired dynamic behaviour capabilities related toime-dependent operations (Table 4). An example of informationhat needs to be updated in “real-time” is resource availabil-ty, since this affects the allocation of resources to tasks overime. This is important for tasks competing for specific resourcesince the tasks can become delayed by the non-availability ofresource. In addition, the availability of equipment resources
s further constrained by their status which can change betweenclean”, “sterile” and “dirty”. SuperPro Designer did not accountor the impact of delays due to resource constraints and hence
Please cite this article in press as: Farid, S. S. et al., Modelling biopharmacComputers and Chemical Engineering (2006), doi:10.1016/j.compchemen
ad limited logistical capabilities. These conclusions are echoedy Shanklin, Roper, Yegneswaran, and Marten (2001) in theirvaluation of Aspen Batch Plus and SuperPro Designer for mod-
tpo
PRESSal Engineering xxx (2006) xxx–xxx 7
lling a vaccine manufacturing process; they report that neitherackage accounts for constraints, such as available labour orime limitations between cleaning and processing. Another keyimitation for the purposes of this work was the inability toncorporate probability distributions to represent the uncertaintyn parameter values. Furthermore, it only offered pre-specifiedunctionality with no option to create user-defined models. Thiseant that it was not possible to model newer unit operations,
uch as expanded bed chromatography, or to customise existingodels. On the other hand, object-oriented programming lan-
uages were found to have features that support all these requiredapabilities. Similar conclusions were related by Knutilla et al.1998), when examining several platforms for specifying man-facturing processes.
.2. Implementation strategy using an object-orientedpproach
Gensym’s G2® (Gensym Corporation, Cambridge, MA) waselected as the most suitable environment in which to buildhe models describing the process and business perspectives ofiopharmaceutical manufacture.
G2 is a graphical simulation tool that enables modelling ofnumber of key manufacturing and business features, such as
esource utilisation and costs. Both types of applications requireommon information, such as the process sequence, the unitperation models, the design data, the relationships betweenbjects and the constraints on the process due to time, costnd resource availability. This graphically- and object-orientednowledge-based tool can be used to capture and formalisell these common properties. A particular advantage of suchn object-oriented language is its rapid prototyping capability,hich facilitates the development of applications in a mod-lar fashion, where modules are reusable. A benefit of thenowledge-based approach is that more of the information isn an explicit, declarative form, accessible by both developersnd end-users, rather than buried in procedural code (Stanley,994). This facilitates error detection. A further and powerfulroperty of such knowledge-based systems is the inheritance in alass hierarchy, which simplifies development and maintenancey abstracting common properties and behaviours.
ReThink® (Gensym Corporation, Cambridge, MA), anpplication that runs in G2’s object-oriented programming envi-onment, contains useful pre-built features, such as basic tasksnd resources, to enable business process re-engineering. Neweatures pertinent to biopharmaceutical manufacture can bedded by extending and customising the building blocks ineThink, using the G2 programming environment. Theoreti-ally then when modelling a manufacturing process at the unitrocedure/operation level, ReThink can be configured to allowsers to build simulation cases that comprise the productionrocess sequences as interconnected tasks, each with a dura-ion and cost and each related to the resources it requires. This
eutical manufacture: Design and implementation of SimBiopharma,g.2006.10.020
ask-oriented approach is that it focuses more on the logistics ofroduction unlike the unit-oriented approach that focuses moren the plant schematic and promotes a clear linkage between the

IN+ModelC
8 emic
mipitoiethspi
rfamcdidocptf
9
sstcttoa
oditi
FpTtpcmts
i
dimtattoTc
sreafwetmpattso
9
tbtEoipciccr
9
ctuwott
ARTICLEACE-3348; No. of Pages 18
S.S. Farid et al. / Computers and Ch
anufacturing activities, their resource requirements and costsncurred through the use of the allocated resources. This canrovide a better understanding of where costs originate and howmprovements can be made to the process. Another benefit of theask-oriented approach is that it facilitates a hierarchical analysisf the process by describing the manufacturing activities at var-ous levels of abstraction. Resource requirements are expressedxplicitly for each task providing a clear visualisation of theasks and their required resources. Such an approach confers aigher level of flexibility than implicit resource representationince the resource requirements of a task are not fixed in itsroperties but can be set at any time without disrupting the toolnfrastructure.
The technical performance of each task and hence the mate-ial flow to each task was dictated by mathematical modelsor the unit operations. The values of these performance vari-bles could either be determined by specifying the mathematicalodels in G2 or by data-seeking from an external simulator
ontaining the unit operation models. A key implementationecision was to determine the optimum method of incorporat-ng the output of the mathematical process models within thisecision-support software. Since the mathematical complexityf the simple process models is within G2’s capabilities, the pro-ess and logistical models were created all in G2; this avoided theroblems of interfacing between different packages and offeredhe advantages of an open architecture for future additions ofeatures. The tool was designed and implemented in ReThink.
. Tool overview
In designing SimBiopharma the challenge was to repre-ent the declarative and procedural knowledge required in aufficiently robust manner, so as to enhance the efficiency, main-ainability and reusability of the application. It was necessary toustomise ReThink to model the processes of biopharmaceu-ical manufacture using the G2 language. The components ofhe tool built with this language possess the benefits of object-riented design, including the use of encapsulation, inheritancend polymorphism.
The mapping of the key features of the framework intobject classes was facilitated by the principles of object-orientedesign. The development of the class hierarchies was morenvolved. It was guided by the requirements of the manufac-uring domain and exploited the object-oriented principle ofnheritance of attributes and methods in hierarchies.
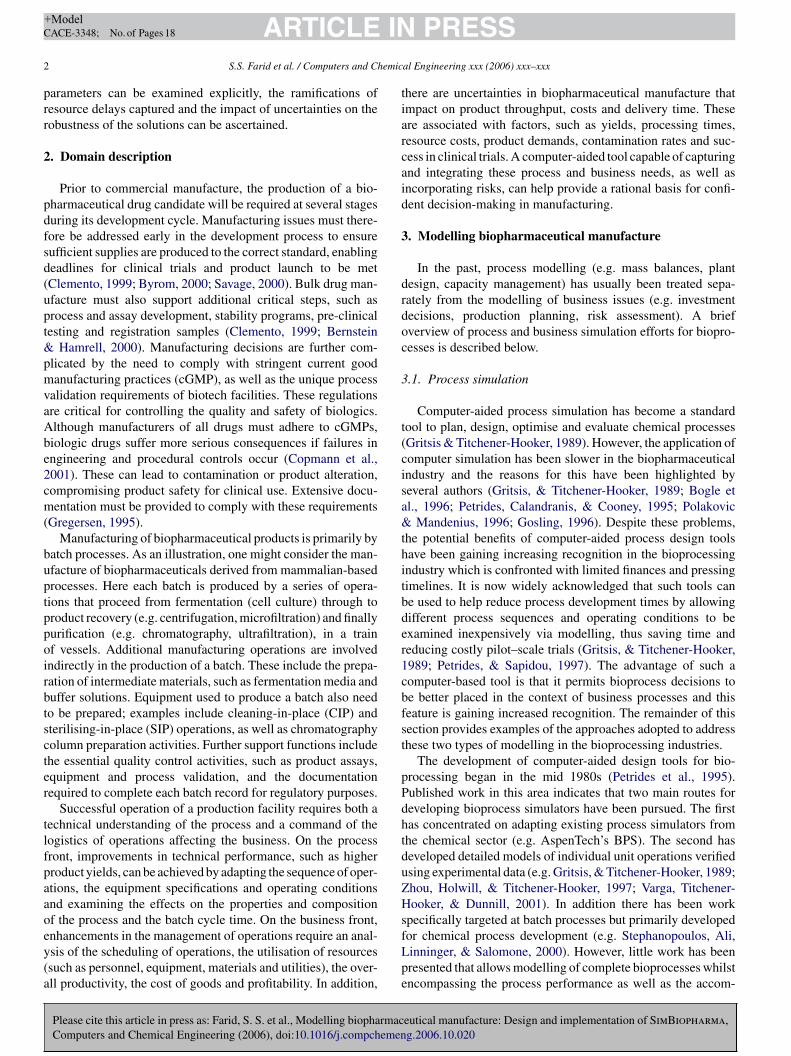
The main components of SimBiopharma are depicted inig. 2. The system definitions comprise all the declarative androcedural knowledge for modelling manufacturing operations.he declarative knowledge consists of all the objects, such as
asks and resources, and their class definitions describing theirroperties. The procedural knowledge enables programmaticontrol over an application and takes the form of procedures,ethods and rules. Each of these items contains G2 statements
Please cite this article in press as: Farid, S. S. et al., Modelling biopharmacComputers and Chemical Engineering (2006), doi:10.1016/j.compchemen
hat can be used to obtain information about objects and topecify actions to be executed on them.
Some of the key features of the user interface are highlightedn the simplified schematic in Fig. 2. The graphical user interface
et
d
PRESSal Engineering xxx (2006) xxx–xxx
epicted simplifies rapid prototyping of specific cases since its highly interactive and provides visualisation of the various
anufacturing levels. The user interface provides a template ofhe manufacturing levels to guide the user through building theirpplication graphically. Palettes provide the different types ofasks and resources required to populate a simulation model suchhat the building blocks can be cloned from the palette and placedn the appropriate level in the simulation model and configured.he resource pools in the plant are specified to describe theapabilities of the plant.
The task-oriented approach adopted requires that the taskequences within each recipe be generated and the resourceequirements identified. Resource requirements were expressedxplicitly for each task by using objects (resource managers)ttached to the task to represent the association of a resourcerom a pool to the task. Attributes of the tasks and resourcesere initialised through the use of input/output tables. When-
ver a simulation is run, the simulation clock advances withhe completion of each task and the simulation model is ani-
ated to enable the user to view what is happening at anyoint in time. Dynamic simulation enables temporal reasoningnd makes it possible to view the tasks that are active and torack the impact on parameters over time. Examples of suchime-dependent parameters include the composition of processtreams, the status of equipment, the product mass, the numberf batches completed, resource availability and utilisation.
.1. System definitions
The three main constructs identified to specify a manufac-uring process were the tasks carried out to manufacture aiopharmaceutical, the resources available within the plant, andhe process streams that flow between material-handling tasks.ach type of construct required descriptions at multiple levelsf detail represented as objects. The objects were categorisednto classes defined by a set of attributes, which describe theirroperties, and methods, which characterise their functions. Theonstructs were classified into class hierarchies to allow inher-tance of common properties and behaviour. Encapsulating theommon features and behaviours of these objects into genericlasses facilitated re-use of code and the extension of knowledgeepresentation.
.2. Manufacturing task classes
The tasks describing the manufacturing operations form theore of SimBiopharma. The hierarchical views of the manufac-uring activities were realised through the use of workspaces,pon which items can be placed. Each high-level task on aorkspace can be broken down into its subtasks that are placedn the subworkspace of the task. The manufacturing levels areherefore represented as a workspace hierarchy. This is illus-rated in Fig. 3 where the tasks representing product manufacture
eutical manufacture: Design and implementation of SimBiopharma,g.2006.10.020
ach have an associated subworkspace with the constituent taskshat make up the recipe procedure.
The task class hierarchy is shown in Fig. 4 where theefinitions of the tasks have been extended from ReThink’s
ARTICLE IN PRESS+ModelCACE-3348; No. of Pages 18
S.S. Farid et al. / Computers and Chemical Engineering xxx (2006) xxx–xxx 9
F a. TS
sdmtts
ttmr
tcssgvo
ig. 2. Simplified schematic of the main components of the tool, SimBiopharmome of the features of the user interface are palettes and the model template.
ystem-defined class of a task block. The task blocks representiscrete events and have cost and duration attributes as well asethods defining default behaviour. These are all inherited by
he custom tasks. When a task becomes active it calls methodso perform appropriate actions, such as cleaning or calculatingtream compositions and activity costs.
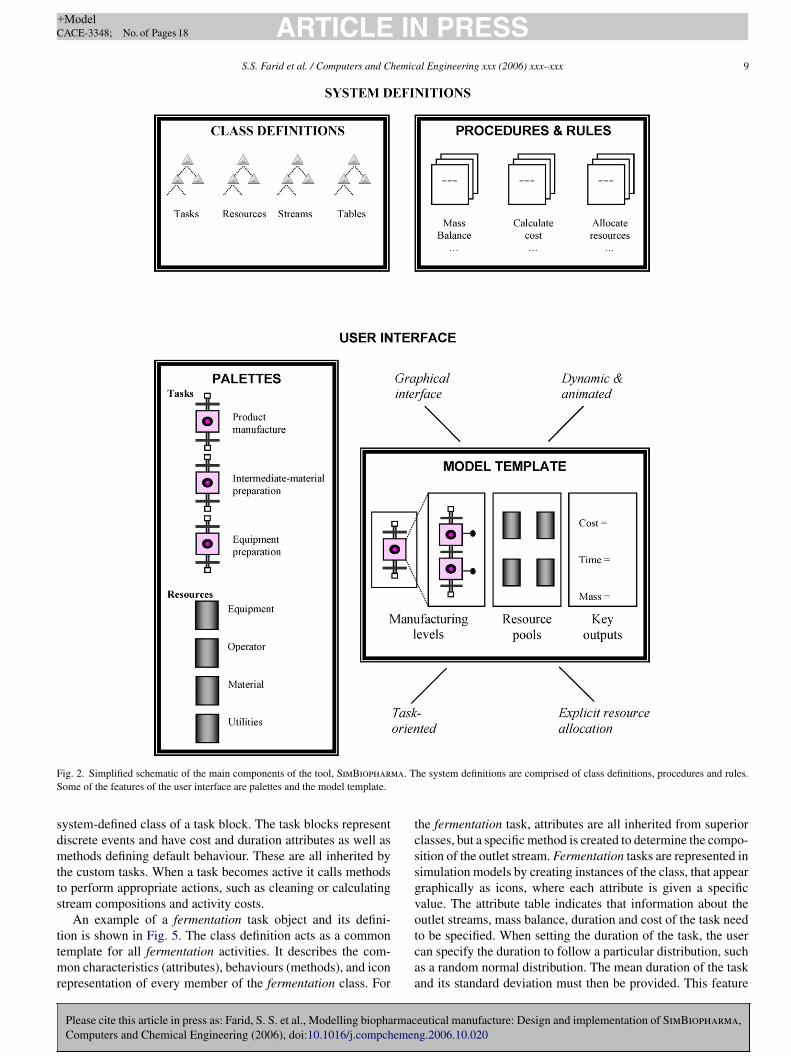
An example of a fermentation task object and its defini-
Please cite this article in press as: Farid, S. S. et al., Modelling biopharmacComputers and Chemical Engineering (2006), doi:10.1016/j.compchemen
ion is shown in Fig. 5. The class definition acts as a commonemplate for all fermentation activities. It describes the com-
on characteristics (attributes), behaviours (methods), and iconepresentation of every member of the fermentation class. For
tcaa
he system definitions are comprised of class definitions, procedures and rules.
he fermentation task, attributes are all inherited from superiorlasses, but a specific method is created to determine the compo-ition of the outlet stream. Fermentation tasks are represented inimulation models by creating instances of the class, that appearraphically as icons, where each attribute is given a specificalue. The attribute table indicates that information about theutlet streams, mass balance, duration and cost of the task need
eutical manufacture: Design and implementation of SimBiopharma,g.2006.10.020
o be specified. When setting the duration of the task, the useran specify the duration to follow a particular distribution, suchs a random normal distribution. The mean duration of the tasknd its standard deviation must then be provided. This feature

ARTICLE IN PRESS+ModelCACE-3348; No. of Pages 18
10 S.S. Farid et al. / Computers and Chemical Engineering xxx (2006) xxx–xxx
F ct mas
atma
eaaps
tEtmmt
F
ig. 3. Example of a workspace hierarchy. This shows tasks representing a produubworkspaces.
llows variability in process durations to be captured. When theask is activated it calls the mass balance method as well as other
ethods defined for the superior classes to execute the requiredctions.
Regarding the mass balance inputs, the user may select differ-nt mass balance calculation methods for the fermentation task
Please cite this article in press as: Farid, S. S. et al., Modelling biopharmacComputers and Chemical Engineering (2006), doi:10.1016/j.compchemen
ccording to the level of sophistication desired. For example,t a certain level of detail it may be sufficient to determine theerformance of unit operations using process models based onimple yield relations; whereas when more rigorous and predic-
adt
ig. 4. Class hierarchy of key manufacturing tasks. The manufacturing operations ar
nufacture recipe and an equipment preparation recipe each with their associated
ive evaluations are required, kinetic models may be selected.ach mass balance calculation method has an associated data
able. The data table for a simple mass balance method for fer-entation is illustrated in Fig. 5. This highlights that the simpleass balance method is based on the mass stoichiometry and
he product titre being specified.
eutical manufacture: Design and implementation of SimBiopharma,g.2006.10.020
It was necessary to prevent tasks inheriting inappropriatettributes and methods. This was achieved by making a clearistinction between the overall hierarchical framework and theask class hierarchy (Fig. 4). So for example, the campaign
e classified as either material preparation tasks or equipment preparation tasks.
ARTICLE IN PRESS+ModelCACE-3348; No. of Pages 18
S.S. Farid et al. / Computers and Chemical Engineering xxx (2006) xxx–xxx 11
F e. Thei
mfiafiTatmupita
9
rap
tcasbbaau“aattt
ig. 5. Class definition and instance of fermentation task with its attribute tablnstance represents a specific occurrence of the task.
anufacture and product manufacture recipe tasks are classi-ed separately from the remaining manufacturing operations. Inddition, the biopharmaceutical manufacturing tasks are classi-ed into material preparation and equipment preparation steps.he campaign manufacture task represents the top-level activitynd its attributes include a “campaign summary table” indicatinghe total number of campaigns completed, cumulative product
ass supplied and cumulative product mass demand. The prod-ct manufacture recipe task contains summary statistics on therogress of the batches for each campaign. Its attributes thereforenclude a “product-supply-and-demand-table” which monitorhe number of batches completed, the product supplied per batchnd the product demand per campaign.
.2.1. Material preparation tasks
Please cite this article in press as: Farid, S. S. et al., Modelling biopharmacComputers and Chemical Engineering (2006), doi:10.1016/j.compchemen
The product manufacture and intermediate material prepa-ation tasks all share some characteristics and behaviours as theyll make material. For this reason, the superior class, materialreparation, was created to encapsulate the common informa-
aapt
class definition acts as a common template for all fermentation tasks and the
ion into a single class. This minimises the use of redundantode, making the class hierarchy easier to comprehend, extendnd maintain. The subclasses have more specific attributes touit their function. For example, the product manufacture tasklock and its subclasses have attributes needed to perform massalance calculations. Decoupling the mass balance data andssociated calculation method from the task’s attributes waschieved by assigning the following attributes to the prod-ct manufacture definition: “mass-balance-method-name” andmass-balance-data-table”. This meant that the subclasses, suchs fermentation and centrifugation, could all inherit thesettributes without any conflict. It also provided the flexibilityo select different mass balance calculation methods for theseasks, and fill in their associated data requirements, accordingo the level of sophistication desired. To monitor the steps that
eutical manufacture: Design and implementation of SimBiopharma,g.2006.10.020
chieve virus clearance, the product manufacture task block waslso given the attribute “virus-clearance-data-table”, where it isossible to specify the “log-clearance-factor”. Material prepara-ion tasks were also given attributes to specify the name and type
IN+ModelC
1 emic
oo
9
adssm“aiaf
9
tutttatptariTattt
pritama
9
aap
iarFio
oitrtbaic
Fo
ARTICLEACE-3348; No. of Pages 18
2 S.S. Farid et al. / Computers and Ch
f outlet streams produced as a result of the activity. Examplesf stream type are “product”, “intermediate” and “waste”.
.2.2. Equipment preparation tasksEquipment preparation tasks did not require specific
ttributes in addition to those inherited that include cost anduration tables. Modelling equipment preparation operations,uch as cleaning-in-place (CIP) operations, was achieved at aimple level by creating a generic cleaning method for the equip-ent resource that changes the status of the equipment from
dirty” to “clean” and a CIP task block method that initiallydjusts the equipment status to “cleaning-in-progress” and thennvokes the equipment CIP method to perform the cleaning oper-tion on the attached equipment. Similar methods were createdor each of the equipment preparation operations.
.2.3. TransitionsIn addition to the manufacturing operations, it was necessary
o create transition steps to be placed between the product man-facture tasks. These steps between tasks were created to servewo main purposes. Firstly, for discrete event simulation, theask duration and resource utilisations must be known beforehe task is activated. However, since certain operations, suchs filtration and chromatography have methods to determine theask duration and volumes of buffer required, it was necessary toerform these calculations prior to starting these operations. Theransition steps therefore call methods to compute these valuesnd to set these attributes in the following task and its attachedesources. The other fundamental function of the transition stepss to schedule the ancillary operations required between tasks.o this end the transition step has attribute tables, to specify the
Please cite this article in press as: Farid, S. S. et al., Modelling biopharmacComputers and Chemical Engineering (2006), doi:10.1016/j.compchemen
ncillary operations required prior to the next operation and posthe previous operation, and methods to run the ancillary opera-ions identified. For example a chromatography task will requirehe column to be cleaned and equilibrated before loading of the
9
a
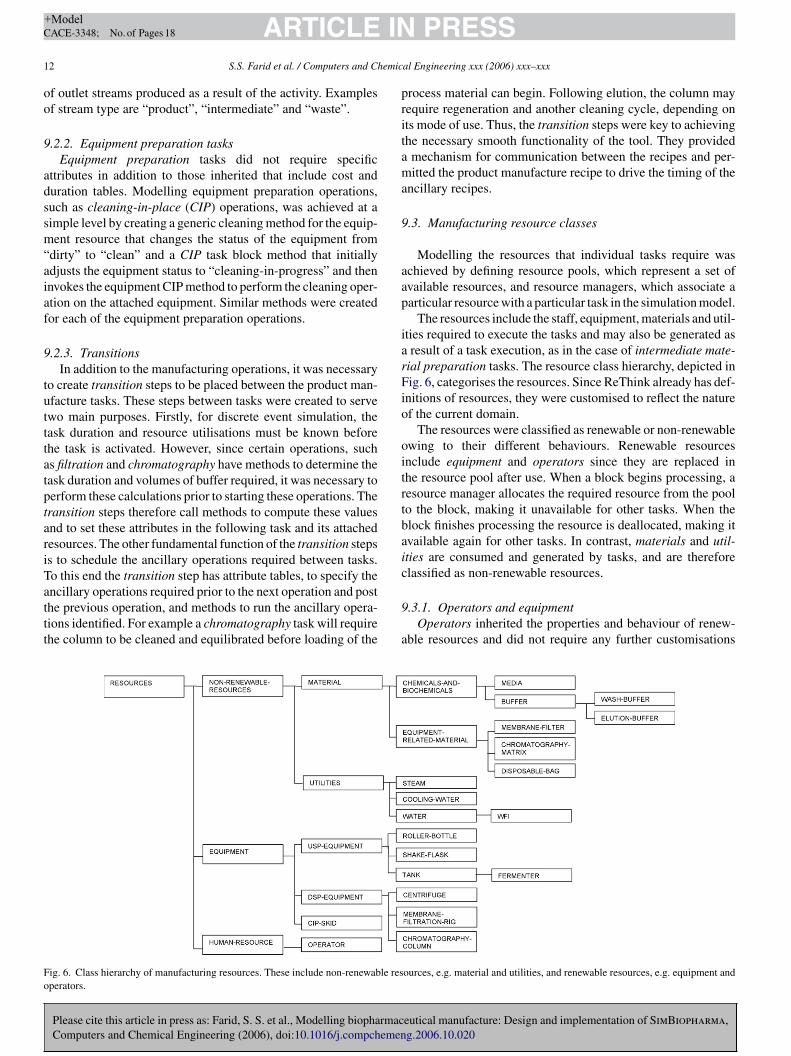
ig. 6. Class hierarchy of manufacturing resources. These include non-renewable resperators.
PRESSal Engineering xxx (2006) xxx–xxx
rocess material can begin. Following elution, the column mayequire regeneration and another cleaning cycle, depending onts mode of use. Thus, the transition steps were key to achievinghe necessary smooth functionality of the tool. They providedmechanism for communication between the recipes and per-itted the product manufacture recipe to drive the timing of the
ncillary recipes.
.3. Manufacturing resource classes
Modelling the resources that individual tasks require waschieved by defining resource pools, which represent a set ofvailable resources, and resource managers, which associate aarticular resource with a particular task in the simulation model.
The resources include the staff, equipment, materials and util-ties required to execute the tasks and may also be generated asresult of a task execution, as in the case of intermediate mate-
ial preparation tasks. The resource class hierarchy, depicted inig. 6, categorises the resources. Since ReThink already has def-
nitions of resources, they were customised to reflect the naturef the current domain.
The resources were classified as renewable or non-renewablewing to their different behaviours. Renewable resourcesnclude equipment and operators since they are replaced inhe resource pool after use. When a block begins processing, aesource manager allocates the required resource from the poolo the block, making it unavailable for other tasks. When thelock finishes processing the resource is deallocated, making itvailable again for other tasks. In contrast, materials and util-ties are consumed and generated by tasks, and are thereforelassified as non-renewable resources.
eutical manufacture: Design and implementation of SimBiopharma,g.2006.10.020
.3.1. Operators and equipmentOperators inherited the properties and behaviour of renew-
ble resources and did not require any further customisations
ources, e.g. material and utilities, and renewable resources, e.g. equipment and

ARTICLE IN+ModelCACE-3348; No. of Pages 18
S.S. Farid et al. / Computers and Chemic
Frt
thfssssa
s“oimoahcp“t
amtarbecs
9
suc
rurtetftcl
bmacvma
bdtrcbpuwgftbrr
9
opdbgtfv
9
alt
ig. 7. Example of the representation of a specific instance of a fermenteresource with its attribute table. This highlights the key properties that needo be specified for a fermenter.
o describe their cost and utilisation patterns. On the otherand, special features needed to be incorporated into the toolor equipment resources. They were given additional attributes,uch as “equipment-status” (“clean”, “dirty” or “sterile”). Morepecific attributes indicating the equipment sizes were given toubclasses, such as tank and chromatography column. Fig. 7hows an example of the representation of a specific instance offermenter resource with its attribute table.
The common operations for equipment were cleaning andterilising activities. As mentioned earlier, generic “clean” andsterilise” methods were created for the equipment class meth-ds to change the status of equipment. Since objects are arrangedn a class hierarchy, subclasses of equipment, such as fer-
enters, inherit this cleaning method. A key to the creationf this prototype tool was the use of inheritance of attributesnd methods in class hierarchies as demonstrated above. Thiselped to minimise development efforts significantly. In additionhromatography columns were assigned methods for columnreparation activities, such as “equilibrate”, “regenerate” andre-equilibrate”. These alter the status of columns when invoked;o “equilibrated” for example.
The status attribute provides an additional constraint on thevailability of equipment and permits tasks to specify the equip-ent status they require to function. For example, a fermentation
ask block requiring a “sterile” fermenter will only becomective if the fermenter resource allocated to it has the cor-ect status. Allocation of equipment resources was controlledy specification of the “required-initial-equipment-status” forach equipment-resource-manager attached to a task and a pro-edure to choose a resource from the pool with the correcttatus.
.3.2. Materials and utilities
Please cite this article in press as: Farid, S. S. et al., Modelling biopharmacComputers and Chemical Engineering (2006), doi:10.1016/j.compchemen
Unlike equipment and personnel resources where the utili-ation refers to their number, for non-renewable resources thetilisation can refer to a specific attribute in each case. An effi-ient approach to solving this problem was to assign material
ct(l
PRESSal Engineering xxx (2006) xxx–xxx 13
esources the attribute “utilisation-indicator”. This permits these of one generic rule and one generic method for all materialesources, which work together to update the attribute named byhe “utilisation-indicator”. Creating generic rules and methodsnhances the reusability of the application and avoids duplica-ion of code. This approach avoids ambiguity that can resultrom not knowing exactly which attribute is used to indicatehe resource’s utilisation and provides much more flexibility foronfiguring individual material and utilities resources within aarge application.
Material resources were classified into chemicals-and-iochemicals, e.g. glucose, and equipment-related-material, e.g.embrane-filter. The former was assigned a physical state
ttribute, composition tables for component masses, volumes,oncentrations and mass fractions and a virus table detailing theirus titre in the resource. Each subclass of equipment-related-aterial was assigned attributes to indicate its size, e.g. “area”
nd “number-of-units” for membrane-filters.In biopharmaceutical facilities, consumables, such as mem-
ranes and matrices, can be re-used for a certain lifetime or beisposed of after each batch/use. To distinguish between thesewo types of uses of equipment-related material, the equipment-elated material class was given the attribute “re-use”, thatould be true or false, to indicate whether the material coulde re-used in subsequent batches. To ensure that costs of dis-osable materials were not duplicated if the materials weresed in multiple cycles of a step or in ancillary activities asell as the main activity, the equipment resource manager wasiven the attribute “dispose-after-task” that could be true oralse to indicate whether the material attached to a particularask was immediately disposed of upon task completion or usedy another task before disposal. The ability to model flexiblyesources along with their corresponding usage patterns is a keyequirement in most manufacturing applications.
.4. Process streams
The process streams refer to the flows of material outf product manufacture operations and intermediate materialreparation operations. Examples include the culture broth pro-uced by a fermentation task, and fermentation media producedy a media preparation task. The process stream object wasiven attributes to specify its type and define its composition inerms of the component masses, volumes, concentrations, massractions, and their respective totals. In addition, the number ofirus particles in the stream was monitored.
.5. Cost objects
The framework, illustrated in Fig. 1, led to the identificationnd explicit modelling of new cost items incurred from ancil-ary activities, e.g. cleaning equipment. In traditional costingechniques, these costs may be hidden in overheads or unac-
eutical manufacture: Design and implementation of SimBiopharma,g.2006.10.020
ounted for. The cost of each manufacturing task was based onhe costs incurred through the use of the allocated resourcesexcluding equipment). Hence, the framework provided a clearinkage between manufacturing activities and their associated
IN PRESS+ModelC
1 emical Engineering xxx (2006) xxx–xxx
diwcfctfstciogtop
9
tvtmcgRb
9
tfigpctCpapadoewa
1
ftlt
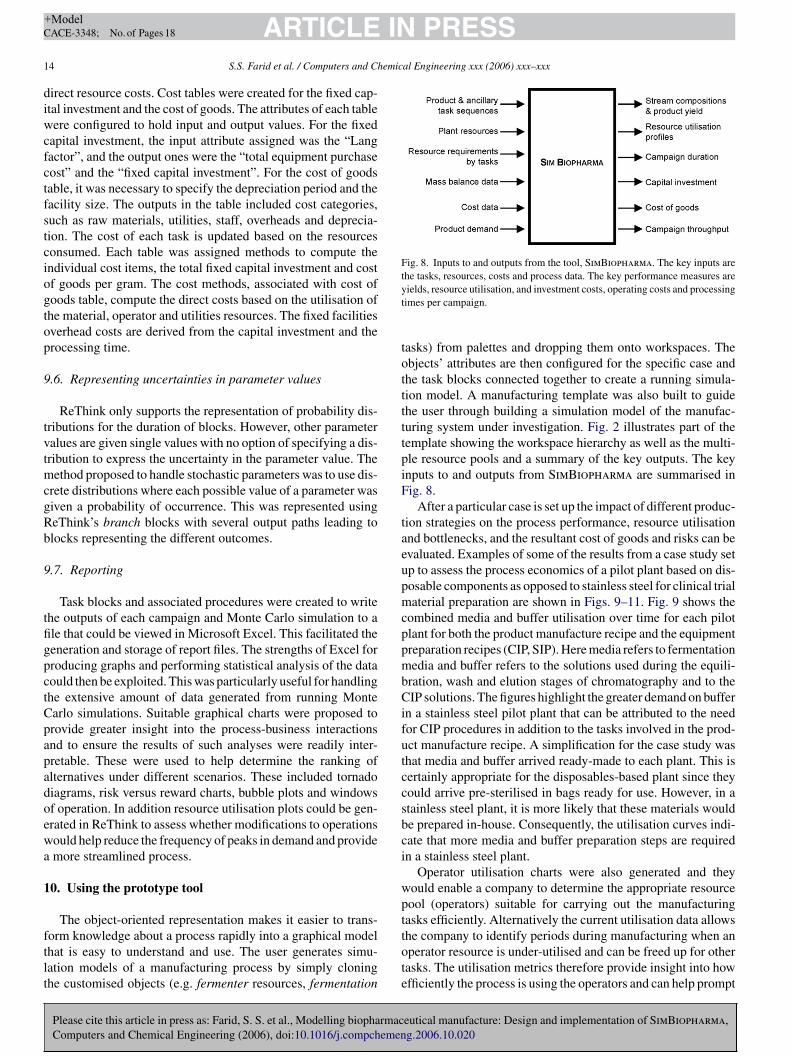
Fig. 8. Inputs to and outputs from the tool, SimBiopharma. The key inputs arethe tasks, resources, costs and process data. The key performance measures areyt
totttttpiF
taeupmcppmbCifutccsbci
wpt
ARTICLEACE-3348; No. of Pages 18
4 S.S. Farid et al. / Computers and Ch
irect resource costs. Cost tables were created for the fixed cap-tal investment and the cost of goods. The attributes of each tableere configured to hold input and output values. For the fixed
apital investment, the input attribute assigned was the “Langactor”, and the output ones were the “total equipment purchaseost” and the “fixed capital investment”. For the cost of goodsable, it was necessary to specify the depreciation period and theacility size. The outputs in the table included cost categories,uch as raw materials, utilities, staff, overheads and deprecia-ion. The cost of each task is updated based on the resourcesonsumed. Each table was assigned methods to compute thendividual cost items, the total fixed capital investment and costf goods per gram. The cost methods, associated with cost ofoods table, compute the direct costs based on the utilisation ofhe material, operator and utilities resources. The fixed facilitiesverhead costs are derived from the capital investment and therocessing time.
.6. Representing uncertainties in parameter values
ReThink only supports the representation of probability dis-ributions for the duration of blocks. However, other parameteralues are given single values with no option of specifying a dis-ribution to express the uncertainty in the parameter value. The
ethod proposed to handle stochastic parameters was to use dis-rete distributions where each possible value of a parameter wasiven a probability of occurrence. This was represented usingeThink’s branch blocks with several output paths leading tolocks representing the different outcomes.
.7. Reporting
Task blocks and associated procedures were created to writehe outputs of each campaign and Monte Carlo simulation to ale that could be viewed in Microsoft Excel. This facilitated theeneration and storage of report files. The strengths of Excel forroducing graphs and performing statistical analysis of the dataould then be exploited. This was particularly useful for handlinghe extensive amount of data generated from running Montearlo simulations. Suitable graphical charts were proposed torovide greater insight into the process-business interactionsnd to ensure the results of such analyses were readily inter-retable. These were used to help determine the ranking oflternatives under different scenarios. These included tornadoiagrams, risk versus reward charts, bubble plots and windowsf operation. In addition resource utilisation plots could be gen-rated in ReThink to assess whether modifications to operationsould help reduce the frequency of peaks in demand and providemore streamlined process.
0. Using the prototype tool
The object-oriented representation makes it easier to trans-
Please cite this article in press as: Farid, S. S. et al., Modelling biopharmacComputers and Chemical Engineering (2006), doi:10.1016/j.compchemen
orm knowledge about a process rapidly into a graphical modelhat is easy to understand and use. The user generates simu-ation models of a manufacturing process by simply cloninghe customised objects (e.g. fermenter resources, fermentation
tote
ields, resource utilisation, and investment costs, operating costs and processingimes per campaign.
asks) from palettes and dropping them onto workspaces. Thebjects’ attributes are then configured for the specific case andhe task blocks connected together to create a running simula-ion model. A manufacturing template was also built to guidehe user through building a simulation model of the manufac-uring system under investigation. Fig. 2 illustrates part of theemplate showing the workspace hierarchy as well as the multi-le resource pools and a summary of the key outputs. The keynputs to and outputs from SimBiopharma are summarised inig. 8.
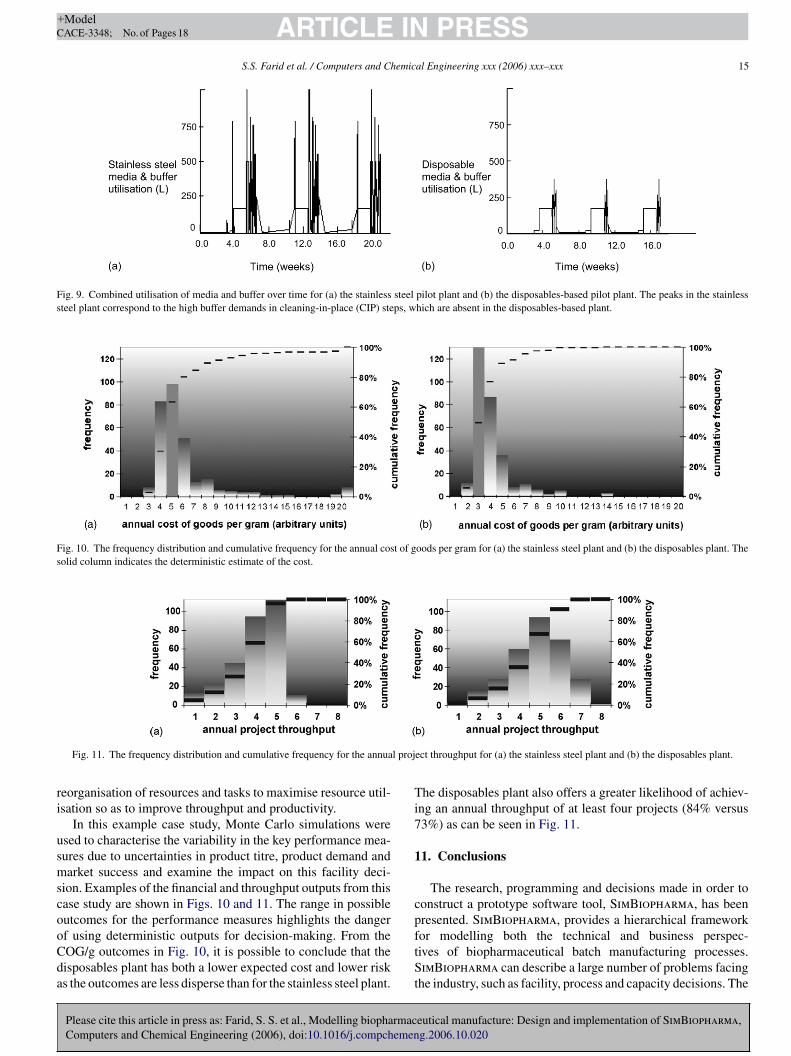
After a particular case is set up the impact of different produc-ion strategies on the process performance, resource utilisationnd bottlenecks, and the resultant cost of goods and risks can bevaluated. Examples of some of the results from a case study setp to assess the process economics of a pilot plant based on dis-osable components as opposed to stainless steel for clinical trialaterial preparation are shown in Figs. 9–11. Fig. 9 shows the
ombined media and buffer utilisation over time for each pilotlant for both the product manufacture recipe and the equipmentreparation recipes (CIP, SIP). Here media refers to fermentationedia and buffer refers to the solutions used during the equili-
ration, wash and elution stages of chromatography and to theIP solutions. The figures highlight the greater demand on buffer
n a stainless steel pilot plant that can be attributed to the needor CIP procedures in addition to the tasks involved in the prod-ct manufacture recipe. A simplification for the case study washat media and buffer arrived ready-made to each plant. This isertainly appropriate for the disposables-based plant since theyould arrive pre-sterilised in bags ready for use. However, in atainless steel plant, it is more likely that these materials woulde prepared in-house. Consequently, the utilisation curves indi-ate that more media and buffer preparation steps are requiredn a stainless steel plant.
Operator utilisation charts were also generated and theyould enable a company to determine the appropriate resourceool (operators) suitable for carrying out the manufacturingasks efficiently. Alternatively the current utilisation data allowshe company to identify periods during manufacturing when an
eutical manufacture: Design and implementation of SimBiopharma,g.2006.10.020
perator resource is under-utilised and can be freed up for otherasks. The utilisation metrics therefore provide insight into howfficiently the process is using the operators and can help prompt
ARTICLE IN PRESS+ModelCACE-3348; No. of Pages 18
S.S. Farid et al. / Computers and Chemical Engineering xxx (2006) xxx–xxx 15
Fig. 9. Combined utilisation of media and buffer over time for (a) the stainless steel pilot plant and (b) the disposables-based pilot plant. The peaks in the stainlesssteel plant correspond to the high buffer demands in cleaning-in-place (CIP) steps, which are absent in the disposables-based plant.
Fig. 10. The frequency distribution and cumulative frequency for the annual cost of goods per gram for (a) the stainless steel plant and (b) the disposables plant. Thesolid column indicates the deterministic estimate of the cost.
l proj
ri
usmscooCda
Ti7
1
cp
Fig. 11. The frequency distribution and cumulative frequency for the annua
eorganisation of resources and tasks to maximise resource util-sation so as to improve throughput and productivity.
In this example case study, Monte Carlo simulations weresed to characterise the variability in the key performance mea-ures due to uncertainties in product titre, product demand andarket success and examine the impact on this facility deci-
ion. Examples of the financial and throughput outputs from thisase study are shown in Figs. 10 and 11. The range in possibleutcomes for the performance measures highlights the danger
Please cite this article in press as: Farid, S. S. et al., Modelling biopharmacComputers and Chemical Engineering (2006), doi:10.1016/j.compchemen
f using deterministic outputs for decision-making. From theOG/g outcomes in Fig. 10, it is possible to conclude that theisposables plant has both a lower expected cost and lower risks the outcomes are less disperse than for the stainless steel plant.
ftSt
ect throughput for (a) the stainless steel plant and (b) the disposables plant.
he disposables plant also offers a greater likelihood of achiev-ng an annual throughput of at least four projects (84% versus3%) as can be seen in Fig. 11.
1. Conclusions
The research, programming and decisions made in order toonstruct a prototype software tool, SimBiopharma, has beenresented. SimBiopharma, provides a hierarchical framework
eutical manufacture: Design and implementation of SimBiopharma,g.2006.10.020
or modelling both the technical and business perspec-ives of biopharmaceutical batch manufacturing processes.imBiopharma can describe a large number of problems facing
he industry, such as facility, process and capacity decisions. The
IN+ModelC
1 emic
hfldotamtcupIitrotemfabab
sasWTaWima
A
SgcRac
I
F
C
M
ARTICLEACE-3348; No. of Pages 18
6 S.S. Farid et al. / Computers and Ch
ierarchical approach to representing activities confers maximalexibility since it allows production strategies to be evaluated atifferent levels of detail according to the goals of the user. Thebject-oriented representation of the key objects, their proper-ies and behaviour provides full access to the base languagend hence facilitates incorporation of new or changed require-ents once implementation is underway. It also encourages
he development of well-modularised applications. The toolombines interactive graphics, animation, and dynamic sim-lation to create a more flexible environment for modellingrocesses than that found in conventional process software tools.t adopts a task-oriented approach to modelling manufactur-ng and incorporates the interactions between manufacturingasks (e.g. fermentation, chromatography) and the availableesources (e.g. manpower, materials, equipment). The task-riented approach also promotes transparency, as it is possibleo view the cost, duration and yield of each task. The tool alsoncourages the explicit modelling of ancillary tasks, e.g. equip-ent cleaning-in-place (CIP) and hence the cost models account
or items that might otherwise be overlooked. In addition, risk
Please cite this article in press as: Farid, S. S. et al., Modelling biopharmacComputers and Chemical Engineering (2006), doi:10.1016/j.compchemen
nd uncertainty are dealt with and so investment appraisal cane based on both the expected outputs and the likelihood ofchieving certain threshold values. The performance measuresuilt into the tool to evaluate manufacturing alternatives can be
AS
nputs Outputs
ermentationMass-stoichiometry coefficient, ai Outlet stream comp
Feed stream component mass, mi in Extent of reaction,
Reference component, ref
Final concentration of ref component, cref
Total volume of feed stream, Vintot ,Limiting substrate, lim
entrifugationSolids-carry-over-fraction, S Solids removal fracSolid-volume-fraction in sediment, vssed Supernatant and se
mssup , mssed
Total feed stream component masses, mintot Supernatant and semlisup , mlised
Total volume of feed stream, Vintot
Solid density, ρs
*Assumption: only 1 solid component
embrane filtration
Calculation mode: Output mode:
Membrane area per unit, A/Processing time per cycle, t Membrane area pe
Average flux, J Total processing tim
PRESSal Engineering xxx (2006) xxx–xxx
ummarised in terms of cost, time, mass, resource utilisationnd risk. This framework has been used for a series of casetudies ranging from facility decisions (Farid, Novais, Karri,ashbrook, & Titchener-Hooker, 2000; Farid, Washbrook, &
itchener-Hooker, 2005a,b), to process decisions (Mustafa etl., 2004) and capacity decisions (Lim et al., 2005; Lim, Zhou,ashbrook, Titchener-Hooker, & Farid, 2005). They serve to
llustrate how the prototype application can be used to assessanufacturing strategies in terms of their operational benefits
nd cost-effectiveness.
cknowledgements
Financial support from the Biotechnology and Biologicalciences Research Council (BBSRC) and Lonza Biologics isratefully acknowledged. The Advanced Centre for Biochemi-al Engineering at UCL houses the Innovative Manufacturingesearch Centre (IMRC) and collaborates with a range ofcademic partners and biopharmaceutical and biotechnologyompanies.
eutical manufacture: Design and implementation of SimBiopharma,g.2006.10.020
ppendix A. Key mass balance models inIMBIOPHARMA
Mass balance calculations
onent mass, mi out 1. moutref = crefVintot
x 2. x = minref − moutref
minlim
alim
aref
3. mi out = mi in − minlim xai
alim
tion, R 1. R = 1 − Sdiment solid component masses, 2. mssed = Rmsin
mssup = msin − mssed
diment liquid component masses, 3. mlin = mintot − msin
Vlin = Vintot − Vsin
ρlin = mlin
Vlin
4. Vssed = mssed
ρs
Vtotsed = Vssed
vssedVlsed = Vtotsed − Vssed
mlsed = Vlsed ρlin5. mlised , mlisup
mlised = mliin
mlinmlsed
mlisup = mliin − mlised
1. A = Vin(1 − CF−1)
Jntor
t = Vin(1 − CF−1)
JnAr unit, A/Processing time per cycle, t 2. T = nt
e, T 3. Vret = Vin
CF

ARTICLE IN PRESS+ModelCACE-3348; No. of Pages 18
S.S. Farid et al. / Computers and Chemical Engineering xxx (2006) xxx–xxx 17
Inputs Outputs Mass balance calculations
Volume of feed stream, Vin Permeate and retentate stream componentmasses, mi perm, mi ret
4. mi retRC�=0 = mi inCF(RCi−1)
Vi retRC�=0 = mi retRC�=0
ρi
No. of cycles, n 5. VretRC=0 = Vret −∑
Vi retRC �=0
Vi retRC=0 = Vi in
VinRC=0
VretRC=0
mi retRC=0 = Vi retRC=0 ρi
Concentration factor, CF 6. mi perm = mi in − mi ret
Rejection coefficient, RC
Chromatography
Column height, H Processing time per cycle, t 1. tr, r = L, W, E, tr = HCVr
urNo. of column volumes, CV Buffer volumes required, V 2. Vr = CVrVcolnLinear flow rates, u Product and waste stream masses, mi prod,
mi waste
3. Vprod = CVprodVcol
mi prodfrom L = mi Lyi
Vi prodfrom L = mi prodfrom L
ρi
Vprodfrom E = Vprod −∑
Vi prodfrom L
Vi prodfrom E = Vi E
VEVprodfrom E
mi prodfrom E = Vi prodfrom E ρi
mi prod = mi prodfrom L + mi prodfrom E
mi waste = mi L + mi W + mi E − mi prod
Column volume, Vcol
No. of cycles, nYield fraction, yProduct-stream-column-volumes, CVprod
Viral clearancestream
R
A
B
B
B
B
B
C
C
C
C
D
F
F
F
G
G
G
H
H
J
K
No of virus units in inlet stream, vrin No of virus units in outletLog clearance factor, LCF
eferences
tkinson, B., & Mavituna, F. (1991). Biochemical engineering and biotechnol-ogy handbook (2nd ed.). Basingstoke: Macmillan. New York, N.Y: StocktonPress. Chapter 19.
anks, J. (1998). Principles of simulation. In J. Banks (Ed.), Handbook of sim-ulation: Principles, methodology, advances, applications, and practice (pp.3–30). Chichester: Wiley, Engineering & Management Press.
astiaan, H. K. (1998). Process model and recipe structure. The conceptualdesign for a flexible batch plant. ISA Transactions, 36(4), 249–255.
ernstein, D. F., & Hamrell, M. R. (2000). Integrating drug supply issueswith strategic preclinical and clinical development. Drug Inf. J., 34, 909–917.
ogle, I. D. L., Cockshott, A. R., Bulmer, M., Thornhill, N., Gregory, M., &Dehgant, M. (1996). A process systems engineering view of biochemicalprocess operations. Comput. Chem. Eng., 20(6–7), 943–949.
yrom, D. (2000). Role and timing of process development for biopharmaceu-tical manufacture. Pharm. Technol. Eur. (BioPharm Eur.), 12(3), 52–56.
hadd, H. E., & Chamow, S. C. (2001). Therapeutic antibody expression tech-nology. Curr. Opin. Biotechnol., 12, 188–194.
lemento, A. (1999). New and integrated approaches to successful accelerateddrug development. Drug Inf. J., 33, 699–710.
opmann, T., Davis, G., Garnick, R., Landis, J., Lubiniecki, A., Massa, T., etal. (2001). One product, one process, one set of specifications: A provenquality paradigm for the safety and efficacy of biologic drugs. BioPharm.,14–24.
rowl, T. E. (1997). S88.01 Concepts streamline control software application
Please cite this article in press as: Farid, S. S. et al., Modelling biopharmacComputers and Chemical Engineering (2006), doi:10.1016/j.compchemen
for biotech plant. In ISA Tech/Expo Technology Update Conference Proceed-ings, 1 (2) (pp. 131–141).
atar, R. V., Cartwright, T., & Rosen, C. (1993). Process economics ofanimal cell and bacterial fermentations: A case study analysis of tPA.Bio/Technology, 11, 349–357.
K
K
, vrout 1. vrout = vrin10LCF
arid, S. S., Washbrook, J., & Titchener-Hooker, N. J. (2005a). Decision-supporttool for assessing bio-manufacturing strategies under uncertainty: Stain-less steel versus disposable equipment for clinical trial material preparation.Biotechnol. Prog., 21(2), 486–497.
arid, S. S., Washbrook, J., & Titchener-Hooker, N. J. (2005b). Combiningmultiple quantitative and qualitative goals when assessing biomanu-facturing strategies under uncertainty. Biotechnol. Prog., 21(4), 1183–1191.
arid, S., Novais, J. L., Karri, S., Washbrook, J., & Titchener-Hooker, N. J.(2000). A tool for modelling strategic decisions in cell culture manufacturing.Biotechnol. Prog., 16(5), 829–836.
osling, I. (1996). The role of computer simulation in the bioprocessing industry.BioPharm. Jan.
regersen, J. (1995). Biomedicinal product development. In H.-J. Rehm, G.Reed, A. Puhler, P. Stadler, & D. Brauer (Eds.), Biotechnology: Legal, eco-nomic and ethical dimensions vol. 12,(2nd ed., pp. 213–237). Weinheim:VCH.
ritsis, D., & Titchener-Hooker, N. J. (1989). Biochemical process simulation.In IChemE Symposium Series, 114 (pp. 69–77).
amers, M. N. (1993). Multiuse biopharmaceutical manufacturing.Bio/Technology, 561–570. May.
ayes, R. H., & Wheelwright, S. C. (1984). Restoring our competitive edge:Competing through manufacturing. New York: Chichester: Wiley.
ohnsson, C., & Arzen, K.-E. (1998). Grafchart for recipe-based batch control.Comput. Chem. Eng., 22(12), 1811–1828.
arri, S., Davies, E., Titchener-Hooker, N. J., & Washbrook, J. (2001). Biophar-maceutical process development: Part III A framework to assist decision
eutical manufacture: Design and implementation of SimBiopharma,g.2006.10.020
making. Biopharm Eur., 76–82.elley, B. D. (2001). Bioprocessing of therapeutic proteins. Curr. Opin. Biotech-
nol., 12(2), 173–174.nutilla, A., Schlenoff, C., Ray, S., Polyak, S. T., Tate, A., Cheah, S. C., et al.
(1998). Process specification language: An analysis of existing representa-

IN+ModelC
1 emic
L
L
L
L
M
M
M
M
N
N
O
P
P
P
P
P
P
P
R
S
S
S
S
S
S
S
S
V
ARTICLEACE-3348; No. of Pages 18
8 S.S. Farid et al. / Computers and Ch
tions. NISTIR 6160. Gaithersburg, MD: National Institute of Standards andTechnology.
akshmanan, R., & Stephanopoulos, G. (1998). Synthesis of operating proce-dures for complete chemical plants – I. Hierarchical structures modeling fornon-linear planning. Comput. Chem. Eng., 12(9), 985–1002.
ang, H. J. (1948). Simplified approach to preliminary cost estimates. Chem.Eng., 55, 112–113.
im, A. C., Zhou, Y., Washbrook, J., Sinclair, A., Fish, B., Francis, R., et al.(2005). Application of a decision-support tool to assess pooling strategiesin perfusion culture processes under uncertainty. Biotechnol. Prog., 21(4),1231–1242.
im, A. C., Zhou, Y., Washbrook, J., Titchener-Hooker, N. J., & Farid, S. S.(2005). A computer-aided approach to compare the production economicsof fed-batch versus perfusion culture. Biotechnol. Bioeng., 93(4), 687–697.
anivannan, M. S. (1998). Simulation of logistics and transportation systems. InJ. Banks (Ed.), Handbook of simulation: Principles, methodology, advances,applications, and practice (pp. 571–604). Chichester: Wiley Engineering &Management Press.
ison, D., & Curling, J. (2000). The industrial production costs of recombinanttherapeutic proteins expressed in transgenic corn. BioPharm., 48–54. May.
oilanen, T., & Martin, C. (1996). Financial evaluation of environmental invest-ments. Rugby, England: Institution of Chemical Engineers.
ustafa, M. A., Washbrook, J., Lim, A. C., Zhou, Y., Titchener-Hooker, N.J., & Morton, P., et al. (2004). A software tool to assist business-processdecision making in the biopharmaceutical industry. Biotechnol. Prog., 20(4),1096–1102 [Correction: Biotechnol. Prog., (2005), 21(1), 320].
elson, K. (1998). Cell culture manufacturing: An economic perspective froman engineering consultant. In US Biotechnology Symposium.
ovais, J. L., Titchener-Hooker, N. J., & Hoare, M. (2001). Economic com-parison between conventional and disposables-based technology for theproduction of biopharmaceuticals. Biotechnol. Bioeng., 75(2), 143–153.
sborne, A. (1997). Evaluation of project economic viability. UCL, UK: Pre-sented at MBI Training Programme: Design II. May.
eters, M. S., & Timmerhaus, K. D. (1991). Plant design and economics forchemical engineers. London, New York: McGraw-Hill. Chapter 6.
etrides, D. P., & Sapidou, E. S. (1997). Optimization of protein recoveryusing computer-aided process design tools. In E. Goldberg (Ed.), Hand-
Please cite this article in press as: Farid, S. S. et al., Modelling biopharmacComputers and Chemical Engineering (2006), doi:10.1016/j.compchemen
book of downstream processing. London, New York: Blackie Academic &Professional.
etrides, D. P., Calandranis, J., & Cooney, C. (1995). Computer-aided designtechniques for integrated biochemical processes. Genet. Eng. News. Sep.,10(28–29), 35.
Z
PRESSal Engineering xxx (2006) xxx–xxx
isano, G., & Wheelwright, S. C. (1995). High-tech R&D. Harvard BusinessReview, 93–105.
olakovic, M., & Mandenius, C. F. (1996). Simulation of a complex biotech-nological process using an object-oriented knowledge-based system. In A.R. Moreira, & K. K. Wallace (Eds.), Computer and information scienceapplications in bioprocess engineering (pp. 157–163). Dordrecht, London:Kluwer in cooperation with NATO Scientific Affairs Division.
ugh, G. (1998). Cell culture manufacturing: An economic perspective from acontract manufacturer’s viewpoint. In US Biotechnology Symposium.
uigjaner, L., & Espuna, A. (1998). Prospects for integrated management andcontrol of total sites in the batch manufacturing industry. Comput. Chem.Eng., 22(1–2), 87–107.
ajapakse, A., Titchener-Hooker, N. J., & Farid, S. S. (2005). Modelling of thebiopharmaceutical drug development pathway and portfolio management.Comput. Chem. Eng., 29(6), 1357–1368.
adana, A., & Beelaram, A. M. (1994). Efficiency and economics of biosepara-tion: Some case studies. Bioseparation, 4, 221–235.
avage, C. (2000). Scaleup and bioproduction. Genet. Eng. News, 1(65),80.
hanklin, T., Roper, K., Yegneswaran, P. K., & Marten, M. R. (2001). Selectionof bioprocess simulation software for industrial applications. Biotechnol.Bioeng., 72(4), 483–489.
innott, R. K. (1993). Coulson and Richardson’s chemical engineering (chem-ical engineering design (Vol. 6, pp. 209–244). Oxford: Pergamon Press.
ofer, G., & Hagel, L. (1997). Handbook of process chromatography: A guide tooptimization, scale-up, and validation. San Diego, CA, London: AcademicPress. Chapter 10.
tanley, G. M. (1994). The emerging trend towards knowledge-based frame-works for computer-integrated manufacturing. In Instrument Society ofAmerica ISA/94 Conference.
tephanopoulos, G., Ali, S., Linninger, A. A., & Salomone, E. (2000). Batchprocess development: Challenging traditional approaches. In AICHE Sym-posium Series, 96(323), 46–57.
ubrahmanyan, S., Pekny, J. F., & Reklaitis, G. V. (1996). Decompositionapproaches to batch plant design and planning. Ind. Eng. Chem. Res., 35,1866–1876.
arga, E. G., Titchener-Hooker, N. J., & Dunnill, P. (2001). Prediction of the
eutical manufacture: Design and implementation of SimBiopharma,g.2006.10.020
pilot-scale recovery of a recombinant yeast enzyme using integrated models.Biotechnol. Bioeng., 74(2), 96–107.
hou, Y. H., Holwill, I. L. J., & Titchener-Hooker, N. J. (1997). A study ofthe use of computer simulations for the design of integrated downstreamprocesses. BioProcess Eng., 16, 367–374.