ARTICLE IN PRESS - DPI - Divis??o de Processamento de … · HAND, a new terrain descriptor using...
13
HAND, a new terrain descriptor using SRTM-DEM: Mapping terra-firme rainforest environments in Amazonia Camilo Daleles Rennó a, ⁎, Antonio Donato Nobre b , Luz Adriana Cuartas a , João Vianei Soares a , Martin G. Hodnett c , Javier Tomasella a,b , Maarten J. Waterloo c a Instituto Nacional de Pesquisas Espaciais, Av. Astronautas, 1758, São José dos Campos, SP, 12227-010, Brazil b Instituto Nacional de Pesquisas da Amazonia, Escritório Regional do INPA, INPE Sigma, Av. dos Astronautas,1758, São José dos Campos, SP, 12227-010, Brazil c Vrije Universiteit Amsterdam, De Boelelaan 1105, 1081 HV Amsterdam, The Netherlands ABSTRACT ARTICLE INFO Article history: Received 29 May 2007 Received in revised form 24 March 2008 Accepted 29 March 2008 Available online xxxx Optical imagery can reveal spectral properties of forest canopy, which rarely allows for finding accurate correspondence of canopy features with soils and hydrology. In Amazonia non-floodable swampy forests can not be easily distinguished from non-floodable terra-firme forests using just bidimensional spectral data. Accurate topographic data are required for the understanding of land surface processes at finer scales. Topographic detail has now become available with the Shuttle Radar Topographic Mission (SRTM) data. This new digital elevation model (DEM) shows the feature-rich relief of lowland rain forests, adding to the ability to map rain forest environments through many quantitative terrain descriptors. In this paper we report on the development of a new quantitative topographic algorithm, called HAND (Height Above the Nearest Drainage), based on SRTM-DEM data. We tested the HAND descriptor for a groundwater, topographic and vegetation dataset from central Amazonia. The application of the HAND descriptor in terrain classification revealed strong correlation between soil water conditions, like classes of water table depth, and topography. This correlation obeys the physical principle of soil draining potential, or relative vertical distance to drainage, which can be detected remotely through the topography of the vegetation canopy found in the SRTM-DEM data. © 2008 Elsevier Inc. All rights reserved. 1. Introduction Tropical terrain covered by rainforest presents rich mosaics of very distinctive environments, often hidden from remote view. The overwhelming challenge of describing 5.5 million km 2 of such environments and associated dense, tall and closed-canopy vegetation in Amazonia has made its complete inventory a seemingly impractic- able task. Passive optical remote sensing imagery (such as Landsat and CBERS) can reveal spectral properties of forest canopy with detail (e.g. Wulder, 1998), but rarely allows for finding accurate correspondence of canopy features with soils and local hydrology. In Amazonia even seasonally flooded tropical forests could not be easily spotted and distinguished from non-floodable terra-firme forests using this type of data (Novo et al., 1997). The usually flat optical imagery can hint at relief through either bright or shadow reflection artifacts on the slope pixels of steeper areas, or where spectral signatures of the vegetation are distinctive because of local environmental effects (Guyot et al., 1989; Novo et al., 1997; Nobre et al., 1998), but without stereo images it lacks the ability to describe relief quantitatively. Optical stereo images (e.g. obtained from ASTER or SPOT) can be used to produce digital elevation models (DEM). However, the cost and difficulty of obtaining cloud-free coverage for many areas of the world, com- pounded with the requirement of sun angles below 25° (from Nadir) to avoid long shadows (Jacobsen, 2003), has limited the possibilities for producing DEMs of large, continuous areas (Hirano et al., 2003). In addition, because ground truth accessibility to large areas is limited, many aspects of landscape complexity in those vast tropical surfaces remain shrouded in mystery. However, some of these drawbacks are quickly being overcome with imagery from active space borne sensors, such as synthetic aperture radars (SAR). Canopy penetrating L-Band SAR imagery from the Japanese Earth Resources Satellite (Siqueira et al., 2000) revealed with unprecedented detail patches of flooded vegetation (Barbosa et al., 2000; Melack and Hess, 2004). Careful mapping of such previously hidden seasonally flooded biomes has suggested their occurrence over a far wider area than formerly believed (Siqueira et al., 2003; Hess et al., 2003). Accurate topographic data are required for the understanding of land surface processes at finer scales. Topographic detail has now become available on a global scale through the C-Band SAR imagery (van Zyl, 2001) of the Shuttle Radar Topographic Mission (SRTM). The spaceborne SRTM circled the globe over a wide swath covering all the tropics and more, generating radar Remote Sensing of Environment xxx (2008) xxx-xxx ⁎ Corresponding author. Tel.: +55 12 39456521; fax: +55 12 39456468. E-mail address: [email protected] (C.D. Rennó). RSE-07152; No of Pages 13 0034-4257/$ – see front matter © 2008 Elsevier Inc. All rights reserved. doi:10.1016/j.rse.2008.03.018 Contents lists available at ScienceDirect Remote Sensing of Environment journal homepage: www.elsevier.com/locate/rse ARTICLE IN PRESS Please cite this article as: Rennó, C. D., et al., HAND, a new terrain descriptor using SRTM-DEM: Mapping terra-firme rainforest environments in Amazonia, Remote Sensing of Environment (2008), doi:10.1016/j.rse.2008.03.018
Transcript of ARTICLE IN PRESS - DPI - Divis??o de Processamento de … · HAND, a new terrain descriptor using...

Remote Sensing of Environment xxx (2008) xxx-xxx
RSE-07152; No of Pages 13
Contents lists available at ScienceDirect
Remote Sensing of Environment
j ourna l homepage: www.e lsev ie r.com/ locate / rse
ARTICLE IN PRESS
HAND, a new terrain descriptor using SRTM-DEM: Mapping terra-firme rainforestenvironments in Amazonia
Camilo Daleles Rennó a,⁎, Antonio Donato Nobre b, Luz Adriana Cuartas a, João Vianei Soares a,Martin G. Hodnett c, Javier Tomasella a,b, Maarten J. Waterloo c
a Instituto Nacional de Pesquisas Espaciais, Av. Astronautas, 1758, São José dos Campos, SP, 12227-010, Brazilb Instituto Nacional de Pesquisas da Amazonia, Escritório Regional do INPA, INPE Sigma, Av. dos Astronautas, 1758, São José dos Campos, SP, 12227-010, Brazilc Vrije Universiteit Amsterdam, De Boelelaan 1105, 1081 HV Amsterdam, The Netherlands
⁎ Corresponding author. Tel.: +55 12 39456521; fax: +E-mail address: [email protected] (C.D. Rennó).
0034-4257/$ – see front matter © 2008 Elsevier Inc. Aldoi:10.1016/j.rse.2008.03.018
Please cite this article as: Rennó, C. D., et al.in Amazonia, Remote Sensing of Environmen
A B S T R A C T
A R T I C L E I N F OArticle history:
Optical imagery can reveal Received 29 May 2007Received in revised form 24 March 2008Accepted 29 March 2008Available online xxxxspectral properties of forest canopy, which rarely allows for finding accuratecorrespondence of canopy features with soils and hydrology. In Amazonia non-floodable swampy forests cannot be easily distinguished from non-floodable terra-firme forests using just bidimensional spectral data.Accurate topographic data are required for the understanding of land surface processes at finer scales.Topographic detail has now become available with the Shuttle Radar Topographic Mission (SRTM) data. Thisnew digital elevation model (DEM) shows the feature-rich relief of lowland rain forests, adding to the abilityto map rain forest environments through many quantitative terrain descriptors. In this paper we report onthe development of a new quantitative topographic algorithm, called HAND (Height Above the NearestDrainage), based on SRTM-DEM data. We tested the HAND descriptor for a groundwater, topographic andvegetation dataset from central Amazonia. The application of the HAND descriptor in terrain classificationrevealed strong correlation between soil water conditions, like classes of water table depth, and topography.This correlation obeys the physical principle of soil draining potential, or relative vertical distance todrainage, which can be detected remotely through the topography of the vegetation canopy found in theSRTM-DEM data.
© 2008 Elsevier Inc. All rights reserved.
1. Introduction
Tropical terrain covered by rainforest presents rich mosaics of verydistinctive environments, often hidden from remote view. Theoverwhelming challenge of describing 5.5 million km2 of suchenvironments and associated dense, tall and closed-canopy vegetationin Amazonia has made its complete inventory a seemingly impractic-able task. Passive optical remote sensing imagery (such as Landsat andCBERS) can reveal spectral properties of forest canopy with detail (e.g.Wulder, 1998), but rarely allows for finding accurate correspondenceof canopy features with soils and local hydrology. In Amazonia evenseasonally flooded tropical forests could not be easily spotted anddistinguished fromnon-floodable terra-firme forests using this type ofdata (Novo et al., 1997). The usually flat optical imagery can hint atrelief through either bright or shadow reflection artifacts on the slopepixels of steeper areas, or where spectral signatures of the vegetationare distinctive because of local environmental effects (Guyot et al.,1989; Novo et al., 1997; Nobre et al., 1998), but without stereo imagesit lacks the ability to describe relief quantitatively. Optical stereo
55 12 39456468.
l rights reserved.
, HAND, a new terrain descript (2008), doi:10.1016/j.rse.20
images (e.g. obtained from ASTER or SPOT) can be used to producedigital elevation models (DEM). However, the cost and difficulty ofobtaining cloud-free coverage for many areas of the world, com-pounded with the requirement of sun angles below 25° (from Nadir)to avoid long shadows (Jacobsen, 2003), has limited the possibilitiesfor producing DEMs of large, continuous areas (Hirano et al., 2003). Inaddition, because ground truth accessibility to large areas is limited,many aspects of landscape complexity in those vast tropical surfacesremain shrouded in mystery.
However, some of these drawbacks are quickly being overcomewith imagery from active space borne sensors, such as syntheticaperture radars (SAR). Canopy penetrating L-Band SAR imagery fromthe Japanese Earth Resources Satellite (Siqueira et al., 2000) revealedwith unprecedented detail patches of flooded vegetation (Barbosaet al., 2000; Melack and Hess, 2004). Careful mapping of suchpreviously hidden seasonally flooded biomes has suggested theiroccurrence over a far wider area than formerly believed (Siqueiraet al., 2003; Hess et al., 2003). Accurate topographic data are requiredfor the understanding of land surface processes at finer scales.Topographic detail has now become available on a global scalethrough the C-Band SAR imagery (van Zyl, 2001) of the Shuttle RadarTopographic Mission (SRTM). The spaceborne SRTM circled the globeover a wide swath covering all the tropics and more, generating radar
tor using SRTM-DEM: Mapping terra-firme rainforest environments08.03.018

Fig. 1. Hydrological connection between points A and B. Red line indicates the profileshown above, blue lines represent the drainage network and the arrows indicate flowdirection. B and C are points on streams. (For interpretation of the references to colourin this figure legend, the reader is referred to the web version of this article.)
2 C.D. Rennó et al. / Remote Sensing of Environment xxx (2008) xxx-xxx
ARTICLE IN PRESS
data that allowed for the digital reconstruction of the surface relief,producing the DEM. The SRTM-DEM data, with a horizontal resolutionof 3” (~90 m near the equator) and a vertical resolution of 1 m,constitutes the finest resolution and most accurate topographic dataavailable for most of the globe. Detailed information on the accuracyand performance of SRTM can be found in Rodriguez et al. (2006). Incontrast to the passive optical imagery, this new DEM shows thefeature-rich relief of lowland rain forests, adding to the ability toidentify and map rain forest environments through many quantitativeterrain descriptors.
A range of topographic algorithms are available, which allowvarious quantitative relief features to be obtained from the DEM. Slopeand aspect (e.g. Jenson and Domingue, 1988), and drainage networkand catchment area (e.g. Curkendall et al., 2003) are a few classicaldescriptors. A range of hydrological parameters such as superficialrunoff trajectories, accumulated contributing area and groundwaterrelated variables (e.g. Tarboton, 2003) add to the suite of reliefdescriptors. Relief shape parameters such as curvatures and formfactors can also be calculated (Valeriano et al., 2006). The thirddimension in a DEM, height, is obviously the key parameter, used tosome degree in the derivation of all of the previously mentioneddescriptors. Absolute height (above sea level— ASL) can be used on itsown as a relief descriptor, as large scale geomorphologic features tendto be associated with altitude relevant geological control (Goudie,2004). Upon flooding a given catchment for hydro dam development,for example, the height ASL is the descriptor that will predict the reachof the impoundment. However, when local environments in the finescale relief are considered, height ASL has little, if any, descriptivepower. As a result, local scale environments, although of conspicuousimportance and clearly defined by characteristic terrain topographythat is clearly visible on the SRTM-DEM, have not so far had a gooddescriptor.
In this paper we present the development of a new quantitativetopographic algorithm based on SRTM-DEM data. We crafted andtested the terrain descriptor, applying it for a groundwater, topo-graphic and vegetation dataset from central Amazonia, using groundcalibrated terrain classes for mapping the study area.
2. Algorithm development
2.1. Conditioning procedures
The new descriptor algorithm requires a hydrologically coherentDEM as input, with resolved depressions (sinks), computed flowdirections for each grid point and a defined drainage network. Theprocedures to develop these are presented below.
2.1.1. Fixing DEM topology and computing flow directionsTopography is a hydrologic driver since it defines the direction and
speed of flows. Flow directions define hydrological relations betweendifferent points within a basin. Topological continuity for the flowdirections is therefore necessary for a functional drainage to exist.Hydrological connections by flow direction between two points on asurface are not the same as those based on Euclidian distances. As seenin Fig. 1, point A is spatially closer to C, but it is hydrologically connectedto point B because superficial water (runoff) will flow towards the latter.
The flow directions can be represented using different approaches(Zhou and Liu, 2002). For a DEM represented by a grid, the simplestand most widely used method for determining flow directions isdesignated D8 (eight flow directions) initially proposed by O'Calla-ghan andMark (1984). In this method, the flow from each grid point isassigned to one of its eight neighbors, towards the steepest downwardslope. The result is a grid called LDD (Local Drain Directions), whosevalues clearly represent the link to the downhill neighbor. A pit isdefined as a point none of whose neighbors has a lower elevation. Fora pit, the flow direction is undefined.
Please cite this article as: Rennó, C. D., et al., HAND, a new terrain descripin Amazonia, Remote Sensing of Environment (2008), doi:10.1016/j.rse.20
Defining G as a set of pairs of Cartesian coordinates of a grid with ccolumns and r rows,
G ¼ hi; jiji ¼ 1; c½ �oN; j ¼ 1; r½ �oNf g; ð1Þwe can represent LDD as a function that associates to each grid pointhi,ji the flow direction LDD(hi,ji) which can assume a value accordingto its orientation: N, NE, E, SE, S, SW, W, NW or null. The null value isassigned to all points with undefined flow direction (pits).
The real hydrological meaning of the LDD depends on the quality ofthe DEM. The C Band interacts strongly with the vegetation with theresult that the actual topography represented in the SRTM data isroughly that of the upper canopy (Valeriano et al., 2006). Therefore,for areas where the soil surface is covered by dense or tall vegetation itmust be expected that a variable degree of relief masking occurs in theSRTM data (Kellndorfer et al., 2004), producing pits and extensiveunresolved flat areas. Some of these features can be real properties ofthe relief, but often they represent artifacts in the data. SRTM data,perhaps because of radar speckle (noise) or vegetation effects, havemore spurious points than other DEMs (Curkendall et al., 2003).Besides, forests have characteristic sylvigenetic dynamics with arelatively high occurrence of tree gaps (Oldeman, 1990), which willappear in the SRTM-DEM as depressions. Such depressions, if theyoccur on a stream, for example, create false interruptions in thetopological continuity of that drainage (apparent impounding).Another particular feature of SRTM data is related to abrupttransitions of vegetation types or land uses where vegetation issuddenly absent, revealing the soil surface in a patchy manner.
According to Lindsay and Creed (2005), the depression artifactsarising from underestimation of elevation should be filled and thefeatures caused by elevation overestimation should be corrected bybreaching. In general, filling methods involve raising the inner area ofa depression to the elevation of its outlet point, defined as a pointthrough which water could leave the depression. The outlet is usually
tor using SRTM-DEM: Mapping terra-firme rainforest environments08.03.018

3C.D. Rennó et al. / Remote Sensing of Environment xxx (2008) xxx-xxx
ARTICLE IN PRESS
defined as the lowest point along the border of the depression basin.On the other hand, breaching methods create an artificial channellowering some points across a divide in order to connect two neigh-boring depressions.
In this work, both sink and flat areas were eliminated by using aprocess similar to depression breaching suggested by O'Callaghan andMark (1984), Band (1986) and Jenson and Domingue (1988). Althoughdepression breaching can create strong anomalies at the edge of theartificial drainage channels, it produces the least amount of change onmost of the remaining points of the DEM. Fig. 2 exemplifies theapproach used in the DEM fixing process. The first step is to delimitthe sink area (or closed basin) to be corrected based on the LDDobtained from the original DEM. Note that there are two sink areas inthis example (52 and 50 elevation, the pits in darker hues). Next, theoutlets of these sinks, generally falling on a saddle in the relief, are
Fig. 2. DEM fixing process. Red arrows indicate flow directions changed during correction. (Fothe web version of this article.)
Please cite this article as: Rennó, C. D., et al., HAND, a new terrain descripin Amazonia, Remote Sensing of Environment (2008), doi:10.1016/j.rse.20
identified (here, 55 for the first pit). This outlet point will be theneighbor of the lowest point along the limits of the adjacent sink area(54). A topological trajectory passing through the outlet andconnecting the two pits is then generated. Taking into account thedistance between the two extremities, the new elevation of everypoint along this trajectory for cutting the hill or breaching is calculatedby a linear interpolation. The result is a new functional flow path thateliminates one sink. Finally, a coherent new LDD is obtained based onthis corrected DEM.
2.1.2. Computing drainage networkMany methods of automatic extraction of drainage networks from
DEMs have been developed. Soille et al. (2003) grouped the drainageextraction algorithms into two classes, the first based on morpholo-gical features and the second on hydrological terrain characteristics.
r interpretation of the references to colour in this figure legend, the reader is referred to
tor using SRTM-DEM: Mapping terra-firme rainforest environments08.03.018

Table 1Δ Function definition
Flow direction Δ (Flow direction)
N h0,−1iNE h1,−1iE h1,0iSE h1,1iS h0,1iSW h−1,1iW h−1,0iNW h−1,−1iNull h0,0i
4 C.D. Rennó et al. / Remote Sensing of Environment xxx (2008) xxx-xxx
ARTICLE IN PRESS
Montgomery and Dietrich (1988) discussed the criteria to predict thepoint where channels should begin (headwater). One of the firstprocedures for delineating drainage networks (O'Callaghan and Mark,1984) used a minimum contributing area threshold to identifychannel beginning. The drainage network is thus defined by thosegrid points that have a contributing area greater than a giventhreshold. The contributing area is computed by counting the numberof points whose flow paths converge to the considered point.
Considering a given point h i, j i, we can determine its neighborhoodas
N hi; jið Þ ¼ hk; liaGjk ¼ i� 1; i; i� 1f g; l ¼ j� 1; j; jþ 1f g; hk; liphi; jif gð2Þ
The points inN(hi, ji) are called the neighbors of h i, j i. If pointh i, j i isnot on the border grid (i≠1, i≠c, j≠1 and j≠r), then it has 8 neighbors,that is
N hi; jið Þ ¼ fhi� 1; j� 1i; hi� 1; ji; hi� 1; jþ 1i; hi; j� 1i; hi; jþ 1i;hiþ 1; j� 1i; hiþ 1; ji; hiþ 1; jþ 1ig
ð3Þ
otherwise, it will have less than 8 neighbors.Based on the D8 method, the point hi, ji can be hydrologically
connected to only one of its neighbors. If F(hi, ji) is the point towhich hi, jiflows, it can be defined as:
F hi; jið Þ ¼ hi; ji þ D LDD hi; jið Þð Þ ð4Þ
where Δ is a function that represents the relative position hΔi,Δjibetween two hydrologically connected points. Table 1 shows thecorrespondence between the flow directions and the relative posi-tions. Note that if point hi, ji is a pit, then F(hi, ji)= hi, ji.
The contributing area of point hi, ji, defined as A(hi, ji), is computedthrough an iterative process.
Let At(hi, ji) be the contributing area of the point hi, ji in the tth
iteration. In the first iteration (t=1)
A1 hi; jið Þ ¼ 1 ifhi; jigF Gð Þ0 otherwise
�ð5Þ
where F(G) represents the set of all upward points connected to anygiven point, that is
F Gð Þ ¼ hk; liaGjahi; jiaN hk; lið ÞjF hi; jið Þ ¼ hk; lif g: ð6Þ
In this first iteration, the contributing area of all points that initiatea flow path is equal to one.
For the other iterations (tN1)
At hi; jið Þ ¼At�1 hi; jið Þ if At�1 hi; jið Þp01þP
F−1 hi;jið Þ At�1 hk; lið Þ if 0gAt�1 F�1 hi; jið Þ� �
0 otherwise
8<: ð7Þ
Please cite this article as: Rennó, C. D., et al., HAND, a new terrain descripin Amazonia, Remote Sensing of Environment (2008), doi:10.1016/j.rse.20
where F−1(hi, ji) represents a set of all neighbors of point hi, ji that flowto it, that is
F�1 hi; jið Þ ¼ hk; liaN hi; jið ÞjF hk; lið Þ ¼ hi; jif g ð8Þ
The iterationprocess stops (t=n)when, for any point hi, ji,At−1(hi, ji)≠0,that is, A(hi, ji)=An(hi, ji).
The method based on the contributing area is very easy toimplement and therefore widely used. Tarboton (2003) pointed outthat a significant question with this method is the choice ofcontributing area threshold. The basic hypothesis is that channelheads, where there is a transition from convex to concave profiles, isalso where concentrated fluxes begins to dominate over diffusivefluxes (Tarboton et al., 1991, 1992). Some authors have called forobjective criteria to define channel heads, such as the relationshipbetween slope and contributing area (Tarboton et al., 1991). Others uselocal curvatures to account for spatially variable drainage densities(Tarboton and Ames, 2001). Montgomery and Foufoula-Georgiou(1993) compared the constant contributing area with the slope-dependent contributing area. Although these approaches representprogress towards the automatic determination of channel heads, thetests we conducted for Central Amazonia showed that the applicationof these methodologies to SRTM data did not estimate drainagedensity properly. We suspect that vegetation masking groundtopography may be the explanation. For this reason, we decided touse the contributing area threshold as one of the main criteria todefine the drainage network, validating channel heads with field data.To define the channel heads we used an additional criteria based onsimplifications of horizontal and vertical geomorphic curvatures.Firstly, the channel head element should represent a convergent point,meaning it should have two ormore overland flux paths converging toit (horizontal curvature). Secondly, the channel profile should beconcave, i.e. where the channel head profile point has a smallerchange of elevation than the mean of the elements located uphill anddownhill of it (vertical curvature).
2.2. The height above the nearest drainage terrain descriptor
To quantify relevant parameters that could uniquely identify general-izable spatial properties of hill slopes there was the need to have a localframe of variable topographic reference that should bemore useful thanthe all encompassing and generic height ASL, or the third dimension inthe DEM. Horizontal distances of DEM grid points to connected drainagechannels (slope length) have been computed by a number of approaches(e.g. Tucker et al., 2001). As the initial interest in this studywas to predictpotential hydrological properties for each DEM grid point, especially thedepth to the permanently saturated zone, this approach wasn't useful.The gravitational potential energy difference between any given gridpoint and theother extremity of thehill slopeflowpath, at the functionalstream outlet (explicit in the LDD), defines a unique and permanentproperty of that grid point that we call draining potential. The verticaldistance of a given grid point to its drainage outlet (which ishydrologically important) can in most cases be expressed as a relativeheight, or the height difference between those points. Thus therewill beno gravitationally driven water movement between two hydrologicallyconnected points that share the same height. Classifying all grid pointsaccording to their respective draining potentials allows them to begrouped into classes of equipotential (equivalent draining gravitationalpotential), defining environments or zones with inferred similarhydrological properties. The linking of every grid point to its outlet onthe drainage system allows for the whole DEM to be normalized for thedrainage network (adjusting point heights in relation to the drainage),which in this way becomes a distributed frame of topographic reference.
If D is a set of drainage network points, identified by a numberthrough a bijective function in order that each point of the drainage
tor using SRTM-DEM: Mapping terra-firme rainforest environments08.03.018

Fig. 3. Procedure to calculate the HAND grid. BBBBlue squares represent grid points belonging to the drainage network. Only black arrows are considered as flow paths.
5C.D. Rennó et al. / Remote Sensing of Environment xxx (2008) xxx-xxx
ARTICLE IN PRESS
network be identified by a unique identification number k a N⁎. Wedefine that
D hi; jið Þ ¼ k if hi; ji is a drainage network point0 otherwise
�ð9Þ
and its inverse function as
D�1 kð Þ ¼ hi; jiaGjD hi; jið Þ ¼ kf g: ð10Þ
Following respective flow paths, each and every point in the grid isnecessarily connected to a drainage point. Let I(hi, ji) be the functionthat identifies the drainage point connected to the point hi, ji. Thisfunction is computed through an iterative process and the result is agrid that associates the identification number of the drainage pointthat each point is connected to. If It(hi, ji) is the drainage identificationnumber of the point hi, ji in the tth iteration. In the first iteration (t=1),
I1 hi; jið Þ ¼ D hi; jið Þ: ð11Þ
For the other iterations (tN1)
It hi; jið Þ ¼It�1 hi; jið Þ if It�1 hi; jið Þp0It�1 F hi; jið Þð Þ if It�1 F hi; jið Þð Þp00 otherwise:
8<: ð12Þ
The iteration process stops (t=m) when, for any point hi, ji, It(hi, ji)≠0,that is,
I hi; jið Þ ¼ Im hi; jið Þ: ð13Þ
Assuming that all points belong to a flow path and that all flowpaths are associated to respective drainage points, we define theHAND value of any given point hi, ji as
HAND hi; jið Þ ¼ H hi; jið Þ � HD hi; jið Þ if HD hi; jið ÞbH hi; jið Þ0 otherwise
�ð14Þ
Please cite this article as: Rennó, C. D., et al., HAND, a new terrain descripin Amazonia, Remote Sensing of Environment (2008), doi:10.1016/j.rse.20
where H(hi, ji) represents the height of the point hi, ji given by theoriginal DEM and HD(hi, ji) is the height of drainage point hydro-logically connected to point hi, ji following the flow path, that is,
HD hi; jið Þ ¼ H D�1 I hi; jið Þð Þ� �: ð15Þ
It is important to note that if the point i,j is a point belonging tothe drainage, then
I hi; jið Þ ¼ D hi; jið Þ ð16Þ
D�1 Ihi; jið Þ ¼ hi; ji ð17Þ
HD hi; jið Þ ¼ H hi; jið Þ ð18Þand so
HAND hi; jið Þ ¼ H hi; jið Þ � H hi; jið Þ ¼ 0: ð19Þ
In other words, all grid points belonging to the drainage networkare zeroed in height, which implies that the draining potential(according with the HAND definition) along the stream channel isdisregarded. Although the drainage channel is also a flow path, whicheffectively drains, the HAND descriptor uses the whole channel as aflat relative topographic reference, the end of all non channel flowpaths. By definition, the HAND drainage outlet grid point is the nearestdraining point to itself, therefore it can only be subtracted from itself.
It is important to note that the breaching process, required to reach atopologically sound and accurate drainage network, introduces occa-sional canyon like artifacts into the DEM, as a result of aberrant heightdifferences adjacent to the drainage network. These artifacts would betransferred to the HAND grid if it were computed from the correctedDEM. When using original SRTM data for the HAND grid computation,some associations prescribed by the corrected drainage connection gridresult in small negative differences that could be interpreted as points
tor using SRTM-DEM: Mapping terra-firme rainforest environments08.03.018
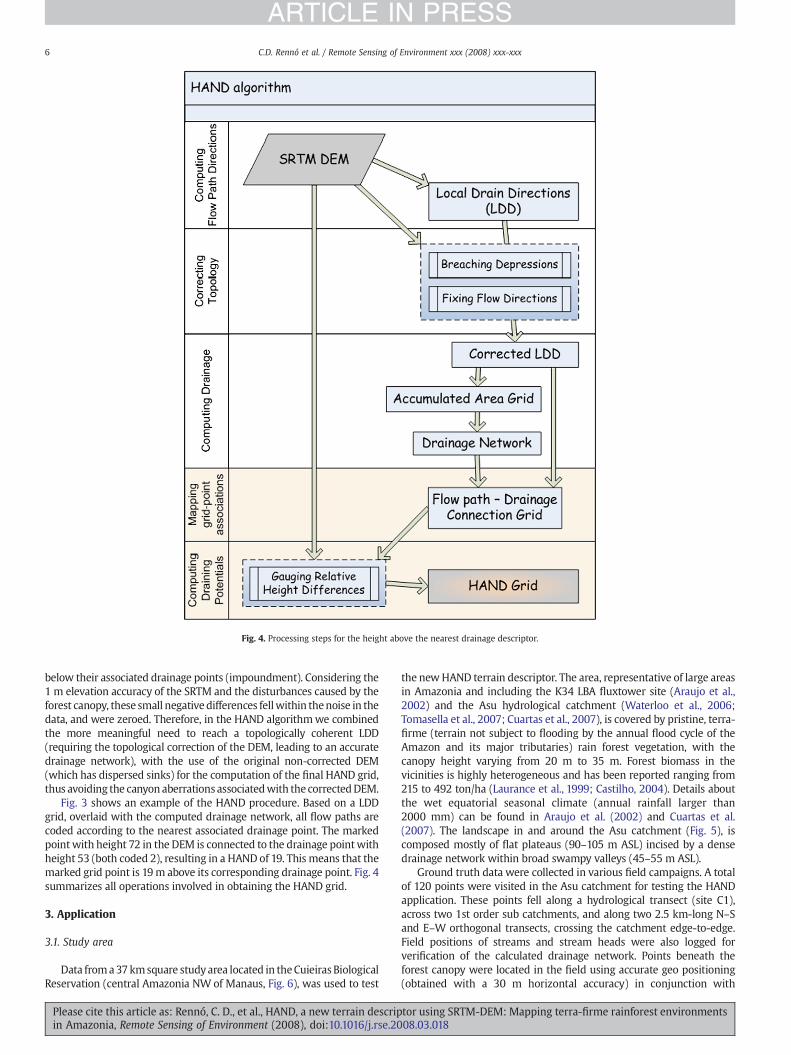
Fig. 4. Processing steps for the height above the nearest drainage descriptor.
6 C.D. Rennó et al. / Remote Sensing of Environment xxx (2008) xxx-xxx
ARTICLE IN PRESS
below their associated drainage points (impoundment). Considering the1 m elevation accuracy of the SRTM and the disturbances caused by theforest canopy, these small negative differences fellwithin thenoise in thedata, and were zeroed. Therefore, in the HAND algorithmwe combinedthe more meaningful need to reach a topologically coherent LDD(requiring the topological correction of the DEM, leading to an accuratedrainage network), with the use of the original non-corrected DEM(which has dispersed sinks) for the computation of the final HAND grid,thus avoiding the canyon aberrations associatedwith the correctedDEM.
Fig. 3 shows an example of the HAND procedure. Based on a LDDgrid, overlaid with the computed drainage network, all flow paths arecoded according to the nearest associated drainage point. The markedpointwith height 72 in the DEM is connected to the drainage pointwithheight 53 (both coded 2), resulting in a HAND of 19. This means that themarked grid point is 19m above its corresponding drainage point. Fig. 4summarizes all operations involved in obtaining the HAND grid.
3. Application
3.1. Study area
Data froma37kmsquare studyarea located in theCuieirasBiologicalReservation (central Amazonia NW of Manaus, Fig. 6), was used to test
Please cite this article as: Rennó, C. D., et al., HAND, a new terrain descripin Amazonia, Remote Sensing of Environment (2008), doi:10.1016/j.rse.20
the newHAND terrain descriptor. The area, representative of large areasin Amazonia and including the K34 LBA fluxtower site (Araujo et al.,2002) and the Asu hydrological catchment (Waterloo et al., 2006;Tomasella et al., 2007; Cuartas et al., 2007), is covered by pristine, terra-firme (terrain not subject to flooding by the annual flood cycle of theAmazon and its major tributaries) rain forest vegetation, with thecanopy height varying from 20 m to 35 m. Forest biomass in thevicinities is highly heterogeneous and has been reported ranging from215 to 492 ton/ha (Laurance et al., 1999; Castilho, 2004). Details aboutthe wet equatorial seasonal climate (annual rainfall larger than2000 mm) can be found in Araujo et al. (2002) and Cuartas et al.(2007). The landscape in and around the Asu catchment (Fig. 5), iscomposed mostly of flat plateaus (90–105 m ASL) incised by a densedrainage network within broad swampy valleys (45–55 m ASL).
Ground truth data were collected in various field campaigns. A totalof 120 points were visited in the Asu catchment for testing the HANDapplication. These points fell along a hydrological transect (site C1),across two 1st order sub catchments, and along two 2.5 km-long N–Sand E–W orthogonal transects, crossing the catchment edge-to-edge.Field positions of streams and stream heads were also logged forverification of the calculated drainage network. Points beneath theforest canopy were located in the field using accurate geo positioning(obtained with a 30 m horizontal accuracy) in conjunction with
tor using SRTM-DEM: Mapping terra-firme rainforest environments08.03.018

Fig. 5. Study area NWofManaus. (a) Landsat TM 5,4,3 (RGB) 2001, (b) SRTM-DEM, showing rich details in the forest topography. Flood lands in the SRTM-DEM, identified using JERS-1data (Melack and Hess, 2004), were removed from the analysis of this study (masked in black).
7C.D. Rennó et al. / Remote Sensing of Environment xxx (2008) xxx-xxx
ARTICLE IN PRESS
vegetation and soil pattern evaluation, aided by subsurface water tabledepth data (multiyear time series, logged by an irregular samplingnetwork of 27 piezometers installed in valleys, major stream heads, andalong a hillslope hydrological transect). Hydrological details about theAsu instrumented catchment can be found in Tomasella et al. (2007).Non-floodable local environments were clearly identified in the fieldthrough topography, vegetation, soils and hydrological cues.
3.2. Results
The SRTM data for the study area were corrected in order doproduce the hydrologically coherent LDD. Using this corrected LDD,the contributing area grid was computed and with it the drainagenetwork was derived, using a selected contributing area threshold.The HAND grid was then obtained using this drainage as reference.The results of these steps are presented below.
3.2.1. Drainage network sensitivityDrainage density is an important parameter for the accuracy of the
HAND descriptor. Fig. 6 shows networks extracted from the SRTM datausing three different contributing area thresholds. For the HAND
Fig 6. Contributing area (left) and drainage networks plotted on SRTM imag
Please cite this article as: Rennó, C. D., et al., HAND, a new terrain descripin Amazonia, Remote Sensing of Environment (2008), doi:10.1016/j.rse.20
descriptor, the contributing area is the tunable parameter. Note thatthe lower the threshold, the higher the density of the resulting drainagenetwork. Automatic extraction of the drainage network from a DEM stilllacks competence to represent channel heads realistically and withrobustness, which requires field verification for an appropriatedrepresentation of drainage density. The ground truth for channel headscarried out in this study indicated that the contributing area threshold of50 grid points produces the most accurate drainage network density.
From an exploratory analysis of the relationship between drainagedensity and contributing area threshold, we found that varying thresh-oldswithin the range of 47 through92did not change channel hierarchyat a verification point in a 3rd order stream. Smaller or larger thresholdsproduced higher or lower orders respectively. Fig. 7 shows the impact ofthese three contributingarea thresholds (47, 50and92), plus two chosenextreme points (5 and 500) on the HAND grid distribution of heights.The skewness in the HAND distribution of heights is directly propor-tional to the smoothness of the HAND grid. Higher frequencies of thesmall HAND values, for example, result in a smoother topography of theHAND grid, which implies a lower ability to distinguish and resolvecontrasting local environments. If the calculated drainage networkremains within the range that realistically captures the order hierarchy
e, with varying contributing area thresholds (in number of grid points).
tor using SRTM-DEM: Mapping terra-firme rainforest environments08.03.018

Fig. 7. Sensitivity of the HAND grids based on different drainages with varying contributing areas.
8 C.D. Rennó et al. / Remote Sensing of Environment xxx (2008) xxx-xxx
ARTICLE IN PRESS
of the drainage network, then the effect of slightly varying channelheads on the HAND grid (and therefore on other estimations based onit), will not be significantly great. In a forthcoming paper we report thisto be a robust result, verified for awider area around the Asu catchment.But for other areaswith distinct geomorphologies thisfinding still needsverification.
Fig. 8. HAND grid DEM (using 50 grid points t
Please cite this article as: Rennó, C. D., et al., HAND, a new terrain descripin Amazonia, Remote Sensing of Environment (2008), doi:10.1016/j.rse.20
3.2.2. The HAND grid DEMFig. 8 shows a HAND grid shaded relief of the test area. Altimetric
differences along the drainage channels are no longer visible as theywere in the original DEM (Fig. 5b). The capacity of the HANDdescriptor to make evident locally significant terrain-controllingfactors is apparent.
hreshold for drainage contributing area).
tor using SRTM-DEM: Mapping terra-firme rainforest environments08.03.018

Fig. 9. Profile comparing original SRTM data and the HAND grid normalized for thedrainage network.
Fig. 11. Box-plot of HAND for ground truth points: 36 points from the hydrologicaltransect, 84 spread out within the Igarapé Asu catchment, with water table inferredfrom data of 27 piezometers.
9C.D. Rennó et al. / Remote Sensing of Environment xxx (2008) xxx-xxx
ARTICLE IN PRESS
The main difference between the original SRTM-DEM and theHAND grid DEM (Fig. 9) lies in the effect of the topographicnormalization for the drainage network. In fact, the HAND gridconverts into absolute the relative nature of the distributed frame oftopographic reference in the drainage network. Thus, although theHAND grid loses the height reference to sea level, it enhancesmeaningful local relative variations in height. This local relevance isespecially useful because height differences now found in the HANDgrid have hydrological significance, and can potentially revealpreviously hidden local environments.
3.2.3. Mapping local environmentsTheHAND algorithmcan be applied to the SRTM-DEMof any terrain,
producing HAND grid DEMs with implicit geomorphologic and hydro-logical meaning. However, the significance in practical applications is
Fig. 10. a) Cross-section of the Igarapé Asu hydrological hillslope transect (from A to A') withof ground truth points onto SRTM-based HAND grid DEM (grayscale, with top contour lines
Please cite this article as: Rennó, C. D., et al., HAND, a new terrain descripin Amazonia, Remote Sensing of Environment (2008), doi:10.1016/j.rse.20
provided by finding HAND classes (ranges of heights) that match withrelevant soil water and land cover characteristics. For this application,the most detailed field data was produced along the hydrologicaltransect (Fig. 10), running orthogonally from the top of the K34fluxtower plateau to the 2nd order Asu stream (Hodnett et al., inpreparation). This transect encompassed and represented all topo-graphic features for the area, containing measurement and samplingpoints for soil water, vegetation, soil and topographic ground truthverification.
The vertical cross-section of the hydrological transect (Fig. 10a),reveals the relation of the HAND grid profile with the surveyed groundtopography and water table data. Note the convergence of the watertable with the topography in the lowland, towards the stream. Note alsothat the HAND grid profile hovers above the ground topography by thedistance of the forest vegetation height (the C-band radar data from theSRTM interacted strongly with the forest canopy). Local environmentsand their relative extents were defined by matching ground truth ofvegetation and topographywith groundwaterdata. These environmentswere easily recognized in the field by pattern observation, and wereclassified as waterlogged (considering only the zone where soil isperennially saturated to the surface), ecotone (shallow water table,usually covered byCampinarana – sensu, Anderson et al.,1975) or upland
HAND grid profile superimposed on ground topography and water table data. b) Overlayin red) along the hillslope hydrological transect (from A to A').
tor using SRTM-DEM: Mapping terra-firme rainforest environments08.03.018

Fig. 12. Four-class HAND map overlaid with ground truth points to site C1.
10 C.D. Rennó et al. / Remote Sensing of Environment xxx (2008) xxx-xxx
ARTICLE IN PRESS
(deep water table). The last category was arbitrarily split into slope(upland with slope N3°) and plateau (flat upland).
The overlaying of the ground truth points onto the HAND grid(Fig. 10b) suggests a coherent matching between local environmentsidentified in the field and corroborated by groundwater data, withdrainage-normalized canopy-topography represented by the HANDgrid. This coherence suggests that local environments can beassociated with height classes in the HAND grid. An exploratoryquantitative analysis matching the distribution of ground truth pointsin the Asu catchmentwith respective heights in the HANDgrid (Fig.11)
Fig. 13. Four-class HAND ma
Please cite this article as: Rennó, C. D., et al., HAND, a new terrain descripin Amazonia, Remote Sensing of Environment (2008), doi:10.1016/j.rse.20
suggests a compelling separation of HAND classes, especially betweenwaterlogged, ecotone and upland environments.
Taking these into account, HAND grid values of 5 m and 15 mwereselected as preliminary best-guess thresholds between the threeclasses. To optimize this separation (lessen errors on class inclusion)we applied the simplex algorithm (Cormen et al., 2001), finding 5.3 mand 15.0m as the best thresholds between classes for the set of groundtruth points available.
The upland class, in comparison to the other two lowland classes,represented well and in a relatively homogeneous way a single soil
p for entire study area.
tor using SRTM-DEM: Mapping terra-firme rainforest environments08.03.018
11C.D. Rennó et al. / Remote Sensing of Environment xxx (2008) xxx-xxx
ARTICLE IN PRESS
water condition (well drained soil, deepwater table). However there aremany distinct substrate effects in the definition of an environment on aslopecompared tooneonaplateau. Thewaterloggedandplateau classesare quite well defined in that they share low slope angles, and are wellseparated from ecotone and slope. This analysis reveals that the HANDheight is a good separator between the three soil water relevant classes.It also shows that, in the case of the Igarapé Asu catchment — with itsfairly uniform plateau heights, it can also separate the upland class intoslope and plateau. However, for other catchments with plateaus atvariable HAND heights, it might not score so well. Slope angle, on theother hand, can be used to identify flat surfaces independently of HANDheight. However theHANDheight can still beuseful to set aside plateausfrom flat alluvial terrain in the valley bottoms. As both slope and aspectare terrain descriptors that do not require field verification, slopewill bea better separator when applied exclusively for the upland class. Theupland class (HANDN15.0 m) was then split on the basis of slope, withthe initial threshold value arbitrarily selected at 6.5% slope, and thenoptimized with the simplex algorithm to 7.6% (Fig. 12).
The ground truth survey was accurate in identifying the localenvironment for each chosen point, and as a result, for most points, thematching between field environments with HAND predicted environ-ments was exceptionally good. Nevertheless, unavoidable localizationerrors were responsible for a few mismatches, which happened only tothe extreme values. Area estimation indicates that the distinctivewaterlogged plus ecotone environments (valley bottoms) occupied 43%of the surface, whereas slope and plateau occupied only 26% and 31%respectively (Fig. 13). The two valley bottom classes have been widelyconsidered as a minor proportion of the landscape and as a result havebeen largely disregarded by most integrative studies of terra-firme. TheHAND descriptor clearly and quantitatively reveals that the valleybottom classes are very important in this landscape. TheHAND class testcarried out in this studymight suffer from some site specific bias, but asit uses site-independent gravitational potential as themain driver for itsdescription of terrain, we expect that it will show robustness whenapplied in the Amazon outside the test area, and even anywhere elsewith a similar terrain covered by thick forests with a relatively uniformcanopy height across the landscape.
4. Discussion
Topography in the SRTM shaded relief image is plainly discernible tothe trained eye.When the computed drainage network is plotted on the
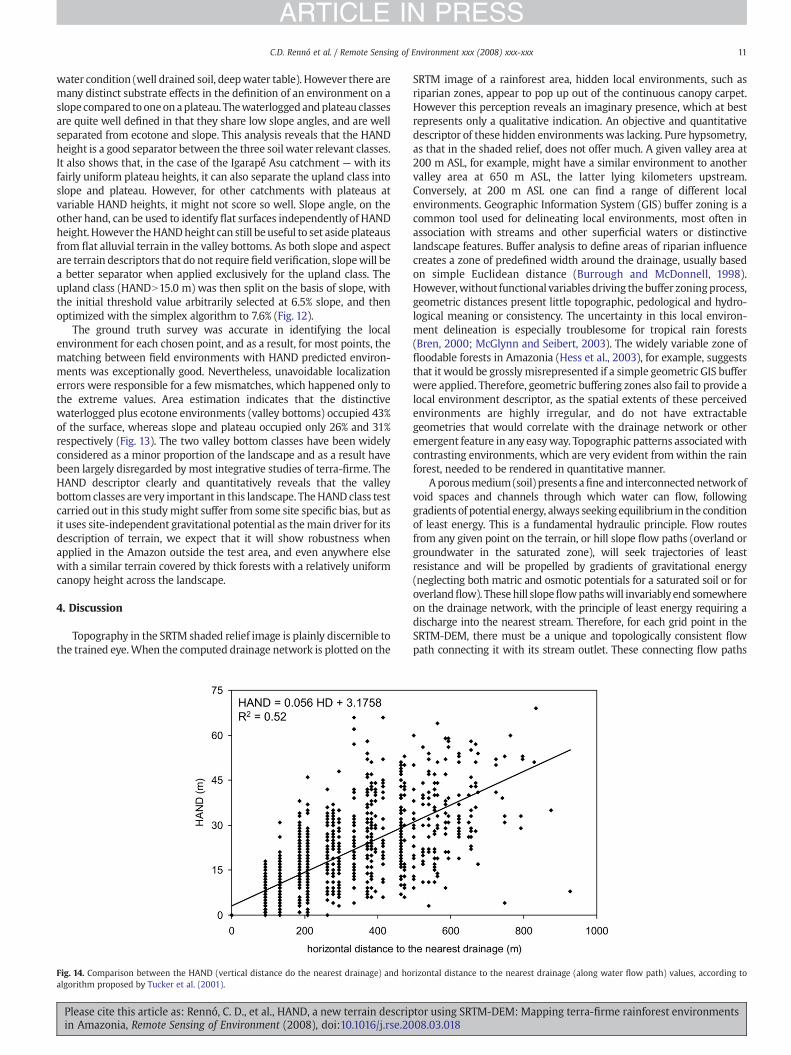
Fig. 14. Comparison between the HAND (vertical distance do the nearest drainage) and hoalgorithm proposed by Tucker et al. (2001).
Please cite this article as: Rennó, C. D., et al., HAND, a new terrain descripin Amazonia, Remote Sensing of Environment (2008), doi:10.1016/j.rse.20
SRTM image of a rainforest area, hidden local environments, such asriparian zones, appear to pop up out of the continuous canopy carpet.However this perception reveals an imaginary presence, which at bestrepresents only a qualitative indication. An objective and quantitativedescriptor of these hidden environments was lacking. Pure hypsometry,as that in the shaded relief, does not offer much. A given valley area at200 m ASL, for example, might have a similar environment to anothervalley area at 650 m ASL, the latter lying kilometers upstream.Conversely, at 200 m ASL one can find a range of different localenvironments. Geographic Information System (GIS) buffer zoning is acommon tool used for delineating local environments, most often inassociation with streams and other superficial waters or distinctivelandscape features. Buffer analysis to define areas of riparian influencecreates a zone of predefined width around the drainage, usually basedon simple Euclidean distance (Burrough and McDonnell, 1998).However,without functional variables driving thebuffer zoningprocess,geometric distances present little topographic, pedological and hydro-logical meaning or consistency. The uncertainty in this local environ-ment delineation is especially troublesome for tropical rain forests(Bren, 2000; McGlynn and Seibert, 2003). The widely variable zone offloodable forests in Amazonia (Hess et al., 2003), for example, suggeststhat it would be grossly misrepresented if a simple geometric GIS bufferwere applied. Therefore, geometric buffering zones also fail to provide alocal environment descriptor, as the spatial extents of these perceivedenvironments are highly irregular, and do not have extractablegeometries that would correlate with the drainage network or otheremergent feature in any easyway. Topographic patterns associatedwithcontrasting environments, which are very evident fromwithin the rainforest, needed to be rendered in quantitative manner.
Aporousmedium (soil) presents afine and interconnectednetwork ofvoid spaces and channels through which water can flow, followinggradients of potential energy, always seekingequilibrium in the conditionof least energy. This is a fundamental hydraulic principle. Flow routesfrom any given point on the terrain, or hill slope flow paths (overland orgroundwater in the saturated zone), will seek trajectories of leastresistance and will be propelled by gradients of gravitational energy(neglecting both matric and osmotic potentials for a saturated soil or foroverlandflow). Thesehill slopeflowpathswill invariablyend somewhereon the drainage network, with the principle of least energy requiring adischarge into the nearest stream. Therefore, for each grid point in theSRTM-DEM, there must be a unique and topologically consistent flowpath connecting it with its stream outlet. These connecting flow paths
rizontal distance to the nearest drainage (along water flow path) values, according to
tor using SRTM-DEM: Mapping terra-firme rainforest environments08.03.018

12 C.D. Rennó et al. / Remote Sensing of Environment xxx (2008) xxx-xxx
ARTICLE IN PRESS
bear all topological components, extractable from the SRTM-DEM, whichallowed for the development of the new HAND terrain descriptor. Theresults of the test of the HAND descriptor reported here demonstrate itscapacity to resolve meaningfully the delineation of local environments.
There are a host of generic terrain descriptors, e.g. topographicindexes, which could be compared to the HAND, but an exhaustivecomparison is beyond the aim of the present work. The closestdescriptor to the vertical distance along a flow path is the non-Euclidian horizontal distance along the same flow path (Tucker et al.,2001). To test the similarity between the two descriptors, 1000independent points (pixels) were randomly drawn from the test areaSRTM-DEM. According to the linear regression, the horizontal distancecan only explain 55% of the total variance that can be explained by theHAND (Fig. 14).
There is an obvious relation between horizontal and verticaldistances because it is expected that as one moves away from thedrainage, the terrain will get higher. However, the other 45% of thevariance is new information that only the HAND descriptor can give.Points with large horizontal distances but low HAND are indicative ofgreat flat areas connected to the drainage (swampy areas). The innateswampy characteristic of these terrains, for example, would never beseen with horizontal distances alone. With a large HAND value(vertical flow path distance) and a small horizontal flow path distance,the terrain is quickly rising away from the stream, i.e. a well etcheddrainage valley. But, although the HAND has this evident advantage,the horizontal flow path distance is a great advance over plainEuclidian distances, because the latter may connect and relate pointson the terrain that do not belong to the same catchment. Furthermore,horizontal flow path distances to the nearest drainage might have abearing in terms of span of time spent in draining flows, determinedby hydraulic conductivity and slope along the flow path. Height abovethe nearest drainage correlates directly with gravitational potential,and this fact alone sets this descriptor aside as unique.
5. Conclusions
The height above the nearest drainage algorithmwas developed ontop of the local drain directions and drainage networks, two wellestablished and basic topographic descriptors. The HAND has addedthe height difference along flow paths, or draining potential, as asignificant and unique terrain descriptor. The HAND terrain descriptorproduces a normalized digital elevation model (HAND grid) that canbe applied to classify terrain in a manner that is related to local soilwater conditions. The HAND grid, a DEM where all pixels have beenmapped according to their draining potential, has a wide range ofpotential applications. The application of the HAND descriptor inclassifying the terrain within a monitored hydrological catchment inAmazonia revealed strong correlations between soil water conditions,like classes of water table depth, and topography. This correlationobeys the physical principle of soil draining potential, or relativevertical distance to drainage, which can be detected remotely throughthe topography of the vegetation canopy found in the SRTM-DEMdata. To our knowledge no previous study has noticed or reported theheight above the nearest drainage as likely being a good terraindescriptor. It increases usability of the SRTM-DEM data and provides anew quantitative view on the steady state landscape, one that wasmissing in the repertoire of terrain descriptors.
Acknowledgements
This work was developed within the Environmental Physics Groupof GEOMA modeling network (Brazil's Ministry of Science andTechnology funding), with invaluable collaboration and co-fundingfrom the LBA project (Igarapé Asu instrumented catchment study).This work would not have been possible without full support of INPEand INPA. The Igarapé Asu catchment study was also funded by the
Please cite this article as: Rennó, C. D., et al., HAND, a new terrain descripin Amazonia, Remote Sensing of Environment (2008), doi:10.1016/j.rse.20
PPG7/FINEP Ecocarbon project and by CTEnerg and CThidro (Energyand Water Resources Sectorial Funds). Brazilian Science FundingAgency, CNPq and Fapeam, also contributed with grants and scholar-ships of personnel involved in the project. Thanks to Gerard Banon(DPI/INPE), two anonymous reviewers and the editor for their valuablecomments and questions.We thank dearly Antonio Huxley for supportin the field work. We thank also Evlyn Novo, Adriana Affonso and JohnMelack for the cession of the JERS-1 based flood land numerical mask.
References
Anderson, A. B., Prance, G. T., & Albuquerque, B.W. P. de (1975). Estudos sobre avegetaçãodas Campinas Amazônicas — III. A vegetação lenhosa da Campina da ReservaBiológica INPA-SUFRAMA (Manaus Caracaraí, Km 62). Acta Amazônica, 5(3),225−246.
Araujo, A. C., Nobre, A. D., Kruijt, B., Elbers, J. A., Dallarosa, R., Stefani, P., Randow, C.,Manzi, A. O., Culf, A. D., Gash, J. H. C., Valentini, R., & Kabat, P. (2002). Comparativemeasurements of carbon dioxide fluxes from two nearby towers in a centralAmazonian rainforest: The Manaus LBA site. Journal of Geophysical Research, 107(D20), 8090. doi:10.1029/2001JD000676.
Band, L. E. (1986). Topography partition of watersheds with digital elevation models.Water Resources Research, 22(1), 15−24.
Barbosa, C., Hess, L., Melack, J., & Novo, E. (2000). Mapping Amazon basin wetlandsthrough region growing segmentation and segmented-based classification of JERS-1 Data. IX Simposio Latinoamericano de Percepción Remota, Puerto Iguazú, Argentina.
Bren, L. J. (2000). A case study in the use of threshold measures of hydrologic loading inthe design of stream buffer strips. Forest Ecology and Management, 132, 243−257.
Burrough, P. A., & McDonnell, R. A. (1998). Principles of Geographical InformationSystems. Spatial Information Systems.New York: Oxford University Press 333p.
Castilho, C. (2004). Variação espacial e temporal da biomassa arbórea viva em 64 km2 defloresta de terra-firme na Amazônia Central. 87p. Doctoral Thesis, ecology, InstitutoNacional de Pesquisa da Amazônia, Manaus-AM.
Cormen, T. H., Leiserson, C. E., Rivest, R. L., & Stein, C. (2001). Introduction to algorithms,Section 29.3: The simplex algorithm (pp. 790−804)., Second Edition Cambridge: MITPress and McGraw-Hill 0-262-03293-7.
Cuartas, L. A., Tomasella, Nobre, A. D., Hodnett, M.,Waterloo,M. J., &Munera, J. C. (2007).Interception water-partitioning dynamics for a pristine rainforest in CentralAmazonia: Marked differences between normal and dry years. Agricultural andForest Meteorology, 145(1–2), 69−83.
Curkendall, D. W., Fielding, E. J., Cheng, T. -H., & Pohl, J. M. (2003). A computational-gridbased system for continental drainage network extraction using SRTM digitalelevation models. Proceedings of the HPSECA/IPCC conference, Taiwan.
Goudie, A. (2004). Encyclopedia of Geomorphology.New York: Routledge publisher1250p.
Guyot, G., Guyon, D., & Riom, J. (1989). Factors affecting the spectral response of forestcanopies — A review. Geocarto International, 4, 3−18.
Hess, L. L., Melack, J. M., Novo, E. M. L. M., Barbosa, C. C. F., & Gastil, M. (2003). Dual-season mapping of wetland inundation and vegetation for the central Amazonbasin. Remote Sensing of Environment, 87, 404−428.
Hodnett, M.G., Tomasella, J., Cuartas, L.A., Waterloo, & Nobre, A.D. (in preparation). SubSurface Hydrological Flow Paths in a Ferralsol (Oxisol) landscape in CentralAmazonia.
Hirano, A., Welch, R., & Lang, H. (2003). Mapping from ASTER stereo image data: DEMvalidation and accuracy assessment. Journal of Photogrammetry & Remote Sensing,57, 356−370.
Jacobsen, K. (2003). DEM Generation from Satellite Data. EARSeL Symposium Ghent:Remote Sensing in Transition (pp. 273−276). 90-77017-71-2.
Jenson, S. K., & Domingue, J. O. (1988). Extracting topographic structure from digitalelevation data for geographic information system analysis. Photogrammetricengineering and remote sensing, 54, 1593−1600.
Kellndorfer, J.,Walker,W., Pierce, L., Dobson, C., Fites, J. A., Hunsaker, C., Vona, J., & Clutter,M. (2004). Vegetation height estimation from shuttle radar topographymission andnational elevation datasets. Remote Sensing of Environment, 93, 339−358.
Laurance,W. F., Fearnside, P. M., Laurance, S. G., Delamonica, P., Lovejoy, T. E., Rankin-de-Merona, J. M., Chambers, J. Q., & Gascon, C. (1999). Relationship between soils andAmazon forest biomass: A landscape-scale study. Forest Ecology Management, 118(1–3), 127−138.
Lindsay, J. B., & Creed, I. F. (2005). Removal of artifact depressions from digital elevationmodels: towards a minimum impact approach. Hydrological processes, 19,3113−3126.
McGlynn, B. L., & Seibert, J. (2003). Distributed assessment of contributing area andriparian buffering along stream networks. Water resources research, 39(4),TNN2.1−TNN2.7.
Melack, J. M., & Hess, L. L. (2004). Remote sensing of wetlands on a global scale. SILNews, 42, 1−5.
Montgomery, D. R., & Dietrich, W. E. (1988). Where do channels begin? Nature, 336,232−234.
Montgomery, D. R., & Foufoula-Georgiou, E. (1993). Channel network sourcerepresentation using digital elevation models. Water Resources Research, 29(12),3925−3934.
Nobre, A. D., Hirata, Y., Honzak, M., & Campos, A. C. (1998). Vegetation classification andmapping of Manaus region using passive remote sensing. In N. Higuchi, M. A. A.Campos, P. T. B. Sampaio, & J. Santos (Eds.), Pesquisas florestais para a conservação da
tor using SRTM-DEM: Mapping terra-firme rainforest environments08.03.018
13C.D. Rennó et al. / Remote Sensing of Environment xxx (2008) xxx-xxx
ARTICLE IN PRESS
floresta e reabilitação de áreas degradadas da Amazonia, Projeto Jacaranda (pp. 28−49).Manaus: MCT-INPA & Jica pub.
Novo, E. M. L. M., Leite, F. A., Avila, J., Ballester, M. V., & Melack, J. M. (1997). Assessmentof Amazon floodplain habitats using TM/Landsat data. Ciência e Cultura, 49(4),280−284.
O'Callaghan, J. F., & Mark, D. M. (1984). The extraction of drainage networks from digitalelevation data. Computer Vision, Graphics and Image Processing, 28, 323−344.
Oldeman, R. A. A. (1990). Forests: Elements of Silvology.Berlin: Springer Verlag 624p.Rodriguez, E., Morris, C. S., & Belz, J. E. (2006). A global assessment of the SRTM
performance. Photogrammetric Engineering and Remote Sensing, 72(3), 249−260.Siqueira, P., Chapman, B., & McGarragh, G. (2003). The coregistration, calibration, and
interpretation of multiseason JERS-1 SAR data over South America. Remote Sensingof the Environment, 87, 389−403.
Siqueira, P., Hensley, S., Shaffer, S., Hess, L., McGarragh, G., Chapman, B., & Freeman, A.(2000). A continental-scale mosaic of the Amazon basin using JERS-1 SAR. IEEETransactions on Geoscience and Remote Sensing, 38(6), 2638−2644.
Soille, P., Vogt, J., & Colombo, R. (2003). Carving and adaptive drainage enforcement ofgrid digital elevation models. Water Resources Research, 39(12), 1366−1375.
Tarboton, D. G. (2003). Terrain analysis using digital elevation models in hydrology.23rd ESRI International Users Conference, San Diego, California.
Tarboton, D. G., & Ames, D. P. (2001). Advances in the mapping of flow networks fromdigital elevation data. World Water and Environmental Resources Congress, Orlando,Florida.
Tarboton, D. G., Bras, R. L., & Rodriguez-Iturbe, I. (1991). On the extraction of channelnetworks from digital elevation data.. Hydrological processes, 5, 81−100.
Please cite this article as: Rennó, C. D., et al., HAND, a new terrain descripin Amazonia, Remote Sensing of Environment (2008), doi:10.1016/j.rse.20
Tarboton, D. G., Bras, R. L., & Rodriguez-Iturbe, I. (1992). A physical basis for drainagedensity. Geomorphology, 5, 59−76.
Tomasella, J., Hodnett, M. G., Cuartas, L. A., Nobre, A. D., Waterloo, M. J., & Oliveira, S. M.(2007). The water balance of an Amazonian micro-catchment: The effect of interannualvariability of rainfall on hydrological behavior. Published online, HydrologicalProcesses.
Tucker, G. E., Catani, F., Rinaldo, A., & Brás, R. L. (2001). Statistical analysis of drainagedensity from digital terrain data. Geomorphology, 36, 187−202.
Valeriano, M. M., Kuplich, T. M., Storino, M., Amaral, B. D., Mendes, J. N., & Lima, D. J.(2006). Modeling small watersheds in Brazilian Amazonia with shuttle radartopographic mission-90 m data. Computer Geosciences, 32, 1169−1181.
van Zyl, J. J. (2001). The shuttle radar topography mission breakthrough in remotesensing of topography. Acta Astronautica, 48(5–12), 559−565.
Waterloo, M. J., Oliveira, S. M., Drucker, D. P., Nobre, A. D., Cuartas, L. A., Hodnett, M. G.,Langedijk, I., Jans, W. W. P., Tomasella, J., Araújo, A. C., Pimentel, T. P., & Estrada, J. C.M. (2006). Export of organic carbon in run-off from an Amazonian rainforestblackwater catchment. Hydrological Processes, 20(12), 2581−2597.
Wulder, M. (1998). Optical remote-sensing techniques for the assessment of forestinventory and biophysical parameters. Progress in Physical Geography, 22(4),449−476.
Zhou, Q., & Liu, X. (2002). Error assessment of grid-based flow routing algorithms used inhydrological models. International journal of geographical information science, 16(8),819−842.
tor using SRTM-DEM: Mapping terra-firme rainforest environments08.03.018