Article Healthcare Warranty Policies Optimization for ...
16
healthcare Article Healthcare Warranty Policies Optimization for Chronic Diseases Based on Delay Time Concept Heng Zhao 1 , Zixian Liu 1 , Mei Li 1 and Lijun Liang 2, * Citation: Zhao, H.; Liu, Z.; Li, M.; Liang, L. Healthcare Warranty Policies Optimization for Chronic Diseases Based on Delay Time Concept. Healthcare 2021, 9, 1088. https://doi.org/10.3390/ healthcare9081088 Academic Editors: Thomas G. Poder and Maude Laberge Received: 20 June 2021 Accepted: 20 August 2021 Published: 23 August 2021 Publisher’s Note: MDPI stays neutral with regard to jurisdictional claims in published maps and institutional affil- iations. Copyright: © 2021 by the authors. Licensee MDPI, Basel, Switzerland. This article is an open access article distributed under the terms and conditions of the Creative Commons Attribution (CC BY) license (https:// creativecommons.org/licenses/by/ 4.0/). 1 College of Management and Economics, Tianjin University, Tianjin 300072, China; [email protected] (H.Z.); [email protected] (Z.L.); [email protected] (M.L.) 2 School of Management, Tianjin University of Traditional Chinese Medicine, Tianjin 301617, China * Correspondence: [email protected] Abstract: Warranties for healthcare can be greatly beneficial for cost reductions and improvements in patient satisfaction. Under healthcare warranties, healthcare providers receive a lump sum payment for the entire care episode, which covers a bundle of healthcare services, including treatment decisions during initial hospitalization and subsequent readmissions, as well as disease-monitoring plans composed of periodic follow-ups. Higher treatment intensities and more radical monitoring strategies result in higher medical costs, but high treatment intensities reduce the baseline readmission rates. This study intends to provide a systematic optimization framework for healthcare warranty policies. In this paper, the proposed model allows healthcare providers to determine the optimal combination of treatment decisions and disease-monitoring policies to minimize the total expected healthcare warranty cost over the prespecified period. Given the nature of the disease progression, we introduced a delay time model to simulate the progression of chronic diseases. Based on this, we formulated an accumulated age model to measure the effect of follow-up on the patient’s readmission risk. By means of the proposed model, the optimal treatment intensity and the monitoring policy can be derived. A case study of pediatric type 1 diabetes mellitus is presented to illustrate the applicability of the proposed model. The findings could form the basis of developing effective healthcare warranty policies for patients with chronic diseases. Keywords: healthcare warranty; chronic diseases; delay time model; disease monitoring 1. Introduction Hospital readmissions have received substantial worldwide attention in recent years. According to a report, over 17% of patients were readmitted within 30 days of discharge [1]. Hospital readmissions are often costly, representing USD 25 billion per year [2]. However, approximately 75% of all readmissions can be prevented by appropriate post-discharge monitoring and management [3]. A high readmission rate imposes a heavy financial burden on patients but is also regarded as a symbol of poor quality of medical services [4–6]. To reduce readmissions and curb rising medical costs, there have been many payment systems, such as capitation, pay-for-performance, per diem prospective payment, and diagnostic-related groups, aiming at replacing the traditional fee-for-service (FFS) that has long been criticized for rewarding healthcare providers who spend more unnecessarily [7,8]. In 2013, the Centers for Medicare and Medicaid Services (CMS) initiated a new payment program called Bundled Payments for Care Improvement (BPCI) [9]. BPCI requires hospital to define bundles of healthcare services associated with a specified disease. For example, bundles for joint replacement include advance payments, details of healthcare services during the episode, and plans for post-discharge monitoring [10,11]. Under the bundled payment (BP) system, the hospital will receive a lump sum for a whole episode of care, including index admissions and readmissions that occur over a specified warranty period, such as 90 days after discharge, regardless of the treatment details and the possible related complications [12]. Here, BP is a reimbursement scheme with the implication of healthcare Healthcare 2021, 9, 1088. https://doi.org/10.3390/healthcare9081088 https://www.mdpi.com/journal/healthcare
Transcript of Article Healthcare Warranty Policies Optimization for ...
healthcare
Article
Healthcare Warranty Policies Optimization for ChronicDiseases Based on Delay Time Concept
Heng Zhao 1 , Zixian Liu 1, Mei Li 1 and Lijun Liang 2,*
�����������������
Citation: Zhao, H.; Liu, Z.; Li, M.;
Liang, L. Healthcare Warranty
Policies Optimization for Chronic
Diseases Based on Delay Time
Concept. Healthcare 2021, 9, 1088.
https://doi.org/10.3390/
healthcare9081088
Academic Editors: Thomas G. Poder
and Maude Laberge
Received: 20 June 2021
Accepted: 20 August 2021
Published: 23 August 2021
Publisher’s Note: MDPI stays neutral
with regard to jurisdictional claims in
published maps and institutional affil-
iations.
Copyright: © 2021 by the authors.
Licensee MDPI, Basel, Switzerland.
This article is an open access article
distributed under the terms and
conditions of the Creative Commons
Attribution (CC BY) license (https://
creativecommons.org/licenses/by/
4.0/).
1 College of Management and Economics, Tianjin University, Tianjin 300072, China;[email protected] (H.Z.); [email protected] (Z.L.); [email protected] (M.L.)
2 School of Management, Tianjin University of Traditional Chinese Medicine, Tianjin 301617, China* Correspondence: [email protected]
Abstract: Warranties for healthcare can be greatly beneficial for cost reductions and improvements inpatient satisfaction. Under healthcare warranties, healthcare providers receive a lump sum paymentfor the entire care episode, which covers a bundle of healthcare services, including treatment decisionsduring initial hospitalization and subsequent readmissions, as well as disease-monitoring planscomposed of periodic follow-ups. Higher treatment intensities and more radical monitoring strategiesresult in higher medical costs, but high treatment intensities reduce the baseline readmission rates.This study intends to provide a systematic optimization framework for healthcare warranty policies.In this paper, the proposed model allows healthcare providers to determine the optimal combinationof treatment decisions and disease-monitoring policies to minimize the total expected healthcarewarranty cost over the prespecified period. Given the nature of the disease progression, we introduceda delay time model to simulate the progression of chronic diseases. Based on this, we formulatedan accumulated age model to measure the effect of follow-up on the patient’s readmission risk. Bymeans of the proposed model, the optimal treatment intensity and the monitoring policy can bederived. A case study of pediatric type 1 diabetes mellitus is presented to illustrate the applicabilityof the proposed model. The findings could form the basis of developing effective healthcare warrantypolicies for patients with chronic diseases.
Keywords: healthcare warranty; chronic diseases; delay time model; disease monitoring
1. Introduction
Hospital readmissions have received substantial worldwide attention in recent years.According to a report, over 17% of patients were readmitted within 30 days of discharge [1].Hospital readmissions are often costly, representing USD 25 billion per year [2]. However,approximately 75% of all readmissions can be prevented by appropriate post-dischargemonitoring and management [3]. A high readmission rate imposes a heavy financial burdenon patients but is also regarded as a symbol of poor quality of medical services [4–6].
To reduce readmissions and curb rising medical costs, there have been many paymentsystems, such as capitation, pay-for-performance, per diem prospective payment, anddiagnostic-related groups, aiming at replacing the traditional fee-for-service (FFS) that haslong been criticized for rewarding healthcare providers who spend more unnecessarily [7,8].In 2013, the Centers for Medicare and Medicaid Services (CMS) initiated a new paymentprogram called Bundled Payments for Care Improvement (BPCI) [9]. BPCI requires hospitalto define bundles of healthcare services associated with a specified disease. For example,bundles for joint replacement include advance payments, details of healthcare servicesduring the episode, and plans for post-discharge monitoring [10,11]. Under the bundledpayment (BP) system, the hospital will receive a lump sum for a whole episode of care,including index admissions and readmissions that occur over a specified warranty period,such as 90 days after discharge, regardless of the treatment details and the possible relatedcomplications [12]. Here, BP is a reimbursement scheme with the implication of healthcare
Healthcare 2021, 9, 1088. https://doi.org/10.3390/healthcare9081088 https://www.mdpi.com/journal/healthcare

Healthcare 2021, 9, 1088 2 of 16
warranty, and the 90 days after discharge can be regarded as the warranty period. Inaddition to BP, there are other forms of payment such as ProvenCare and PROMETHEUS,which can be described as healthcare warranties [13]. Under the healthcare warranty, if theactual healthcare costs are lower than the lump sum, the hospital will profit; otherwise, thehospital will suffer a financial loss [14]. Therefore, the transformation of the payment mech-anism from the traditional FFS to healthcare warranty has shifted the financial risk from thepatient to the healthcare provider. Some scholars hold that healthcare warranty paymentscontribute to a higher quality of healthcare and keep treatment costs under control becausepatients would no longer pay for hospital readmissions when they occur [9,15]. Thus,providing a high level of treatment services to the patient during index admission mayincrease the profit margins by reducing the probability of readmissions under healthcarewarranty payments [16]. The healthcare warranty reimbursement scheme is currentlyapplied to joint replacement surgery, cardiovascular care, cancer care, and treatment ofchronic diseases such as diabetes and chronic obstructive pulmonary disease [15,17–21].The practice has proven that healthcare warranties can be greatly beneficial for reducingcosts, improving patient satisfaction, and enhancing the competitiveness of medical in-stitutions. Numerous efforts have been made to improve healthcare performance, fromstrategic to operational levels. Strategic decisions involve capital investment, resourceplanning of healthcare services, etc. [22,23]. Healthcare operations management focuses onthe decision making related to the execution of healthcare delivery processes, includinghealthcare resources scheduling, process optimization and control, disease management,etc. [24–26]. Disease management comprises disease prediction and diagnosis, risk as-sessment, healthcare service strategy optimization, and disease monitoring [27–30]. Inaddition, research on healthcare cost control and management support systems in recentyears has also created value in healthcare. For example, time-driven activity-based costinghas been applied in healthcare and can help to efficiently modify cost processes and therebycontribute to cost control and efficiency improvement in healthcare delivery [31]. Anotherexample is a healthcare management system with blockchain-based electronic healthcarerecords against the background of data security and inefficiently management [32]. Thisstudy is intended to provide an effective medical service decision-making model to enrichdisease management research.
Jacobs et al. [33] showed that many types of patients’ post-discharge care processesand readmission characteristics are similar. For example, when a cystectomy patient isdischarged from hospital, a disease-monitoring plan consisting of periodic follow-up ismade. After the patient is discharged, they will receive scheduled follow-up checkups,such as a timely general inspection, comprehensive inspection, phone call, and officevisit. The purpose of follow-up is to detect whether the patient has developed illnessesor complications prior to patient readmission. Once a condition is detected by follow-up,measures such as drug interventions can prevent further development. Moreover, earlyintervention and prevention programs may save total treatment costs and improve servicequality simultaneously. Previous literature shows that undertaking a series of disease-monitoring plans can significantly reduce readmission rates [14,34]. Based on our fieldresearch, the patient’s condition goes through several states of progression before read-mission. As time passes, the patient may develop a readmission-causing condition (calledan “illness” in this article). When the illness first develops, it will not trigger immediatereadmission. However, if nothing is done to address this illness, the patient’s condition willworsen and eventually lead to readmission. We call the time lapse between a detectableillness and readmission the delay time. In this study, we developed an optimization modelbased on a delay time model from the reliability and machine maintenance literature tocapture disease-monitoring dynamics. The delay-time model is widely applied to modelengineering problems in machine maintenance and inspection; it assumes that a device’slife cycle has an increasing failure rate [35–37]. The period that starts with the deviceshowing signs of failure, and ending with the final failure, is called the delay time. Inmedical operations management, the delay-time model has been used to model disease
Healthcare 2021, 9, 1088 3 of 16
progression. Fu et al. [38] proposed a two-stage delayed diagnosis regression model forhepatitis screening based on a delay time model. Zhang et al. [39] applied a delay timemodel to optimize postoperative monitoring plans for vascular surgery by minimizing theprobability of failing to detect patency loss before readmission. Helm et al. [40] developedmixed integer programming based on a delay time model to determine optimal follow-upschedules and allocate necessary resources. Liu et al. [2] developed a delay time modelto analyze the impact of quantity, effectiveness to detect conditions and a mix of differentcheckup methods on the optimal decision making of follow-up schedules.
Providing disease monitoring for patients implies additional costs for the hospitalunder the healthcare warranty, and these costs result from labor costs for medical staff,medical devices, and drugs during a predetermined warranty period. However, these inter-ventions may lower the lump sum of healthcare warranties by reducing readmissions rates.The episodes of care can be divided into two consecutive periods: the hospitalization phaseand the post-discharge phase. Healthcare providers need to develop a healthcare warrantypolicy that includes treatment decisions for the first phase and monitoring plans for thesecond phase. Treatment decisions affect the baseline readmission rate after discharge, andthe follow-up monitoring strategy will also affect the readmission rate. Although a highnumber of treatment decisions incur higher medical costs, providing a high number oftreatment options may reduce overall costs by reducing baseline readmission rates. There-fore, for cost control and profitability, joint optimization of hospital treatment decisionsand monitoring strategies is of great significance for reducing patient readmissions andcontrolling the healthcare costs for a medical institution.
Previous studies and medical practices have demonstrated the potential of a healthcarewarranty in terms of cost saving and quality improvement [9,14,15]. However, somequestions need to be further explored, which are also the motivation for this study. First,existing studies on disease-monitoring policies have aimed at maximizing the probabilityof detecting the patients’ health conditions but failed to consider the costs associated withfollow-up and treatment. Sujan et al. [41] pointed out that it is necessary for hospitalsto establish a mechanism for managing explicitly the trade-off between risk reductionand cost. Second, the extant research does not use appropriate models to simulate theeffect of disease monitoring on the patients’ readmission rates. The purpose of diseasemonitoring is to reduce the readmission rates by follow-up checkups of patients to detectthe illness early and take intervention measures to remove it. Consequently, after an illnessintervention, the progress of the disease is expected to be halted, and the readmission riskof the patient is expected to be reduced compared to that before the follow-up interventions,which may in turn influence the decisions made about a disease-monitoring policy. Inaddition, although healthcare warranties are beneficial for cost savings and medical qualityassurance, the method behind designing effective healthcare warranty policies is poorlyunderstood. Currently implemented healthcare warranty policies have been obtainedempirically and subjectively without supporting quantitative analysis.
Our study is relevant to the research on developing the optimal follow-up policiesbased on the delay time model as mentioned above [2,39,40]. Given that a patient developsa readmission-causing condition after discharge, the delay time defines a time windowduring which a follow-up checkup can prevent readmission. Existing research uses thedelay time model to characterize the dynamics of readmission and further derives the opti-mal follow-up schedule to maximize the probability of detecting the readmission-causingcondition. Our research extended these modeling approaches in several aspects. First,we considered the impact of inpatient treatment decisions on baseline readmission riskand optimized treatment decisions and follow-up monitoring strategies simultaneously.Second, we measured the effect of follow-up intervention on the patient’s readmissionrisk. Both extensions made the model construction and computational complexity morechallenging. The main contributions are as follows. We proposed a systematic optimizationmodel of a healthcare warranty policy that allows healthcare providers to determine theoptimal combination of treatment decisions and disease-monitoring policies to minimize

Healthcare 2021, 9, 1088 4 of 16
the total expected healthcare warranty cost over the prespecified period. To the best of ourknowledge, there has been a lack of research on the development of healthcare warrantypolicies in the healthcare operations and management. We used elaborate mathematicalformulas to characterize the relationship between the treatment intensity and baselinereadmission rates, and we utilized the delay time model to analyze and optimize thedisease-monitoring strategy. The effect of a follow-up intervention on the patient’s readmis-sion risk was measured by the accumulative age method. In addition, a healthcare warrantypolicy optimization model was constructed to determine the optimal combination of thetreatment decisions and the timing of follow-up checkups during the warranty period. Acase study of pediatric type 1 diabetes mellitus is presented to illustrate the applicability ofthe proposed model. The proposed model framework and practical implications can pro-vide a basis for the healthcare provider to formulate healthcare warranty policies, furthercontributing to improving the quality of healthcare and control the costs. Furthermore, theapplication of the delay time model and accumulative age method provide a reference fordisease modeling and management.
2. Problem Definition
Consider a healthcare delivery system with two parties, namely, a hospital and itscohort of patients. Under the healthcare warranty scheme, the length of care episodes(i.e., warranty period) is prespecified. Once a patient enters the hospital, the hospitalreceives a lump sum payment to cover all services during the entire care episode. Thesemedical services include treatment options during hospitalization, disease monitoring,and possible readmission treatment after discharge. Figure 1 illustrates the sequenceof events. In medical practice, patients are often considered to be homogeneous underhealthcare warranties. This consensus is reasonable, since patients are classified intoheterogeneous diagnosis-related groups (DRGs) based on their individual characteristics.Patients in the same group have similar physical and disease conditions; that is, they arehomogeneous [42,43]. When a patient is entered into a healthcare delivery system, thehospital chooses treatment intensity θ ∈ [θmin, θmax] to maximize their expected profit [14].The variable θ refers to the level of treatment services provided by the hospital for patients,such as the professional level of doctors, the professional competence of the nursing staff,the length of stay (LOS), and the precision of the medical devices. The associated costsincurred by hospitals during hospitalization increase with the treatment intensity θ. Aftera patient is discharged, disease-monitoring plans consisting of periodic follow-up activitiesare necessary to reduce hospital readmission rates and control healthcare costs. Duringthe post-discharge phase, the patient’s condition undergoes several states of progressionbefore readmission. In this study, we used a delay time model to capture the progressionof disease. For example, diabetic patients usually have polydipsia and polyuria beforebeing readmitted to the hospital. Under the condition that the patient is monitored afterdischarge from the hospital, if any readmission-causing conditions are detected by follow-up, intervention measures can be taken immediately to mitigate illness deterioration. Thepurpose of disease monitoring is to detect developing conditions before they deteriorate,reducing unnecessary readmissions.
Healthcare 2021, 9, x 5 of 16
Arrives Patient
Hospital make treatment decisions
Hospital Hospitalization
costs
Discharge
Warranty period
Readmission
Postdischarge costs receive a lump sum payment
Illness become detectable
t1 t2 t3 t4 t5
Illness become serious Wh
Healthy Delay time Hospitalization phase Postdischarge phase
Figure 1. Sequence of events.
3. Mathematical Model In this section, we first presented the model notations and assumptions to make the
mathematical model tractable. After that, we constructed a two-phase optimization model including the hospitalization phase and post-discharge phase under healthcare warran-ties.
3.1. Notations and Assumptions The notation is introduced as follows. 𝜃 Treatment intensity for a patient during hospitalization, 𝜃 ∈ [𝜃 , 𝜃 ] 𝐶 (𝜃) Treatment cost incurred by hospital during a patient’s hospitalization 𝑇 Follow-up interval 𝑡 Follow-up instants, (𝑖 = 1,2, … ) 𝑐 Average cost of each follow-up 𝑐 Average cost of each drug intervention triggered by follow-up 𝑐 Average cost of each readmission 𝑊 Prespecified length of warranty period 𝑢 Time lapse between latest follow-up and the illness being detectable 𝑣 Time lapse between the illness being detectable and readmission 𝑓 (𝑢, 𝜃) Baseline probability density function (pdf) of illness 𝜆 (𝑢, 𝜃) Baseline instantaneous rates of illness ℎ(𝑣) Instantaneous rates of readmission 𝜏 The time of the kth drug intervention 𝜌 Improvement factor of drug intervention (0 ≤ 𝜌 ≤ 1) 𝛥𝑖 Accumulative age after drug intervention at 𝑡 𝜆 (𝑢, 𝜃) Instantaneous rate of illness after the drug intervention at time 𝑡 𝑓 (𝑢, 𝜃) Probability density function (pdf) of illness after the drug intervention at 𝑡 𝐹 (𝑢, 𝜃) Cumulative distribution function (cdf) of illness after the drug intervention at 𝑡 𝑔(𝑣) Probability density function (pdf) of readmission 𝐺(𝑣) Cumulative distribution function (cdf) of readmission
The following assumptions are taken into account: Patients are discharged healthy. The time to illness becoming detectable post-discharge is a random variable follow-
ing a Weibull distribution [2,44]. Follow-ups are periodic and can detect the patients’ condition perfectly. Once a pa-
tient is detected to be in an illness state, a drug intervention is carried out to imme-diately resolve any illness.
Figure 1. Sequence of events.

Healthcare 2021, 9, 1088 5 of 16
3. Mathematical Model
In this section, we first presented the model notations and assumptions to make themathematical model tractable. After that, we constructed a two-phase optimization modelincluding the hospitalization phase and post-discharge phase under healthcare warranties.
3.1. Notations and Assumptions
The notation is introduced as follows.
θ Treatment intensity for a patient during hospitalization, θ ∈ [θmin, θmax]CT(θ) Treatment cost incurred by hospital during a patient’s hospitalizationT Follow-up intervalti Follow-up instants, (i = 1, 2, . . .)c f Average cost of each follow-upcd Average cost of each drug intervention triggered by follow-upcr Average cost of each readmissionWh Prespecified length of warranty periodu Time lapse between latest follow-up and the illness being detectablev Time lapse between the illness being detectable and readmissionf0(u, θ) Baseline probability density function (pdf) of illnessλ0(u, θ) Baseline instantaneous rates of illnessh(v) Instantaneous rates of readmissionτk The time of the kth drug interventionρ Improvement factor of drug intervention (0 ≤ ρ ≤ 1)∆i Accumulative age after drug intervention at tiλi+1(u, θ) Instantaneous rate of illness after the drug intervention at time tifi+1(u, θ) Probability density function (pdf) of illness after the drug intervention at tiFi+1(u, θ) Cumulative distribution function (cdf) of illness after the drug intervention at tig(v) Probability density function (pdf) of readmissionG(v) Cumulative distribution function (cdf) of readmission
The following assumptions are taken into account:
• Patients are discharged healthy.• The time to illness becoming detectable post-discharge is a random variable following
a Weibull distribution [2,44].• Follow-ups are periodic and can detect the patients’ condition perfectly. Once a patient
is detected to be in an illness state, a drug intervention is carried out to immediatelyresolve any illness.
• The effectiveness of drug intervention triggered by follow-up is imperfect, whilereadmission treatment is perfect. This assumption is reasonable in medical practice be-cause the patient’s physical condition at the time of discharge needs to meet dischargecriteria [45].
• The duration of follow-up and readmission treatment is negligible compared with theprespecified length of the warranty period [46].
3.2. Hospitalization Phase
The treatment intensity θ is used to quantify treatment decisions during the hospital-ization period. When a patient is accepted by a hospital, the hospital determines treatmentintensity θ ∈ [θmin, θmax] for the patient to maximize its expected profits. For example, forthe treatment of patients with chronic gastropathy disease, there are five different treatmentintensities: (1) routine visit and consultation, (2) daily dose prescription omeprazole 20 mgtablet for a period of 30 days, (3) manometry, (4) endoscopy, and (5) Laparoscopic NissenFundoplication (LNF) surgery, where each treatment level is cumulative (for example,level 2 is to prescribe the drug and do a routine consultation). To calculate the treatmentcost during the hospitalization period, Adida et al. [14] used a simple power function oftreatment level to characterize the treatment costs under different treatment levels. How-

Healthcare 2021, 9, 1088 6 of 16
ever, their model cannot clearly reflect the cost component because treatment costs dependalmost entirely on the treatment intensity. In this study, we assumed that with the increasein treatment decision variable θ, the speed of marginal treatment cost increases. Therefore,CT(θ) is increasing and convex in θ. This is more accurate than a simple power function tocalculate the costs, but it inevitably increases the computational complexity. The treatmentcost during the hospitalization period is expressed as follows:
CT(θ) = A0 + A1 exp(
kθmax − θ
θ − θmin
)(1)
where θ is the treatment intensity parameter (θmin < θ ≤ θmax), A0 represents the basiccosts, and A1 is the variable costs associated with the treatment intensity.
3.3. Post-Discharge Phase
After hospitalization, patients are discharged from hospital at t0. After discharge, thepatient’s condition may worsen, eventually leading to readmission. However, when theillness first develops (e.g., an infection), it is not so serious that it can only be detected by afollow-up checkup. Additionally, it can hardly result in immediate readmission becausethere is a delay between the illness becoming detectable and readmission. To reduce thepossibility of readmission, disease-monitoring plans must be developed for detecting ill-nesses early. In this study, the patient’s condition after discharge was monitored by periodicfollow-up. The purpose of follow-up is to detect the illness before gradual deteriorationand readmission. Once a condition is detected early by a follow-up, intervention measures(e.g., drug interventions) are carried out to resolve the illnesses. Our goal is to develop anoptimal follow-up schedule under healthcare warranties.
3.3.1. Discrete Follow-Up and Drug Intervention Actions
In this study, follow-up was assumed to be perfect for detecting patients’ conditions,while the effectiveness of drug intervention was imperfect. To model the effect of drug in-tervention, borrowing from maintenance techniques was used to describe the effectivenessof maintenance activities, we assumed that the kth drug intervention will reduce the lengthof the last drug intervention time from τk − τk−1 to ρ(τk − τk−1), where τk is the time of thekth drug intervention and ρ = 1− δ(m) is an improvement factor. Each drug interventionaction reduces the “effective age” of the patient. The reduction in the effective age dependson the degree of intervention m, with δ(m) decreasing with m [47].
δ(m) = (1 + m)e−m, 0 ≤ δ(m) ≤ 1, 0 ≤ m ≤ M. (2)
where δ(0) = 1 (m = 0, no intervention measures are taken) and δ(M) = 0 ( m = M, patientrestored to the state of the last drug intervention).
For an infinite drug intervention effort M (impossible to implement in the actualtreatment), the condition of the patient was restored to the same condition as it wasfollowing the previous drug intervention (δ(∞) = 1). Hence, in this study, our modelallows the drug intervention to be imperfect.
For x > τk, the effective age after the kth drug intervention is v(x) = x − ρτk. Theinstantaneous rate of illness after the kth drug intervention is λ0(v(x), θ), where λ0(t, θ)is the instantaneous rate of the illness without any drug intervention. In this paper,we use the concept of “accumulated age” to denote the accumulative deterioration ofprevious intervention actions; Figure 2 illustrates the accumulative age. The lapse of timebetween the x and the kth drug intervention is x − ρτk; in other words, the interval of(1− ρ)τk = x − ρτk − (x− τk), is the accumulated age, which denotes the accumulateddeterioration of previous intervention actions. The magnitude of accumulated age affectsthe instantaneous rate of illness in the (k + 1)th intervention stage.

Healthcare 2021, 9, 1088 7 of 16
Healthcare 2021, 9, x 7 of 16
𝛿(𝑚) = (1 + 𝑚)𝑒 , 0 ≤ 𝛿(𝑚) ≤ 1, 0 ≤ 𝑚 ≤ 𝑀. (2)
where 𝛿(0) = 1 (m = 0, no intervention measures are taken) and 𝛿(𝑀) = 0 ( 𝑚 = 𝑀, pa-tient restored to the state of the last drug intervention).
For an infinite drug intervention effort M (impossible to implement in the actual treatment), the condition of the patient was restored to the same condition as it was fol-lowing the previous drug intervention (𝛿(∞) = 1). Hence, in this study, our model allows the drug intervention to be imperfect.
For 𝑥 > 𝜏 , the effective age after the kth drug intervention is 𝑣(𝑥) = 𝑥 − 𝜌𝜏 . The instantaneous rate of illness after the kth drug intervention is 𝜆 (𝑣(𝑥), 𝜃), where 𝜆 (𝑡, 𝜃) is the instantaneous rate of the illness without any drug intervention. In this paper, we use the concept of “accumulated age” to denote the accumulative deterioration of previ-ous intervention actions; Figure 2 illustrates the accumulative age. The lapse of time be-tween the x and the kth drug intervention is 𝑥 − 𝜌𝜏 ; in other words, the interval of (1 − 𝜌)𝜏 = 𝑥 − 𝜌𝜏 − (𝑥 − 𝜏 ), is the accumulated age, which denotes the accumulated deterioration of previous intervention actions. The magnitude of accumulated age affects the instantaneous rate of illness in the (k+1)th intervention stage.
x t
instantaneous rate
0 Figure 2. Illustration of the accumulative age.
Let 𝑡 be the time of the ith follow-up. In medical practice, follow-up activities are always carried out according to physicians’ experience or based on a fixed interval of T. For example, in the 2018 Diabetes clinical guidelines, the International Society for Pediat-ric and Adolescent Diabetes (ISPAD) recommends three-month follow-ups for HbA1c measurement for adolescents with diabetes. In this study, the time of the ith follow-up is 𝑡 = 𝑖𝑇. It is worth noting that not all follow-ups will induce drug intervention; hence, the time of ith drug intervention 𝜏 may be greater than 𝑡 . If a drug intervention is triggered by the ith follow-up at 𝑡 , then the accumulative age is: ∆𝑖 = (1 − ρ)𝑡 . (3)
The instantaneous rate and the pdf of illness after the intervention action at 𝑡 is: 𝜆 (𝑢, 𝜃) = 𝜆 (𝑢 + Δ𝑖, 𝜃) where 𝑢 = 𝑥 − 𝑡 . (4)
The pdf and the cdf of illness after the intervention action at 𝑡 are: 𝑓 (𝑢, 𝜃) = 𝜆 (𝑢, 𝜃)𝑒 ( , ) = 𝜆 (𝑢 + Δ𝑖, 𝜃)𝑒 ( , ) (5)𝐹 (𝑢, 𝜃) = 1 − 𝑒 ( , ) . (6)
Moreover, the pdf and the cdf of readmission are defined as:
Figure 2. Illustration of the accumulative age.
Let ti be the time of the ith follow-up. In medical practice, follow-up activities arealways carried out according to physicians’ experience or based on a fixed interval ofT. For example, in the 2018 Diabetes clinical guidelines, the International Society forPediatric and Adolescent Diabetes (ISPAD) recommends three-month follow-ups for HbA1cmeasurement for adolescents with diabetes. In this study, the time of the ith follow-up isti = iT. It is worth noting that not all follow-ups will induce drug intervention; hence, thetime of ith drug intervention τi may be greater than ti. If a drug intervention is triggeredby the ith follow-up at ti, then the accumulative age is:
∆i = (1− ρ)ti. (3)
The instantaneous rate and the pdf of illness after the intervention action at ti is:
λi+1(u, θ) = λ0(u + ∆i, θ) where u = x− ti. (4)
The pdf and the cdf of illness after the intervention action at ti are:
fi+1(u, θ) = λi+1(u, θ)e−∫ u
0 λi+1(s,θ)ds = λ0(u + ∆i, θ)e−∫ u+∆i
∆i λ0(s,θ)ds (5)
Fi+1(u, θ) = 1− e−∫ u+∆i
∆i λ0(s,θ)ds. (6)
Moreover, the pdf and the cdf of readmission are defined as:
g(v) = h(v)e−∫ v
0 h(t)dt (7)
G(v) = 1− e−∫ v
0 h(t)dt. (8)
3.3.2. Probability of Drug Intervention
For the kth follow-up, if illness was detected and did not cause readmission, drugintervention actions could be taken to curb disease progression. If the last drug interventionwas conducted at ti(i < k − 1), the illness was developed at [(k− 1)T, kT] and did notcause readmission (see Figure 3), and the probability of drug intervention occurring at kTcan be calculated as:
P[(k− i− 1)T < u< (k− i− 1)T ∩ u + v >(k− i)T] =∫ (k−1)T
(k−i−1)Tfi+1(u)[1−G((k− i)T − u)]du. (9)

Healthcare 2021, 9, 1088 8 of 16
Healthcare 2021, 9, x 8 of 16
𝑔(𝑣) = ℎ(𝑣)𝑒 ( ) (7)𝐺(𝑣) = 1 − 𝑒 ( ) . (8)
3.3.2. Probability of Drug Intervention For the kth follow-up, if illness was detected and did not cause readmission, drug
intervention actions could be taken to curb disease progression. If the last drug interven-tion was conducted at 𝑡 (𝑖 < 𝑘 − 1), the illness was developed at [(𝑘 − 1)𝑇, 𝑘𝑇] and did not cause readmission (see Figure 3), and the probability of drug intervention occurring at 𝑘𝑇 can be calculated as: 𝑃[(𝑘 − 𝑖 − 1)𝑇 < 𝑢 < (𝑘 − 𝑖 − 1)𝑇 ∩ 𝑢 + 𝑣 > (𝑘 − 𝑖)𝑇] = 𝑓 (𝑢)( )( ) [1 − G((𝑘 − 𝑖)𝑇 − 𝑢)]𝑑𝑢. (9)
Figure 3. Illustration of drug intervention.
The probability of the last drug intervention occurring at 𝑡 is 𝑃 (𝑖, 𝑇); thus, average probability that a drug intervention action occurs at 𝑡 is: 𝑃 (𝑘, 𝑇) = ∑ 𝑃 (𝑖, 𝑇) 𝑓 (𝑢)( )( ) [1 − G((𝑘 − 𝑖)𝑇 − 𝑢)]𝑑𝑢,
where 𝑃 (0, 𝑇) = 1, k = 1, 2, … (10)
3.3.3. Probability of Readmission Similarly, if readmission happens in [(𝑘 − 1)𝑇, 𝑘𝑇] and the last drug intervention
was taken at 𝑖𝑇, the illness was developed in [(𝑘 − 1)𝑇, 𝑘𝑇] and caused readmission be-fore 𝑘𝑇 (see Figure 4). Recalling a recent drug intervention at 𝑖𝑇, the probability of read-mission in [(𝑘 − 1)𝑇, 𝑘𝑇] is 𝑃 (𝑘, 𝑇) = ∑ 𝑃 (𝑖, 𝑇) 𝑓 (𝑢, 𝜃)( )( ) 𝐺[(𝑘 − 𝑖)𝑇 − 𝑢]𝑑𝑢. (11)
0 iT (k-1)T kT
u illnessDrug intervention
t Figure 4. Process of readmission.
If a patient has not been readmitted until x (𝑚𝑇 < 𝑥 < (𝑚 + 1)𝑇), this means that the patient did not develop an illness at x, or they have developed an illness at [𝑚𝑇, 𝑥] but the illness did not cause readmission before x. Thus, the average probability of survival is
𝑅(𝑥, 𝑇) = ∑ 𝑃 (𝑖, 𝑇) 1 − 𝑓 (𝑢)𝑑𝑢 + 𝑓 (𝑢)[1 − G(𝑥 − 𝑖𝑇 − 𝑢)]𝑑𝑢( ) . (12)
3.3.4. Cost Model It is assumed that the cost of follow-up, drug intervention, and readmission treat-
ment are independent of the severity of the patient’s condition. Readmission treatment is assumed to be so perfect so as to restore the patient’s condition to the state when they
0 iT (k-1)T kT
u Drug intervention
t
Illness
Figure 3. Illustration of drug intervention.
The probability of the last drug intervention occurring at ti is Pd(i, T); thus, averageprobability that a drug intervention action occurs at tk is:
Pd(k, T) = ∑k−1i=0 Pd(i, T)
∫ (k−1)T(k−i−1)T fi+1(u)[1−G((k− i)T − u)]du,
where Pd(0, T) = 1, k = 1, 2, . . .(10)
3.3.3. Probability of Readmission
Similarly, if readmission happens in [(k− 1)T, kT] and the last drug intervention wastaken at iT, the illness was developed in [(k− 1)T, kT] and caused readmission before kT(see Figure 4). Recalling a recent drug intervention at iT, the probability of readmission in[(k− 1)T, kT] is
Pr(k, T) =k−1
∑i=0
Pd(i, T)∫ (k−1)T
(k−i−1)Tfi+1(u, θ)G[(k− i)T − u]du. (11)
Healthcare 2021, 9, x 8 of 16
𝑔(𝑣) = ℎ(𝑣)𝑒 ( ) (7)𝐺(𝑣) = 1 − 𝑒 ( ) . (8)
3.3.2. Probability of Drug Intervention For the kth follow-up, if illness was detected and did not cause readmission, drug
intervention actions could be taken to curb disease progression. If the last drug interven-tion was conducted at 𝑡 (𝑖 < 𝑘 − 1), the illness was developed at [(𝑘 − 1)𝑇, 𝑘𝑇] and did not cause readmission (see Figure 3), and the probability of drug intervention occurring at 𝑘𝑇 can be calculated as: 𝑃[(𝑘 − 𝑖 − 1)𝑇 < 𝑢 < (𝑘 − 𝑖 − 1)𝑇 ∩ 𝑢 + 𝑣 > (𝑘 − 𝑖)𝑇] = 𝑓 (𝑢)( )( ) [1 − G((𝑘 − 𝑖)𝑇 − 𝑢)]𝑑𝑢. (9)
Figure 3. Illustration of drug intervention.
The probability of the last drug intervention occurring at 𝑡 is 𝑃 (𝑖, 𝑇); thus, average probability that a drug intervention action occurs at 𝑡 is: 𝑃 (𝑘, 𝑇) = ∑ 𝑃 (𝑖, 𝑇) 𝑓 (𝑢)( )( ) [1 − G((𝑘 − 𝑖)𝑇 − 𝑢)]𝑑𝑢,
where 𝑃 (0, 𝑇) = 1, k = 1, 2, … (10)
3.3.3. Probability of Readmission Similarly, if readmission happens in [(𝑘 − 1)𝑇, 𝑘𝑇] and the last drug intervention
was taken at 𝑖𝑇, the illness was developed in [(𝑘 − 1)𝑇, 𝑘𝑇] and caused readmission be-fore 𝑘𝑇 (see Figure 4). Recalling a recent drug intervention at 𝑖𝑇, the probability of read-mission in [(𝑘 − 1)𝑇, 𝑘𝑇] is 𝑃 (𝑘, 𝑇) = ∑ 𝑃 (𝑖, 𝑇) 𝑓 (𝑢, 𝜃)( )( ) 𝐺[(𝑘 − 𝑖)𝑇 − 𝑢]𝑑𝑢. (11)
0 iT (k-1)T kT
u illnessDrug intervention
t Figure 4. Process of readmission.
If a patient has not been readmitted until x (𝑚𝑇 < 𝑥 < (𝑚 + 1)𝑇), this means that the patient did not develop an illness at x, or they have developed an illness at [𝑚𝑇, 𝑥] but the illness did not cause readmission before x. Thus, the average probability of survival is
𝑅(𝑥, 𝑇) = ∑ 𝑃 (𝑖, 𝑇) 1 − 𝑓 (𝑢)𝑑𝑢 + 𝑓 (𝑢)[1 − G(𝑥 − 𝑖𝑇 − 𝑢)]𝑑𝑢( ) . (12)
3.3.4. Cost Model It is assumed that the cost of follow-up, drug intervention, and readmission treat-
ment are independent of the severity of the patient’s condition. Readmission treatment is assumed to be so perfect so as to restore the patient’s condition to the state when they
0 iT (k-1)T kT
u Drug intervention
t
Illness
Figure 4. Process of readmission.
If a patient has not been readmitted until x (mT < x < (m + 1)T), this means that thepatient did not develop an illness at x, or they have developed an illness at [mT, x] but theillness did not cause readmission before x. Thus, the average probability of survival is
R(x, T) = ∑mi=1 Pd(i, T)
{1−
∫ x−iT0 fi+1(u)du +
∫ x−iT(m−i)T fi+1(u)[1−G(x− iT − u)]du
}. (12)
3.3.4. Cost Model
It is assumed that the cost of follow-up, drug intervention, and readmission treatmentare independent of the severity of the patient’s condition. Readmission treatment isassumed to be so perfect so as to restore the patient’s condition to the state when they werefirst discharged; hence, the time lapse between two adjacent readmissions can be regardedas a renewal cycle. The time of follow-up, drug intervention, and readmission treatmentcan be neglected in our assumption. The expected length of a renewal cycle is calculatedbased on the following formulation:
EL(T) =∫ ∞
0R(x, T)dx. (13)
If a renewal cycle is terminated at [(k− 1)T, kT], then the total cost during a renewalcycle is
C(k, T) = (k− 1)c f +k−1
∑i=1
Pd(k, T)cd + cr. (14)

Healthcare 2021, 9, 1088 9 of 16
Since the occurrence of readmission may occur in any follow-up interval, the expectedtotal cost per cycle over an infinite period is
EC(T) =∞
∑k=1
C(k, T)Pr(k, T). (15)
and therefore, the average expected cost during the post-discharge period is
EC(WP, T) =EC(T)EL(T)
Wh =∑∞
k=1 C(k, T)Pr(k, T)∫ ∞0 R(x, T)dx
Wh. (16)
3.4. The Optimization Model of Healthcare Warranty Policies
Under healthcare warranties, the expected total cost from a hospital’s perspective overthe planning horizon depends on the treatment intensity θ and the follow-up period T. Ourgoal is to optimize both the treatment intensity and the follow-up period to control health-care expenditures. The objective function of the healthcare warranty policy optimizationmodel is given as:
ECT = CT(θ) + EC(WP, T). (17)
4. Case Study4.1. Numerical Example
In this section, we perform numerical analyses on pediatric type 1 diabetes mellitus(T1DM). The primary goal of this research is to verify the feasibility of the proposedmodel and provide healthcare providers with a cost model and optimization method forhealthcare warranty policies. T1DM is a condition resulting from the pancreas’ inabilityto produce insulin, and it is characterized by elevated blood glucose. Diabetes requireslong-term comprehensive treatment and care, including insulin injections, diet control, andexercise. In addition, complications related to diabetes, such as diabetic ketoacidosis andhypoglycemia, increase readmission rates [48]. The dynamics of T1DM readmission occuras follows. First, the hospital chooses a treatment decision at θε[θmin, θmax] for patientsand incurred cost of treatment CT(θ) for the first stage. After the patient is discharged,the doctor will advise the patient to have an office visit every three months to see if theyhave developed a readmission-causing illness. The International Society for Pediatricand Adolescent Diabetes (ISPAD) also recommends that the pediatric and adolescentdiabetics have a follow-up every three months. When the illness first develops, it is usuallycharacterized by polydipsia, polyphagia, polyuria, and weight loss; however, it is not soserious enough to cause immediate readmission. During an office visit, routine laboratorytests for the HbA1c level and thyroid and endocrine functioning will be performed, as wellas an inquiry for physical illnesses. If an illness has developed and is detected in the officevisit, intervention measures, such as insulin injection and healthy guidance for patients,can be taken to control the disease progression. However, in cases where no examinationand intervention measures are taken, the illness will worsen over time and eventuallybecome so severe that the patient will be readmitted to the hospital. We called the periodbetween illness detection and readmission the delay time.
Based on our field research, we considered that the interval between discharge and theillness being detected follows a Weibull distribution with a shape parameter β1 and scaleparameter θ where the scale parameter θ is regarded as the treatment intensity during thehospitalization phase. The delay time follows a Weibull distribution with shape parameterβ2 and scale parameter α. Let β1 = 1.6, β2 = 1.1, α = 0.08, θmin = 0.1, θmax = 0.2. Thecost-related parameters used for the numerical experiment were based on an average ofthe costs associated with treatment pediatric and adolescent diabetes patients in a largegeneral hospital in Tianjin, as shown in Table 1.
Healthcare 2021, 9, 1088 10 of 16
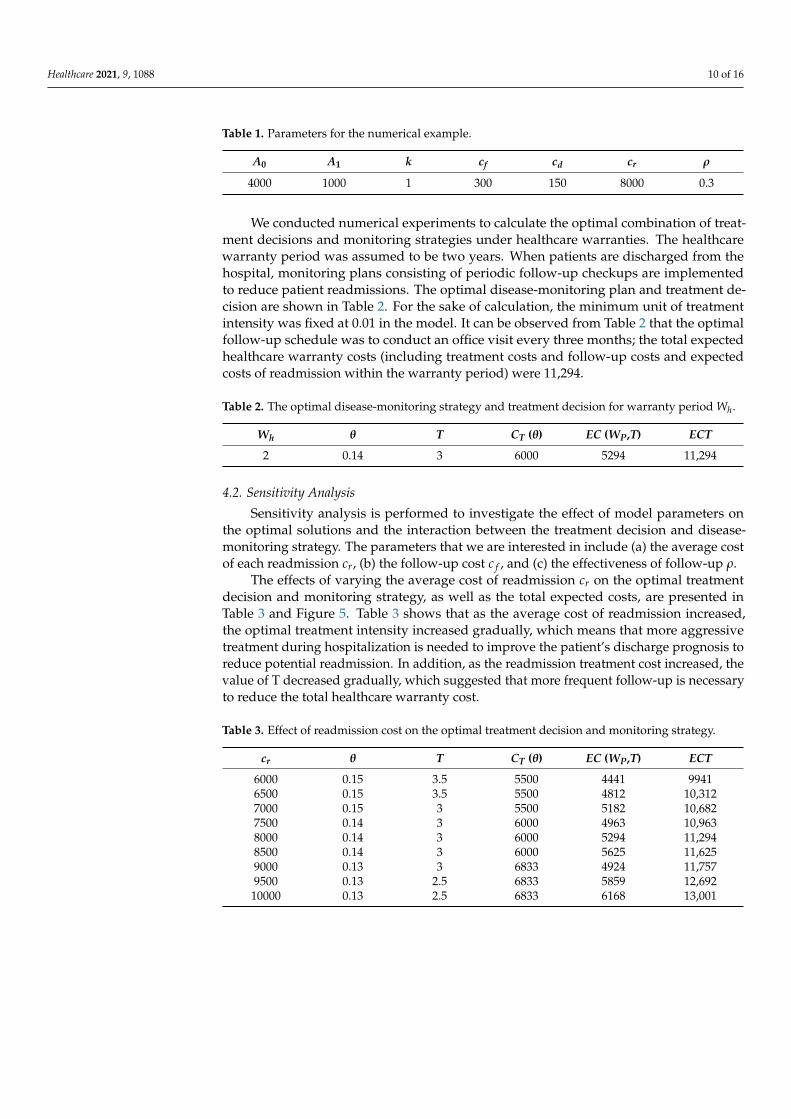
Table 1. Parameters for the numerical example.
A0 A1 k cf cd cr ρ
4000 1000 1 300 150 8000 0.3
We conducted numerical experiments to calculate the optimal combination of treat-ment decisions and monitoring strategies under healthcare warranties. The healthcarewarranty period was assumed to be two years. When patients are discharged from thehospital, monitoring plans consisting of periodic follow-up checkups are implementedto reduce patient readmissions. The optimal disease-monitoring plan and treatment de-cision are shown in Table 2. For the sake of calculation, the minimum unit of treatmentintensity was fixed at 0.01 in the model. It can be observed from Table 2 that the optimalfollow-up schedule was to conduct an office visit every three months; the total expectedhealthcare warranty costs (including treatment costs and follow-up costs and expectedcosts of readmission within the warranty period) were 11,294.
Table 2. The optimal disease-monitoring strategy and treatment decision for warranty period Wh.
Wh θ T CT (θ) EC (WP,T) ECT
2 0.14 3 6000 5294 11,294
4.2. Sensitivity Analysis
Sensitivity analysis is performed to investigate the effect of model parameters onthe optimal solutions and the interaction between the treatment decision and disease-monitoring strategy. The parameters that we are interested in include (a) the average costof each readmission cr, (b) the follow-up cost c f , and (c) the effectiveness of follow-up ρ.
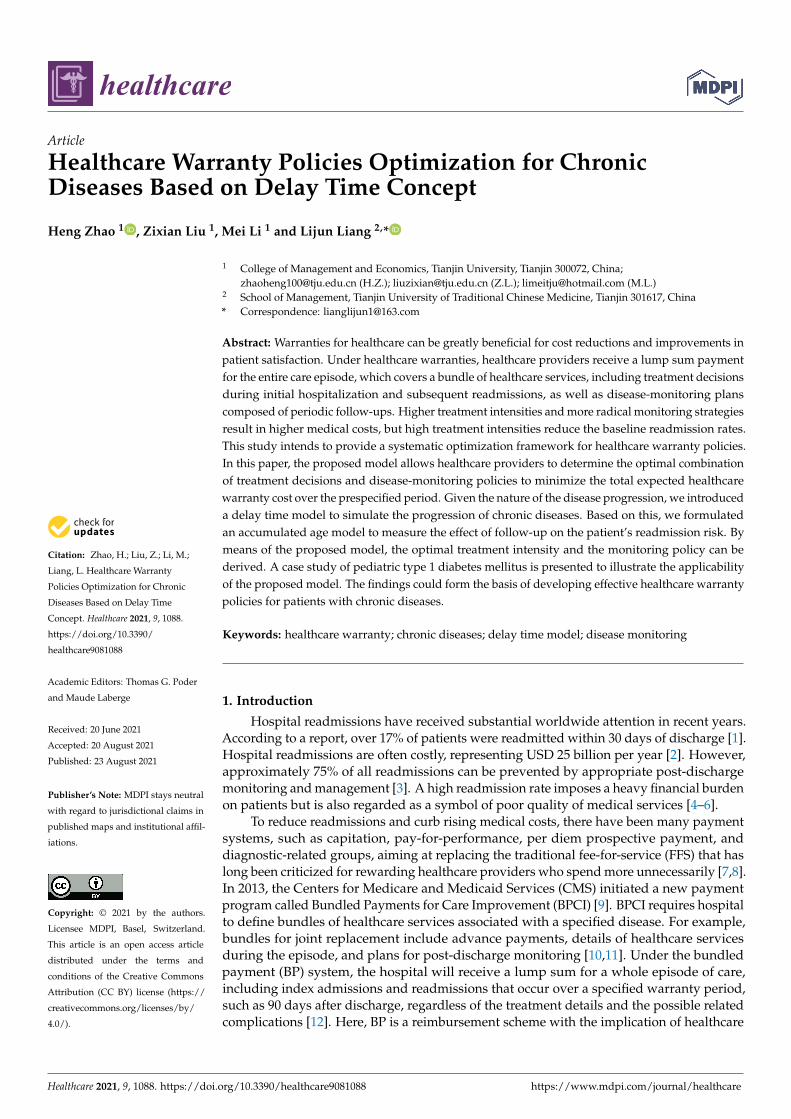
The effects of varying the average cost of readmission cr on the optimal treatmentdecision and monitoring strategy, as well as the total expected costs, are presented inTable 3 and Figure 5. Table 3 shows that as the average cost of readmission increased,the optimal treatment intensity increased gradually, which means that more aggressivetreatment during hospitalization is needed to improve the patient’s discharge prognosis toreduce potential readmission. In addition, as the readmission treatment cost increased, thevalue of T decreased gradually, which suggested that more frequent follow-up is necessaryto reduce the total healthcare warranty cost.
Table 3. Effect of readmission cost on the optimal treatment decision and monitoring strategy.
cr θ T CT (θ) EC (WP,T) ECT
6000 0.15 3.5 5500 4441 99416500 0.15 3.5 5500 4812 10,3127000 0.15 3 5500 5182 10,6827500 0.14 3 6000 4963 10,9638000 0.14 3 6000 5294 11,2948500 0.14 3 6000 5625 11,6259000 0.13 3 6833 4924 11,7579500 0.13 2.5 6833 5859 12,692
10000 0.13 2.5 6833 6168 13,001

Healthcare 2021, 9, 1088 11 of 16
Healthcare 2021, 9, x 11 of 16
8500 0.14 3 6000 5625 11,625 9000 0.13 3 6833 4924 11,757 9500 0.13 2.5 6833 5859 12,692
10000 0.13 2.5 6833 6168 13,001
Figure 5. Change in readmission cost parameter, cr, for total costs.
In the case study, the monitoring strategy consisted of periodic follow-up office vis-its, and each office visit incurred associated costs, including inspection costs, testing costs, and labor costs. Then, we analyzed the impact of follow-up costs on the optimal treatment decision and monitoring strategy by varying the follow-up costs cf. We started with a fol-low-up cost of 100 and increased it by 100. Table 4 summarizes the optimal combination of treatment decisions and monitoring strategy. From Table 4, we can see that as the fol-low-up cost increased, the optimal treatment intensity increased, but the optimal follow-up period did not show a significant variation pattern. In addition, the total healthcare warranty cost also showed an increasing trend. Figure 6 shows the change in total costs as the follow-up cost parameter changed.
Table 4. Effect of follow-up cost on the optimal treatment decision and monitoring strategy.
cf 𝜽 𝑻 𝑪𝑻 (𝜽) 𝑬𝑪 (𝑾𝑷, 𝑻) 𝑬𝑪𝑻 100 0.14 2.5 6000 3794 9794 200 0.14 3 6000 4494 10,494 300 0.14 3 6000 5294 11,294 400 0.14 3.5 6000 5894 11,894 500 0.13 3 6833 5977 12,810
Figure 5. Change in readmission cost parameter, cr, for total costs.
In the case study, the monitoring strategy consisted of periodic follow-up office visits,and each office visit incurred associated costs, including inspection costs, testing costs, andlabor costs. Then, we analyzed the impact of follow-up costs on the optimal treatmentdecision and monitoring strategy by varying the follow-up costs cf. We started with afollow-up cost of 100 and increased it by 100. Table 4 summarizes the optimal combinationof treatment decisions and monitoring strategy. From Table 4, we can see that as thefollow-up cost increased, the optimal treatment intensity increased, but the optimal follow-up period did not show a significant variation pattern. In addition, the total healthcarewarranty cost also showed an increasing trend. Figure 6 shows the change in total costs asthe follow-up cost parameter changed.
Table 4. Effect of follow-up cost on the optimal treatment decision and monitoring strategy.
cf θ T CT (θ) EC (WP,T) ECT
100 0.14 2.5 6000 3794 9794200 0.14 3 6000 4494 10,494300 0.14 3 6000 5294 11,294400 0.14 3.5 6000 5894 11,894500 0.13 3 6833 5977 12,810
Healthcare 2021, 9, x 12 of 16
Figure 6. Change in follow-up cost parameter, cf, for total costs.
The effects of the improvement factor of drug intervention in reducing readmission performance changes on optimal treatment decisions and treatment intensity was also studied. As shown in Table 5, as the improvement factor of drug intervention increased, the optimal treatment intensity showed a downward trend. The total expected healthcare warranty cost also decreased, which suggested improved medical technology and effec-tive drug development. Figure 7 shows the change in total costs as the improvement factor parameter of drug intervention change.
Table 5. Effect of improvement factor of drug intervention on the optimal treatment decision and monitoring strategy.
ρ 𝜽 𝑻 𝑪𝑻 (𝜽) 𝑬𝑪 (𝑾𝑷, 𝑻) 𝑬𝑪𝑻 0.1 0.13 2.5 6833 5528 12,361 0.2 0.13 3 6833 5072 11,905 0.3 0.14 3 6000 5294 11,294 0.4 0.14 3 6000 4847 10,847 0.5 0.14 3.5 6000 4655 10,655
Figure 6. Change in follow-up cost parameter, cf, for total costs.

Healthcare 2021, 9, 1088 12 of 16
The effects of the improvement factor of drug intervention in reducing readmissionperformance changes on optimal treatment decisions and treatment intensity was alsostudied. As shown in Table 5, as the improvement factor of drug intervention increased,the optimal treatment intensity showed a downward trend. The total expected healthcarewarranty cost also decreased, which suggested improved medical technology and effectivedrug development. Figure 7 shows the change in total costs as the improvement factorparameter of drug intervention change.
Table 5. Effect of improvement factor of drug intervention on the optimal treatment decision andmonitoring strategy.
ρ θ T CT (θ) EC (WP,T) ECT
0.1 0.13 2.5 6833 5528 12,3610.2 0.13 3 6833 5072 11,9050.3 0.14 3 6000 5294 11,2940.4 0.14 3 6000 4847 10,8470.5 0.14 3.5 6000 4655 10,655
Healthcare 2021, 9, x 13 of 16
Figure 7. Change in improvement factor parameter of drug intervention, ρ, for total costs.
5. Discussion 5.1. Principal Findings
Healthcare warranties can be greatly beneficial to reduce costs, improve care quality, and enhance the competitiveness of medical institutions. Although existing studies have proved the advantages of a healthcare warranty in theory and practice, currently imple-mented healthcare warranty policies are obtained empirically and subjectively without supporting quantitative analysis [9,14,15]. The optimization model of healthcare warranty policies presented in this paper contributes new insights to healthcare operation and man-agement.
The proposed model achieved the trade-off between treatment decisions and post-discharge monitoring strategies from a systematic point of view. Compared to the tradi-tional subjective experience-based approach, the proposed framework realized optimal allocation of resources and avoided overspending and loss of healthcare providers.
Since there is a time lapse between a readmission-causing condition and a readmis-sion, we used a delay time model to simulate the progression of chronic diseases. To cap-ture the effectiveness of the drug intervention on disease progression, the accumulated age model was employed. Currently, few studies have formulated the post-discharge monitoring strategy from the perspective of healthcare cost based on the delay time model [2,39], and there is little research on healthcare warranty policies that is based on analytical methods. This study fills this gap by constructing a healthcare warranty policy optimiza-tion model and providing new technologies and methods for healthcare research. The proposed model forms the basis for developing effective healthcare warranty policies for patients with chronic diseases.
5.2. Practical Implications The healthcare sector has long been plagued by rising healthcare costs, which have
put great pressure on the society and the government. Providing warranties for certain diseases contributes to care quality improvement and cost control. This study systemati-cally optimized treatment decisions and follow-up strategies for healthcare warranties, and it has great potential for assisting healthcare providers to reduce healthcare risks and the associated costs. The healthcare warranty costs are usually paid by the insurer, and the proportion of the payment depends on the type of medical insurance that the patient
Figure 7. Change in improvement factor parameter of drug intervention, ρ, for total costs.
5. Discussion5.1. Principal Findings
Healthcare warranties can be greatly beneficial to reduce costs, improve care quality,and enhance the competitiveness of medical institutions. Although existing studies haveproved the advantages of a healthcare warranty in theory and practice, currently imple-mented healthcare warranty policies are obtained empirically and subjectively withoutsupporting quantitative analysis [9,14,15]. The optimization model of healthcare war-ranty policies presented in this paper contributes new insights to healthcare operationand management.
The proposed model achieved the trade-off between treatment decisions and postdis-charge monitoring strategies from a systematic point of view. Compared to the traditionalsubjective experience-based approach, the proposed framework realized optimal allocationof resources and avoided overspending and loss of healthcare providers.
Since there is a time lapse between a readmission-causing condition and a readmission,we used a delay time model to simulate the progression of chronic diseases. To capture theeffectiveness of the drug intervention on disease progression, the accumulated age modelwas employed. Currently, few studies have formulated the post-discharge monitoring

Healthcare 2021, 9, 1088 13 of 16
strategy from the perspective of healthcare cost based on the delay time model [2,39], andthere is little research on healthcare warranty policies that is based on analytical methods.This study fills this gap by constructing a healthcare warranty policy optimization modeland providing new technologies and methods for healthcare research. The proposed modelforms the basis for developing effective healthcare warranty policies for patients withchronic diseases.
5.2. Practical Implications
The healthcare sector has long been plagued by rising healthcare costs, which haveput great pressure on the society and the government. Providing warranties for certaindiseases contributes to care quality improvement and cost control. This study systematicallyoptimized treatment decisions and follow-up strategies for healthcare warranties, and ithas great potential for assisting healthcare providers to reduce healthcare risks and theassociated costs. The healthcare warranty costs are usually paid by the insurer, and theproportion of the payment depends on the type of medical insurance that the patientpurchased. Therefore, the actual cost savings can reduce the expenses of the insurer andpromote the implementation of the healthcare warranty management.
The computational result of the proposed model in pediatric type 1 diabetes mel-litus cases resulted in the optimal healthcare warranty policy, that is, the combinationof treatment decision and monitoring strategy. The subsequent sensitivity analysis pro-vided further guidance for healthcare providers to develop flexible healthcare warrantypolicies because it revealed the impact of key parameters on healthcare warranty perfor-mance. Application of the proposed model and its findings has the potential for reducingreadmissions, improving healthcare quality, and reducing healthcare costs.
5.3. Limitations and Future Research
Despite the above theoretical and practical implications, this study has some lim-itations. First, the duration of readmission treatment and follow-up in this study wasassumed to be instantaneous. Further research can modify this assumption by usingrandom variables representing the checkup and treatment times. Second, the disease-monitoring strategy is consisted of periodic follow-ups. However, adjustments to thedisease-monitoring strategy are needed, since the patient’s disease progression is dynamicand complex. In this case, dynamic follow-up policies are more applicable and need tobe investigated, which may require the introduction of wearable devices [44]. Third, theproposed model is not suitable for all diseases. Our model focused on the certain diseases,especially chronic diseases with delayed readmission dynamics. In future research, itwill be fruitful to extend the model to the design of healthcare warranty policy for otherdiseases according to their characteristics.
6. Conclusions
This study presented a healthcare warranty strategy optimization model for deter-mining simultaneously the optimal combination of treatment decisions and the disease-monitoring strategy for patients with chronic diseases, which is aimed at minimizing thehealthcare provider’s total expected warranty cost over a prespecified warranty period.We modeled the dynamics of chronic disease progression using the delay time model. Theaccumulated age model was employed to capture the effectiveness of the drug interventionon disease progression. To verify the feasibility and effectiveness of the proposed model, acase study of diabetes patients was presented. According to the proposed model, the opti-mal combination of treatment decisions and disease-monitoring strategies was calculated.The model proposed in this paper helps to enrich the healthcare warranty theory, includingthe formulation of healthcare warranties and the analysis of warranty costs. In addition, theproposed model can also be extended to warranty management for other chronic diseases.The application of the proposed model has the potential to reduce healthcare costs andimprove care quality.

Healthcare 2021, 9, 1088 14 of 16
Author Contributions: Conceptualization, H.Z. and Z.L.; methodology, H.Z. and Z.L.; software,H.Z.; validation, H.Z., Z.L., M.L. and L.L.; formal analysis, M.L.; investigation, H.Z. and M.L.;resources, Z.L. and L.L.; data curation, H.Z. and L.L.; writing—original draft preparation, H.Z. andZ.L.; writing—review and editing, H.Z., Z.L., M.L. and L.L.; visualization, M.L.; supervision, Z.L.and L.L.; project administration, L.L.; funding acquisition, Z.L. All authors have read and agreed tothe published version of the manuscript.
Funding: This work was supported by the National Natural Science Foundation of China(Nos. 71871158, 91746205, and 72104180).
Institutional Review Board Statement: Not applicable.
Informed Consent Statement: Not applicable.
Data Availability Statement: The data presented in this study are available on request from thecorresponding author.
Conflicts of Interest: The authors declare no conflict of interest.
References1. Dua, A.; Rothenberg, K.A.; Wohlaer, M.; Rossi, P.J.; Lewis, B.D.; Brown, K.R.; Seabrook, G.R.; Lee, C.J. Unplanned 30-day
readmissions after endovascular aneurysm repair: An analysis using the Nationwide Readmissions Database. J. Vasc. Surg. 2019,70, 1603–1611. [CrossRef]
2. Liu, X.; Hu, M.; Helm, J.E.; Lavieri, M.S.; Skolarus, T.A. Missed Opportunities in Preventing Hospital Readmissions: RedesigningPost-Discharge Checkup Policies. Prod. Oper. Manag. 2018, 27, 2226–2250. [CrossRef]
3. Golmohammadi, D.; Radnia, N. Prediction modeling and pattern recognition for patient readmission. Int. J. Prod. Econ. 2016, 171,151–161. [CrossRef]
4. Gwadry-Sridhar, F.H.; Flintoft, V.; Lee, D.S.; Lee, H.; Guyatt, G.H. A systematic review and meta-analysis of studies comparingreadmission rates and mortality rates in patients with heart failure. Arch. Intern. Med. 2004, 164, 2315–2320. [CrossRef] [PubMed]
5. Linertova, R.; Garcia-Perez, L.; Vazquez-Diaz, J.R.; Lorenzo-Riera, A.; Sarria-Santamera, A. Interventions to reduce hospitalreadmissions in the elderly: In-hospital or home care. A systematic review. J. Eval. Clin. Pract. 2011, 17, 1167–1175. [CrossRef]
6. Chen, S.Y.; Kong, N.; Sun, X.X.; Meng, H.D.; Li, M.Y. Claims data-driven modeling of hospital time-to-readmission risk withlatent heterogeneity. Health Care Manag. Sci. 2019, 22, 156–179. [CrossRef]
7. Fainman, E.Z.; Kucukyazici, B. Design of financial incentives and payment schemes in healthcare systems: A review. Socio-Econ.Plan. Sci. 2020, 72. [CrossRef]
8. Hamada, H.; Sekimoto, M.; Imanaka, Y. Effects of the per diem prospective payment system with DRG-like grouping system(DPC/PDPS) on resource usage and healthcare quality in Japan. Health Policy 2012, 107, 194–201. [CrossRef]
9. Froimson, M.I.; Rana, A.; White, R.E.; Marshall, A.; Schutzer, S.F.; Healy, W.L.; Naas, P.; Daubert, G.; Iorio, R.; Parsley, B. BundledPayments for Care Improvement Initiative: The Next Evolution of Payment Formulations AAHKS Bundled Payment Task Force.J. Arthroplast. 2013, 28, 157–165. [CrossRef] [PubMed]
10. Behery, O.A.; Kester, B.S.; Williams, J.; Bosco, J.A.; Slover, J.D.; Iorio, R.; Schwarzkopf, R. Patterns of Ninety-Day ReadmissionsFollowing Total Joint Replacement in a Bundled Payment Initiative. J. Arthroplast. 2017, 32, 1080–1084. [CrossRef]
11. Ryan, S.P.; Goltz, D.E.; Howell, C.B.; Jiranek, W.A.; Attarian, D.E.; Bolognesi, M.P.; Seyler, T.M. Predicting Costs ExceedingBundled Payment Targets for Total Joint Arthroplasty. J. Arthroplast. 2019, 34, 412–417. [CrossRef] [PubMed]
12. Sood, N.; Huckfeldt, P.; Escarce, J.J.; Grabowski, D.C.; Newhouse, J.P. Medicare’s bundled payment pilot for acute and postacutecare. Health Aff. 2011, 30, 1708–1717. [CrossRef]
13. Casale, A.S.; Paulus, R.A.; Selna, M.J.; Doll, M.C.; Steele, G.D., Jr. “ProvenCareSM”: A Provider-Driven Pay-for-PerformanceProgram for Acute Episodic Cardiac Surgical Care. Ann. Surg. 2007, 246, 613–621; discussion 621–623. [CrossRef] [PubMed]
14. Adida, E.; Mamani, H.; Nassiri, S. Bundled Payment vs. Fee-for-Service: Impact of Payment Scheme on Performance. Manag. Sci.2017, 63, 1606–1624. [CrossRef]
15. Siddiqi, A.; White, P.B.; Mistry, J.B.; Gwam, C.U.; Nace, J.; Mont, M.A.; Delanois, R.E. Effect of Bundled Payments and HealthCare Reform as Alternative Payment Models in Total Joint Arthroplasty: A Clinical Review. J. Arthroplast. 2017, 32, 2590–2597.[CrossRef] [PubMed]
16. Carey, K. Measuring the Hospital Length of Stay/Readmission Cost Trade-Off Under a Bundled Payment Mechanism. HealthEcon. 2015, 24, 790–802. [CrossRef]
17. Mead, H.; Grantham, S.; Siegel, B. Improving Cardiovascular Care Through Outpatient Cardiac Rehabilitation An Analysis ofPayment Models That Would Improve Quality and Promote Use. J. Cardiovasc. Nurs. 2014, 29, 158–164. [CrossRef] [PubMed]
18. Falit, B.P.; Chernew, M.E.; Mantz, C.A. Design and Implementation of Bundled Payment Systems for Cancer Care and RadiationTherapy. Int. J. Radiat. Oncol. Biol. Phys. 2014, 89, 950–953. [CrossRef]
19. Xu, G.C.; Luo, Y.; Li, Q.; Wu, M.F.; Zhou, Z.J. Standardization of Type 2 Diabetes Outpatient Expenditure with Bundled PaymentMethod in China. Chin. Med. J. 2016, 129, 953–959. [CrossRef] [PubMed]
Healthcare 2021, 9, 1088 15 of 16
20. Ohar, J.A. Medicare Bundled Payments for Care Improvement Initiative for Chronic Obstructive Pulmonary Disease Readmissions:A Negative Study That Has Positive Implications. Ann. Am. Thorac. Soc. 2017, 14, 617–618. [CrossRef] [PubMed]
21. de Bakker, D.H.; Struijs, J.N.; Baan, C.B.; Raams, J.; de Wildt, J.E.; Vrijhoef, H.J.M.; Schut, F.T. Early Results From Adoption OfBundled Payment For Diabetes Care In The Netherlands Show Improvement In Care Coordination. Health Aff. 2012, 31, 426–433.[CrossRef]
22. Stefanini, A.; Aloini, D.; Benevento, E.; Dulmin, R.; Mininno, V. A data-driven methodology for supporting resource planning ofhealth services. Socio-Econ. Plan. Sci. 2020, 70, 1–14. [CrossRef]
23. Arnolds, I.V.; Nickel, S. Multi-period layout planning for hospital wards. Socio-Econ. Plan. Sci. 2013, 47, 220–237. [CrossRef]24. Dai, T.L.; Tayur, S. Healthcare Operations Management: A Snapshot of Emerging Research. Manuf. Serv. Oper. Manag. 2020, 22,
869–887. [CrossRef]25. Kastberg, G.; Siverbo, S. The Design and Use of Management Accounting Systems in Process Oriented Health Care—An
Explorative Study. Financ. Account. Manag. 2013, 29, 246–270. [CrossRef]26. Ngo, Q.H. Effectiveness of Management Accounting System in Public Healthcare Sector: An Empirical Investigation in Vietnam.
Asian J. Bus. Account. 2020, 13, 147–179. [CrossRef]27. Srinivasu, P.N.; SivaSai, J.G.; Ijaz, M.F.; Bhoi, A.K.; Kim, W.; Kang, J.J. Classification of Skin Disease Using Deep Learning Neural
Networks with MobileNet V2 and LSTM. Sensors 2021, 21, 2852. [CrossRef]28. Ali, F.; El-Sappagh, S.; Islam, S.M.R.; Kwak, D.; Ali, A.; Imran, M.; Kwak, K.S. A smart healthcare monitoring system for heart
disease prediction based on ensemble deep learning and feature fusion. Inform. Fusion 2020, 63, 208–222. [CrossRef]29. Ijaz, M.F.; Alfian, G.; Syafrudin, M.; Rhee, J. Hybrid Prediction Model for Type 2 Diabetes and Hypertension Using DBSCAN-
Based Outlier Detection, Synthetic Minority Over Sampling Technique (SMOTE), and Random Forest. Appl. Sci. 2018, 8, 1325.[CrossRef]
30. Li, M.; Liu, Z.X.; Liu, Y.L.; Li, X.P.; Lv, L. Optimal follow-up policies for monitoring chronic diseases based on virtual age. Int. J.Prod. Res. 2021. [CrossRef]
31. Keel, G.; Savage, C.; Rafiq, M.; Mazzocato, P. Time-driven activity-based costing in health care: A systematic review of theliterature. Health Policy 2017, 121, 755–763. [CrossRef] [PubMed]
32. Singh, A.P.; Pradhan, N.R.; Luhach, A.K.; Agnihotri, S.; Jhanjhi, N.Z.; Verma, S.; Kavita; Ghosh, U.; Roy, D.S. A Novel Patient-Centric Architectural Framework for Blockchain-Enabled Healthcare Applications. IEEE Trans. Ind. Inf. 2021, 17, 5779–5789.[CrossRef]
33. Jacobs, B.L.; He, C.; Li, B.Y.; Helfand, A.; Krishnan, N.; Borza, T.; Ghaferi, A.A.; Hollenbeck, B.K.; Helm, J.E.; Lavieri, M.S.; et al.Variation in readmission expenditures after high-risk surgery. J. Surg. Res. 2017, 213, 60–68. [CrossRef] [PubMed]
34. Gandra, S.R.; Lawrence, L.W.; Parasuraman, B.M.; Darin, R.M.; Sherman, J.J.; Wall, J.L. Total and component health care costs in anon-medicare HMO population of patients with and without type 2 diabetes and with and without macrovascular disease. J.Manag. Care Pharm. 2006, 12, 546–554. [CrossRef]
35. Wang, W.B. An overview of the recent advances in delay-time-based maintenance modelling. Reliab. Eng. Syst. Saf. 2012, 106,165–178. [CrossRef]
36. da Silva, J.G.; Lopes, R.S. An integrated framework for mode failure analysis, delay time model and multi-criteria decision-makingfor determination of inspection intervals in complex systems. J. Loss Prev. Process. Ind. 2018, 51, 17–28. [CrossRef]
37. Scarf, P.A.; Cavalcante, C.A.V.; Lopes, R.S. Delay-time modelling of a critical system subject to random inspections. Eur. J. Oper.Res. 2019, 278, 772–782. [CrossRef]
38. Fu, B.; Wang, W.B.; Shi, X. A risk analysis based on a two-stage delayed diagnosis regression model with application to chronicdisease progression. Eur. J. Oper. Res. 2012, 218, 847–855. [CrossRef]
39. Zhang, S.; Hanagal, P.; Frazier, P.I.; Meltzer, A.J.; Schneider, D.B. Optimal patient-specific post-operative surveillance for vascularsurgery. In Proceedings of the 7th INFORMS Workshop on Data Mining and Health Informatics, Phoenix, AZ, USA, 10 October2012; pp. 1–6.
40. Helm, J.E.; Alaeddini, A.; Stauffer, J.M.; Bretthauer, K.M.; Skolarus, T.A. Reducing Hospital Readmissions by Integrating EmpiricalPrediction with Resource Optimization. Prod. Oper. Manag. 2016, 25, 233–257. [CrossRef]
41. Sujan, M.A.; Habli, I.; Kelly, T.P.; Gühnemann, A.; Pozzi, S.; Johnson, C.W. How can health care organisations make and justifydecisions about risk reduction? Lessons from a cross-industry review and a health care stakeholder consensus developmentprocess. Reliab. Eng. Syst. Saf. 2017, 161, 1–11. [CrossRef]
42. Guo, P.F.; Tang, C.S.; Wang, Y.L.; Zhao, M. The Impact of Reimbursement Policy on Social Welfare, Revisit Rate, and Waiting Timein a Public Healthcare System: Fee-for-Service Versus Bundled Payment. Manuf. Serv. Oper. Manag. 2019, 21, 154–170. [CrossRef]
43. Malik, A.T.; Phillips, F.M.; Yu, E.; Khan, S.N. Are current DRG-based bundled payment models for lumbar fusions risk-adjustingadequately? An analysis of Medicare beneficiaries. Spine J. 2020, 20, 32–40. [CrossRef]
44. Tarakci, H.; Kulkarni, S.; Ozdemir, Z.D. The impact of wearable devices and performance payments on health outcomes. Int. J.Prod. Econ. 2018, 200, 291–301. [CrossRef]
45. Leeds, I.L.; Sadiraj, V.; Cox, J.C.; Gao, X.S.; Pawlik, T.M.; Schnier, K.E.; Sweeney, J.F. Discharge decision-making after complexsurgery: Surgeon behaviors compared to predictive modeling to reduce surgical readmissions. Am. J. Surg. 2017, 213, 112–119.[CrossRef] [PubMed]
Healthcare 2021, 9, 1088 16 of 16
46. Bavafa, H.; Savin, S.; Terwiesch, C.J.P.; Management, O. Managing Patient Panels with Non-Physician Providers. Prod. Oper.Manag. 2019, 28, 1577–1593. [CrossRef]
47. Bouguerra, S.; Chelbi, A.; Rezg, N. A decision model for adopting an extended warranty under different maintenance policies.Int. J. Prod. Econ. 2012, 135, 840–849. [CrossRef]
48. Robbins, T.; Keung, S.N.L.C.; Sankar, S.; Randeva, H.S.; Arvanitis, T.N. Risk factors for readmission of inpatients with diabetes: Asystematic review. J. Diabetes Its Complicat. 2019, 33, 398–405. [CrossRef]