Article for Pharma-Paper
21
Boiler House Division Page 1 of 21 STEAM QUALITY MATTERS Steam quality, in Pharma industry, plays a vital role in the quality of product. Steam quality also plays an important role in the batch time of a process. Although a known fact, little action is taken today to ensure that steam is generated with the right quality in the first place. Steam quality varies because of many boiler operational parameters. Effective monitoring of these parameters ensures proper quality and quantity. The boiler operation can be tuned to suit the specific plant operation when parameters like steam flow, temperature and pressure are monitored online. Maintaining proper drum TDS ensures minimum foaming and water carry over ensuring right steam quality. Feed water temperature, resulting in de-aeration of feed water also helps. “One third of the scope of energy conservation in steam systems is right there in the boiler house.” - Study of utility costs and savings potential conducted by Forbes Marshall for CII across various industry segments Boiler efficiency has been a focus at Forbes Marshall for many years. With our knowledge and expertise in steam systems, we have continuously developed products and system for over six decades now. About ten years ago, we started looking at efficiency of steam generation – the economics and what it takes to generate the right quantity and quality of steam. What is presented here is what we have learnt from hundreds of boiler houses here in India and abroad. We will cover: Why look at boiler Efficiency? o Cost of operating a boiler o Impact of boiler efficiency on steam generation o Scope of energy conservation in boiler house compared to over all potential in steam and condensate loop o Today’s scenario – What has changed over the last decade o Savings potential Calculating boiler efficiency Boiler efficiency measured in real life 33%
-
Upload
neettiyath1 -
Category
Documents
-
view
8 -
download
0
description
Pharma Paper
Transcript of Article for Pharma-Paper

Boiler House Division Page 1 of 21
STEAM QUALITY MATTERS
Steam quality, in Pharma industry, plays a vital role in the quality of product. Steam quality also plays an
important role in the batch time of a process. Although a known fact, little action is taken today to ensure that
steam is generated with the right quality in the first place.
Steam quality varies because of many boiler operational parameters. Effective monitoring of these parameters
ensures proper quality and quantity. The boiler operation can be tuned to suit the specific plant operation when
parameters like steam flow, temperature and pressure are monitored online. Maintaining proper drum TDS
ensures minimum foaming and water carry over ensuring right steam quality. Feed water temperature, resulting
in de-aeration of feed water also helps.
“One third of the scope of energy conservation in steam systems is right there in the boiler house.”
- Study of utility costs and savings potential conducted by Forbes Marshall for CII across various industry
segments
Boiler efficiency has been a focus at Forbes Marshall for many years. With our
knowledge and expertise in steam systems, we have continuously developed
products and system for over six decades now. About ten years ago, we started looking at efficiency of steam
generation – the economics and what it takes to generate the right quantity and quality of steam. What is
presented here is what we have learnt from hundreds of boiler houses here in India and abroad.
We will cover:
Why look at boiler Efficiency?
o Cost of operating a boiler
o Impact of boiler efficiency on steam generation
o Scope of energy conservation in boiler house compared to over all potential in steam and
condensate loop
o Today’s scenario – What has changed over the last decade
o Savings potential
Calculating boiler efficiency
Boiler efficiency measured in real life
33%
Boiler House Division Page 2 of 21
A day, a week and a season in the life of a boiler
o Factors affecting boiler efficiency
Practical Standard Operating Practices for improving boiler efficiency
Simple & effective tools available for Efficiency Monitoring
Case study of a Pharma plant

Boiler House Division Page 3 of 21
Cost of Operation – Oil / Gas fired boilers
Cost of Operation – Solid fuel fired boilers
Why look at boiler Efficiency?
Cost of operating a boiler
The cost of buying a new boiler is small compared to the amount of
money spent in operating the boiler year on year. This is a known fact
and also known is that this expense is governed by boiler efficiency.
Although “Boiler Efficiency” is an important parameter in the boiler
specification when buying a new boiler, little attention is given to it
once the boiler is steaming. The myth is that the boiler will always
continue to generate steam at the rated efficiency. The truth is that
one of the most critical parameters in boiler operation is its delivered
efficiency in actual operation. We say boiler efficiency is the most
critical parameter of boiler operation because every boiler generates
steam (its primary function and we have not yet come across a boiler
that does not generate steam). What distinguishes one boiler from
another is actually at what cost steam is generated.
What is your annual fuel bill?
Steam being generated Oil fired Boiler Gas fired Boiler Solid fuel Boiler
1 TPH Rs. 112 L Rs. 111 L Rs. 58 L*
5 TPH Rs. 560 L Rs. 555 L Rs. 290 L*
10 TPH Rs. 1120 L Rs. 1110 L Rs. 580 L*
20 TPH Rs. 2240 L Rs. 2220 L Rs. 1160 L*
Basis: Boilers generating steam at 10.5 kg/cm2 pressure with feed water temperature of 60 deg C, operating for
8000 hours per annum.
* Actual operating costs of solid fuel fired boiler are substantially more than indicated here due to huge electricity
and man power costs involved.
Our surveys plant after plant after plant show the true delivered boiler efficiency to be lower by 3% to 12% than rated. And
yes, all these plants thought they were getting the rated efficiency, or may be just slightly lower. Usually ignored, the boiler
continues running at lower efficiency and consuming much fuel more than it actually should. Data collected from a hundred
different boilers show boilers operating at very low efficiencies. This definitely would not been the case had people not
thought their boiler were operating efficiently. You would take action if you knew what your boiler’s efficiency was –
Would you not?
With these huge fuel bills, it is expensive to turn a blind eye to boiler efficiency!!

Boiler House Division Page 4 of 21
Case 2 – When Boiler Efficiency drops
Boiler100% Input Process
Distribution losses 5-7%
75% 70%
Boiler losses 25%20% Flash & Condensate
50% Process
So, for 1 Ton steam for process, fuel used equal to 2 Ton!!
Case 1 – Boiler operating Efficiently
Boiler100% Input Process
Distribution losses 5-7%
85% 80%
Boiler losses 15%20% Flash & Condensate
60% Process
So, for 1 Ton steam for process, fuel used equal to 1.67 Ton
Impact of boiler efficiency on steam generation
Consider a typical steam and condensate loop. This loop shows the flow of energy through the entire system.
The impact of drop in boiler efficiency can be seen in the loop diagram above. The consumption increases by 16 % when the
boiler efficiency drops by 10 %.
Today’s scenario – What has changed over the last decade?
Consider the fuel prices today and a decade ago.
Year 1997 – 1998
Fuel Cost Rated efficiency of boiler Fuel cost per ton of steam
Furnace oil Rs. 8 /- per L 84 % Rs. 560 /-
Natural Gas Rs. 4.5 /- per Nm3 81 % Rs. 347 /-
Coal Rs. 1600 /- per ton 78 % Rs. 293 /-
Year 2007 – 2008
Fuel Cost Rated efficiency of boiler Fuel cost per ton of steam
Furnace oil Rs. 20 /- per L 84 % Rs. 1400 /-
Natural Gas Rs. 18 /- per Nm3 81 % Rs. 1388 /-
Coal Rs. 4000 /- per ton 78 % Rs. 732 /-
Basis: Boilers generating steam at 10.5 kg/cm2 pressure with feed water temperature of 60 deg C
The cost of steam generation has gone up by about 2.5 times in the last decade. The cost of generating steam using a solid
fuel fired boiler today is greater than an oil fired boiler ten years ago!

Boiler House Division Page 5 of 21
Why are we talking about it now? Boilers have been steaming for over two hundred years.
The cost of fuels has increased significantly in the recent past; the rated boiler efficiency has not! Increasing fuel prices is
not a temporary phenomenon but is here to stay. This has pushed up the steam generation costs significantly. Also, the basic
instrumentation and practices required to monitor the boiler efficiency has come down during this period. Both these factors
put together have made boiler efficiency monitoring economical and beneficial for even small capacity boilers starting from
capacities of 1 TPH.
Boiler efficiency monitoring has never made so much sense as it does today.
If your boiler efficiency is not being measured and optimized, you would have lost Rs. 250 /- in the hour you took to read
this write up due to inefficient operations!! And the clock is still ticking!
Savings potential – What will you save even if you improve your boiler’s efficiency by a modest 3 %?
Steam being generated Oil fired Boiler Gas fired Boiler Solid fuel Boiler
1 TPH Rs. 4.2 L Rs. 4.3 L Rs. 1.68 L
5 TPH Rs. 21 L Rs. 21.5 L Rs. 8.4 L
10 TPH Rs. 42 L Rs. 43 L Rs. 16.8 L
20 TPH Rs. 84 L Rs. 86 L Rs. 33.6 L
Conclusion:
People understand the significance of boiler efficiency when buying a boiler.
Boilers are huge fuel consumers.
These boilers remain unmonitored when operating, resulting in poor efficiencies.
It is necessary to monitor boiler efficiency on a continuous basis.
Fuel prices have gone up, instrumentation costs have come down.
It is now economical to measure and sustain efficiency of even small process boilers.
It pays to monitor your boiler’s efficiency – Savings potential are huge.

Boiler House Division Page 6 of 21
Flow of energy in a boiler
Radiation – 2 %
Fuel100 %
Burner
Loss – 20 %•Stack
•Enthalpy•Un Burnt
Boiler
Draft – 5 %
Blow down – 3 %
Steam70 %
Air
Typical values of losses
Calculating boiler efficiency
Before we move on, we would like to clarify a few concepts in boiler efficiency measurement. Listed here are different ways
and norms of measuring efficiency, their advantages and disadvantages.
– Steam to Fuel ratio
edFuelConsum
atedSteamGenerFS :
This is simply a ratio of total steam generated to the total fuel consumed.
– Direct Efficiency
fFuelificValueOGrossCaloredFuelConsum
emperatureFeedWaterTlpySteamEnthaatedSteamGenerEfficiency
Direct Efficiency is a ratio of heat input to heat output.
– In-Direct Efficiency
)(100 ssBlowDownLoossRadiationLssEnthalpyLoStackLossEfficiency
In direct efficiency is calculated by measuring individual losses in the boiler and subtracting the sum of these losses from 100.
Advantages:A good indicator of fuel consumptionSimple to measure – requires measurement of only two parameters
Disadvantages:It is an indicator of boiler performance but is not boiler efficiency.This means that with the same boiler efficiency, you may have different S:F depending on feed water temperature, pressure at which steam is generated and calorific value of fuel.
Advantages:Covers all losses that happenSimple measurement – requires measurement of only four parameters
Disadvantages:Does not give a break up of lossesSensitive to instrument accuracyNeeds to be averaged over a period of time
Advantages:Gives a breakup of all lossesNot very sensitive to instrument accuracy
Disadvantages:Some losses like draft losses are difficult to measure and are generally not measured.

Boiler House Division Page 7 of 21
Losses in a boiler
1. Stack Losses: This is also known as Dry Flue Gas Loss. This happens Because Combustion Air Enters the
boiler at a lower temperature & when going out of stack is heated. the heat carried away by the air is Stack
Loss. These occur due to improper Excess air settings & burner modulation. Tuning of burner depending on
the load variation can reduce these losses to a large extent.
2. Enthalpy/Moisture losses: This loss depends on Moisture & hydrogen present in the fuel. Hydrogen
during combustion converts to water, so the moisture & water present in fuel get evaporated as they are in
hot environment. The heat carried away by the moisture is known as Enthalpy Loss.
3. Radiation Losses: This Loss occurs from the surface of the Boiler. Although radiation Loss is fixed, it
varies as a percentage depending on the Load of the Boiler.
4. Un-burnt Losses: Any Ash or Incomplete Combustion of Fuel Remaining Unburnt Contributes to this
loss.
5. Blow down Losses: When water is removed from boiler to maintain TDS it is replenished by Feed Water
which is at lower Temperature. The amount of heat required to heat the Feed water upto the Boiler water
temperature is the Blowdown Loss.
6. Draft Loss: When the boiler is turned off because of high pressure (when the steam demand is very low),
some air still enters the boiler. This air, as it is surrounded by hot steam, gets heated. The heat carried away
by this air is the draft loss.

Boiler House Division Page 8 of 21
Boiler efficiency measured in real life
Data collected from a 100 different boilers shows that the Efficiency delivered by the boiler in real life is much lower than
the rated efficiency of the boiler. The data is segregated on the basis of fuel type and different industries. In each of these
graphs, the X axis shows different boilers. For each of the boiler, it’s rated efficiency, measured direct efficiency and
indirect efficiency is indicated. The difference in direct and indirect efficiency is due to the fact that all the losses in indirect
efficiency cannot be measured. In most of these cases, this loss is because of On/Off cycles of boilers resulting in draft
losses.

Boiler House Division Page 9 of 21

Boiler House Division Page 10 of 21
Conclusion 1
17.1 %13.2 %3.9 %Solid
11.8 %6.7 %5.1 %Liquid
11.2 %8.2 %3 %Gas
Scope for savings (%)
Difference between In direct and
Ideal Efficiency
Difference between
Direct and In Direct
Efficiency
Fuel
17.1 %13.2 %3.9 %Solid
11.8 %6.7 %5.1 %Liquid
11.2 %8.2 %3 %Gas
Scope for savings (%)
Difference between In direct and
Ideal Efficiency
Difference between
Direct and In Direct
Efficiency
Fuel
• No Matter which fuel type you look at, the scope of savings is 10 % to 15 % at least.
• No boiler is an exception

Boiler House Division Page 11 of 21
Now if you look at boilers where boiler efficiency was being monitored continuously and corrective actions were being
taken as required, you see that the gap between delivered efficiency and rated efficiency comes down significantly.
Conclusion 3
• Boilers having EffiMax units give better average efficiency
• The EffiMax data has been compiled from EffiMax reports that we have.
• Each efficiency value has been reduced by 1.5 % for blowdown loss!!

Boiler House Division Page 12 of 21
Summary Data
The data collected from the 100 boilers is summarized in tabular form below. Also indicated in the table are values of
different losses that were measured.
Looking further into this data, the savings potential can be separated in terms of the gap between the direct and indirect
efficiency (as this difference is due to the losses not measured in indirect efficiency). These losses occur mostly due to the
boiler loading patterns and hence need different treatment as compared to other losses. The second gap to be bridged would
be the difference between the indirect efficiency and rated efficiency of the boiler. This gap exists because of traditional
losses that we know of like stack, enthalpy, radiation, etc.
A day, a week and a season in the life of a boiler
Having seen that the delivered boiler efficiency is much lower than the rated, it is now time to look at what happened to all
these good boilers. Is it that the manufacturers always claimed facts on paper that were never to be true? Is it that your
processes inherently are such that your boiler can never deliver rated efficiency? Is it that your boiler operators are illiterate
and you can not really expect anything out of them?
Although most of us would tend to relate and agree to the three questions above, they are not correct. Calculating boiler
efficiency and manufacturers claming some boiler efficiency on paper is science. The heat released during combustion, the
losses that happen during combustion, the heat that is transferred to the boiler, losses that happen from the boiler are all
possible to calculate. And they are not wrong. In fact it is practically possible to achieve this efficiency. If you talk about
DirectEfficiency
In DirectEfficiency
Rated Efficiency
Stack Loss
Enthalpy Loss
Radiation Loss
Boiler Capacity
Pharma 72.4 77.5 82.4 9.7 9.4 1.7 8
Gas 69.8 72.8 81 10 15 1.4 6
Oil 72.2 77.3 84 11.9 7.5 2.2 4
Solids 60.9 64.8 78 16.6 9.5 2 10
Difference between
Major Loss
D & ID ID & Ideal
Scope for Improvement
Loading Traditional
Pharma 5.1 4.9 10 High MediumGas 3 8.2 11.2 Medium High
Oil 5.1 6.7 11.8 High High
Solids 3.9 13.2 17.1 Medium High

Boiler House Division Page 13 of 21
process, no matter which industry you belong to, there are always patterns to your plant operation. These have to be
identified and you boiler set to cater to this pattern. You would see further various steaming patterns we have seen in
different industries. There is a pattern. The final question of knowledge of boiler operators – contrary to the myth that they
are hopeless, we have learnt more about boiler operation and efficiency from them rather than from books. So why don’t
they do things to improve efficiency today? Well, they do the most they can by looking at the flame colour, smoke colour,
ash colour and all. The fact is that we have not given them eyes to really look at what is happening to boiler efficiency in
terms of the required instrumentation. It really does not take much to look at the way boiler is operating, its impact on fuel
consumption and set up SOP’s for optimal boiler operation for the operator. As you have seen earlier, it is definitely worth
the effort you put in.
This is the Art of boiler efficiency.
Factors affecting boiler efficiency
There are many factors that affect the boiler efficiency. It is important to adjust the boiler for these variations regularly to
ensure optimum boiler performance.
Shift variations
Typically in plants, the load on the plant changes from shift to shift. If the boiler response to these load variations is not
changed, the efficiency of the boiler drops. The change in settings required can be as simple as changing the firing rate or
pressure limits of the boiler. These can be done easily from the boiler control panel itself. These changes are easy to do in
either oil, gas or solid fuel fired boilers.
A change may also be required in feed water tank level settings as the load may be lower in certain shifts. Also the blow
down rate needs to be adjusted to reduce blow down based on TDS and not based on time as the load is low.
The combustion system also needs some fine tuning as the day time and night time temperatures may change by 15 to 20
degree C. This variation would affect the excess air setting of the burner and hence dampers may need to be adjusted.
Daily variations
Load variations may occur from data to day too. Again, the boiler need to be adjusted to cater to this efficiently.
Weekly variations
As the fuel quality is changing continuously, adjustments need to be made to the combustion system to take care of these
variations. In oil or gas fired boilers, the quality of oil being received may vary from tanker to tanker. The moisture content

Boiler House Division Page 14 of 21
in solid fuels changes from time to time and the source of purchase. This change in fuel quality makes adjustments
necessary.
Seasonal variations
Boiler loading pattern is an important factor here too. The production requirement of the plant may be affected by seasonal
demands. This calls for adjustments again. In solid fuel fired boilers, the fuel available may change depending on seasons.
The ambient air temperatures and humidity will also change from season to season. The combustion system needs
adjustment too.
Study of different boilers and loading pattern
You would have seen from the data presented till now that understanding the loading pattern of the boiler and then setting
the boiler up accordingly is one of the key steps in improving boiler efficiency. But is it possible really to ascertain a loading
pattern?
It is quite possible to decide the boiler operation based on loading patterns. Given below are graphs of steam flow from
different Pharma plants and our analysis.
Just an example of an over sized boiler operating at very low loads and
not set for it. The efficiency as expected is very poor.
This graph here shows the boiler to be over sized. The load variation
is very very small. The burner is still cycling.

Boiler House Division Page 15 of 21
This boiler shows that the load is fairly high and constant at a bulk
drug facility.
Practical Standard Operating Practices for improving boiler efficiency
• Step 1
– Steam loading (Setting the Pressure control loop right)
• Boiler loading plays an important role in varying boiler efficiency
• The loading pattern can be well defined for most processes
• Setting of boiler control loops as per this data is needed
• Critical parameters – Steam flow and pressure (temperature)
• There is no other way to do this.
• Losses – ON / Off, Combustion, Radiation (In multiple boilers)
• Step 2
– Combustion losses (Setting the Air to fuel ratio right)
• Having done step one, this can be done fairly easily.
• Not only this, the first step HAS to be done before attempting this for any meaningful
output
• Critical parameters – Stack oxygen, temperature & steam temperature
• Losses – Combustion
• Step 3
– Blowdown (ABCO)
• Gets affected by – FW TDS, CRR, TDS Setpoint, Boiler loading
• Monitoring as a loss with others
• Critical parameters – TDS, FW temperature
• Losses – Blow down

Boiler House Division Page 16 of 21
The boiler Efficiency improvement ladder – Bridging the gaps.
• Gap 1 - Direct efficiency of 72 % & Indirect efficiency of
78 %
– Chimney draft loss during stand by
– Loss due to cold air purging during start up cycles
& during stand by
– On\Off cycles of the burner.
– These are losses that are generally not measured
and are very small in magnitude if the boiler is
operated continuously. These factors play an
important role if the boiler load is low or varying a
lot.
• By monitoring the steam flow patterns over a period of time,
the peak and low load demands can be easily mapped out.
• EffiMax provides graphs & reports of such parameters based on which corrective action like operating with a
different nozzle size or on low fire continuously can be taken.
• All the boiler efficiency products generate data critical for reducing fuel consumption and also keep a check on the
process itself.
• Gap 2 - Average indirect efficiency of 78% and the best indirect efficiency of 84%
– Improper tuning of burner.
– This gap can be bridged easily by monitoring the stack oxygen and temperature on a regular basis.
• The boiler loading and variations in fuel firing rate also play an important role in burner combustion. The burner
tuning needs regular adjustments because of variation in fuel quality and burner nozzle condition too.
• Bridging this gap does not mean investing in expensive control system but by simply monitoring and making slight
adjustment to the excess air in the burner result in good burner performance.
• The EffiMax provides this data by stack Oxygen & temperature measurement. It also provides reports & graphs of
variation in O2 which are required for taking the right corrective action.
• Gap 3 - Minimum direct efficiency of 61 % and maximum indirect efficiency of 84 %
– Bridged when all boiler operating parameters in terms of regular tuning, load management on the boiler,
feed water temperature, etc. in the boiler house is done regularly
• Maintaining the correct level in the feed water tank for better feed water temperature

Boiler House Division Page 17 of 21
Simple & effective measurement of boiler efficiency
Direct Efficiency - EffiMax 1000
The EffiMax 1000 provides “Real time Efficiency’ measurement for the boiler by the Direct Method. This compact
system measures the steam and fuel flow, steam and feed water temperature to compute the S:F ratio and Direct
Efficiency. Designed keeping in mind the small boiler house, where elaborate instrumentation is not
commercially justified, the EffiMax 1000 provides powerful diagnostics through a PC based software where all
the parameters are displayed, trended, logged and reported. This system can be used for oil, gas or FBC boilers.

Boiler House Division Page 18 of 21
In Direct Efficiency - EffiMax 2000
This first packaged ‘Total Boiler Efficiency Monitoring’ system incorporates every important parameter into one
package: flue gas O2 levels, stack gas temperature, blow down losses, radiation losses, feed water temperature
and density compensated steam flow rate. With these inputs EffiMax calculates your boiler’s absolute efficiency
in general accordance with British Standard’s recommendation BS845. This calculation is then compared to your
boiler manufacturer’s stated optimum efficiency to determine overall performance. The EffiMax 2000 can be
installed on any type of boiler. The system generates various forms of output like tabular log, graphical
representation, alarms and preventive maintenance tips.
Boiler House Division Page 19 of 21
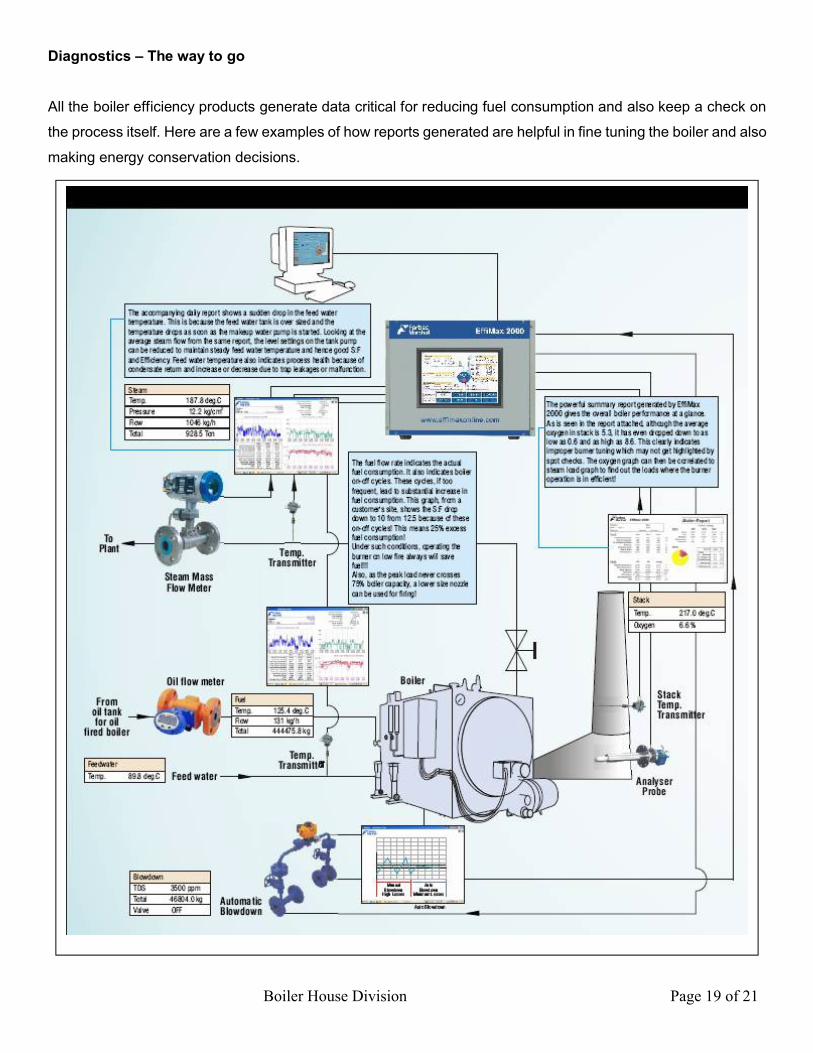
Diagnostics – The way to go
All the boiler efficiency products generate data critical for reducing fuel consumption and also keep a check on
the process itself. Here are a few examples of how reports generated are helpful in fine tuning the boiler and also
making energy conservation decisions.

Boiler House Division Page 20 of 21
Case Study of a Pharma plant using an Oil fired boiler.
Data collected from site:
Findings in the reports:
• Low Steam load leads Frequent on/off cycles of burners
delivering low S:F ratio between 11 to 12
• Constant Steam load can maintain Steam:Fuel ratio between 14 to 15.
• Average, Minimum and Maximum values:
Corrective action required for sustained Boiler Efficiency between 81% to 83%
• Looking at the Steam flow graph better efficiency can be achieved by loading boiler above 550 Kg/hr (because of
Burner Turn down)
• Boiler has 2TPH capacity but the load has never exceeded 580Kg/hr.
• Looking at the Direct Efficiency graph we recommend to change burner nozzle to lower size or to manually fire the
burner at low fire to ensure reduction in frequent ON/OFF of the burner which is the major culprit for drastically
reducing the efficiency
• The boiler is normally running at very low steam pressures. This will result in wet steam and hence more steam
being consumed by the process.

Boiler House Division Page 21 of 21
Steam Flow
0
0.1
0.2
0.3
0.4
0.5
0.6
Efficiency
22
42
62
82
S team Pressure
2.0
4.0
6.0
• The boiler pressure switch settings should be changed to ensure steam is generated between 8 – 10 kg/cm2.
PARAMETRS
Steam
Load
STEAM
PRESSURE
FEED WATER
TEMPERATURE
STEAM :
FUEL
RATIO
DIRECT
EFFICIENCY
MAXIMUM 0.58 7.4 98 15.3 83.6
MINIMUM 0.04 2 46 11.1 63.3
AVERAGE 0.32 5.17 75.72 12.93 73.78