Article Analysis of susceptibility to slope movements in ...
24
Article Analysis of susceptibility to slope movements in the environ- ment of road infrastructures. Models for obtaining predictive mapping applied to roads in the provinces of Malaga and Gra- nada (Spain) María J. Perles-Roselló 1 , Santiago Pardo-García 2 , Juan F. Sortino-Barrionuevo 3 , Sergio Reyes-Corredera 4 and Clau- dio Puglisi 5, * 1 Department of Geography. University of Málaga, Málaga, Spain; [email protected] 2 Department of Geography. University of Málaga, Málaga, Spain; [email protected] 3 Department of Geography. University of Málaga, Málaga, Spain; [email protected] 4 Geographical Analysis Research Group. Department of Geography. University of Málaga, Málaga, Spain; [email protected] 5 ENEA: Italian National Agency for Energy, New technologies and Environment-Roma, Via Anguillarese, 301, Santa Maria di Galeria–00100, Roma, Italy; [email protected] * Correspondence: [email protected]; Tel.: +34952133444 Abstract: This study addresses the peculiarities of the generation of slope movements in the context of road infrastructures and provide a predictive mapping of susceptibility to movements on slopes adjacent to road infrastructures (rockfalls). An inventory of slopes movements was mapped. From the development of the inventory of constant cases of mobilization that is used as a dependent var- iable, two statistical models can be obtained and compared for the same study area. One of them is based on the concept of frequency, whilst the other one is based on the application of a logistic regression. The results reveal the preponderant importance of lithology as a predictive variable, followed, at a considerable distance, by the slope gradient. Likewise, the importance of an unnatural and characteristic variable area of study, such as the presence of artificial cuts, is indicated as a causative factor. The results show a high degree of coincidence between the tendency of suscepti- bility predicted by the model, and the effective presence of empirical mobilization signs on the slopes, with Area Under Curve (AUC) values for Receiver Operating Characteristics (ROC) around 0.8. Keywords: Road infrastructures; risk; slope movements; cartography of susceptibility. 1. Introduction The study of the propensity to slope movements on the slopes adjacent to linear road infrastructures (roads, railways, and other similar ones) requires a particular analysis of the susceptibility factors, since the high degree of anthropic alteration generates a mixed context between the natural and the artificial. In this situation, the conditions in which the predisposing factors to mobilization act can change their habitual behavior ([1]; [2]; [3]). The elaboration of land susceptibility cartographies to mass movements has been broadly studied when they occur in a natural environment. On the contrary, work on sus- ceptibility to mass movements in anthropized environments, has been less frequently treated. However, this is the area in which risk studies by mass movements acquire a more applied sense, given the strategic nature of the exposed elements (traffic, functional and economic activities affected by their interruption, and the infrastructure itself). Authors such as [4] have highlighted the importance of solving risk problems that affect infrastruc- tures in tourist areas. [5] or [6], among others, highlight the importance of mass Preprints (www.preprints.org) | NOT PEER-REVIEWED | Posted: 29 June 2021 doi:10.20944/preprints202106.0704.v1 © 2021 by the author(s). Distributed under a Creative Commons CC BY license.
Transcript of Article Analysis of susceptibility to slope movements in ...
Article
Analysis of susceptibility to slope movements in the environ-
ment of road infrastructures. Models for obtaining predictive
mapping applied to roads in the provinces of Malaga and Gra-
nada (Spain)
María J. Perles-Roselló1, Santiago Pardo-García2, Juan F. Sortino-Barrionuevo3, Sergio Reyes-Corredera4 and Clau-
dio Puglisi5,*
1 Department of Geography. University of Málaga, Málaga, Spain; [email protected] 2 Department of Geography. University of Málaga, Málaga, Spain; [email protected] 3 Department of Geography. University of Málaga, Málaga, Spain; [email protected] 4 Geographical Analysis Research Group. Department of Geography. University of Málaga, Málaga, Spain;
[email protected] 5 ENEA: Italian National Agency for Energy, New technologies and Environment-Roma, Via Anguillarese, 301,
Santa Maria di Galeria–00100, Roma, Italy; [email protected]
* Correspondence: [email protected]; Tel.: +34952133444
Abstract: This study addresses the peculiarities of the generation of slope movements in the context
of road infrastructures and provide a predictive mapping of susceptibility to movements on slopes
adjacent to road infrastructures (rockfalls). An inventory of slopes movements was mapped. From
the development of the inventory of constant cases of mobilization that is used as a dependent var-
iable, two statistical models can be obtained and compared for the same study area. One of them is
based on the concept of frequency, whilst the other one is based on the application of a logistic
regression. The results reveal the preponderant importance of lithology as a predictive variable,
followed, at a considerable distance, by the slope gradient. Likewise, the importance of an unnatural
and characteristic variable area of study, such as the presence of artificial cuts, is indicated as a
causative factor. The results show a high degree of coincidence between the tendency of suscepti-
bility predicted by the model, and the effective presence of empirical mobilization signs on the
slopes, with Area Under Curve (AUC) values for Receiver Operating Characteristics (ROC) around
0.8.
Keywords: Road infrastructures; risk; slope movements; cartography of susceptibility.
1. Introduction
The study of the propensity to slope movements on the slopes adjacent to linear
road infrastructures (roads, railways, and other similar ones) requires a particular analysis
of the susceptibility factors, since the high degree of anthropic alteration generates a
mixed context between the natural and the artificial. In this situation, the conditions in
which the predisposing factors to mobilization act can change their habitual behavior ([1];
[2]; [3]).
The elaboration of land susceptibility cartographies to mass movements has been
broadly studied when they occur in a natural environment. On the contrary, work on sus-
ceptibility to mass movements in anthropized environments, has been less frequently
treated. However, this is the area in which risk studies by mass movements acquire a more
applied sense, given the strategic nature of the exposed elements (traffic, functional and
economic activities affected by their interruption, and the infrastructure itself). Authors
such as [4] have highlighted the importance of solving risk problems that affect infrastruc-
tures in tourist areas. [5] or [6], among others, highlight the importance of mass
Preprints (www.preprints.org) | NOT PEER-REVIEWED | Posted: 29 June 2021 doi:10.20944/preprints202106.0704.v1
© 2021 by the author(s). Distributed under a Creative Commons CC BY license.

movements in the functioning of the city as a whole. Roadblocks and traffic stop as a result
of slope movements are especially traumatic in peri-urban areas, since if mass movements
happen after torrential rainfall, they do also occur simultaneously to floods of the urban
area and/or overflows of urban and peri-urban channels. Because of that, the accessibility
through alternative routes gets difficult, and the situation of crisis, emergency and risk for
the population increases ([7]; [8]; [9]; [4]; [10]).
The identification of the points of the route with greater probability of being affected
by mass movements allows decision makers to give priority to the most urgent preventive
measures on each road, and thus, to directly contribute to reducing costs post-event, im-
proving safety conditions and the sustainability of the infrastructure. The proposed model
of susceptibility to mobilization that is presented here can be useful in infrastructures al-
ready built, but it can also be used in the project phase in order to simulate which would
be the degree of danger for the alternative proposed paths. The subject of matter acquires
a special interest and topicality in view of the promulgation of regulations that urge to the
elaboration of specific risk maps for the especially sensitive environments of the so-called
Critical Infrastructures.
The ultimate objective of this study is to propose different methodological strategies
for the elaboration of maps of susceptibility to slope movements adjacent to road infra-
structures, as well as to apply them and compare the results of the different predictive
models proposed. Two alternative predictive models based on methods of varying de-
grees of complexity will be applied, and the predicted degrees of susceptibility will be
validated with empirical data (evidence of movement collected in an inventory of slopes
with detected signs of mobilization and fall). Therefore, the specific objectives addressed
in this work are the following:
● To carry out a cartographic detailed inventory of the slopes adjacent to road infra-
structures with effective signs of slope movements. This information will be used
as a dependent variable in the susceptibility model based on a Weights-of-Evi-
dence method.
● Prepare a predictive mapping of susceptibility to movement on slopes adjacent to
road infrastructures. The predictive model is intended to include the particulari-
ties of the mixed environment (natural and artificial) in which the mobilization
occurs, considering anthropic and natural controlling and triggering factors.
● To apply two types of methodological strategies of fundamentals and differenti-
ated complexity for the deduction of the susceptibility model, based on the fre-
quency (mode), and logistic regression.
● Test the predictive potential of susceptibility mapping in a validation experiment.
● To compare the results obtained through the different methods applied, and to
conclude on their suitability for the analysis in the context of application.
1.1. Background and state of art
The International Association of Engineering Geology (IAEG), together with the
UNESCO, was pioneered in the 70s of the twentieth century in the development of meth-
odologies to assess and map the susceptibility to mass movements and geological risks.
Since in 2006, the Thematic Strategy for the Protection of Soil of the European Union rec-
ognized rockslides as one of the eight major threats worldwide, systematic mapping stud-
ies on the susceptibility to gravitational movements have proliferated. A reference contri-
bution in this line is the report "Guidelines for landslide susceptibility, hazard and risk
zoning for land use planning" ([11]), in which the international working group on land-
slides JTC1 (Joint International Technical Committee on Landslides and Engineering
Slopes), has attempted to standardize the evaluation and mapping of susceptibility and
hazard by slope movements.
In Europe, many countries have developed national inventory landslide maps
and, subsequently, susceptibility maps. To homogenize this large amount of data, in the
framework of the European Soil Thematic Strategy, in 2007, the European Soil Bureau Net-
work (ESBN) proposed a project for mapping the susceptibility to landslides on the
Preprints (www.preprints.org) | NOT PEER-REVIEWED | Posted: 29 June 2021 doi:10.20944/preprints202106.0704.v1
European scale (i.e., 1: 1 million). This project has produced the preliminary European
landslide susceptibility map (ELSUS 1000) ([12]). In Spain, the main contributions have
been made by the Geological Survey of Spain (IGME), which has published inventory
maps of rockslides since the 80s, and susceptibility maps at different scales of the different
studied regions.
At the academic level, the development of susceptibility maps to mass movements
has been widely addressed by researchers, although the object of study has preferably been
the analysis of mass movements in natural environments, without considering the possible
influence of anthropic factors. Some authors have addressed the problem by assessing the
propagation distance ([13]; [14]) as well as the form of the potential transit and accumula-
tion areas ([15]). Other authors have tried to adapt the methods to the climatic or physio-
graphic contexts in which they are applied ([12]).
The mapping procedure has been traditionally treated by using geomorphological
methods, and progressively, methodologies based on multivariate statistics and GIS tech-
niques ([16]; [17]; [18]; [19]; [11]; [3]; [20]; [21]; among others) were applied. Other authors
have contributed research in the evaluation of slope movements on rocky slopes. The tech-
niques and methods of the geomechanical approach have been advancing since the contri-
butions of [22], [23], or [24], up to recent proposals by [25] for quantitative hazard and risk
assessment.
The proposed methodologies for assessing susceptibility at a detailed scale are
very different and there is no general consensus among them. These methodologies are
also conditioned by the amount and type of data available and by the scale of the study
([26]). Different approaches can be distinguished, such as those of heuristic overlap ([27]),
statistical with a descriptive sense and supervised allocation of weights ([28] and [29]), or
inferential, which implies a statistical use, e.g., univariate logistic regression ([30]), or mul-
tivariate. Authors such as [31] and [32] apply a deterministic approach, and others such as
[33] and [19], apply different techniques to develop cartographies and perform a compar-
ative analysis of their results.
In the present study, the application of a multivariate logistic regression is used as
the basis of the methodology. This method has been widely used to perform susceptibility
mapping for predictive purposes in different countries. ([34], [35]; [36], [37], [38]; [16]; [39];
[40]; [41]; [20]; [42]; [43]; [44]).
Linear infrastructures constitute a very sensitive environment not only because the
structures themselves can be affected by mass movements, but also because the anthropic
intervention alters the nature of the slope by varying the original level of susceptibility,
and thus, modifying the conditions under which the determining and mobilizing activa-
tion factors act ([1]; [2]; [3]; [6]).
Previous studies of the behavior of mass movements when they occur nearby
roads and road infrastructures can be cited ([45]; [46]; [47]; [40]; [48]; [29]; [19]; [8]). This
line of research has been less frequently explored, despite its direct and applied interest,
especially if it is about road infrastructures that articulate the peri-urban spaces of the city
([5]), on which a large part of the urban economic and demographic functioning depends
([7])
2. Materials and Methods
2.1. Study area
The proposed predictive procedure has been applied to roads of different categories
in the provinces of Málaga and Granada (Andalusia, Spain). Altogether, a total of 563
slopes adjacent to the road have been mapped and analyzed, arranged in an overlying or
underlying way along 76 km of road infrastructure. Specifically, three different sections
of roads have been selected:
● Section 1. Road A-357, whose sector of study goes from the town of Casapalma to
the junction of the A-357 with the A-367 (pk.14 to pk.48). This section runs for 34
km and is made up of 335 slopes adjacent to the road.
Preprints (www.preprints.org) | NOT PEER-REVIEWED | Posted: 29 June 2021 doi:10.20944/preprints202106.0704.v1
● Section 2. Málaga ring road. This area of study goes entirely through the munici-
pality of Málaga. Runs for 15,5 km and is made up of 190 slopes adjacent to the
road.
● Section 3. Highway connecting Motril with Granada. This section extends for 26,5
kms and is made up of 38 slopes adjacent to the road.
The sections of road infrastructure selected for the study are spread over an area
characterized by very steep gradients. From the geological point of view, it has a structural
and tectonic complexity that grants great variability to the area, with juxtaposition and
superposition of series of very different characteristics (Paleozoic schistose materials,
Permo-Triassic series of conglomerates, plasters and clays, ultra-basic rocks (hazburguites
and peridotites) and limestones and Jurassic dolomites, fundamentally). These materials,
sometimes overlapped, have a high contrast in both the permeability and mechanical be-
havior of the rock, which increases the casuistry of susceptibility to movement. Suscepti-
bility to mass movement on natural slopes close to the study area has been studied by [49]
and [50]. The [51] has also published a generic cartography of natural risks in the province
of Granada, which includes the treatment of the risk of mass movements.
The three study areas are located in a Mediterranean climate area. Concatenation of
persistent rainy episodes with moderate intensity during several days are frequent, in
which, at some point, rains of high intensity and with enough kinetic energy are produced,
and they act as an activating factor of mobilization. This rainfall regime favors the phe-
nomenon called multiple occurrence regional landslide events (MORLEs), where hun-
dreds or thousands of surface rockslides happen roughly simultaneously within a deter-
mined area [52].
The peri-urban character of some of the infrastructures that constitute the area of
analysis increases the likelihood of anthropic interventions in the environment, and thus,
the existence of activating factors of the movement from an artificial origin, which in-
creases the danger. On the other hand, these are areas of very high population vulnerabil-
ity to slope movements. Effects over infrastructures in peri-urban areas produce a territo-
rial dysfunctionality, which affects a high number of inhabitants and basic territorial func-
tions such as the accessibility to housing and workplace, transport and the supply of
goods, among the most prominent. The specific problems of mass movements in an-
thropized environments and close to road infrastructures have been studied in the context
of the study area by [7] and [53].
All these characteristics show a high probability of mobilization in the selected ar-
eas, as well as a varied casuistry of causative factors, both of which have determined their
selection.
Preprints (www.preprints.org) | NOT PEER-REVIEWED | Posted: 29 June 2021 doi:10.20944/preprints202106.0704.v1
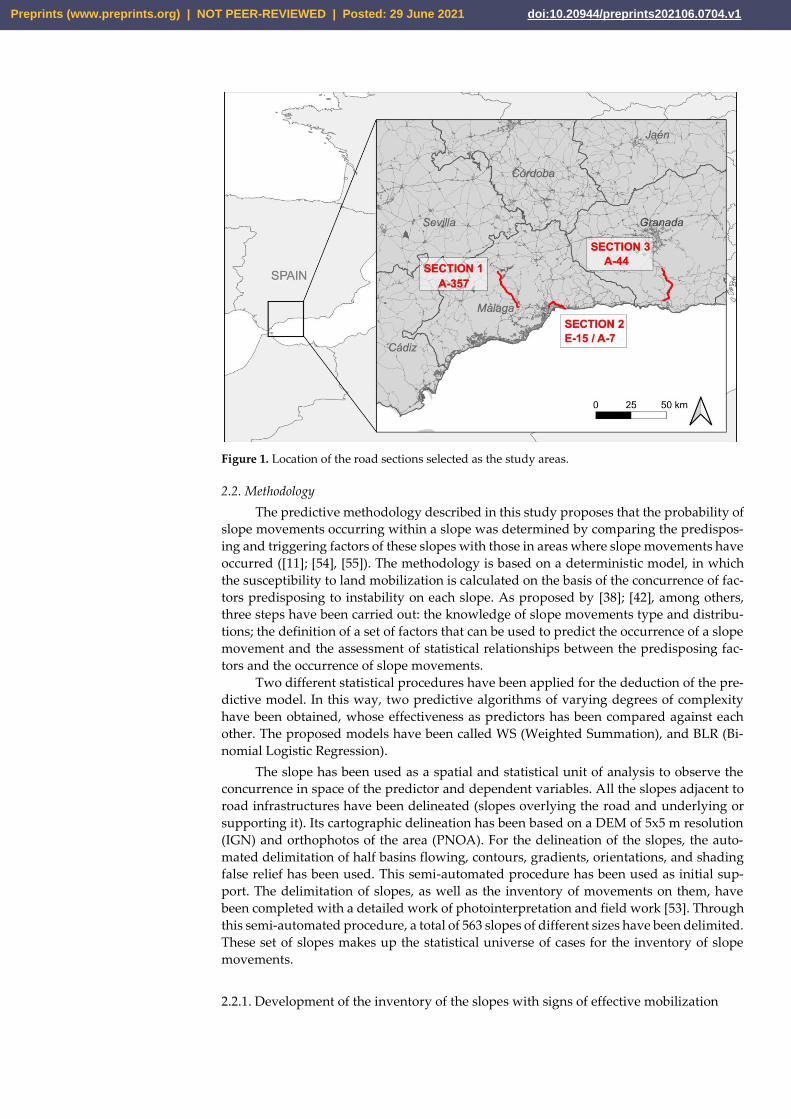
Figure 1. Location of the road sections selected as the study areas.
2.2. Methodology
The predictive methodology described in this study proposes that the probability of
slope movements occurring within a slope was determined by comparing the predispos-
ing and triggering factors of these slopes with those in areas where slope movements have
occurred ([11]; [54], [55]). The methodology is based on a deterministic model, in which
the susceptibility to land mobilization is calculated on the basis of the concurrence of fac-
tors predisposing to instability on each slope. As proposed by [38]; [42], among others,
three steps have been carried out: the knowledge of slope movements type and distribu-
tions; the definition of a set of factors that can be used to predict the occurrence of a slope
movement and the assessment of statistical relationships between the predisposing fac-
tors and the occurrence of slope movements.
Two different statistical procedures have been applied for the deduction of the pre-
dictive model. In this way, two predictive algorithms of varying degrees of complexity
have been obtained, whose effectiveness as predictors has been compared against each
other. The proposed models have been called WS (Weighted Summation), and BLR (Bi-
nomial Logistic Regression).
The slope has been used as a spatial and statistical unit of analysis to observe the
concurrence in space of the predictor and dependent variables. All the slopes adjacent to
road infrastructures have been delineated (slopes overlying the road and underlying or
supporting it). Its cartographic delineation has been based on a DEM of 5x5 m resolution
(IGN) and orthophotos of the area (PNOA). For the delineation of the slopes, the auto-
mated delimitation of half basins flowing, contours, gradients, orientations, and shading
false relief has been used. This semi-automated procedure has been used as initial sup-
port. The delimitation of slopes, as well as the inventory of movements on them, have
been completed with a detailed work of photointerpretation and field work [53]. Through
this semi-automated procedure, a total of 563 slopes of different sizes have been delimited.
These set of slopes makes up the statistical universe of cases for the inventory of slope
movements.
2.2.1. Development of the inventory of the slopes with signs of effective mobilization
Preprints (www.preprints.org) | NOT PEER-REVIEWED | Posted: 29 June 2021 doi:10.20944/preprints202106.0704.v1
The effective verification of mobilization signs on the slopes of the study area has
been used as a dependent variable, so these are the data that allow to validate the predic-
tive model. The detected slope movements have been identified and classified according
to the criteria of [56] and [57]. These are mostly stone falls with deposits on the shoulder,
and, in other cases, falling and avalanche of blocks.
For the elaboration of the map of this variable, an inventory with the location of the
slopes that show signs of mobilization have been carried out, based on the following
sources and procedures:
● Field work, with the aim of observing the morphologies that indicate land mobi-
lization (erosion or deposit) on the slopes.
● Compilation of information from the General Directorate of Roads (action reports)
about maintenance activities related to the falling of material from the slope to the
road or to the berm. Georeferencing press news related to traffic breaks due to slope
movements.
● Presence in the study area of artificial interventions for slope control (breakwaters,
retaining walls, berms), which were indicative of previous movements.
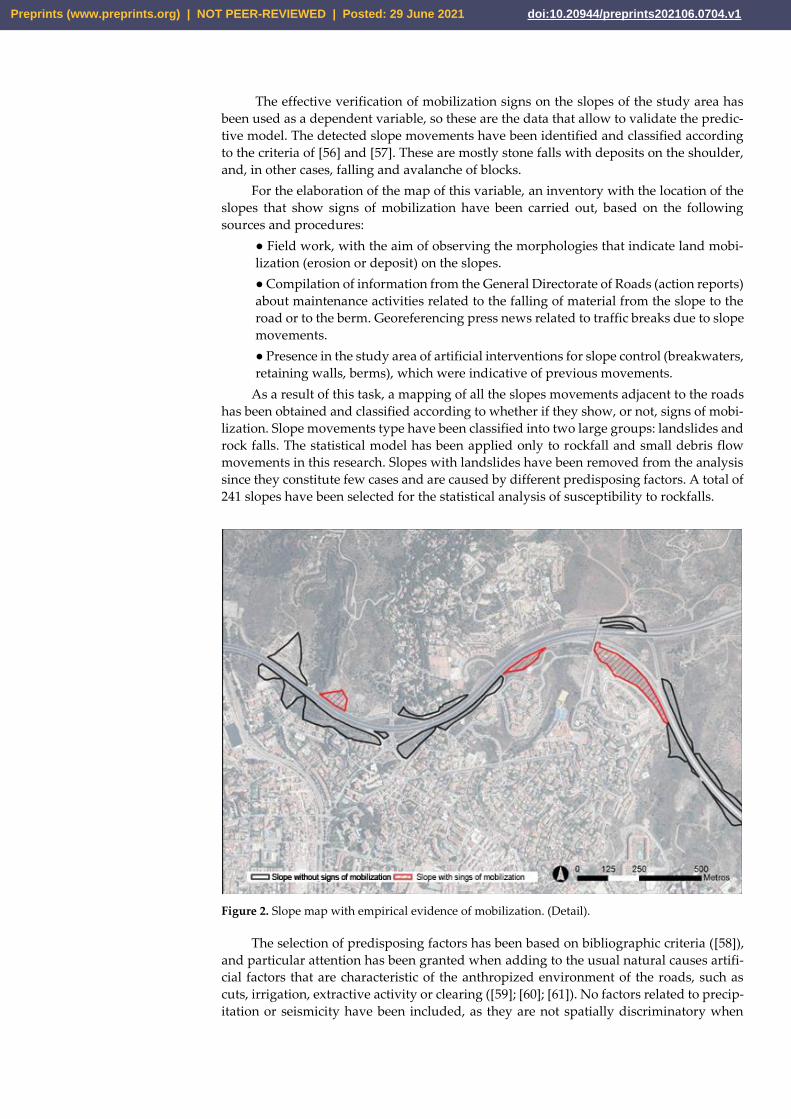
As a result of this task, a mapping of all the slopes movements adjacent to the roads
has been obtained and classified according to whether if they show, or not, signs of mobi-
lization. Slope movements type have been classified into two large groups: landslides and
rock falls. The statistical model has been applied only to rockfall and small debris flow
movements in this research. Slopes with landslides have been removed from the analysis
since they constitute few cases and are caused by different predisposing factors. A total of
241 slopes have been selected for the statistical analysis of susceptibility to rockfalls.
Figure 2. Slope map with empirical evidence of mobilization. (Detail).
The selection of predisposing factors has been based on bibliographic criteria ([58]),
and particular attention has been granted when adding to the usual natural causes artifi-
cial factors that are characteristic of the anthropized environment of the roads, such as
cuts, irrigation, extractive activity or clearing ([59]; [60]; [61]). No factors related to precip-
itation or seismicity have been included, as they are not spatially discriminatory when
Preprints (www.preprints.org) | NOT PEER-REVIEWED | Posted: 29 June 2021 doi:10.20944/preprints202106.0704.v1
working at large-scale. In this sense, [41], observed the difficulty to relate precipitation
with the concrete occurrence of the movement at a detailed scale.
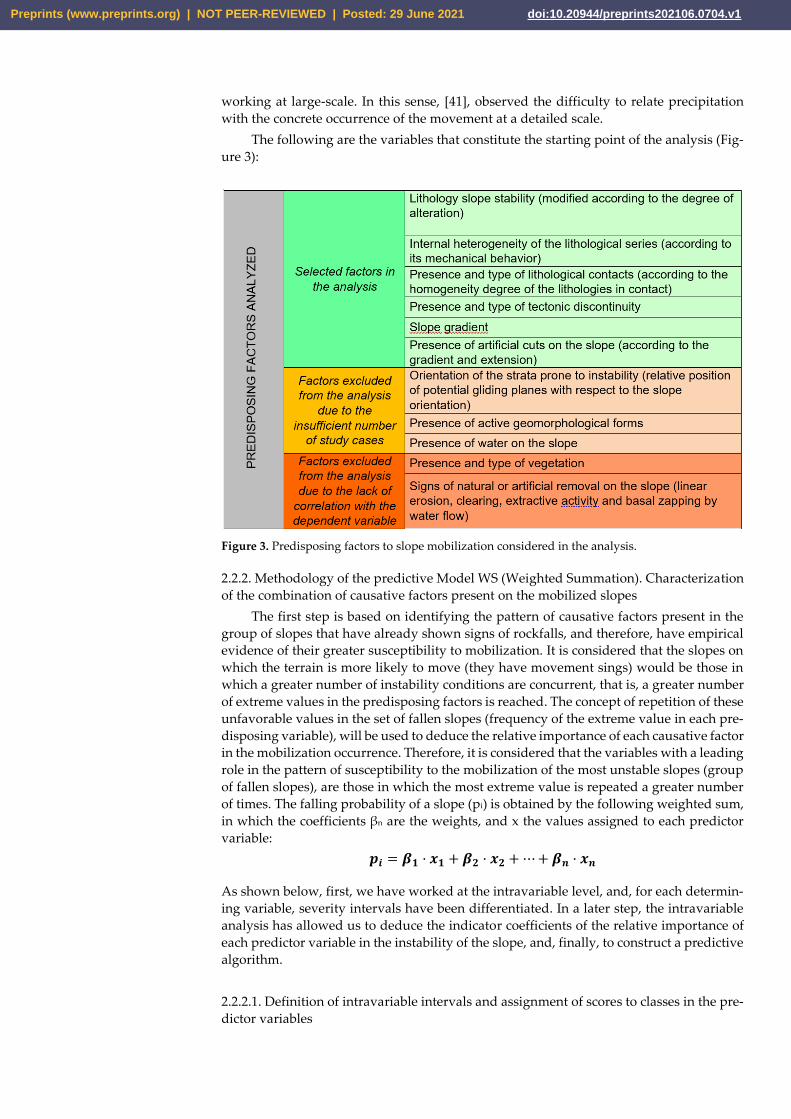
The following are the variables that constitute the starting point of the analysis (Fig-
ure 3):
Figure 3. Predisposing factors to slope mobilization considered in the analysis.
2.2.2. Methodology of the predictive Model WS (Weighted Summation). Characterization
of the combination of causative factors present on the mobilized slopes
The first step is based on identifying the pattern of causative factors present in the
group of slopes that have already shown signs of rockfalls, and therefore, have empirical
evidence of their greater susceptibility to mobilization. It is considered that the slopes on
which the terrain is more likely to move (they have movement sings) would be those in
which a greater number of instability conditions are concurrent, that is, a greater number
of extreme values in the predisposing factors is reached. The concept of repetition of these
unfavorable values in the set of fallen slopes (frequency of the extreme value in each pre-
disposing variable), will be used to deduce the relative importance of each causative factor
in the mobilization occurrence. Therefore, it is considered that the variables with a leading
role in the pattern of susceptibility to the mobilization of the most unstable slopes (group
of fallen slopes), are those in which the most extreme value is repeated a greater number
of times. The falling probability of a slope (pi) is obtained by the following weighted sum,
in which the coefficients βn are the weights, and x the values assigned to each predictor
variable:
𝒑𝒊 = 𝜷𝟏 · 𝒙𝟏 + 𝜷𝟐 · 𝒙𝟐 + ⋯ + 𝜷𝒏 · 𝒙𝒏
As shown below, first, we have worked at the intravariable level, and, for each determin-
ing variable, severity intervals have been differentiated. In a later step, the intravariable
analysis has allowed us to deduce the indicator coefficients of the relative importance of
each predictor variable in the instability of the slope, and, finally, to construct a predictive
algorithm.
2.2.2.1. Definition of intravariable intervals and assignment of scores to classes in the pre-
dictor variables
Preprints (www.preprints.org) | NOT PEER-REVIEWED | Posted: 29 June 2021 doi:10.20944/preprints202106.0704.v1

For assigning the intravariable intervals and their corresponding scores, the follow-
ing tasks have been carried out:
• The check-up of the intensity of the statistical relationship between each predis-
posing variable and the occurrence of slope mobilization.
• Considering the non-parametric character of most of the predictor variables, and
the binary of the dependent one (fallen / not fallen slope), frequency histograms of the
different degrees of the predictor variable path have been developed, as well as the per-
centages of falls that happen at each level in order to analyze the functions that relate each
independent and dependent variable. Histograms have allowed us to establish the thresh-
olds in which the cause-effect relationship presents more drastic variations, and to define
intervals in the predictor variable to which a proportional score that runs from 0 to 1 has
been assigned, being 1 the maximum susceptibility. The representative scores of zero and
maximum susceptibility to movement in the predictor variables have been established
from a common threshold, so that they are equivalent between some determining varia-
bles and others. The selected criteria have been:
o Negligible susceptibility: (Score <= 0.2). Interval that includes all the values of
the determining variables that coincide with cumulative percentages of slopes
falling below 10%.
o Maximum susceptibility: (Score >= 0.7) Interval that includes the values of the
predictor variable that coincide with a cumulative percentage of falls greater
than 80%).
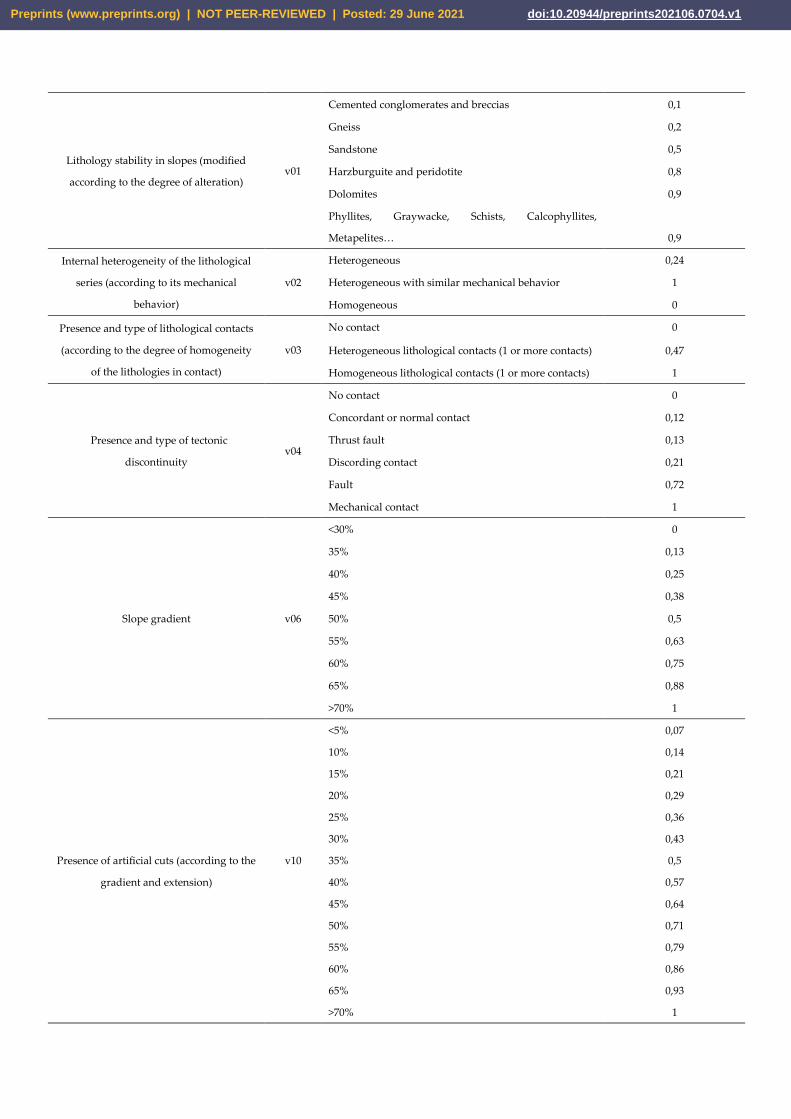
The mobilization susceptibility scores deducted and assigned to each class or interval
of the predisposing variables are summarized in the following table (Table 1):
Table 1. Mobilization susceptibility scores assigned to each class or interval of the predisposing
variables.
Predisposing variables Variable
code Classes and/or intervals
Susceptibility to
mobilization (from 0 to 1)
Preprints (www.preprints.org) | NOT PEER-REVIEWED | Posted: 29 June 2021 doi:10.20944/preprints202106.0704.v1
Lithology stability in slopes (modified
according to the degree of alteration) v01
Cemented conglomerates and breccias 0,1
Gneiss 0,2
Sandstone 0,5
Harzburguite and peridotite 0,8
Dolomites 0,9
Phyllites, Graywacke, Schists, Calcophyllites,
Metapelites… 0,9
Internal heterogeneity of the lithological
series (according to its mechanical
behavior)
v02
Heterogeneous 0,24
Heterogeneous with similar mechanical behavior 1
Homogeneous 0
Presence and type of lithological contacts
(according to the degree of homogeneity
of the lithologies in contact)
v03
No contact 0
Heterogeneous lithological contacts (1 or more contacts) 0,47
Homogeneous lithological contacts (1 or more contacts) 1
Presence and type of tectonic
discontinuity v04
No contact 0
Concordant or normal contact 0,12
Thrust fault 0,13
Discording contact 0,21
Fault 0,72
Mechanical contact 1
Slope gradient v06
<30% 0
35% 0,13
40% 0,25
45% 0,38
50% 0,5
55% 0,63
60% 0,75
65% 0,88
>70% 1
Presence of artificial cuts (according to the
gradient and extension)
v10
<5% 0,07
10% 0,14
15% 0,21
20% 0,29
25% 0,36
30% 0,43
35% 0,5
40% 0,57
45% 0,64
50% 0,71
55% 0,79
60% 0,86
65% 0,93
>70% 1
Preprints (www.preprints.org) | NOT PEER-REVIEWED | Posted: 29 June 2021 doi:10.20944/preprints202106.0704.v1
2.2.2.2. Definition of intravariable intervals and assignment of scores to classes in the pre-
dictor variables
It has been considered that the process of land falling is the result of a compensated
association of the set of causative variables, so that the predictive model should be based
on compensatory techniques ([62]). The procedure for assigning weighting coefficients
has been conditioned by the non-parametric nature of the data.
For the estimation of the relative weight that each predictive variable has in the mo-
bilization generation, the statistical analysis has focused on the group of slopes in which
previous rockfalls have already been observed. The reasoning for deducing the weighting
coefficients has been based on the calculation of the number of times in which the worst
susceptibility value is repeated in each of the causative variables. It has been considered
that the variables that most frequently repeat their worst susceptibility value are those
that have the greatest incidence in the generation of the fall. At the same time, it has been
verified that the worst susceptibility value appears poorly represented in each variable
among the group of not fallen slopes (less than 20%), which consolidates the research hy-
pothesis.
From this reasoning, the following calculations have been made:
• The count of the number of times in which the range of greatest susceptibil-
ity of each predictive variable (scores greater than 0.7) is present in the group
of fallen slopes.
•The sum of all the modes obtained for each variable, and standardization of
their values to 1 (value of the total sum). This value becomes the weighting
coefficient of the variable.
The formula used to obtain the weights by standardized variables is, in short, the
following:
𝑽𝒂𝒓𝒊𝒂𝒃𝒍𝒆 𝒘𝒆𝒊𝒈𝒉𝒕 = 𝑭𝒓𝒆𝒒𝒖𝒆𝒏𝒄𝒚 𝒗𝒂𝒍𝒖𝒆 ≥ 𝟎. 𝟕 𝒊𝒏 𝒕𝒉𝒆 𝒗𝒂𝒓𝒊𝒂𝒃𝒍𝒆 (𝒖𝒏𝒊𝒗𝒆𝒓𝒔𝒆 𝑭𝒂𝒍𝒍𝒔)
𝑺𝒖𝒎𝒎𝒂𝒓𝒚 𝒗𝒂𝒍𝒖𝒆𝒔 ≥ 𝟎. 𝟕 𝒕𝒐𝒕𝒂𝒍 𝒐𝒇 𝒗𝒂𝒓𝒊𝒂𝒃𝒍𝒆𝒔 (𝒖𝒏𝒊𝒗𝒆𝒓𝒔𝒆 𝑭𝒂𝒍𝒍𝒔)
Once the predictor algorithm was calculated, it has been applied to all the slopes of
the study area and the data of susceptibility to mobilization have been obtained. The re-
sulting values have been classified in severity intervals for their cartographic representa-
tion. The intervals have been individualized based on the observation of the histogram of
frequencies.
2.2.2.3. Evaluation of the effectiveness of the WS model
Once the predictive model was obtained through the WS method, the relationship
between the measured values and those predicted by the algorithm has been evaluated
through different analysis strategies. In addition to assessing the level of coincidence
through percentages of success in the different severity intervals, a confusion matrix has
been developed, which compares the measured and the predicted values, in order to as-
sess the fitting of the prediction. The sensitivity value represents the ratio of positive val-
ues (value 1, fallen slopes) correctly predicted, whereas the specificity value refers to the
negative values (value 0, not fallen slopes). In both cases, the model is better fitted when
high values in these concepts are obtained. The optimal threshold of probability of falling
or not falling has also been calculated, based on a graph that shows the evolution of sen-
sitivity and specificity, and its point of intersection (0.6 in this case).
A ROC (Receiver Operating Characteristic) curve has also been developed, which
represents the percentage of correct positives that a logistic model predicts when the prob-
ability threshold is progressively lowered from 1 to 0. A good model should indicate more
measured 1 as positive and less measured 0 as positive as the threshold drops. Therefore,
in a suitable model the curve should rise with a high gradient, indicating that the rate of
Preprints (www.preprints.org) | NOT PEER-REVIEWED | Posted: 29 June 2021 doi:10.20944/preprints202106.0704.v1

correct positives (TPR, True Positive Ratio, Y axis) increases faster than the false positive
ones (FPR. False Positive Ratio, X axis). For this reason, in a ROC curve, the larger the area
under the curve (AUC), the better the predictive capacity of the model. The data obtained
in the calibration exercise are shown in the results section.
2.2.3. Methodology for the development of the BLR predictive model (Binomial Logistic
Regression)
2.2.3.1. Deduction of the predictive equation and evaluation of the effectiveness of the
model
The second strategy utilized to make the map of susceptibility to rockfalls is based
on a statistical model of logistic regression. The binomial logistic regression model is used
when it is intended to predict the probability of occurrence of a particular event. It is a
multivariate statistical method that allows to predict the presence or absence of a given
event according to the values of a set of starting indicators. The binomial logistic regres-
sion allows us to deduce an equation that establishes the underlying mathematical rela-
tionship between a dependent dichotomous variable, and a set of independent predictor
variables ([59]). For the analysis, variables of different nature and statistical expression
(continuous or categorical, and with or without normal distribution) can be included.
In our case of study, the variable dependent on logistic regression acquires value 1
on those slopes collected in the inventory that have signs of mobilization, that is, that have
experienced movements (falls).
The independent variables considered in the analysis (Model BLR.1) are shown be-
low (Table 2):
Table 2. Susceptibility factors included in the BLR.1 model.
Independent variables
(model BLR.1)
v01 - Lithology stability on slopes (modified according to the degree of
alteration)
v02 - Internal heterogeneity of the lithological series (according to its
mechanical behavior)
v03 - Presence and type of lithological contacts (according to the degree of
homogeneity of the lithologies in contact)
v04 - Presence and type of tectonic discontinuity
v06 - Slope gradient
v10 - Presence of artificial cuts (according to the gradient and extension)
From these data, in a second phase, it has been decided to generate a new regression
model by eliminating from the procedure the variables with less statistical significance
(those with p> 0.05) (BLR.2 model), in order to observe whether the restriction clarifies the
statistical procedure and improves the results. In this second iteration of the entire proce-
dure, the independent variables used have been the following:
Table 3. Susceptibility factors included in the BLR.2 model.
Independent variables
(BLR.2 model)
v01 - Lithology stability on slopes (modified according to the degree of
alteration)
v03 - Presence and type of lithological contacts (according to degree of
homogeneity of the lithologies in contact)
v06 - Slope gradient
v10 - Presence of artificial cuts (according to the gradient and extension)
Preprints (www.preprints.org) | NOT PEER-REVIEWED | Posted: 29 June 2021 doi:10.20944/preprints202106.0704.v1

The regression models have been generated using the “caret” package of R, adjusting
them to binomial logistic regressions (method=”glm”,family=binomial(link="logit"). The
cross-validation method k-fold has been used for this (with 10 groups and iterations
(k=10), choosing the model that maximizes the area under the ROC curve. The optimal
threshold of probability cuts has been selected from cross-charts of sensitivity and speci-
ficity. From this data, the correctness of the estimation through a confusion matrix, the
elaboration of the ROC curve, and the calculation of the area under the curve (AUC),
which is the indicator of the goodness of the model as a predictor, have been verified.
For the two models generated (BLR.1 model and BLR.2 model) the β coefficients for
each variable, and their statistical significance have been calculated. These indicators have
allowed us to discriminate the variables that have the most influence in the production of
the mobilization, and to decide which ones to eliminate from the analysis in the second
application of the model.
Once the coefficients have been obtained and their statistical significance has been
analyzed, the probability of falling that they predict for each slope is then calculated. This
information is added to the input data table, which makes its representation and analysis
possible through GIS. The probability of falling is finally used to make maps of suscepti-
bility to mobilization in a predictive way.
3. Results and discussion
The first result to comment on is the advantage that the topographic delimitation of
slopes adjacent to the road offers for the analysis of causative factors. Using this proce-
dure, the statistical unit is scaled to the slope, the basic geomorphological unit in which
gravitational processes occur. In this way, the cause-effect relationships are directly re-
lated in each spatial unit. When larger spatial units are used, such as the basin ([64]), there
are problems of generalization of the value of the causative factors that sometimes hinder
the statistical relationship between cause and effect. The use of the slope as the basic unit
of analysis also avoids other extrapolation problems associated with MAUP ([65]), which
have been addressed by authors such as [66]; [67], [68] using different strategies.
3.1. Results of the WS method: method based on the frequency of unfavorable conditions
3.1.1. Weighting coefficients and predictive algorithm obtained
The weights obtained for each variable, once standardized, are the following (Table
4):
Table 4. Weighting coefficients obtained for each predictor variable (WS Method)
Rockfall (variables)
Litho
(v01)
Slope
(v06) IntHet (v02)
ArtSlo
(v10)
LithoCon
(v03)
TectDisc
(v04) TOTAL
Count (>=0,7) 48 40 30 25 20 16 179
Percentage with
respect to 49 FALLS 0,98 0,82 0,61 0,51 0,41 0,33 3,66
Weighing 0,27 0,22 0,17 0,14 0,11 0,09 1,00
Preprints (www.preprints.org) | NOT PEER-REVIEWED | Posted: 29 June 2021 doi:10.20944/preprints202106.0704.v1
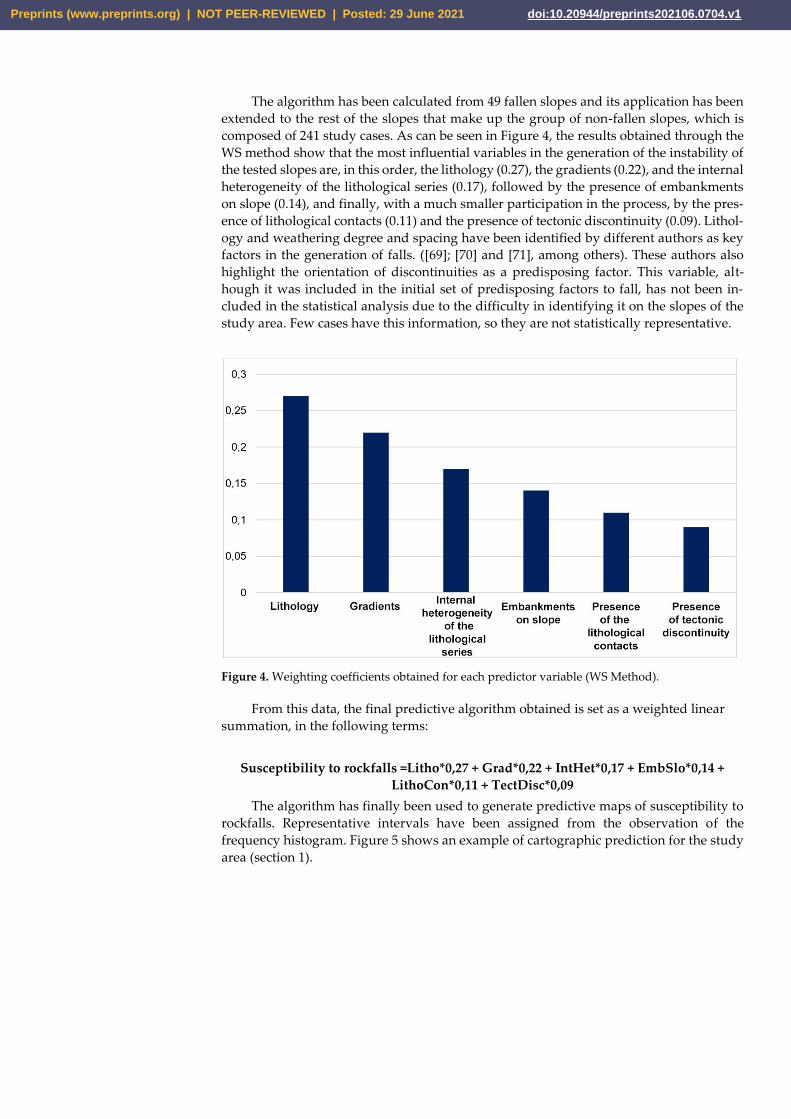
The algorithm has been calculated from 49 fallen slopes and its application has been
extended to the rest of the slopes that make up the group of non-fallen slopes, which is
composed of 241 study cases. As can be seen in Figure 4, the results obtained through the
WS method show that the most influential variables in the generation of the instability of
the tested slopes are, in this order, the lithology (0.27), the gradients (0.22), and the internal
heterogeneity of the lithological series (0.17), followed by the presence of embankments
on slope (0.14), and finally, with a much smaller participation in the process, by the pres-
ence of lithological contacts (0.11) and the presence of tectonic discontinuity (0.09). Lithol-
ogy and weathering degree and spacing have been identified by different authors as key
factors in the generation of falls. ([69]; [70] and [71], among others). These authors also
highlight the orientation of discontinuities as a predisposing factor. This variable, alt-
hough it was included in the initial set of predisposing factors to fall, has not been in-
cluded in the statistical analysis due to the difficulty in identifying it on the slopes of the
study area. Few cases have this information, so they are not statistically representative.
Figure 4. Weighting coefficients obtained for each predictor variable (WS Method).
From this data, the final predictive algorithm obtained is set as a weighted linear
summation, in the following terms:
Susceptibility to rockfalls =Litho*0,27 + Grad*0,22 + IntHet*0,17 + EmbSlo*0,14 +
LithoCon*0,11 + TectDisc*0,09
The algorithm has finally been used to generate predictive maps of susceptibility to
rockfalls. Representative intervals have been assigned from the observation of the
frequency histogram. Figure 5 shows an example of cartographic prediction for the study
area (section 1).
Preprints (www.preprints.org) | NOT PEER-REVIEWED | Posted: 29 June 2021 doi:10.20944/preprints202106.0704.v1
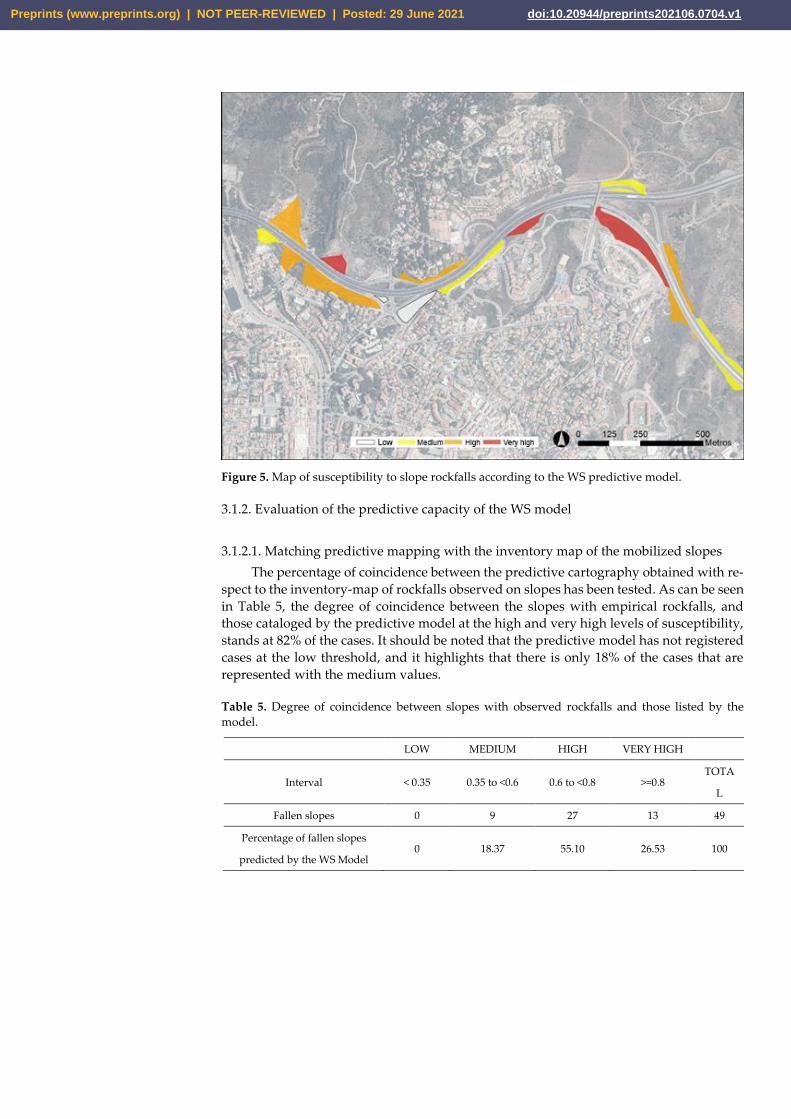
Figure 5. Map of susceptibility to slope rockfalls according to the WS predictive model.
3.1.2. Evaluation of the predictive capacity of the WS model
3.1.2.1. Matching predictive mapping with the inventory map of the mobilized slopes
The percentage of coincidence between the predictive cartography obtained with re-
spect to the inventory-map of rockfalls observed on slopes has been tested. As can be seen
in Table 5, the degree of coincidence between the slopes with empirical rockfalls, and
those cataloged by the predictive model at the high and very high levels of susceptibility,
stands at 82% of the cases. It should be noted that the predictive model has not registered
cases at the low threshold, and it highlights that there is only 18% of the cases that are
represented with the medium values.
Table 5. Degree of coincidence between slopes with observed rockfalls and those listed by the
model.
LOW MEDIUM HIGH VERY HIGH
Interval < 0.35 0.35 to <0.6 0.6 to <0.8 >=0.8 TOTA
L
Fallen slopes 0 9 27 13 49
Percentage of fallen slopes
predicted by the WS Model 0 18.37 55.10 26.53 100
Preprints (www.preprints.org) | NOT PEER-REVIEWED | Posted: 29 June 2021 doi:10.20944/preprints202106.0704.v1
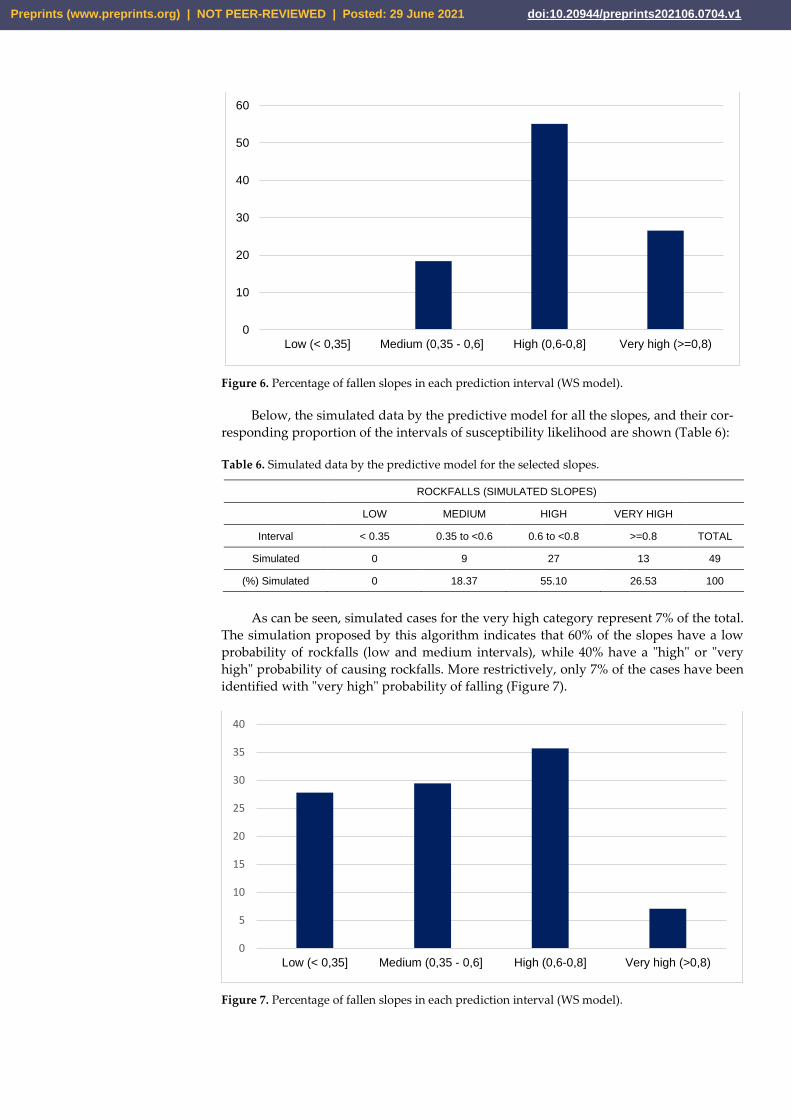
Figure 6. Percentage of fallen slopes in each prediction interval (WS model).
Below, the simulated data by the predictive model for all the slopes, and their cor-
responding proportion of the intervals of susceptibility likelihood are shown (Table 6):
Table 6. Simulated data by the predictive model for the selected slopes.
ROCKFALLS (SIMULATED SLOPES)
LOW MEDIUM HIGH VERY HIGH
Interval < 0.35 0.35 to <0.6 0.6 to <0.8 >=0.8 TOTAL
Simulated 0 9 27 13 49
(%) Simulated 0 18.37 55.10 26.53 100
As can be seen, simulated cases for the very high category represent 7% of the total.
The simulation proposed by this algorithm indicates that 60% of the slopes have a low
probability of rockfalls (low and medium intervals), while 40% have a "high" or "very
high" probability of causing rockfalls. More restrictively, only 7% of the cases have been
identified with "very high" probability of falling (Figure 7).
Figure 7. Percentage of fallen slopes in each prediction interval (WS model).
0
10
20
30
40
50
60
Low (< 0,35] Medium (0,35 - 0,6] High (0,6-0,8] Very high (>=0,8)
0
5
10
15
20
25
30
35
40
Low (< 0,35] Medium (0,35 - 0,6] High (0,6-0,8] Very high (>0,8)
Preprints (www.preprints.org) | NOT PEER-REVIEWED | Posted: 29 June 2021 doi:10.20944/preprints202106.0704.v1
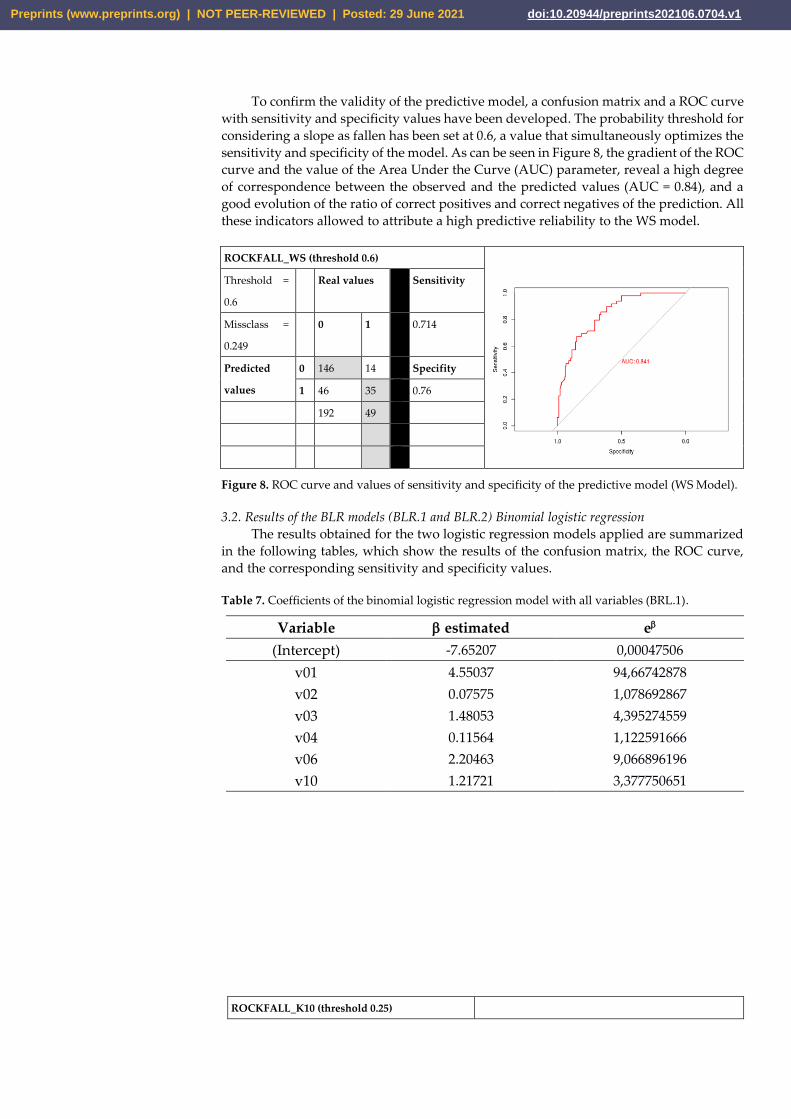
To confirm the validity of the predictive model, a confusion matrix and a ROC curve
with sensitivity and specificity values have been developed. The probability threshold for
considering a slope as fallen has been set at 0.6, a value that simultaneously optimizes the
sensitivity and specificity of the model. As can be seen in Figure 8, the gradient of the ROC
curve and the value of the Area Under the Curve (AUC) parameter, reveal a high degree
of correspondence between the observed and the predicted values (AUC = 0.84), and a
good evolution of the ratio of correct positives and correct negatives of the prediction. All
these indicators allowed to attribute a high predictive reliability to the WS model.
ROCKFALL_WS (threshold 0.6)
Threshold =
0.6
Real values Sensitivity
Missclass =
0.249
0 1 0.714
Predicted
values
0 146 14 Specifity
1 46 35 0.76
192 49
Figure 8. ROC curve and values of sensitivity and specificity of the predictive model (WS Model).
3.2. Results of the BLR models (BLR.1 and BLR.2) Binomial logistic regression
The results obtained for the two logistic regression models applied are summarized
in the following tables, which show the results of the confusion matrix, the ROC curve,
and the corresponding sensitivity and specificity values.
Table 7. Coefficients of the binomial logistic regression model with all variables (BRL.1).
Variable estimated e
(Intercept) -7.65207 0,00047506
v01 4.55037 94,66742878
v02 0.07575 1,078692867
v03 1.48053 4,395274559
v04 0.11564 1,122591666
v06 2.20463 9,066896196
v10 1.21721 3,377750651
ROCKFALL_K10 (threshold 0.25)
Preprints (www.preprints.org) | NOT PEER-REVIEWED | Posted: 29 June 2021 doi:10.20944/preprints202106.0704.v1
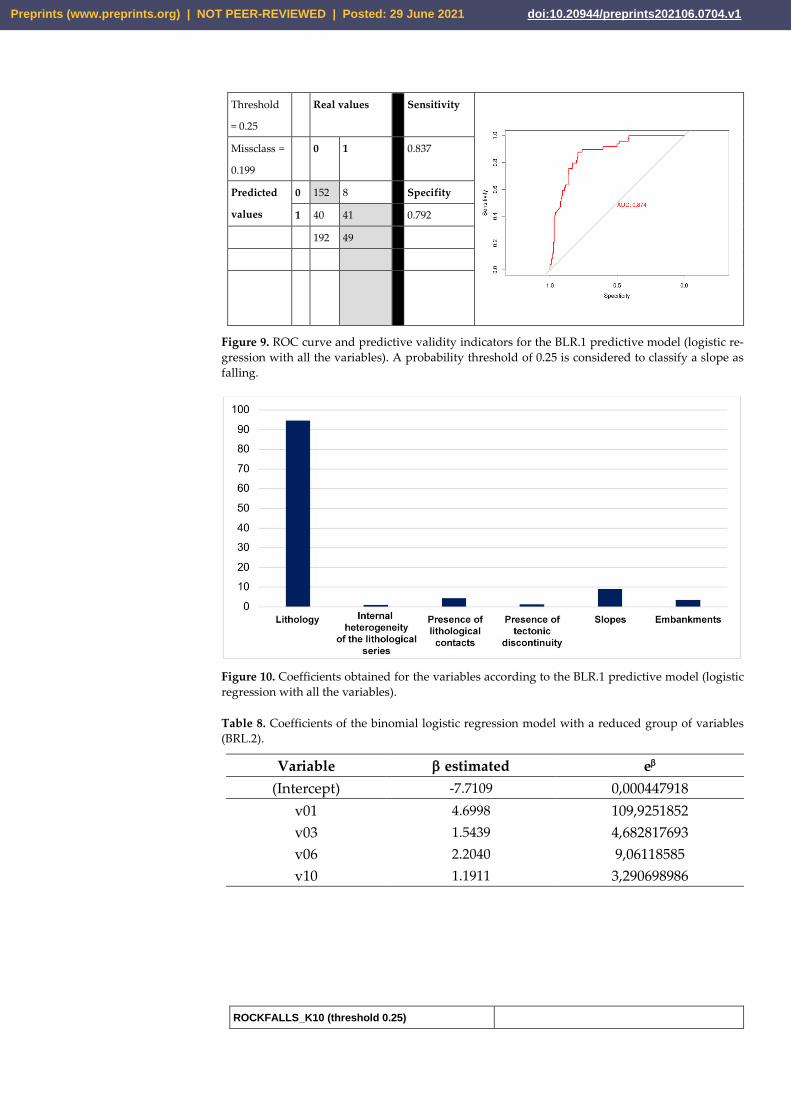
Threshold
= 0.25
Real values Sensitivity
Missclass =
0.199
0 1 0.837
Predicted
values
0 152 8 Specifity
1 40 41 0.792
192 49
Figure 9. ROC curve and predictive validity indicators for the BLR.1 predictive model (logistic re-
gression with all the variables). A probability threshold of 0.25 is considered to classify a slope as
falling.
Figure 10. Coefficients obtained for the variables according to the BLR.1 predictive model (logistic
regression with all the variables).
Table 8. Coefficients of the binomial logistic regression model with a reduced group of variables
(BRL.2).
Variable estimated e
(Intercept) -7.7109 0,000447918
v01 4.6998 109,9251852
v03 1.5439 4,682817693
v06 2.2040 9,06118585
v10 1.1911 3,290698986
ROCKFALLS_K10 (threshold 0.25)
Preprints (www.preprints.org) | NOT PEER-REVIEWED | Posted: 29 June 2021 doi:10.20944/preprints202106.0704.v1
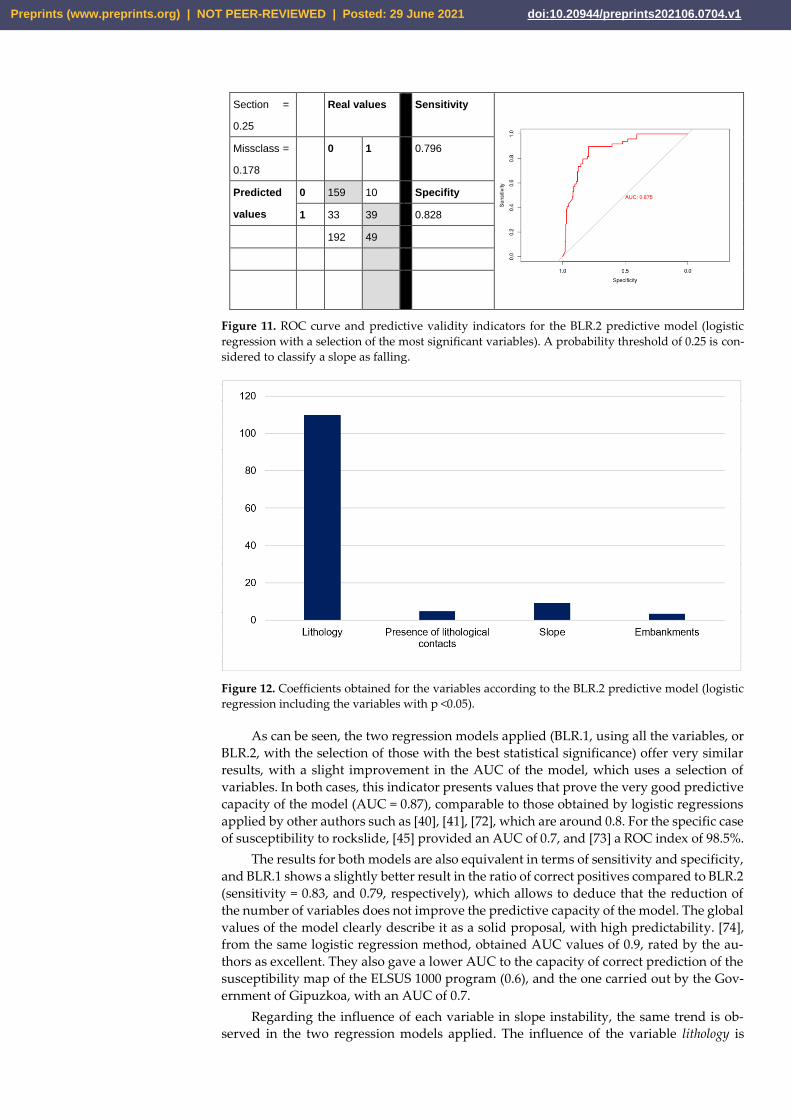
Section =
0.25
Real values Sensitivity
Missclass =
0.178
0 1 0.796
Predicted
values
0 159 10 Specifity
1 33 39 0.828
192 49
Figure 11. ROC curve and predictive validity indicators for the BLR.2 predictive model (logistic
regression with a selection of the most significant variables). A probability threshold of 0.25 is con-
sidered to classify a slope as falling.
Figure 12. Coefficients obtained for the variables according to the BLR.2 predictive model (logistic
regression including the variables with p <0.05).
As can be seen, the two regression models applied (BLR.1, using all the variables, or
BLR.2, with the selection of those with the best statistical significance) offer very similar
results, with a slight improvement in the AUC of the model, which uses a selection of
variables. In both cases, this indicator presents values that prove the very good predictive
capacity of the model (AUC = 0.87), comparable to those obtained by logistic regressions
applied by other authors such as [40], [41], [72], which are around 0.8. For the specific case
of susceptibility to rockslide, [45] provided an AUC of 0.7, and [73] a ROC index of 98.5%.
The results for both models are also equivalent in terms of sensitivity and specificity,
and BLR.1 shows a slightly better result in the ratio of correct positives compared to BLR.2
(sensitivity = 0.83, and 0.79, respectively), which allows to deduce that the reduction of
the number of variables does not improve the predictive capacity of the model. The global
values of the model clearly describe it as a solid proposal, with high predictability. [74],
from the same logistic regression method, obtained AUC values of 0.9, rated by the au-
thors as excellent. They also gave a lower AUC to the capacity of correct prediction of the
susceptibility map of the ELSUS 1000 program (0.6), and the one carried out by the Gov-
ernment of Gipuzkoa, with an AUC of 0.7.
Regarding the influence of each variable in slope instability, the same trend is ob-
served in the two regression models applied. The influence of the variable lithology is
Preprints (www.preprints.org) | NOT PEER-REVIEWED | Posted: 29 June 2021 doi:10.20944/preprints202106.0704.v1
much greater than the others: the normalized coefficient value practically multiplies by 10
the value of the next ranking variable. The second variable is the percentage of gradient,
with a certain weight in determining the probability of falling of each slope. Finally, the
variables presence of lithological discontinuity and presence of artificial cuts have little signifi-
cance. The remaining variables have coefficients with low weight or low statistical signif-
icance. It is worthy to note the very high impact of the lithology in the instability process
that has been observed in this study, since even it is very logical at the theoretical level, it
cannot always be verified in statistical analyses, due to the categorical nature of the vari-
able, which hinders the association with other causative variables. Usually, this variable
is introduced in the analysis by assigning a score based on a susceptibility ranking, which
generates subjectivity errors. In other cases, as suggested by [44], the susceptibility value
of the lithology is obtained from the density of movement sites observed in each type of
material, which, in our opinion, forces in a directed way the coincidence with the depend-
ent variable, also constructed through the inventory of movements.
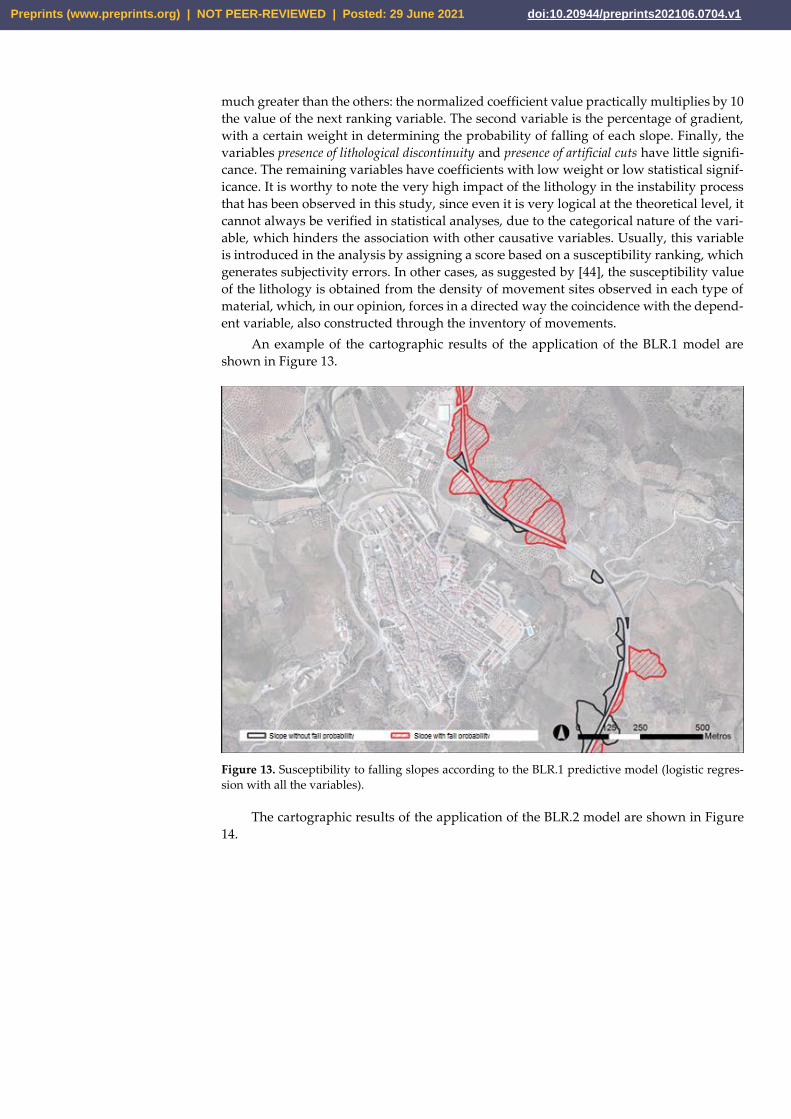
An example of the cartographic results of the application of the BLR.1 model are
shown in Figure 13.
Figure 13. Susceptibility to falling slopes according to the BLR.1 predictive model (logistic regres-
sion with all the variables).
The cartographic results of the application of the BLR.2 model are shown in Figure
14.
Preprints (www.preprints.org) | NOT PEER-REVIEWED | Posted: 29 June 2021 doi:10.20944/preprints202106.0704.v1
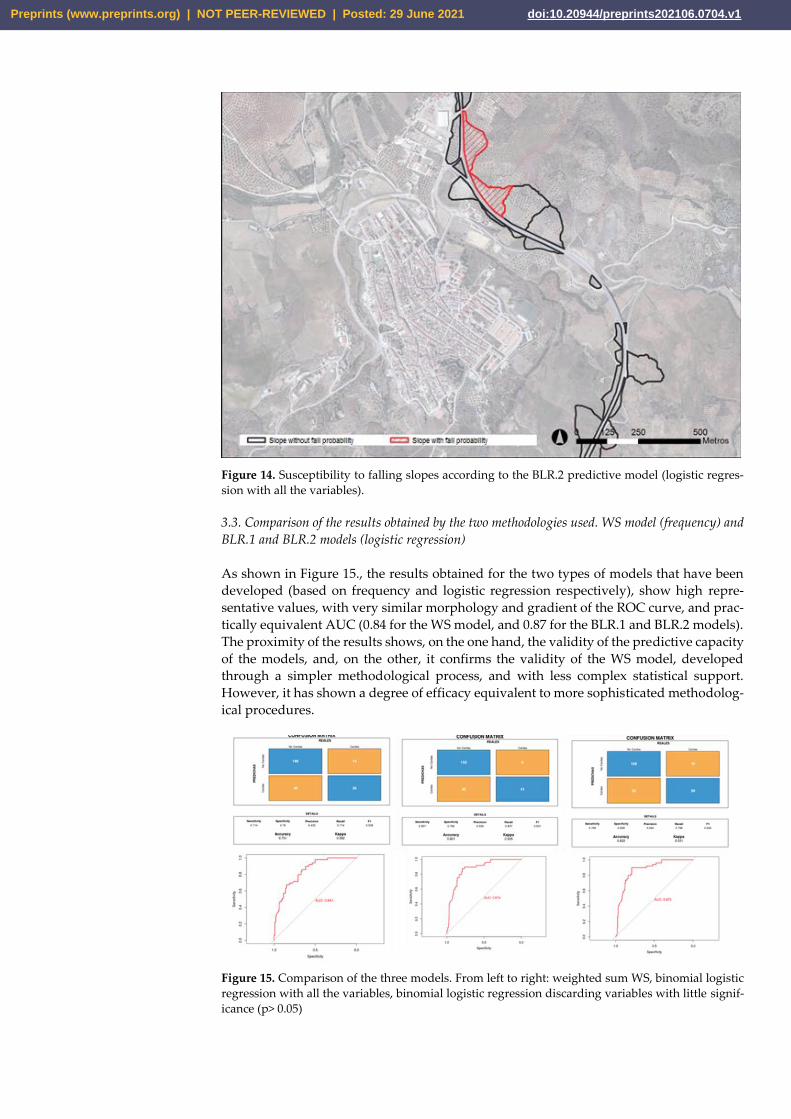
Figure 14. Susceptibility to falling slopes according to the BLR.2 predictive model (logistic regres-
sion with all the variables).
3.3. Comparison of the results obtained by the two methodologies used. WS model (frequency) and
BLR.1 and BLR.2 models (logistic regression)
As shown in Figure 15., the results obtained for the two types of models that have been
developed (based on frequency and logistic regression respectively), show high repre-
sentative values, with very similar morphology and gradient of the ROC curve, and prac-
tically equivalent AUC (0.84 for the WS model, and 0.87 for the BLR.1 and BLR.2 models).
The proximity of the results shows, on the one hand, the validity of the predictive capacity
of the models, and, on the other, it confirms the validity of the WS model, developed
through a simpler methodological process, and with less complex statistical support.
However, it has shown a degree of efficacy equivalent to more sophisticated methodolog-
ical procedures.
Figure 15. Comparison of the three models. From left to right: weighted sum WS, binomial logistic
regression with all the variables, binomial logistic regression discarding variables with little signif-
icance (p> 0.05)
Preprints (www.preprints.org) | NOT PEER-REVIEWED | Posted: 29 June 2021 doi:10.20944/preprints202106.0704.v1
Regarding the identification of the most influential predictor variables in the creation
of slope instability, both models coincide in two essential aspects: to highlight the im-
portance of the lithology in the genesis of instability, followed by the gradient and, sec-
ondly, they also show the importance of an unnatural variable, such as the presence of ar-
tificial embankment, in the genesis of rockfall on slopes adjacent to roads.
4. Conclusions
The surrounding area of road infrastructures presents a degree of alteration by an-
thropic processes that strongly determines the dynamics of gravitational processes. To
analyze the susceptibility to land mobilization on the slopes adjacent to road infrastruc-
tures requires a treatment of causative factors adapted to the specific characteristics of the
environment. The approach used in this work has sought to collect these particularities
and brings together ad hoc natural and anthropic factors as constrains of mobilization.
The disparate nature of the conditioning and activating factors of the mobilization,
and its different expression in statistical terms, makes it difficult to use parametric statis-
tics and linear correlation techniques as an instrument for the deduction of interchangea-
ble relationships. To address this problem, complementary prediction strategies have
been successfully addressed at work. First, as an alternative analysis strategy, a procedure
based on the spatial coincidence of the most negative values of each predisposing factor
with the effective occurrence of slope mobilization (WS predictive model) has been used.
This procedure has allowed us to establish the relative importance of each determining
factor in the final generation of the susceptibility to mobilization through a simple but
effective process. After the application of the predictive model, the results obtained certify
a high degree of coincidence between the tendency of susceptibility foreseen by the model,
and the effective presence of empirical signs of mobilization on the slopes. The gradient
of the ROC curve and the AUC parameter have proven the effectiveness of this model for
the creation of cartographies of susceptibility to rockfalls. Secondly, a binomial logistic
regression has been applied to obtain the BLR.1 and BLR.2 models, whose confidence in-
dicators also showed a very good capacity of the equation to estimate the probability of
landslides. The results of both models show the preponderant importance of lithology in
the production of rockfalls, followed, at a considerable distance, by the gradient variable.
The application of logistic regression has enabled the analysis with variables of different
nature and statistical expression (continuous or categorical, and with or without normal
distribution), so it is ideal for the case of study, in which they are linked as variable caus-
ative factors of low variability, or even dichotomous character, along with other discrete
and wide variability. It must be added that the binomial logistic regression with selected
variables (BLR.2), gets good predictions using only 4 variables, which allows to simplify
the study processes in other cases. v02 and v04 are discarded due to low significance; this
means that there is no significant causality regarding the increased probability of falls.
It is interesting to observe how in the two predictive models obtained, the im-
portance in the genesis of the rockfalls of an unnatural variable, such as the presence of
artificial embankment, is indicated. This fact points out the convenience of studying mass
movements that occur in natural environments and have their own functional dynamics,
as distinct processes with respect to those that take place in anthropized environments. In
this latter case, it is necessary to analyze in a specific way factors that determine non-
natural mobilization, usually not considered in the predictive cartographies, but which,
however, can take a leading role in the instability process. The results also speak about
the relative effectiveness of the construction engineering models in the designing of road
infrastructures, since it is confirmed that there are abundant cases of slopes with rockfalls
associated with their construction. It is necessary, therefore, to apply a less sectoral ap-
proach to the prediction procedures, which includes a vision of road infrastructures as a
mixed nature space, in which natural and artificial processes interact in the genesis of in-
stability. Author Contributions: Perles: designed the methodology and the conceptual approach; analyzed
the data, writing the manuscript and revised the manuscript. Pardo: designed and applied the
Preprints (www.preprints.org) | NOT PEER-REVIEWED | Posted: 29 June 2021 doi:10.20944/preprints202106.0704.v1
statistical methodology, and interpretation of results and discussion; Sortino: was involved in data
processing, GIS application, interpretation of results and discussion; Reyes: GIS application and de-
sign maps, formatted and edited the text and graphics; Puglisi. compiled previous and current re-
search, collaborated to design the methods, and approved the final version of the manuscript.
Acknowledgments: This study is framed within the Research Project: “Development of an applied
methodology for the detection of conflict points in the road infrastructures of Andalusian peri-urban
areas in the face of episodes of activation of synergistic risks associated with torrential rains”. Fi-
nancing: Department of Infrastructure and Housing of the Junta de Andalucía, and Agency for Pub-
lic Works (J.A). (Code G-GI 3000 / IDI).
References
1. Luce, C.H. & Wemple, B.C. Introduction to special issue on hydrologic and geomorphic effects of forest roads. Earth Surface
Processes and Landforms 2001, 26, 111-113.
2. Perles Roselló, M.J. & Cantarero Prados, F. Problemas y retos en el análisis de los riesgos múltiples del territorio: propuestas
metodológicas para la elaboración de cartografías multi-peligros. Boletín de la Asociación de Geógrafos Españoles 2010, 52, 245-271.
3. Corominas, J.; Ibarbia, I.; Luzuriaga, S.; Navarro, J.A.; Jujo, I.; Jurnet, C.; Hurlimann, M. Rockfall and debris flow hazard assess-
ment of the coastal road of Gipuzkoa (Northern Spain). In Landslides Science and Practice, Margottini, C., Canuti, P., Sassa, K.
(eds.), Risk Assessment, Management and Mitigation. Ed. Springer. Germany. 2013; vol. 6.
4. Turconi, L.; Faccini, F.; Marchese, A.; Paliaga, G.; Casazza, M.; Vojinovic, Z.; Luino, F. Implementation of Nature-Based Solu-
tions for Hydro-Meteorological Risk Reduction in Small Mediterranean Catchments: The Case of Portofino Natural Regional
Park, Italy. Sustainability 2020, 12, 1240.
5. Giordan, D.; Wrzesniak, A.; Allasia, P. The Importance of a Dedicated Monitoring Solution and Communication Strategy for an
Effective Management of Complex Active Landslides in Urbanized Areas. Sustainability 2019, 11, 946.
6. Bezerra, L.; Neto, O.F.; Santos, O., Jr.; Mickovski, S. Landslide Risk Mapping in an Urban Area of the City of Natal, Brazil.
Sustainability 2020, 12, 9601.
7. Perles Roselló, M.J. & Mérida Rodríguez M.F. Patrón territorial y conformación del riesgo en espacios periurbanos. El caso de
la periferia este de la ciudad de Málaga. Scripta Nova 2010, XIV.
8. Perles Roselló, M.J.; Mérida Rodríguez, M.F.; Blanco Sepúlveda, R. Urbanización infraestructuras y riesgos naturales en la pe-
riferia montañosa de la ciudad de Málaga. El caso del Monte San Antón. Baética 1998, 20, 129-158.
9. Youssef, A.M.; Pradhan, B.; Hassan, A.M. Flash flood risk estimation along the St. Katherine Road, southern Sinai, Egypt using
GIS based morphometry and satellite imagery. Environmental Earth Sciences 2011, 62(3), 611-623.
10. Michoud, C.; Derron, M.-H.; Horton, P.; Jaboyedoff, M.; Baillifard, F.-J.; Loye, A.; Nicolet, P.; Pedrazzini, A.; Queyrel, A. Rockfall
hazard and risk assessments along roads at a regional scale: example in Swiss Alps. Nat. Hazards Earth Syst. Sci. 2012, 12, 615–
629, https://doi.org/10.5194/nhess-12-615-2012.
11. Fell, R.; Corominas, J.; Bonnard, C.; Cascini, L.; Leroi, E.; Savage, W.Z. Guidelines for landslide susceptibility, hazard and risk
zoning for land-use planning. Eng Geol 2008, 102, 99–111.
12. Günther, A.; Van Den Eeckhaut, M.; Reichenbach, P.; Hervás, J.; Malet, J.-P.; Foster, C.; Guzzetti, F. New developments in har-
monized landslide susceptibility mapping over Europe in the framework of the European Soil Thematic Strategy. In Proceedings
of the Second World Landslide Forum, 3- 7 October 2011, Rome, Italy; Margottini, C., Canuti, P. Sassa, K. (Eds): Springer, 2011.
13. García-Ruiz, J.M.; Beguería, S.; Lorente, A.; Martí, C. Comparing debris flow relationships in the Alps and in the Pyrenees. Instituto
Pirenaico de Ecología: Zaragoza, Spain, 2002.
14. Rickenmann, D. Empirical relationship for debris flow. Kluwer Academic Publishers: Amsterdam, Netherlands, 1999.
15. Puglisi, C.; Falconi, L.; Lentini, A.; Leoni, G.; Prada, C.R. Debris flow risk assessment in the Aguas Calientes Village (Cusco,
Perù). In Landslide science and practice. Margottini C, Canuti P, Sassa K (eds): Springer: Berlin, 2013, 519–526.
16. Guzzetti, F.; Carrara, A.; Cardinali, M.; Reichenbach, P. Landslide hazard evaluation: a review of current techniques and their
application in a multi-scale study, Central Italy. Geomorphology 1999, 31, 181–216.
17. Ardizzone, E.; Cardinali, M.; Carrara, A.; Guzzetti, F.; Reichenbach, P. Impact of mapping errors on the reliability of landslide
hazard maps. Nat Hazards Earth Syst Sci 1999, 2, 3–14.
18. Chacón, J. & Corominas, J. Landslides and GIS. Special Issue. Natural Hazards 2003, 30:3, 263-512.
19. González-Jiménez, A.; Carrasco, R.M.; Ayala Carcedo, F.J.; Pedraza, J.; Martín-Duque, J.F.; Sanz, M.A.; y Bodoque, J.M.; Sanz,
M. El análisis de la susceptibilidad en la prevención de los movimientos de ladera: un análisis comparativo de las metodologías
aplicadas al Valle del Jerte (Sistema Central español). In Riesgos naturales y desarrollo sostenible. Impacto, predicción y mitigación.
IGME. Serie Medio Ambiente y Riesgos Geológicos (10). Ayala Carcedo J., Olcina Cantos, J., Laín Huerta, L., Gonzáles Jiménez, A.
IGME: Madrid, Spain, 2006.
20. Felicísimo, A.; Cuartero, A.; Remondo, R.; Quirós, E. Mapping landslide susceptibility with logistic regression, multiple adap-
tive regression splines, classification and regression trees, and maximum entropy methods: a comparative study. Landslides
2013, 10 (2), 175–189.
Preprints (www.preprints.org) | NOT PEER-REVIEWED | Posted: 29 June 2021 doi:10.20944/preprints202106.0704.v1
21. Razavizadeh, S.; Solaimani, K.; Massironi, M.; Kavian, A. Mapping landslide susceptibility with frequency ratio, statistical in-
dex, and weights of evidence models: a case study in northern Iran. Environ Earth Sci 2017, 76, 499. DOI 10.1007/s12665-017-
6839-7
22. Selby, M. J. A rock mass strength classification for geomorphic purposes: with tests from Antarctica and New Zealand. Geomorph
1980, 24(1), 31-51.
23. Romana, M. El papel de las clasificaciones geomecánicas en el estudio de la estabilidad de taludes. In IV Simposio nacional sobre
taludes y laderas inestables, Granada, Spain, 1997, vol. III, 955-1011.
24. Serón, J. B.; Romana, M.; Montalar, E.; Cruzado, J. M.; Denia, J. L. Aplicación de la clasificación geomecánica SMR mediante
un Sistema de Información Geográfica (SIG). V Simposio Nacional Taludes y Laderas Inestables, Madrid, Spain, 2001, vol. I, 405-416.
25. Hantz, D.; Corominas, J.; Crosta, G.B.; Jaboyedoff, M. Definitions and Concepts for Quantitative Rockfall Hazard and Risk
Analysis. Geosciences 2021, 11, 158. https://doi.org/10.3390/ Geosciences 11040158
26. Corominas, J. & Mavrouli, O. 2013. Estimation quantitative du risque (QRA) pour les bâtiments lié aux © European Union, Société
Vaudoise des Sciences Naturelles (SVSN): Switzerland, 2013.
27. Amadesi E.; Vianello G.; Bonfatti G.; Pignone R.; Preti D. Guida alla realizzazione di una carta della stabilità dei versanti. Pitagora
Editrice: Bologna, Italy, 1977, 72.
28. Chacón, J.; Irigaray, C.; Fernández del Castillo, T.; El Hamdouni, R. Susceptibilidad a los movimientos de ladera en el sector
central de la Cordillera Bética. In Mapas de susceptibilidad a los movimientos de ladera con técnicas SIG. Fundamentos y Aplicaciones
en España. Ayala-Carcedo, F.J. & Corominas, J. (eds.). I.G.M.E, Serie Medio Ambiente Nº4: Madrid, Spain. 2003.
29. Sortino Barrionuevo, J.F; Mérida Rodríguez, M.F.; Perles Roselló, M.J. Susceptibilidad de movimientos en masa en infraestruc-
turas viarias. Aplicación a un tramo de la autovía A-7 (circunvalación de Málaga). In Comprendiendo el relieve: del pasado al futuro.
Actas de la XIV Reunión Nacional de Geomorfología. Durán, J.J., Montes, M., Robador, A., Salazar, A. (Eds.). IGME: Madrid, Spain,
2016.
30. Cardinali, M.; Reichenbach, P.; Guzzetti, F.; Ardizzone, F.; Antonini, G.; Galli, M.; Cacciano, M.; Castellani, M.; Salvatti, P. A
geomorphological approach to the estimation of landslide hazards and risks in Umbria, Central Italy. Natural Hazards and earth
System Sciences 2002, 2, 57–72.
31. Montgomery, D.R. & Dietrich, W.E. A physically based model for the topographic control on shallow landsliding. Water Resour.
Res. 1994, 30, 1153-1171.
32. Dietrich, W.E. & Montgomery, D.R. Shalstab: a digital terrain model for mappingshallow landslide potential. Berkeley: California,
United States, 1998.
33. Carrasco, R.M.; Pedraza, J.; Martín Duque, J.F.; Mattera, M.; Sanz M.A.; Bodoque, J.M.; Diez Herrero, A. Cartografía de zonas
de susceptibilidad o propensión a los movimientos en masa en el Valle del Jerte (Sistema Central Español). In Mapas de suscep-
tibilidad a los movimientos de ladera con técnicas SIG. Ayala-Carcedo, F. J. & Corominas, J. (eds). IGME: Madrid, Spain, 2003. Serie:
Medio Ambiente, 4, 133-153.
34. Carrara, A. A multivariate model for landslide hazard evaluation. Mathematical Geology 1983, 15, 403-426.
35. Carrara, A. Multivariate models for landslide hazard evaluation. A "Black Box" approach. Workshop on Natural Disasters in
European Mediterranean Countries. Perugia, Italy, 1988, 205-224.
36. Carrara, A.; Cardinali, M.; Detti, R.; Guzzetti, F.; Pasqui, V.; Reichenbach, P. GIS techniques and statistical models in evaluating
landslide hazard. Earth Surf Process Landf 1991, 16(5), 427-445. doi: 10.1002/esp.3290160505
37. Carrara, A.; Cardinali, M.; Guzzetti, F. Uncertainty in assessing landslide hazard and risk. ITC-Journal 1992, 2, 172-183.
38. Carrara, A.; Cardinali, M.; Guzzetti, F.; Reichenbach, P. GIS technology in mapping landslide hazard. In Geographical Information
Systems in assessing natural hazards. Carrara, A. & Guzzetti, F. (eds). Kluwer Academic Publisher, Dordrecht, Netherlands. 1995,
135-175.
39. Clerici, A.; Perego, S.; Tellini, C.; Vescovi, P. A procedure for landslide susceptibility zonation by the conditional analysis
method. Geomorphology 2002, 48, 349-364. doi:10.1016/S0169-555X (02)00079-X
40. Ayalew, L.; Yamagishi, H. The application of GIS-based logistic regression for landslide susceptibility mapping in the Kakuda–
Yahiko Mountains, Central Japan. Geomorphology 2005, 65, 15–31.
41. Bornaetxea, T.; Ormaetxea, O.; Antigüedad, I. Modelo de susceptibilidad de deslizamientos superficiales para la cuenca del río
Oria (Gipuzkoa). Aplicación de la regresión logística y comparación de resultados con estudios precedentes. In Comprendiendo
el relieve: del pasado al futuro. Actas de la XIV Reunión Nacional de Geomorfología. Durán, J.J.; Montes, M.; Robador, A.; Salazar, A.
(eds.). Instituto Geológico y Minero de España: Málaga, Spain, 2016, 213-220.
42. Van Den Eeckhaut, M.; Vanwalleghem, T.; Poesen, J.; Govers, G.; Verstraeten, G. Prediction of landslide susceptibility using
rare events logistic regression: a case-study in the Flemish Ardennes (Belgium). Geomorphology 2006, 76, 392-410.
43. Yilmaz, I. Landslide susceptibility mapping using frequency ratio, logistic regression, artificial neural networks and their com-
parison: a case study from Kat landslides (Tokat-Turkey). Computers and Geosciences 2009, 35, 1125-1138.
44. Trigila, A.; Ladanza, C.; Esposito, C.; Scarascia-Mugnozza, G. Comparison of Logistic Regression and Random Forests tech-
niques for shallow landslide susceptibility assessment in Giampilieri (NE Sicily, Italy). Geomorphology 2015, 249, 119-136.
45. Ataollah, S.; Lee, S.; Oh, H.; Kamran, C. A GIS-based logistic regression model in rock-fall susceptibility mapping along a moun-
tainous road: Salavat Abad case study, Kurdistan, Iran. Nat Hazards 2012, 64, 1639-1656. DOI 10.1007/s11069-012-0321-3
46. Chau, K.; Tang, Y.; Wong, R. GIS-Based Rock-fall susceptibility map for Hong Kong. J Rock Mech Min Sci 2004, 41(3), 530-542.
47. Remondo, J.; Soto, J.; González-Díez, A.; Terán, J.R.D.; Cendrero, A. Human impact on geomorphic processes and hazards in
mountain areas in northern Spain. Geomorphology 2005, 66, 69-84.
Preprints (www.preprints.org) | NOT PEER-REVIEWED | Posted: 29 June 2021 doi:10.20944/preprints202106.0704.v1
48. San Millan, E.; González-Díez, A.; Fernández-Maroto, G. Influencia de las precipitaciones en los movimientos de ladera en
Cantabria. In Comprendiendo el relieve: del pasado al futuro. Actas de la XIV Reunión Nacional de Geomorfología. Durán, J.J.;
Montes, M.; Robador, A.; Salazar, A. (Eds.). SEG, Madrid, Spain. 2016.
49. Iriagaray, C. & Chacón, J. Los movimientos de ladera en el sector de Colmenar (Málaga). Rev. Soc. Geol. España 1991, 4, 3003-
214.
50. Irigaray, C.; Chacón, J.; Romero, E. El deslizamiento de Ríogordo (Málaga). Geogaceta 1991, 10, 103-106.
51. IGME Atlas de riesgos naturales en la provincia de Granada. Instituto Geológico y Minero de España. Diputación de Granada,
Granada, Spain. 2007.
52. Crozier M.J. Multiple occurrence regional landslide events. XII Reunión Nacional de Geomorfología, Santander, Spain. 2012.
53. Perles Roselló, M. J.; Pardo García, S. M.; Mérida Rodríguez, M.; Olcina Cantos, J. Methodology for the prediction of multiple
risks points in road infrastructures after torrential episodes (road-risk). Boletín De La Asociación Española De Geografía 2019, 80.
https://doi.org/10.21138/bage.2615
54. Kanungo, D.; Arora, M.; Sarkar, S.; Gupta, R.P. Landslide Susceptibility Zonation (LSZ) Mapping – A Review. Journal of South
Asia Disaster Studies 2009, 2, 81-105.
55. Capitani M.; et al. The slope aspect: A predisposing factor for landsliding? Geoscience 2014,
http://dx.doi.org/10.1016/j.crte.2013.11.002
56. Varnes, D.J. Slope movement types and processes. In Special Report 176: Landslides: Analysis and Control. Schuster, R. L. & Krizek,
R. J. Transportation and Road Research Board, National Academy of Science, Washington D. C., United States, 1978, 11-33.
57. Pedraza, J. Geomorfologia: principios, métodos y aplicaciones. Editorial Rueda, Madrid, Spain. 1996.
58. Reichenbach, P.; Rossi, M.; Malamud, B. D.; Mihir, M.; Guzzetti, F. A review of statistically-based landslide susceptibility mod-
els. Earth-Science Reviews 2018, 180, 60-91. https://doi.org/10.1016/j.earscirev.2018.03.001
59. Li, S.; Xu, Q.; Tang, M.; Li, H.; Yang, H.; Wei, Y. Centrifuge Modeling and the Analysis of Ancient Landslides Subjected to
Reservoir Water Level Fluctuation. Sustainability 2020, 12, 2092.
60. Tien Bui, D.; Shirzadi, A.; Shahabi, H.; Geertsema, M.; Omidvar, E.; Clague, J.J.; Thai Pham, B.; Dou, J.; Talebpour Asl, D.; Bin
Ahmad, B.; Lee, S. New Ensemble Models for Shallow Landslide Susceptibility Modeling in a Semi-Arid Watershed. Forests
2019, 10, 743.
61. Li, C.; Tang, H.; Wang, Y. Study on the Deformation Mechanism of Reservoir Landslides Considering Rheological Properties
of the Slip Zone Soil: A Case Study in the Three Gorges Reservoir Region. Sustainability 2020, 12, 6427.
62. Barredo, J.I.; Benavides, A.; Hervás, J.; Van Westen, C.J. Comparing heuristic landslide hazard assessment techniques using GIS
in the Tirajana basin, Gran Canaria Island, Spain. JAG 2000, 2-1, 9-23.
63. Hosmer, J.R. & Lemeshow, S., Applied logistic regression. John Wiley & Sons, Oxford, United Kingdom. 2004. 528 pp.
64. Wang, Q.; Wang, D.; Huang, Y.; Wang, Z.; Zhang, L.; Guo, Q.; Chen, W.; Chen, W.; Sang, M. Landslide Susceptibility Mapping
Based on Selected Optimal Combination of Landslide Predisposing Factors in a Large Catchment. Sustainability 2015, 7, 16653-
16669.
65. Openshaw, S. The modifiable areal unit problem. CATMOG 38. GeoBooks, Norwich, England, 1984.
66. Dou, J.; Yunus, A.P.; Merghadi, A.; Shirzadi, A.; Nguyen, H.; Hussain, Y.; Avtar, R.; Chen, Y.; Pham, B.T.; Yamagishi, H.; Dif-
ferent sampling strategies for predicting landslide susceptibilities are deemed less consequential with deep learning. Sci Total
Environ 2020, 720, 137320. doi: 10.1016/j.scitotenv.2020.137320.
67. Chang, KT.; Merghadi, A.; Yunus, A.P. et al. Evaluating scale effects of topographic variables in landslide susceptibility models
using GIS-based machine learning techniques. Sci Rep 2019, 9, 12296. https://doi.org/10.1038/s41598-019-48773-2
68. Kouhartsiouk, D.; Perdikou, S. The application of DInSAR and Bayesian statistics for the assessment of landslide susceptibility.
Nat Hazards 2021. https://doi.org/10.1007/s11069-020-04433-7
69. Selby, M.J. Hillslope Materials and Processes. Paperback Bunko, China. 1993.
70. Dorren, L. A review of rockfall mechanics and modelling approaches. Progress in Physical Geography 2003, 27(1), 69-87.
71. Ferentinou, M.; Krebs, A.; Romer, C. Rockfall Susceptibility Analysis, the Case of the Access Road to the Giants Castle Nature
Reserve, South Africa. ISRM Regional Symposium – EUROCK, 2015, Salzburg, Austria.
72. Wei Chen, H. & Zhou, Z. A GIS-based comparative study of DempsterShafer, logistic regression and artificial neural network
models for landslide susceptibility mapping. Geocarto International 2017, 32, 367-385.
73. Abedini, M.; Ghasemyan, B.; Rezaei Mogaddam, H. Susceptibility mapping in Bijar city, Kurdistan Province, Iran: a compara-
tive study by logistic regression and AHP models. Environ Earth Sci 2017, 76, 308. DOI 10.1007/s12665-017-6502-3
74. Bornaetxea, T.; Ormaetxea, O.; Antigüedad, I. Modelo de susceptibilidad de deslizamientos superficiales para la cuenca del río
Oria (Gipuzkoa). Aplicación de la regresión logística y comparación de resultados con estudios precedentes. In Comprendiendo
el relieve: del pasado al futuro. Durán, J.J., Montes, M.; Robador, A.; Salazar, A. (eds.). Actas de la XIV Reunión Nacional de Geo-
morfología. Instituto Geológico y Minero de España, Málaga, Spain. 2016, 213-220. 2016.
Preprints (www.preprints.org) | NOT PEER-REVIEWED | Posted: 29 June 2021 doi:10.20944/preprints202106.0704.v1