ARTICLE 10.1177/0021943605279244JOURNAL OF...
31
10.1177/0021943605279244 ARTICLE JOURNAL OF BUSINESS COMMUNICATION Rutherford / CORPORATE ANNUAL REPORT NARRATIVES GENRE ANALYSIS OF CORPORATE ANNUAL REPORT NARRATIVES A Corpus Linguistics–Based Approach Brian A. Rutherford University of Kent The study reported on in this article analyzes the U.K. Operating and Financial Review (OFR) as a genre of accountingnarrative, employing word frequencies to identify genre rules. Evidence is found of rhetor- ical ploys within the genre and of differences in word frequencies, suggesting the existence of subgenres, related to the exigencies of the rhetorical situation. The genre employs language biased toward the posi- tive (the “Pollyanna effect”), despite authoritative guidance that the OFR should be expressed in neutral terms. Evidence of subgenres includes differential propensity to employ positive language and differ- ences in the rhetorical ploys adopted in connection with marketing strategy, corporate recovery, self- reference, comparative analysis, and gearing (leverage). The study also demonstrates the value of a cor- pus linguistics approach in analyzing accounting narratives. Keywords: genre analysis; corpus linguistics; corporate annual reports; accounting narratives; operating and financial review Accounting narratives in corporate annual reports are composed and read within a dense and complex web of stakeholder communication, which includes interim reports, preliminary announcements, analyst presentations, corporate Web sites, media releases, direct contact with large investors, and, of course, the remainder of the annual report itself (see, for example, Argenti & Forman, 2002, chap. 7; Gibbins, Richardson, & Waterhouse, 1990; Rogers, 2000). Sophisticated users, such as analysts acting on behalf of large investors, draw on these sources to fore- cast future performance. Although direct contacts are a particularly and increas- ingly valuable source of information, corporate annual reports, including narra- tives, are used extensively in the forecasting process, which frequently builds explicitly on information about past performance and current position (Arnold & Moizer, 1984; Barker, 1998, 2001). Because analysts’forecasts frequently include Brian A. Rutherford (Ph.D., University of Kent, 1980) is a professor of accounting in the Kent Business School at the University of Kent. The author wishes to thank Dr. Ali Almohaimeed for assistance with the research and the anonymous reviewers and associate editor for helpful comments on earlier versions of the article. Correspondence concerning this article should be addressed to Professor Brian A. Rutherford, Kent Business School, University of Kent, Canterbury, Kent CT2 7PE, UK; e-mail: [email protected]. Journal of Business Communication, Volume 42, Number 4, October 2005 349-378 DOI: 10.1177/0021943605279244 © 2005 by the Association for Business Communication
Transcript of ARTICLE 10.1177/0021943605279244JOURNAL OF...

10.1177/0021943605279244 ARTICLEJOURNAL OF BUSINESS COMMUNICATIONRutherford / CORPORATE ANNUAL REPORT NARRATIVES
GENRE ANALYSIS OF CORPORATEANNUAL REPORT NARRATIVES
A Corpus Linguistics–Based Approach
Brian A. RutherfordUniversity of Kent
The study reported on in this article analyzes the U.K. Operating and Financial Review (OFR) as a genreof accounting narrative, employing word frequencies to identify genre rules. Evidence is found of rhetor-ical ploys within the genre and of differences in word frequencies, suggesting the existence of subgenres,related to the exigencies of the rhetorical situation. The genre employs language biased toward the posi-tive (the “Pollyanna effect”), despite authoritative guidance that the OFR should be expressed in neutralterms. Evidence of subgenres includes differential propensity to employ positive language and differ-ences in the rhetorical ploys adopted in connection with marketing strategy, corporate recovery, self-reference, comparative analysis, and gearing (leverage). The study also demonstrates the value of a cor-pus linguistics approach in analyzing accounting narratives.
Keywords: genre analysis; corpus linguistics; corporate annual reports; accounting narratives;operating and financial review
Accounting narratives in corporate annual reports are composed and read within adense and complex web of stakeholder communication, which includes interimreports, preliminary announcements, analyst presentations, corporate Web sites,media releases, direct contact with large investors, and, of course, the remainder ofthe annual report itself (see, for example, Argenti & Forman, 2002, chap. 7;Gibbins, Richardson, & Waterhouse, 1990; Rogers, 2000). Sophisticated users,such as analysts acting on behalf of large investors, draw on these sources to fore-cast future performance. Although direct contacts are a particularly and increas-ingly valuable source of information, corporate annual reports, including narra-tives, are used extensively in the forecasting process, which frequently buildsexplicitly on information about past performance and current position (Arnold &Moizer, 1984; Barker, 1998, 2001). Because analysts’ forecasts frequently include
Brian A. Rutherford (Ph.D., University of Kent, 1980) is a professor of accounting in the Kent BusinessSchool at the University of Kent. The author wishes to thank Dr. Ali Almohaimeed for assistance with theresearch and the anonymous reviewers and associate editor for helpful comments on earlier versions ofthe article. Correspondence concerning this article should be addressed to Professor Brian A.Rutherford, Kent Business School, University of Kent, Canterbury, Kent CT2 7PE, UK; e-mail:[email protected].
Journal of Business Communication, Volume 42, Number 4, October 2005 349-378DOI: 10.1177/0021943605279244© 2005 by the Association for Business Communication
a subjective element, the tone as well as the content of narrative descriptions maypotentially influence the reader.
Companies manage their stakeholder communications, including accountingnarratives, strategically while also reacting tactically to particular circumstancesand making relatively mechanical responses to regulatory codes and similar stimuli(Gibbins et al., 1990). The context within which accounting narratives are pro-duced thus provides both opportunities for, and constraints on, communication. Forexample, companies may choose to employ the narrative as part of a wider stake-holder communications strategy, as well as meeting narrow regulatory require-ments. Notable among the constraints affecting corporate report narratives is theneed to align the account offered in the narrative with that in the numerical financialstatements, both to achieve credibility for the narrative with its readers and to sat-isfy regulatory requirements.1 Regularities in the conditions under which corporateannual report narratives are produced, combined with the pattern of opportunitiesand constraints faced by their authors, make it likely that such narratives willrepresent an identifiable genre of business communication.
In the United Kingdom, the general management commentary on the businessaccompanying the numerical financial statements in the corporate annual report isnormally known as the Operating and Financial Review (OFR). This article exam-ines certain lexical features of the OFR, employing genre theory as an analyticalframework and corpus linguistics as the empirical method. Possible explanationsfor the features identified from the corpus are explored, treating the emergence,maintenance, and modification of the genre as a dynamic, socially embeddedprocess.
The greatest research effort in exploring the stylistics of accounting narrativeshas hitherto been directed at the single dimension of syntactical complexity, that is,the readability of the narrative as measured by variables such as word and sentencelength. A recent survey (Stanton & Stanton, 2002) reported more studies of thisdimension of discourse management in accounting narratives than of all otheraspects put together. Though easy and relatively economical to measure, and, ofcourse, important in its own right, readability is only a limited component of theoverall picture. Furthermore, most studies have examined syntactical complexityas a device for obscuring poor performance, when it is not the most obvious targetfor such manipulation and the evidence for this phenomenon is, to say the least,ambivalent (Rutherford, 2003).
Stylistic choices affecting the form of accounting narratives include both thestrictly lexical, principally word choice and frequency of use, and more complexaspects of linguistic formation. An example of the latter is addressed by Thomas’s(1997) analysis of presidents’letters to shareholders in a period of declining perfor-mance. The study found that “as the news becomes more negative, linguistic struc-tures suggest a factual, ‘objective’, situation caused by circumstances not attribut-able to any persons who might otherwise be thought responsible” (p. 47). Studies ofword choice are sometimes treated as an entirely separate category from those
350 JOURNAL OF BUSINESS COMMUNICATION

dealing with more complex linguistic issues: Smith and Taffler (2000), for exam-ple, refer to them as “form-oriented” to contrast them with “meaning-oriented”studies. However, word choice, including questions of usage such as the frequencywith which particular words are deployed, affects meaning and interpretation, sothe difference is one of degree rather than kind.
The OFR is a relatively recent development in the United Kingdom. Britishcompanies publishing OFRs do so within a framework of guidance set down by theAccounting Standards Board that during the period under study, had been com-mended by a variety of authoritative bodies but was, “persuasive rather than man-datory” (Accounting Standards Board, 1993, p. ii).2 It thus provides a useful oppor-tunity to compare the narratives of different companies because the degree ofauthoritative guidance means that all companies cover broadly similar ground(unlike, for example, the wholly free-form chair’s report) while at the same time notbeing so heavily regulated as to produce dense and uniform “boiler-plate” prosewhatever the company’s circumstances. One feature of the guidance of particularrelevance to this study is its statement that it is an “essential feature” of the OFR that“it should be balanced and objective, dealing even-handedly with both good andbad aspects” (Accounting Standards Board, 1993, para. 3).
An important factor in conducting thestudy reported on in this article is thedevelopment of a tool for genre analy-sis of accounting narratives by adoptingan approach based on corpuslinguistics.
An important factor in conducting the study reported on in this article is thedevelopment of a tool for genre analysis of accounting narratives by adopting anapproach based on corpus linguistics. As an initial stage in the development, thisarticle focuses on lexical choice—an approach that has been adopted in other disci-plines such as political science and cultural studies.3 The statement chosen is pro-duced in an environment influenced by the provision of authoritative guidance,unlike most of the reports on which previous research on accounting narratives hasbeen conducted. The remainder of this article is organized as follows. The follow-ing two sections explore the theoretical framework within which the analysis isconducted and the use of corpus linguistics within this framework. The next sectionprovides a survey of prior literature. The design of the current research is thendescribed and the results are explained and discussed. Also included is a briefconcluding section.
Rutherford / CORPORATE ANNUAL REPORT NARRATIVES 351

GENRE THEORY
The notion of genre is classical in origin and was first developed within thehumanities as a tool of literary criticism. Genre has now been embraced bylinguisticians and social theorists of communication,4 for whom
A genre comprises a class of communicative events, the members of which sharesome set of communicative purposes. These purposes are recognised by the expertmembers of the parent discourse community, and thereby constitute the rationalefor the genre. This rationale shapes the schematic structure of the discourse andinfluences and constrains choice of content and style. (Swales, 1990, p. 58)
More succinctly, Miller (1984) identifies genres as “typified rhetorical actionsbased in recurrent situations” (p. 159). As Yates and Orlikowski (1992, pp. 300-301) point out, this approach draws on Bitzer’s (1968) three-part model, composedof (a) the action needed (the exigence), (b) the audience, and (c) constraints (“per-sons, events, objects, and relations which are parts of the situation because theyhave the power to constrain decision and action needed to modify the exigence,”Bitzer [1968, p. 8]).
Yates and Orlikowski (1992) employ Giddens’s structuration theory to locatethe maintenance, elaboration, and modification of genres, and specifically genresof organizational communication, in their sociohistorical context. Genres areviewed as social institutions, produced and modified by human agents employingthe rules of a genre to communicate within the world of organizations. Thisapproach emphasizes the dynamic, recursive nature of the process:
By using (or not using) particular genre rules, individuals enact the establishedgenres (or modified versions), thus reinforcing and reproducing (or challengingand changing) established genres over time. The enacted genres then inform futurecommunicative action, and the recursive cycle begins anew. (p. 306, reference to adiagram omitted)
Traditionally, genre theorists were concerned to derive formal definitions ofgenres, which would identify all members of the class from a limited number ofproperties (see Berkenkotter & Huckin, 1995, p. 17; Harrell & Linkugel, 1978).Recent approaches fit better with Yates and Orlikowski’s (1992) model and arguefor genres to be identified on the basis of “family resemblance,” a concept bor-rowed from Wittgenstein, according to which “exemplars or instances vary in theirprototypicality” (Swales, 1990, p. 49), yielding a more open and fluid scheme.
Although Yates and Orlikowski’s (1992) model is developed in the context ofcommunication inside an organization, it is equally applicable to communicationwithin wider discourse communities in the organizational field. It has beenemployed for this purpose, for example, in Berkenkotter and Huckin’s (1995)analysis of communication within disciplines and professions and Crowston and
352 JOURNAL OF BUSINESS COMMUNICATION

Williams’s (2000) study of World Wide Web sites. This is not to suggest that allgroupings in the corporate world constitute discourse communities, because themembers of a group may not all recognize the same set of communicative purposes.As a consequence, the notion of genre must be deployed with care in cases wherecommunication is taking place within a complex social setting, such as the use ofcorporate annual reports to provide information to a variety of stakeholders.
Most theorists accept that genres can be identified at different levels of abstrac-tion, depending on a discourse community’s “sense of recurrence of rhetorical situ-ations” (Miller, 1984, p. 162). Although Miller (1984) held that genres can onlysensibly be identified at one level for any specific time and place, Simons (1978)and others have argued for a hierarchical approach recognizing “that genres ‘exist’at various levels of abstraction, from the very broad to the very specific” (p. 37).Thus, for example, the interoffice memorandum might be recognized as a broadgenre of communication within the organization and the “new staff announcement”as a more specific genre within the broader class.
Yates and Orlikowski (1992) argue that the “genre phenomenon” requires “elab-oration through further empirical study within particular contexts” (p. 322). Theysuggest that studies can be synchronic or diachronic:
Synchronic analyses would identify the existing genres influencing communica-tion . . . within certain contexts, either by searching for the presence of well-established genres such as the memo or the meeting, or by identifying genres basedon detailed analysis of communication form, substance, and the invoking situa-tion. Such analyses also might examine the relationship between genres and otherfactors such as national culture, communication climates, or work practices.Although synchronic studies focus on a fixed period of time, such studies, never-theless, must be sensitive to differences in genre dimensions due to diachronic fac-tors such as emergence, maintenance, modification, and decay. (p. 322)
The present study treats the OFR as a middle-range genre of corporate commu-nication between organizations and their stakeholders, regarding it as lying withinthe broader genre of accounting narration generally and identifying potentialsubgenres according to the exigencies to be responded to. It is synchronic in theempirical data on which it draws, but the results are analyzed with sensitivity to thediachronic factors to which Yates and Orlikowski (1992) refer, as well as to the ten-sions that may arise from ruptures within the discourse community encompassingthe organization and its stakeholders. The specifics of OFR reporting provide awell-structured context for the communication act to be studied, in terms both ofthe process by which communication takes place and of the exigencies to be han-dled, for example, a loss to be explained. Although this study does not extend toobservation of readers’ reactions to the OFR, the primary audience for the state-ment is sufficiently well delineated for it to be possible to offer some inferencesabout the role of the audience in the communicative act.
Rutherford / CORPORATE ANNUAL REPORT NARRATIVES 353

CORPUS LINGUISTICS
Corpus linguistics is an empirical methodology that employs a large, systemati-cally organized body of natural texts (the corpus) to analyze actual patterns of lan-guage use (Biber, Conrad, & Reppen, 1998, pp. 4-5). Corpus-based methods werefirst employed within linguistics in the 1880s, but Chomsky’s attacks on themethod in the middle of the 20th century interrupted its development for a period(McEnery & Wilson, 2001, pp. 2-13). Chomsky’s objections to corpus-based workwere that (a) the proper object of the linguist is to develop cognitively plausiblemodels of language competence and not to study actual performance, polluted as itwill inevitably be by both defects in the application of models and contextually spe-cific departures from them; (b) corpora, however large, are never comprehensive,and thus cannot fully embrace all possible usages; (c) frequency of use does notnecessarily reflect linguistic importance;5 and (d) introspection is a faster and moreefficient method of establishing language use.
To the first of these objections, corpus linguisticians were able to respond thatthe objective of their methodology was, indeed, to support the development of lin-guistic models, but by empirically grounded and validated, and thus more compel-ling, methods (Leech, 1992). Chomsky’s remaining, essentially practical, objec-tions stimulated corpus linguisticians to improve the methodology. Several verylarge corpora have been constructed to capture the features of general linguisticusage, while smaller corpora remain, of course, appropriate for the examination ofspecific types and aspects of communication.6 A variety of methods have beendeveloped to handle the possible existence within corpora of eccentric or context-bound usages and sampling bias, including the application of statistical tools (Biberet al., 1998, Part IV) and approaches that relate evidence from the corpus to exter-nal referents. Probably the most significant development was the emergence ofcomputer-based corpora and specialist text-analysis software (Kennedy, 1998, pp.259-267). Advanced computational approaches make those corpus-linguisticmethods that can be undertaken using such approaches remarkably efficient com-pared to traditional methods and to some other forms of linguistic analysis. Corpuslinguistics can no longer be accused of being excessively time-consuming or ineffi-cient (Abercrombie, 1965). A final blow against Chomsky’s arguments was theobservation that the results even of his own introspection could sometimes be dem-onstrated to be wrong by evidence from corpora (McEnery & Wilson, 2001, p. 11).7
The increasing sophistication of corpus linguistic methods led to a rapid expan-sion in their use in the final decades of the past century (Aijmer & Altenberg,1991a) and, indeed, to a “remarkable renaissance” (McEnery & Wilson, 2001, p. 1)for corpus linguistics. Expansion occurred initially within linguistics and associ-ated disciplines (Leech, 1991) but rapidly spread across the social and psychologi-cal sciences (McEnery & Wilson, 2001, chap. 4). Corpus linguistics has been usedin genre analysis, both to distinguish between genres (see Biber & Finegan, 1991,pp. 213-215) and to study characteristics of individual genres (see McEnery & Wil-son, 2001, pp. 117-119). An interesting study of the latter kind is Johnson’s (2002)
354 JOURNAL OF BUSINESS COMMUNICATION
examination of the pragmatics of “so-prefaced” questions in formal police inter-views. For an example of a strictly lexical corpus-based study in linguistics, seeStenström’s (1991) study of expletives in spoken conversational English. Exam-ples of corpus-based lexical studies in social sciences include those employed inFairclough’s (2000) analysis of the political rhetoric of “New Labour” in the UnitedKingdom and Lakoff’s (2000) examination of the way use of language by themedia can shape public attitudes and public policy.
PRIOR STUDIES
The survey used in the present study focuses specifically on studies of lexicalchoice in accounting narratives. For a much more wide-ranging survey, see Jonesand Shoemaker’s (1994) review of 32 studies of syntactical complexity, includingSubramanian, Insley, and Blackwell’s (1993) research; and 36 wider, meaning-oriented, analyses of thematic content. The systematic analysis of text-level rhetor-ical devices in accounting narratives is of relatively recent origin: See Hyland(1998) for a valuable contribution to this effort.
The survey used in the present studyfocuses specifically on studies of lexicalchoice in accounting narratives.
Among the earliest studies of word frequency in accounting narratives to appearin the accounting literature were those by Ingram and Frazier (1983), Frazier,Ingram, and Tennyson (1984), and Tennyson, Ingram, and Dugan (1990). Thesewere based on a computer program known as WORDS, which uses a sophisticatedseries of statistical maneuvers to identify relationships between clusters of words.Each cluster is then interpreted subjectively as a theme. Ingram and Frazier (1983),for example, identified eight themes (such as “increased levels of earnings andsales,” p. 56) for each industry and narrative type and related these to financial char-acteristics of the preparers. They found a “logical relationship” (p. 57) betweenthemes and financial characteristics; for example, more profitable companiesreferred relatively frequently to future growth and less frequently to restructuringplans. Although these studies started out from word frequencies, the results wereessentially employed to examine thematic content. In any event, the method wasnot widely taken up, possibly because of its complexity and the effort needed toperform the analytical procedures.
An important study by Hildebrandt and Snyder (1981) appeared before the workdescribed above but received little attention in the finance literature, possibly
Rutherford / CORPORATE ANNUAL REPORT NARRATIVES 355

because it was published in a journal devoted to the discipline of communicationstudies rather than accounting. Their study extended a line of research from otherareas of communication studies to inquire whether “the Pollyanna principle”(Matlin & Stang, 1978), that is, the phenomenon that “positive, affirmative wordsare used more often than negative words” (Hildebrandt & Snyder, 1981, p. 6) alsoapplied in corporate annual report letters to shareholders. They established that itdid: “Positive words occur more frequently than negative words in annual letters tostockholders regardless of the corporation’s financial position” (Hildebrandt &Snyder, 1981, p. 10).
Abrahamson and Amir tested the association between the proportion of “wordswith negative connotations” (1996, p. 1179) in the president’s letter and subsequentperformance. They did not attempt to code words with positive connotationsbecause of the volume of material involved. They performed their analysis for 2years: In the 1st, coding was disambiguated, that is checked for meaning in context,so that, for example, failure would not be coded as negative in a sentence describingthe successful development of a new drug to treat heart failure. Because of thelabor-intensity of this process, disambiguation was not carried out for the 2nd-year’s analysis. The study found that high relative negativity is associated with poorperformance both in the year of the report and as a predictor of future performance.These results hold for the undisambiguated as well as the disambiguated data.
Smith and Taffler’s (2000) U.K. study used both word- and theme-based countsapplied to chairs’ statements and was directed specifically to the prediction offinancial distress. Both word- and theme-based counts were successful. Theauthors were able to build a powerful model to predict corporate failure based onthe presence in the chair’s statement of such words as overdraft, loans, borrowing,closure, disposal, and sale as well as phrases such as bank support, no dividend,chairman resigns, and managing director resigns.
Much thematically oriented research demonstrates significant levels of“impression management,” that is “the process by which individuals attempt tocontrol the impressions others form of them” (Sydserff & Weetman, 2002, p. 526).Interestingly, the two purely lexical studies of Abrahamnson and Amir (1996) andSmith and Taffler (2000) suggest that, if impression management occurs, it is not sosuccessful that differences between good and poor performers are effectivelycamouflaged.
Abrahamson and Park’s (1994) study, which employed the same sample of pres-idents’ letters as Abrahamson and Amir (1996), established that preparers with ahigher proportion of external directors tend to produce narratives with a greaterdegree of negativity (that is, external directors appear to restrain the Pollyannaeffect), but that where the external directors have relatively large shareholdings,this reduces negativity. By looking at the directors’ subsequent patterns of sharedisposal, Abrahamson and Park (1994) also found some evidence that the impact ofthe latter factor was deliberate.
356 JOURNAL OF BUSINESS COMMUNICATION

RESEARCH DESIGN
Sample Selection
Companies in the survey were drawn from the Times UK 1000 for 1998 (Bar-row, 1998). Companies in the Financial Services and Property sectors wereexcluded because of the specialized nature of their operations and those for which amarket capitalization was not given in the source listing were excluded because thisgenerally meant that the company concerned was unquoted, government con-trolled, or a subsidiary, and would thus be likely to face a different reporting regime.A further 61 companies were identified at the time of the survey as delisted since thepublication of the source; 1 company was excluded because its report was preparedunder U.S. regulations; and 3 were excluded because their corporate structuresmade it impossible to apply the analysis used in this article. This left 455 U.K.-listed companies subject to the British financial reporting regime. They range insize and extent of multinational operation and some will, of course, have also beeninfluenced by other reporting regimes.
Annual reports were requested from the 455 companies, and 419 (92.1%) werereceived: Some of the companies not supplying reports may have been delistedsince the publication of the source listing. Of these 419 companies, 68 publishedcombined OFRs, defined as a single narrative statement covering both operationaland financial aspects and identified by the company by the use of a title includingthe terms operating, operations, or operational; finance or financial; and review,report, or statement. The analysis is based on seven groups of 10 companies drawnfrom those producing combined OFRs. The groups were chosen to reflect aspectsof the rhetorical situation such as the performance to be accounted for and the com-plexity of the financial position to be described. The groups are loss-making com-panies; the least and most profitable; the largest and smallest (measured in terms ofcapital employed); and the highest and lowest geared or leveraged, that is, thosewith the highest and lowest proportions of debt finance. Five pair wise comparisonswere then made: (a) loss-making versus least profitable, (b) least profitable versusmost profitable, (c) loss-making versus most profitable, (d) smallest versus largest,and (e) lowest geared versus highest geared. Any one company within the 68 pro-ducing combined OFRs can, of course, appear in more than one group, for exam-ple, if it is loss-making and highly geared. Because some companies did appear inmore than one group, the total number of companies drawn from the 68 featuring inthe groups was in fact 44.8 More precise definitions and the companies in eachgroup are given in Table 1.
Identification of the Text
Modern graphic design of documents such as corporate annual reports oftenbring together onto the page a number of different elements, some of which are not
Rutherford / CORPORATE ANNUAL REPORT NARRATIVES 357

358 JOURNAL OF BUSINESS COMMUNICATION
Table 1. Composition of the Groups of Companies
Loss-makingDefinition: negative profit for the year attributable to shareholders.
Body Shop International*Brent International*CaradonCookson GroupHuntingdon Life Sciences*Laura Ashley Holdings*Liberty*OrangeRank GroupStylo
Total number of words: 30,972Least profitable
Definition: lowest positive return on equity.BG*British Airways*Capital CorporationDaniel ThwaitesJames Fisher & SonsJohn LaingLands Improvement Holdings*Le Riches Stores*Paterson Zochonis*Swan Hill Group*
Total number of words: 29,518Most profitable
Definition: highest positive return on equity.Airtours*Bass*Blagden Industries*British Aerospace*Go-Ahead GroupImperial Chemical Industries*London International GroupMedevaNFC*WPP Group*
Total number of words: 48,563Largest
Definition: highest total assets less current liabilities.Bass*BG*British Aerospace*British Airways*Cable and Wireless*DiageoImperial Chemical Industries*
(continued)

Rutherford / CORPORATE ANNUAL REPORT NARRATIVES 359
National PowerTescoUnited Utilities
Total number of words: 66,625Smallest
Definition: lowest positive total assets less current liabilities.Brent International*Brockhampton HoldingsDorling Kindersley Holdings*International Energy GroupJohnston GroupLands Improvements Holdings*Laura Ashley Holdings*Le Riches Stores *Liberty*Time Products*
Total number of words: 18,577Highest geared (leveraged)
Definition: highest proportion of debt finance (i.e., highest total assets less current liabilitiesminus shareholders’ funds as a percentage of total assets less current liabilities). Companies withnegative shareholders’ funds are excluded.
Airtours*British Aerospace*British Airways*Cable and Wireless*Huntingdon Life Sciences*HyderImperial Chemical Industries*NFC*Tate & LyleWPP Group*
Total number of words: 57,927Lowest geared
Definition: lowest proportion of debt finance (i.e., lowest total assets less current liabilitiesminus shareholders’ funds as a percentage of total assets less current liabilities). Companies withnegative total assets less current liabilities are excluded.
Blagden Industries*Body Shop International*Dorling Kindersley Holdings*Le Riches Stores*Liberty*Paterson Zochonis*PsionScottish & NewcastleSwan Hill Group*Time Products*
Total number of words: 20,850
Note: Companies appearing in more than one group are indicated by an asterisk.
Table 1 (continued)
text whereas others, though textual in nature, are not part of the flow of the mainnarrative to which the page is devoted. A protocol, designed to distinguish betweenthe narrative flow of the main textual statement and other matter appearing on thesame pages, was prepared and used to identify the OFR proper. Among the materialexcluded were (a) prose within graphical material and captions; (b) tables standingalone from the main text; (c) pull quotes, slogans, and similar material displayedoutside the main text area; and (d) repeated headings. The following wereincluded: (a) headlines and standfirst material, and (b) tables, lists, and bullet-pointed material included within the grammatical structure of the continuousprose.
In content analysis it is normal to increase the efficiency of word searches byexcluding from the text to be examined frequently occurring words and other lan-guage units of no significance to the analysis, and this procedure was adopted here.Excluded language units were (a) frequently occurring function words such as arti-cles, conjunctions, pronouns, and common verbs; (b) days and months of the year;(c) numbers, including monetary amounts, in words and figures; (d) numericaldenominations, for example, millions; (e) identifiable company and productnames;9 and (f) punctuation marks.10
Word Frequency
The use of word frequencies is described by Weber (1990) in his text on contentanalysis. Weber uses as an example the political programs of U.S. Presidents, asrevealed in their speeches. Weber demonstrates that in the example he uses, a mea-sure of disambiguation does not materially improve results. Weber himself usesordered word-frequency lists to measure relative frequency. However, althoughthis approach may be appropriate where differences in frequency are sufficientlymarked to make individual rankings significant, and has the advantage of making itpossible to ignore differences in the total volume of words in each group of texts, itis not appropriate where frequencies for individual words within a group of textsare so similar across a large number of words as to undermine the significance ofthe rankings. This was the case for the OFRs under examination, as can be seenfrom Table 2, which shows the 50 most frequently used eligible words across allcompanies in the sample.11
Although the total number of words used was 235,367, frequencies start to con-verge very early in the rank order: For example, between the 20th and 30th rankingwords, 8 out of the 10 words have a frequency that falls within 10 of that for at least1 of the pair of words on either side; between the 30th and 40th ranking all wordshave a frequency that falls within 10 of the words on either side and there are threejoint rankings. To overcome this problem, this study, like Abrahamson and Park(1994) and Abrahamson and Amir (1996), focuses on actual frequencies of wordusage. It was first necessary to identify a manageable number of words for furtherexamination. This was done by obtaining ordered frequency lists for each of theseven groups of texts. The 50 most frequently used words from each group were
360 JOURNAL OF BUSINESS COMMUNICATION
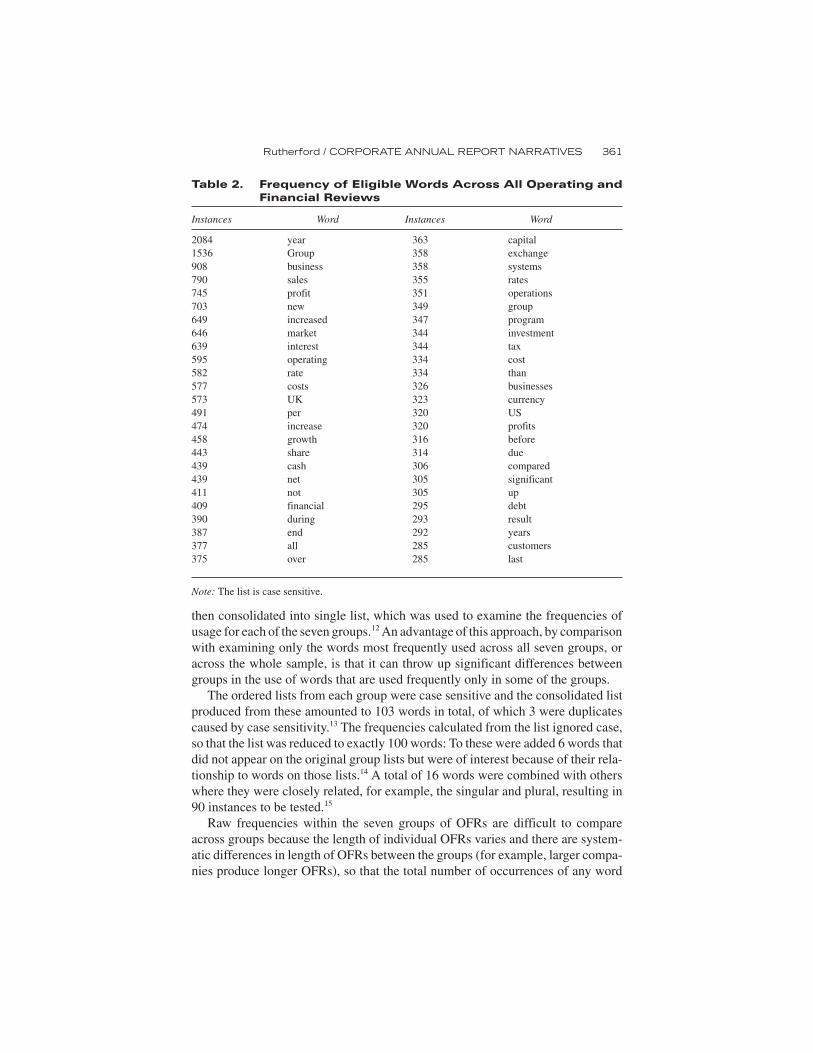
then consolidated into single list, which was used to examine the frequencies ofusage for each of the seven groups.12 An advantage of this approach, by comparisonwith examining only the words most frequently used across all seven groups, oracross the whole sample, is that it can throw up significant differences betweengroups in the use of words that are used frequently only in some of the groups.
The ordered lists from each group were case sensitive and the consolidated listproduced from these amounted to 103 words in total, of which 3 were duplicatescaused by case sensitivity.13 The frequencies calculated from the list ignored case,so that the list was reduced to exactly 100 words: To these were added 6 words thatdid not appear on the original group lists but were of interest because of their rela-tionship to words on those lists.14 A total of 16 words were combined with otherswhere they were closely related, for example, the singular and plural, resulting in90 instances to be tested.15
Raw frequencies within the seven groups of OFRs are difficult to compareacross groups because the length of individual OFRs varies and there are system-atic differences in length of OFRs between the groups (for example, larger compa-nies produce longer OFRs), so that the total number of occurrences of any word
Rutherford / CORPORATE ANNUAL REPORT NARRATIVES 361
Table 2. Frequency of Eligible Words Across All Operating andFinancial Reviews
Instances Word Instances Word
2084 year1536 Group908 business790 sales745 profit703 new649 increased646 market639 interest595 operating582 rate577 costs573 UK491 per474 increase458 growth443 share439 cash439 net411 not409 financial390 during387 end377 all375 over
363 capital358 exchange358 systems355 rates351 operations349 group347 program344 investment344 tax334 cost334 than326 businesses323 currency320 US320 profits316 before314 due306 compared305 significant305 up295 debt293 result292 years285 customers285 last
Note: The list is case sensitive.

reflects a combination of its relative frequency and the length of OFRs in the group.The effect of length can be eliminated by measuring frequency per 10,000 wordsand this is done here.
Charged Words
Two word-lists were identified in broadly the same way as in the studies byAbrahamson and Park (1994) and Abrahamson and Amir (1996). After discussingthe general approach, two researchers independently coded all eligible words ascarrying “negative connotations” (Abrahamson & Amir, 1996, p. 1179), that is, allother things being equal, as being likely to be taken to be “connoting bad news”(Abrahamson & Amir, 1996, p. 1160); or as carrying positive connotations. Theresearchers then arrived at an agreed classification of positively and negativelycharged words. The total numbers of positively and negatively charged words ineach text were used to construct two measures. The first is total charged words per10,000 words and the second, the balance of charged words, is total positivelycharged words as a percentage of all charged words. Following Abrahamson andPark (1994) and Abrahamson and Amir (1996), the words loss and losses werecoded as negatively charged and, consequently, the words profit and profits werecoded as positively charged. To test whether simply referring to their results forthe year was influencing companies’ scores for the use of charged words, thesame analysis was performed for a restricted list excluding these words.
RESULTS AND DISCUSSION
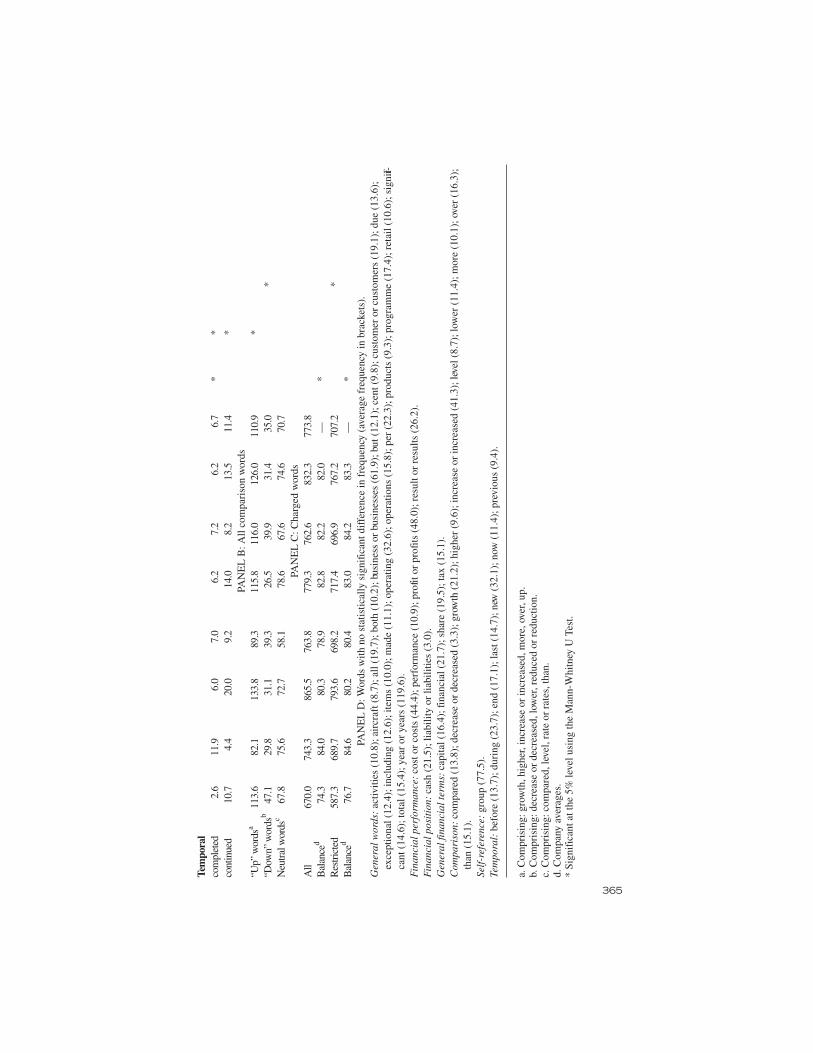
Table 3 (Panel A) shows the frequencies of individual words on the consolidatedlist for each of the seven groups of companies where there were statistically signifi-cant differences in frequency. Frequencies are quoted per 10,000 words for eachcorpus of texts. Individual words are marshaled into categories relevant to the pur-pose of the OFR. The table also shows, for each relevant pair wise comparison,which differences between frequencies were significant at the 5% level, using theMann-Whitney U test. This is a powerful, noncategorical, nonparametric test ofbetween-subjects differences that compares the number of times a score from oneof the groups is ranked higher than a score from the other (Bryman & Cramer, 1999,pp. 136-137). Panel D gives the remaining words and the average frequency ofeach.
For many words, the pattern of usage across pairings suggests that there is a sta-bility that both supports the contention that the narratives constitute an identifiablegenre and implies that where differences do arise, significance can be attached tothem. There is clear evidence that the Pollyanna effect is operating in the construc-tion of OFRs. This confirms that this effect, widely observed in unregulatedaccounting narratives, is also apparent in narratives produced under the influenceof authoritative guidance, and indeed, guidance that includes a requirement to
362 JOURNAL OF BUSINESS COMMUNICATION

363
Ta
ble
3.
Wo
rd F
req
ue
nc
ies A
na
lyze
d b
y C
om
pa
ny
Att
rib
ute
Wor
d F
requ
enci
es p
er 1
0,00
0 W
ords
Stat
isti
call
y Si
gnifi
cant
Diff
eren
ces
in F
requ
ency
Loss
-Le
ast
Loss
-Lo
wes
tLo
ss-
Leas
tM
ost
Low
est
Hig
hest
Mak
ing
Pro
fitab
leM
akin
gSm
alle
stG
eare
dvs
.M
akin
gP
rofit
able
Pro
fitab
leSm
alle
stLa
rges
tG
eare
dG
eare
dvs
.Lea
stvs
.Mos
tvs
.Mos
tvs
.H
ighe
stW
ords
Com
pani
esC
ompa
nies
Com
pani
esC
ompa
nies
Com
pani
esC
ompa
nies
Com
pani
esAv
erag
eP
rofit
able
Pro
fitab
leP
rofit
able
Larg
est
Gea
red
PAN
EL
A: W
ords
with
sta
tistic
ally
sig
nifi
cant
dif
fere
nces
in f
requ
ency
Gen
eral
wor
dsB
ritis
h0.
313
.96.
81.
110
.70.
011
.66.
3*
*de
velo
pmen
t4.
515
.210
.19.
28.
014
.95.
79.
7*
Eur
ope
8.1
3.0
16.1
3.8
10.5
8.6
15.2
9.3
*fa
cilit
ies
15.8
10.2
3.9
8.6
7.4
6.7
9.3
8.8
*m
ajor
8.1
7.5
16.1
12.4
13.1
8.2
12.4
11.1
*m
anag
emen
t13
.219
.615
.015
.615
.512
.918
.615
.8*
mar
ket
17.1
15.9
35.4
17.8
28.2
17.3
28.1
22.8
**
*ne
twor
k18
.72.
73.
30.
58.
60.
58.
66.
1*
*no
t22
.018
.315
.616
.115
.815
.319
.717
.5*
num
ber
14.5
7.8
9.1
9.2
7.8
12.0
8.8
9.9
*pr
oper
ty3.
613
.22.
915
.62.
012
.01.
47.
2*
serv
ices
6.1
7.8
9.3
4.8
13.7
3.4
17.1
8.9
*st
ore
orst
ores
22.6
4.1
0.4
14.5
3.5
33.1
0.3
11.2
*st
rong
5.5
4.1
15.9
9.7
11.4
12.0
14.3
10.4
*sy
stem
s26
.514
.923
.115
.621
.214
.923
.319
.9*
tradi
ng11
.012
.918
.721
.014
.624
.516
.217
.0*
UK
57.1
15.6
18.3
24.2
18.9
24.5
21.1
25.7
*U
S11
.910
.217
.99.
714
.48.
216
.412
.7*
Fin
anci
alpe
rfor
man
celo
ssor
loss
es30
.713
.212
.423
.112
.024
.015
.218
.7*
*m
argi
ns3.
64.
415
.04.
86.
29.
611
.47.
9*
(con
tinu
ed)

364
reve
nue
and/
orsa
les
and/
ortu
rnov
er91
.636
.265
.768
.948
.179
.149
.862
.8*
Fin
anci
alpo
sitio
nas
seto
rass
ets
15.2
23.7
8.4
18.8
15.2
14.4
12.4
15.4
*bo
rrow
ings
14.9
15.9
6.8
11.8
11.9
8.6
7.6
11.1
**
debt
13.6
10.8
11.1
5.9
15.0
7.7
16.2
11.5
**
Gen
eral
finan
cial
term
scu
rren
cy14
.912
.513
.29.
217
.310
.619
.213
.8*
exch
ange
18.7
12.5
16.1
9.7
17.0
9.1
19.7
14.7
*ex
pend
iture
15.2
10.2
9.5
11.3
10.7
9.1
6.7
10.4
*fix
ed9.
711
.95.
14.
311
.63.
89.
88.
0*
*in
tere
st35
.531
.823
.517
.230
.920
.628
.526
.9*
inve
stm
ent
12.3
20.3
5.1
11.3
11.6
15.3
8.1
12.0
**
net
31.6
22.7
23.1
26.9
21.8
22.5
21.6
24.3
**
risk
5.8
19.3
7.2
6.5
16.1
5.8
13.3
10.6
**
ster
ling
7.1
5.4
14.4
5.9
12.6
6.2
16.2
9.7
*C
ompa
riso
nra
teor
rate
s36
.538
.635
.420
.540
.224
.941
.634
.0*
*re
duce
dor
redu
ctio
n25
.518
.014
.830
.112
.224
.516
.920
.3*
up13
.27.
517
.38.
115
.29.
116
.612
.4*
Self-
refe
renc
eco
mpa
ny13
.622
.017
.322
.616
.822
.121
.819
.5*
*di
visi
on7.
79.
57.
018
.84.
219
.23.
310
.0*
TA
BL
E 3
(c
on
tin
ue
d)
Wor
d F
requ
enci
es p
er 1
0,00
0 W
ords
Stat
isti
call
y Si
gnifi
cant
Diff
eren
ces
in F
requ
ency
Loss
-Le
ast
Loss
-Lo
wes
tLo
ss-
Leas
tM
ost
Low
est
Hig
hest
Mak
ing
Pro
fitab
leM
akin
gSm
alle
stG
eare
dvs
.M
akin
gP
rofit
able
Pro
fitab
leSm
alle
stLa
rges
tG
eare
dG
eare
dvs
.Lea
stvs
.Mos
tvs
.Mos
tvs
.H
ighe
stW
ords
Com
pani
esC
ompa
nies
Com
pani
esC
ompa
nies
Com
pani
esC
ompa
nies
Com
pani
esAv
erag
eP
rofit
able
Pro
fitab
leP
rofit
able
Larg
est
Gea
red
365
Tem
pora
lco
mpl
eted
2.6
11.9
6.0
7.0
6.2
7.2
6.2
6.7
**
cont
inue
d10
.74.
420
.09.
214
.08.
213
.511
.4*
PAN
EL
B: A
ll co
mpa
riso
n w
ords
“Up”
wor
dsa
113.
682
.113
3.8
89.3
115.
811
6.0
126.
011
0.9
*“D
own”
wor
dsb
47.1
29.8
31.1
39.3
26.5
39.9
31.4
35.0
*N
eutra
lwor
dsc
67.8
75.6
72.7
58.1
78.6
67.6
74.6
70.7
PAN
EL
C: C
harg
ed w
ords
All
670.
074
3.3
865.
576
3.8
779.
376
2.6
832.
377
3.8
Bal
ance
d74
.384
.080
.378
.982
.882
.282
.0—
*R
estri
cted
587.
368
9.7
793.
669
8.2
717.
469
6.9
767.
270
7.2
*B
alan
ced
76.7
84.6
80.2
80.4
83.0
84.2
83.3
—*
PAN
EL
D: W
ords
with
no
stat
istic
ally
sig
nific
ant d
iffe
renc
e in
fre
quen
cy (
aver
age
freq
uenc
y in
bra
cket
s).
Gen
eral
wor
ds:
activ
ities
(10
.8);
air
craf
t (8.
7); a
ll (1
9.7)
; bot
h (1
0.2)
; bus
ines
s or
bus
ines
ses
(61.
9); b
ut (
12.1
); c
ent (
9.8)
; cus
tom
er o
r cu
stom
ers
(19.
1); d
ue (
13.6
);ex
cept
iona
l (12
.4);
incl
udin
g (1
2.6)
; ite
ms
(10.
0); m
ade
(11.
1); o
pera
ting
(32.
6); o
pera
tions
(15
.8);
per
(22
.3);
pro
duct
s (9
.3);
pro
gram
me
(17.
4); r
etai
l (10
.6);
sig
nifi-
cant
(14
.6);
tota
l (15
.4);
yea
r or
yea
rs (
119.
6).
Fin
anci
al p
erfo
rman
ce:
cost
or
cost
s (4
4.4)
; per
form
ance
(10
.9);
pro
fit o
r pr
ofits
(48
.0);
res
ult o
r re
sults
(26
.2).
Fin
anci
al p
osit
ion:
cash
(21
.5);
liab
ility
or
liabi
litie
s (3
.0).
Gen
eral
fina
ncia
l ter
ms:
capi
tal (
16.4
); fi
nanc
ial (
21.7
); s
hare
(19
.5);
tax
(15.
1).
Com
pari
son:
com
pare
d (1
3.8)
; dec
reas
e or
dec
reas
ed (
3.3)
; gro
wth
(21
.2);
hig
her
(9.6
); in
crea
se o
r in
crea
sed
(41.
3); l
evel
(8.
7); l
ower
(11
.4);
mor
e (1
0.1)
; ove
r (1
6.3)
;th
an (
15.1
).Se
lf-r
efer
ence
:gr
oup
(77.
5).
Tem
pora
l:be
fore
(13
.7);
dur
ing
(23.
7); e
nd (
17.1
); la
st (
14.7
); n
ew (
32.1
); n
ow (
11.4
); p
revi
ous
(9.4
).
a. C
ompr
isin
g: g
row
th, h
ighe
r, in
crea
se o
r in
crea
sed,
mor
e, o
ver,
up.
b. C
ompr
isin
g: d
ecre
ase
or d
ecre
ased
, low
er, r
educ
ed o
r re
duct
ion.
c. C
ompr
isin
g: c
ompa
red,
leve
l, ra
te o
r ra
tes,
than
.d.
Com
pany
ave
rage
s.*
Sign
ific
ant a
t the
5%
leve
l usi
ng th
e M
ann-
Whi
tney
U T
est.
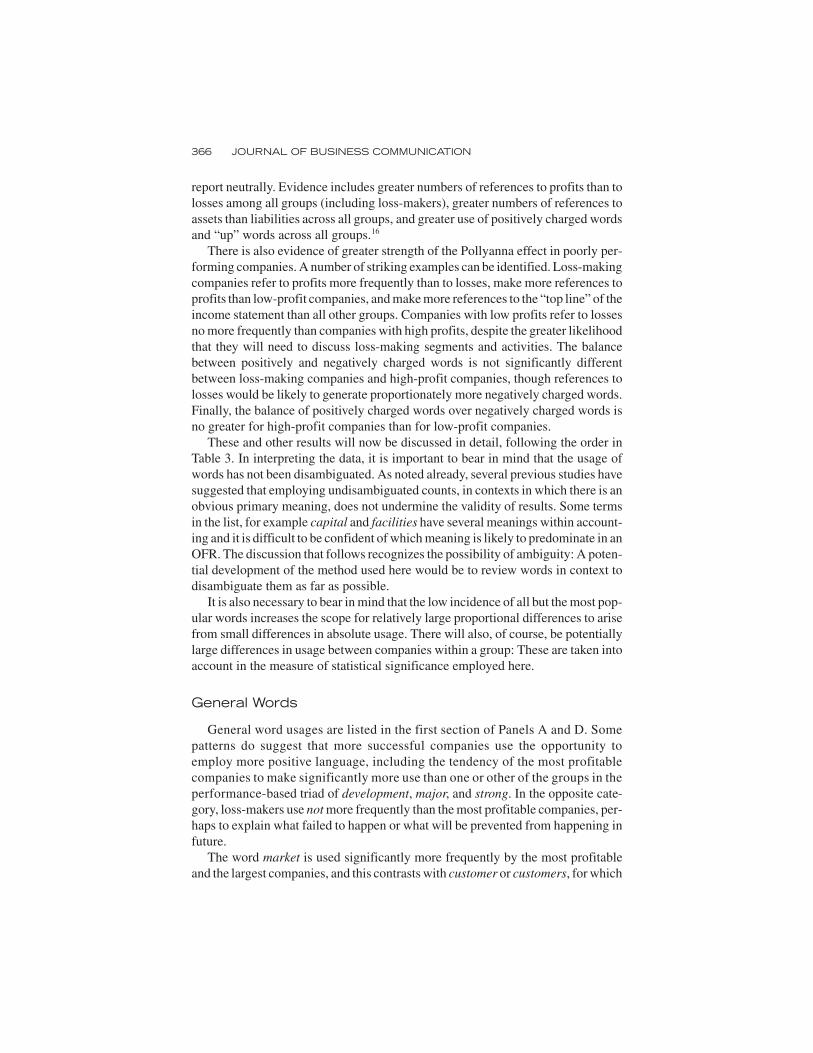
report neutrally. Evidence includes greater numbers of references to profits than tolosses among all groups (including loss-makers), greater numbers of references toassets than liabilities across all groups, and greater use of positively charged wordsand “up” words across all groups.16
There is also evidence of greater strength of the Pollyanna effect in poorly per-forming companies. A number of striking examples can be identified. Loss-makingcompanies refer to profits more frequently than to losses, make more references toprofits than low-profit companies, and make more references to the “top line” of theincome statement than all other groups. Companies with low profits refer to lossesno more frequently than companies with high profits, despite the greater likelihoodthat they will need to discuss loss-making segments and activities. The balancebetween positively and negatively charged words is not significantly differentbetween loss-making companies and high-profit companies, though references tolosses would be likely to generate proportionately more negatively charged words.Finally, the balance of positively charged words over negatively charged words isno greater for high-profit companies than for low-profit companies.
These and other results will now be discussed in detail, following the order inTable 3. In interpreting the data, it is important to bear in mind that the usage ofwords has not been disambiguated. As noted already, several previous studies havesuggested that employing undisambiguated counts, in contexts in which there is anobvious primary meaning, does not undermine the validity of results. Some termsin the list, for example capital and facilities have several meanings within account-ing and it is difficult to be confident of which meaning is likely to predominate in anOFR. The discussion that follows recognizes the possibility of ambiguity: A poten-tial development of the method used here would be to review words in context todisambiguate them as far as possible.
It is also necessary to bear in mind that the low incidence of all but the most pop-ular words increases the scope for relatively large proportional differences to arisefrom small differences in absolute usage. There will also, of course, be potentiallylarge differences in usage between companies within a group: These are taken intoaccount in the measure of statistical significance employed here.
General Words
General word usages are listed in the first section of Panels A and D. Somepatterns do suggest that more successful companies use the opportunity toemploy more positive language, including the tendency of the most profitablecompanies to make significantly more use than one or other of the groups in theperformance-based triad of development, major, and strong. In the opposite cate-gory, loss-makers use not more frequently than the most profitable companies, per-haps to explain what failed to happen or what will be prevented from happening infuture.
The word market is used significantly more frequently by the most profitableand the largest companies, and this contrasts with customer or customers, for which
366 JOURNAL OF BUSINESS COMMUNICATION

differences are not significant. Although no firm conclusion can be drawn fromthese observations alone, they do suggest that an investigation of the rhetoric ofmarketing policy in accounting narratives may show that small or poorly perform-ing companies focus narrowly, for example, on existing customers or categories ofcustomers; whereas larger or better performing companies engage in a wider, morestrategically oriented, discussion. To establish whether this difference in focus is acause or a consequence of the difference in size or performance would requiremuch more extensive research.
Almost all the words with no obvious thematic implication exhibit no significantdifferences in frequency within any of the pairings. This is true of activities, all,both, business or businesses, but, cent, due, exceptional, including, items, made,operating, operations, per, products, programme, significant, total, and year oryears. Some substantial differences in frequency have what Ingram and Frazier(1983) describe as a logical relationship with the industries within which compa-nies in each group are operating. Significant differences in usage of network, prop-erty, and store or stores are associated with the presence in groups of communica-tion and utility companies, an agricultural development company, and retailers,respectively. Some differences have lexical explanations. For example, differencesin the use of British are associated with the presence of companies using this wordin their name.
Thus, over a substantial range of general words, patterns of usage are similarbetween groups or have a logical relationship with the characteristics of the group,or are likely to have lexical explanations. This suggests that there is stability withinthe genre, so that, where differences arise, significance can be attached to them.
Financial Performance
As might be expected, evidence for the Pollyanna effect is strongest in the areaof financial performance. A case in which an a priori expectation of a differencewould be justified is between loss-making and profitable companies in relation tothe use of loss or losses and such a difference, in the direction to be expected, isindeed, observable. OFRs should discuss the performance of segments of the busi-ness as well as the business as a whole (Accounting Standards Board, 1993, para.9). Because it is likely that at least some of the least profitable companies foundthemselves in this position because some of their segments were actually makinglosses, it might be expected that the least profitable companies would refer to loss orlosses significantly more frequently than the most profitable. In fact there was nosignificant difference in this frequency and the difference in usage was less than oneinstance per 10,000 words. This suggests that the Pollyanna effect is implicated in afocus by the least profitable companies on their overall results and on their profit-able segments. Also remarkable is the tendency of loss-making companies toemploy profit or profits more frequently than they use loss or losses and, indeed,more frequently than the least profitable companies used profit or profits. Althoughit is understandable that they would want to refer both to the prospect of profits in
Rutherford / CORPORATE ANNUAL REPORT NARRATIVES 367

future and to the profitable segments of their operations in the current period, thisdoes provide clear support for the Pollyanna hypothesis.
There is no difference between loss-making and profitable companies in the useof result or results or performance, which suggests that loss-making companies arenot avoiding references to losses by employing neutral references to the bottomline. There is, however, a difference between the loss-making and the least profit-able companies in the use of revenue or sales or turnover, suggesting that the Polly-anna effect is manifesting itself in a shift in the focus of discussion from the bottomline to higher up the profit and loss account. The most profitable companies makemore use of margins, suggesting that in the rhetoric of performance analysis, sensi-tive topics receive more attention when the overall position is favorable.
All companies use cost or costs with similar frequencies. If loss-making and theleast profitable companies have strategies for corporate recovery that include cut-ting the cost base, either they are not describing them in the OFR, or their descrip-tions do not actually use cost or costs, or their descriptions are so brief they do notsignificantly affect relative frequencies. Further research on the rhetoric of corpo-rate recovery might yield interesting information about the deployment of technicallanguage in narrative reports. There are no significant differences in the use ofwords describing financial performance between small and large or low- and high-geared companies, and, because there is no reason for expecting differences withinthese categories, this again suggests stability within the genre.
Financial Position
A clear example of the tendency to accentuate the warmer, stronger, more attrac-tive side of operations is that all groups used asset or assets a great deal more fre-quently than liability or liabilities—at least three and a half times as frequently, infact, with the highest ratio occurring in the case of the most profitable companies, at14:1. The most profitable companies talked less about assets than the leastprofitable.
A clear example of the tendency toaccentuate the warmer, stronger, moreattractive side of operations is that allgroups used or assets a greatdeal more frequently than liability orliabilities.
368 JOURNAL OF BUSINESS COMMUNICATION
It might be expected that the most highly geared (leveraged) companies wouldspend proportionately more time explaining the state of their indebtedness and thusmake more use of the terms debt and borrowings. In fact, although the difference inthe use of debt was significant and in the expected direction, that in the case ofborrowings was not significant. Though there may be a functional explanation forthis pattern (that is, a reason relating to the technical character of the events and cir-cumstances to be described), it does suggest that in the rhetoric of gearing, there is aperception by preparers that some technical synonyms are more acceptable thanothers. The apparent attractiveness of debt compared to borrowings is also sup-ported by the significantly greater use of debt but not borrowings by large compa-nies, given the likelihood that larger companies employ communications special-ists in constructing accounting narratives and thus make more sophisticatedrhetorical choices (see Courtis, 1995; Rutherford, 2002).
Word frequencies suggest that companies devote substantially less coverage todiscussing financial position and cash flow than to financial performance. Thereare no differences between companies in their use of cash.
General Financial Terms
Many individual words associated with general financial terms can be used in avariety of contexts, for example financial; or are ambiguous, including fixed (inter-est rate, asset, costs) and interest (return on capital, shareholding) so that it is diffi-cult to attach significance to differences in usage without further exploration. Somesignificant differences can be identified as being likely to be associated with under-lying characteristics of the group: Large companies use currency more often, forexample, presumably because they are likely to have more significant foreign oper-ations. Highly geared companies use risk more often, which again would be a func-tionally appropriate response to the need to address the greater financial risk associ-ated with higher gearing (Palepu, Healy, & Bernard, 2004, chap. 12). Largecompanies also make more use of risk, though it will require further work to estab-lish whether this is a functionally appropriate response to characteristics such asgreater treasury activity or indicates a greater willingness to discuss this dimensionof their operations generally.
Comparison
Comparative analysis should be an important feature of OFRs (AccountingStandards Board, 1993, para. 3) and Table 3 indicates that heavy use is made ofwords likely to be associated with such analysis, suggesting that companies areresponding to the Accounting Standards Board’s guidance. Though there are only asmall number of significant differences within the pairings for individual words,some interesting patterns emerge. There is a significant tendency for the largestcompanies to use reduced or reduction less than the smallest, which may reflectlarger companies’use of greater professional communications resources leading to
Rutherford / CORPORATE ANNUAL REPORT NARRATIVES 369
the avoidance of downbeat prose (another example of the Pollyanna effect). Thelargest companies use up substantially more frequently than the smallest, althoughthe difference here is not significant. The most profitable companies use up morethan twice as frequently as the least profitable and this difference is significant. Thismight result functionally from a balanced discussion of trends in performance bycompanies in both groups, with the most profitable companies having achievedtheir presence in this category by increasing profits, described using up, althoughfurther investigation might reveal Pollyannish tendencies in the deployment of upcontrasted with words connoting decline.
The tendency for the highest geared companies to use rate or rates more fre-quently than the lowest geared companies might have a functional explanation.Specifically, debt finance, and therefore interest rates, could be of greater signifi-cance for the highest geared companies, but it is not obvious that the significant dif-ference between the largest and smallest companies has such a rationale: It may bethat large companies provide more discussion of trends, and therefore rates ofchange, or there may be a rhetorical explanation.
Another interesting feature of the use of comparative words is revealed bygrouping the words according to their directional connotation (Panel B). Wordsgenerally connoting growth or elevation (“up” words) include growth, higher,increase or increased, more, over, and up; “down” words include decrease ordecreased, lower, and reduced or reduction. The remaining comparative words areclassified as neutral. There is a very substantial imbalance between up words anddown words, with the former used more than three times as frequently as the latter.Because price levels globally continue to rise, whereas historical cost remains thepredominant measurement system, and many economies were in an expansionarycondition at the time of the survey, some tendency toward “upness” is to beexpected. However, the size of the imbalance does suggest that the Pollyanna effectmay be in play, with a preference for expansionary rhetoric. The usage of neutralcomparative words is stable across all groups.
The group using down words more frequently than all others is the loss-makers;the difference is significant when compared with the most profitable companiesand they also have the lowest ratio of “upness” to “downness” within the triad basedon performance. This pattern appears to be consistent with the character of thegroup, in that it is likely to be necessary to explain that sales and profits have comedown and that costs are to be brought down in the future. The biggest gap withinpairs in the ratio of upness to downness arises in the case of company size: Becausethere is no obvious a priori reason for large companies to need to use up wordsnearly four and a half times more frequently than down words, when for small com-panies the ratio is two and a quarter, this suggests that in this particular area, largecompanies are more susceptible to the Pollyanna effect, perhaps as a result ofgreater use of corporate communications specialists.
Although there may be functional reasons for the differences identified here, theresults suggest that further investigation of upness and downess may reveal aspectsof a rhetoric of expansionism in accounting narratives.
370 JOURNAL OF BUSINESS COMMUNICATION
Self-Reference
Although the words included in this section can, clearly, be used to commentabout third parties, the nature of the OFR means that it is likely that most usesinvolve self-reference. The least profitable companies make most use of company,which would have a functional explanation in terms of the need to refer to the entityas a whole in discussing strategic responses to underperformance such as restruc-turing. However, interestingly, in the rhetoric of self-reference, loss-making com-panies resemble the most profitable, actually making least use of company of anygroup. Small companies are more likely to refer to a division, perhaps because theyhave not yet grown to a size at which they feel comfortable about employing termslike business for this purpose, as some large companies do. A study of the stylisticsof corporate self-reference might reveal complex patterns of word use, reflectingboth functionally appropriate responses to characteristics such as size andrhetorical ploys.
Temporal Words
This classification includes words referring broadly to the passage of time (suchas during and continued) and the location of events in time (for example, com-pleted, now, and last). The large majority of such words exhibit stable patterns ofuse across all pairings, suggesting that all companies make temporal referenceswith approximately the same frequency. The tendency of the least profitable com-panies to make most use of completed and least use of continued suggests a deci-sion to emphasize discontinuity, change, and a fresh start. As with the rhetoric ofself-reference, loss-making companies resemble the most profitable more closelythan they resemble the least profitable and this interesting result deserves furtherresearch: Are there functional reasons for the pattern or are behavioral influencesimplicated in the stylistics of loss-making companies’ narratives, with, for exam-ple, a reluctance to focus on the discontinuities in operations that might beexpected?
Charged Words
Use of charged words is reported in Panel C. There were no significant differ-ences in frequency or balance within the pairings based on size and gearing.Approximately 80% of all the charged language used in OFRs carries a positivecharge, clear evidence that the Pollyanna effect occurs even in an environment sub-ject to authoritative guidance.
There were no significant differences in frequency in the use of words from thelist of all charged words between companies in the triad based on performance, but,of course, this list includes profit or profits and loss or losses and the tendency ofloss-making companies to offset their need to use loss or losses frequently by mak-ing even more frequent references to profit or profits has already been noted.
Rutherford / CORPORATE ANNUAL REPORT NARRATIVES 371

Removing these words from the list yields a difference between loss-making andthe most profitable companies, with loss-making companies making less use ofcharged words, perhaps to avoid employing negatively charged language or, byemploying neutral language, to foster the impression of objectivity.
There are significant differences between loss-making and the least profit-able companies in the balance of charged words with, as would be expected,loss-making companies using more negatively charged words. This is the case forboth the full and the restricted list and is consistent with the results of Abrahamsonand Amir (1996). It might be expected that a similar difference would be observedbetween loss-making and the most profitable companies because this functionalexplanation is based simply on the distinction between making profits and makinglosses. Indeed, because the least profitable companies are more likely to have loss-making segments, the difference between loss making and the most profitable com-panies should arguably be greater than that between loss making and the least prof-itable companies. In fact the difference between loss making and the most profit-able companies is not significant because the most profitable companies are less“positive” in their language than the least profitable, suggesting that the least profit-able display more Pollyannish tendencies than the most profitable.
CONCLUSION
This study examined one form of accounting narrative, the OFR, as a genre ofaccounting writing and uses word frequencies as the tool of analysis. It finds suffi-cient stability in patterns of usage to support the definition of the OFR as a genre butidentifies a number of interesting variations in patterns of usage. Word frequenciesin the genre are consistent with the well-documented Pollyanna effect. This findingis itself of interest because the context, an accounting narrative produced under theinfluence of authoritative guidance requiring neutrality, has hitherto been littleresearched. Furthermore, the study extends previous research by demonstratingthat the effect can be identified for individual words and classes of words as well asfor charged words generally. The study also finds evidence of the greater strengthof the Pollyanna effect in poorly performing companies, again extending to indi-vidual words and classes of words as well as to charged words generally.
The study also finds evidence of thegreater strength of the Pollyanna effectin poorly performing companies.
372 JOURNAL OF BUSINESS COMMUNICATION
The Pollyanna effect can be interpreted as a form of impression management,that is, “the process by which individuals attempt to control the impressions othersform of them” (Sydserff & Weetman, 2002, p. 526). The incentives for managers toengage in impression management are well established (see, for example, Watts &Zimmerman, 1978) and evidence of apparent impression management in account-ing narratives has been found in several thematic studies: For recent evidence relat-ing to the United Kingdom and references to other studies, see Sydserff andWeetman (2002) and Clatworthy and Jones (2003). However, whether word fre-quencies or, indeed, some forms of meaning-oriented textual choice, such as devot-ing greater length to “good” news than “bad,” would be likely to fool sophisticatedusers such as financial analysts, reading narratives as part of the complex web ofstakeholder communication referred to earlier, is questionable. Whether sophisti-cated preparers would expect users to respond naively to efforts to manageimpressions is equally open to question.
The framework of genre theory allows a more nuanced approach to the workingout of the Pollyanna effect and to the understanding of impression managementgenerally. Suppose there was an initial tendency, in the reporting of some individualcompanies, to put a more positive construction on circumstances than a strictly neu-tral interpretation would allow? Some preparers might, indeed, believe that adegree of impression management could be achieved, at least with some users. Oth-ers might believe that stakeholders would expect the company to show a robust atti-tude by employing positive language. The possibility that some preparers mightemploy language more negative than the situation would warrant, for example toaccentuate the effect of a subsequent recovery, is not ruled out.
Such departures from strict neutrality would potentially form an impetus to theestablishment or modification of genre rules for the construction of accounting nar-ratives. If the generality of departures was toward the positive, preparers wouldcome to regard positive charging as the appropriate style in which to construct nar-ratives. Users would come to expect a degree of positive charging and might “dis-count” the contents of narratives accordingly: Narratives without a positive chargewould thus be misinterpreted and preparers would see that they needed to incorpo-rate an “excess balance” of positives, out of proportion to the underlying situation,in order to communicate the appropriate message effectively. Any preparers whoseinitial tendency was in the negative direction would have to adapt their behavior orface the consequences of even more extensive misunderstanding. Over time theaccounting narrative—like the real estate agent’s property description—wouldinclude in its genre rules an imperative to incorporate a degree of positive bias.Such a dynamic would be sufficient in itself to explain the Pollyanna effect withoutthere necessarily being any systematic intention or expectation to deceive. Ofcourse, not all users would necessarily fully understand the genre rules; classically,small investors acting without expert advice are regarded as likely to read financialstatements naively. Thus there remains scope for genres to act as, as Yates and
Rutherford / CORPORATE ANNUAL REPORT NARRATIVES 373
Orlikowski (1992) put it, “instruments of impression management at the individuallevel” (p. 321).
The evidence of this study supports the existence of subgenres of the OFR,related to the exigencies of the rhetorical situation, such as accounting for poor per-formance. The analytical framework presented earlier argues that these subgenreshave emerged in response to the same forces that are responsible for the mainte-nance and modification of the genre itself. The evidence suggests that subgenresdiffer in the degree to which they exhibit the Pollyanna effect, generally and in rela-tion to individual words. It also suggests that they differ in the rhetorical ploysadopted in areas such as marketing strategy, corporate recovery, self-reference,comparative analysis, and gearing.
The findings of this research remind managers of the need to understand andwork within the genre if effective communication is to be achieved. They also serveto alert users of corporate financial statements to the need to appreciate the rules ofthe genre in order to determine what preparers intend to communicate and toachieve a more sophisticated reading of the report’s contents: It is not only the num-bers that need to be analyzed with care. The existence of subgenres, as suggested bythe findings of this research, necessitates an even closer and more careful apprecia-tion of the rhetorical frame within which accounting narratives are produced.Those in the discourse community, preparers and users alike, who understand thatthe narrative of a poorly performing entity has to be written so as to “accentuate thepositive” more strongly than if the exigencies were more favorable, because that iswhat is expected, do not regard the outcome as misleading. The same is true ofdescriptions of corporate recovery or gearing that employ certain rhetorical ploysrather than others used when the exigencies are different. But members of the dis-course community who do not understand the rules of the genre may interpret thenarrative in a naive way and be misled.
The nature of the method used here is such that evidence is inevitably coarse-grained and suggestive. However, because it is straightforward, objective, and eco-nomical to use (in contrast to many other content-analytic methods), it is valuableas a means of raising issues and pointing to areas suitable for further investigation.Further applications of the method might include the following: (a) comparing thecharacteristics of different genres of accounting writing, including contrasting reg-ulated and unregulated narratives, (b) diachronic studies tracing the emergence andmodification of genre rules, and (c) detailed analysis of aspects of the genre and itsrules. An illustration of the last of these examples would be a longitudinal study ofthe frequency of use of risk and similar terms (and, indeed euphemisms) to analyzeresponses to increasing pressures to discuss risk in annual reports (Steering Groupon the Financial Reporting of Risk, 1999). Other areas of interest, identified earlierin the article, include the rhetoric of marketing strategy, performance analysis,corporate recovery, and gearing.
A suitably large-scale study might be able to identify differential degrees of“Pollyannishness” against the norm of the genre rules. Identifying tendencies todepart from the norm might be helpful in understanding management behavior and
374 JOURNAL OF BUSINESS COMMUNICATION

in forecasting future company performance. It would also begin the task of isolat-ing potentially effective impression management, that is, a level of positive charg-ing that users might not be expecting and thus might not allow for appropriately.Refinements of the method employed in this study might include testing the effectof disambiguating words and examining combinations of words and proximity ofword usage: For example do poorly performing companies use “profit words” nearto “loss words”?
Work in genre analysis of accountingnarratives could be extended to exam-ine the perceptions and behavior ofmembers of the discourse community,including preparers and users of corpo-rate reports.
Work in genre analysis of accounting narratives could be extended to examinethe perceptions and behavior of members of the discourse community, includingpreparers and users of corporate reports. Studies of preparers’ and users’ under-standing of the genre would greatly enrich an institutional model of narrativeaccounting communication responding to Yates and Orlikowski’s (1992) call forthe study of genre “through further empirical study within particular contexts” (p.322). Users have a particular salience for genre analysis as the audience for thecommunicative act. Exploration of users’ responses to subgenres within narrativeaccounting communication would begin the work of establishing how effectivepreparers’ attempts to manage the language of such communication really are.
NOTES
1. For descriptions of the latter, see Wilson, Davies, Curtis, and Wilkinson-Riddle (2001) for theU.K. context and U.S. Securities and Exchange Commission (2002) for the United States.
2. The statement became a statutory requirement in 2005 (see Maslen, 2002).3. For examples of such studies, see the section on Corpus Linguistics.4. For an archetypal theory of genres within literary criticism, see Frye (1957). For surveys of
the literature of genre analysis within linguistics and the social theory of communication respec-tively, see Swales (1990, chap. 3) and Miller (1984).
5. Chomsky’s demonstration of this point is that the sentence, “I live in New York” is likely tooccur more often in the corpus than the sentence, “I live in Dayton, Ohio,” purely because the formercity is more populous (McEnery & Wilson, 2001, p. 10).
6. The term corpus can in principle be applied to any collection of more than one text (McEnery& Wilson, 2001, p. 29). Although occasionally reserved in practice for very large collections, the
Rutherford / CORPORATE ANNUAL REPORT NARRATIVES 375

term is widely applied to any study of multiple texts treated in aggregate, especially when, in the caseof a relatively small number of texts, they are drawn, actually or potentially, from a larger population.Aijmer and Altenberg’s (1991b) volume of studies in English corpus linguistics, for example,includes at least three featuring fewer than 40 texts (not all papers specify the number), of which onecovers only 3.
7. For a brief history of the development of the methodology, see McEnery (2001, chap. 1) orLeech (1992).
8. Where a company appears in two groups and the groups vary in word frequency, its presencewill diminish the strength of the variance but the general tendency will remain apparent in the cor-pora as a whole.
9. Many company names cannot be fully identified as such on the basis of individual words, forexample, the word British is frequently used in company names.
10. Where an overall word count for a group of narratives is given it includes all words, that is, thecount is performed before excluding the word types listed here.
11. All word counts were performed using the Textpack program and text files obtained by scan-ning original documents. The resulting output was proofread.
12. In some cases slightly more than 50 words appeared in the individual lists because of ties in50th place.
13. Further cases of close similarity in words on the consolidated list arose from the inclusion ofsingular and plural nouns (8 cases) and two tenses of a verb (1 case).
14. The words added at this stage were asset, liability and liabilities (because assets feature onthe lists); decrease and decreased (increase and increased feature on the lists); and losses (loss fea-tures on the lists, as do both profit and profits).
15. The full list is shown in Table 3.16. “Up” words are defined later in this section. Frequencies by group for profit or profits and lia-
bility or liabilities are not given in Panel A because pairwise differences are not significant. The fre-quencies for the seven groups, following the order of Table 3, were, for profit or profits, 52.0, 40.3,59.5, 42.5, 49.8, 41.7, and 49.9, and for liability or liabilities, 3.9, 3.0, 0.6, 4.3, 2.4, 3.8, and 2.9.
REFERENCES
Abercrombie, D. (1965). Studies in phonetics and linguistics. Oxford, UK: Oxford University Press.Abrahamson, E., & Amir, E. (1996). The information content of the president’s letter to shareholders.
Journal of Business Finance and Accounting, 23 (8), 1157-1183.Abrahamson, E., & Park, C. (1994). Concealment of organisational outcomes: An agency theory per-
spective. Academy of Management Journal, 37 (5), 1302-1334.Accounting Standards Board. (1993). Operating and financial review. London: Author.Aijmer, K., & Altenberg, B. (1991a). Introduction. In K. Aijmer & B. Altenberg (Eds.), English corpus
linguistics (pp. 1-6). London: Longman.Aijmer, K., & Altenberg, B. (Eds.). (1991b). English corpus linguistics. London: Longman.Argenti, P. A., & Forman, J. (2002). The power of corporate communication. New York: McGraw-Hill.Arnold, J., & Moizer, P. (1984). A survey of the methods used by UK investment analysts to appraise
investments in ordinary shares. Accounting and Business Research, 14 (55), 195-207.Barker, R. G. (1998). The market for information—evidence from finance directors, analysts and fund
managers. Accounting and Business Research, 29 (1), 3-20.Barker, R. G. (2001). Institutional investors, accounting information and the ASB. Edinburgh, Scotland:
Institute of Chartered Accountants of Scotland.Barrow, M. (1998). The Times 1000 1998. London: Times Books.Berkenkotter, C., & Huckin, T. N. (1995). Genre knowledge in disciplinary communication: Cognition/
culture/power. Hillsdale, NJ: Lawrence Erlbaum.
376 JOURNAL OF BUSINESS COMMUNICATION

Biber, D., Conrad, S., & Reppen, R. (1998). Corpus linguistics: Investigating language structure anduse. Cambridge, UK: Cambridge University Press.
Biber, D., & Finegan, E. (1991). On the exploitation of computerised corpora in variation studies. InK. Aijmer & B. Altenberg (Eds.), English corpus linguistics (pp. 204-220). London: Longman.
Bitzer, L. F. (1968). The rhetorical situation. Philosophy and Rhetoric, 1, 1-14.Bryman, A., & Cramer, D. (1999). Quantitative data analysis with SPSS: A guide for social scientists.
London: Routledge.Clatworthy, M., & Jones, M. J. (2003). Financial reporting of good news and bad news: Evidence from
accounting narratives. Accounting and Business Research, 33 (3), 171-185.Courtis, J. K. (1995). Readability of annual reports: Western versus Asian evidence. Accounting, Audit-
ing and Accountability Journal, 8 (2), 4-17.Crowston, K., & Williams, M. (2000). Reproduced and emergent genres of communication on the World
Wide Web. Information Society, 16 (3), 201-215.Fairclough, N. (2000). New Labour, new language? London: Routledge.Frazier, K. B., Ingram, R. W., & Tennyson, B. M. (1984, Spring). A methodology for the analysis of nar-
rative accounting disclosures. Journal of Accounting Research, 22, 318-331.Frye, G. N. (1957). Anatomy of criticism. Princeton, NJ: Princeton University Press.Gibbins, M., Richardson, A., & Waterhouse, J. (1990). The management of corporate financial disclo-
sure: Opportunism, ritualism, policies, and processes. Journal of Accounting Research, 28 (1), 121-143.
Harrell, J., & Linkugel, W. A. (1978). On rhetorical genre: An organising perspective. Philosophy andRhetoric, 11, 262-281.
Hildebrandt, H. H., & Snyder, R. (1981). The Pollyanna hypothesis in business writing: Initial results,suggestions for research. Journal of Business Communication, 18 (1), 5-15.
Hyland, K. (1998). Exploring corporate rhetoric: Metadiscourse in the CEO’s letter. Journal of BusinessCommunication, 35 (2), 224-45.
Ingram, R. W., & Frazier, K. B. (1983). Narrative disclosures in annual reports. Journal of BusinessResearch, 11, 49-60.
Johnson, A. (2002). So . . . ?: Pragmatic implications of so-prefaced questions in formal police inter-views. In J. Cotterill (Ed.), Language in the legal process (pp. 91-110).Basingstoke, UK: Palgrave.
Jones, M. J., & Shoemaker, P. A. (1994). Accounting narratives: A review of empirical studies of contentand readability. Journal of Accounting Literature, 13, 142-184.
Kennedy, G. (1998). An introduction to corpus linguistics. Harlow, Essex, UK: Longman.Lakoff, R. T. (2000). The language war. Berkeley: University of California Press.Leech, G. (1991). The state of the art in corpus linguistics. In K. Aijmer & B. Altenberg (Eds.), English
corpus linguistics (pp. 8-29). London: Longman.Leech, G. (1992). Corpora and theories of linguistic performance. In J. Svartvik (Ed.), Directions in cor-
pus linguistics (pp. 105-122). Berlin, Germany: Mouton de Gruyter.Maslen, L. (2002). Coming up to date. Accountancy, 130 (1310), 113-115.Matlin, M., & Stang, D. (1978). The Pollyanna principle. Cambridge, MA: Schenkman.McEnery, T., & Wilson, A. (2001). Corpus linguistics: An introduction. Edinburgh, Scotland: Edinburgh
University Press.Miller, C. R. (1984). Genre as social action. Quarterly Journal of Speech, 70, 151-167.Palepu, K. G., Healy, P. M., & Bernard, V. L. (2004). Business analysis and valuation using financial
statements (3rd ed.). Mason, OH: South-Western.Rogers, P. S. (2000). CEO presentations in conjunction with earnings announcements: Extending the
construct of organisational genre through competing values profiling and user-needs analysis. Man-agement Communication Quarterly, 13 (3), 426-458.
Rutherford, B. A. (2002). The production of narrative accounting statements. Journal of AppliedAccounting Research, 6 (3), 25-56.
Rutherford, B. A. (2003). Obfuscation, textual complexity and the role of regulated narrative accountingdisclosure in corporate governance. Journal of Management and Governance, 7 (2), 187-210.
Rutherford / CORPORATE ANNUAL REPORT NARRATIVES 377
Simons, H. W. (1978). Genre-alising about rhetoric: A scientific approach. In K. K. Campbell & K. H.Jamieson (Eds.), Form and genre: Shaping rhetorical action (pp. 33-50). Falls Church, VA: SpeechCommunication Association.
Smith, M., & Taffler, R. J. (2000). The chairman’s statement: A content analysis of discretionary disclo-sures. Accounting, Auditing and Accountability Journal, 13 (5), 624-646.
Stanton, P., & Stanton, J. (2002). Corporate annual reports: Research perspectives used. Accounting,Auditing and Accountability Journal, 15 (4), 478-500.
Steering Group on the Financial Reporting of Risk. (1999). No surprises: The case for better risk report-ing. London: Institute of Chartered Accountants in England and Wales.
Stenström, A. (1991). Expletives in the London-Lund corpus. In K. Aijmer & B. Altenberg (Eds.), Eng-lish corpus linguistics (pp. 239-253). London: Longman.
Subramanian, R., Insley, R. G., & Blackwell, R. D. (1993). Performance and readability: A comparisonof annual reports of profitable and unprofitable corporations. Journal of Business Communication,30(1), 49-61.
Swales, J. M. (1990). Genre analysis: English in academic and research settings. Cambridge, UK: Cam-bridge University Press.
Sydserff, R., & Weetman, P. (2002). Developments in content analysis: A transitivity index and dictionscores. Accounting, Auditing and Accountability Journal, 15(4), 523-545.
Tennyson, B. M., Ingram, R. W., & Dugan, M. T. (1990). Assessing the information content of narrativedisclosures in explaining bankruptcy. Journal of Business Finance and Accounting, 17 (3), 391-410.
Thomas, J. (1997). Discourse in the marketplace: The making of meaning in annual reports. Journal ofBusiness Communication, 34 (1), 44-66.
U.S. Securities and Exchange Commission. (2002, January 22). Commission statement about manage-ment’s discussion and analysis of financial condition and results of operations (33-8056, 34-45321and FR-61). Washington, DC: Securities and Exchange Commission.
Watts, R. L., & Zimmerman, J. L. (1978). Towards a positive theory of the determination of accountingstandards. Accounting Review, 53 (1), 112-134.
Weber, R. P. (1990). Basic content analysis (2nd ed.). London: Sage.Wilson, A., Davies, M., Curtis, M., & Wilkinson-Riddle, G. (2001). UK and international GAAP. Lon-
don: Tolley.Yates, J., & Orlikowski, W. J. (1992). Genres of organisational communication: A structurational
approach to studying communicationand media. Academy of Management Review, 17 (2), 299-326.
378 JOURNAL OF BUSINESS COMMUNICATION