Arterials and Streets - CMAP
47
Arterials and Streets Infrastructure and Operations for Mobility, Access, and Community In Metropolitan Chicago Part I: Pavement and Part II: Access Management January, 2009 CMAP Congestion Management Process Author: Tom Murtha
Transcript of Arterials and Streets - CMAP

Arterials and Streets Infrastructure and Operations for Mobility, Access, and Community In Metropolitan Chicago
Part I: Pavement and Part II: Access Management January, 2009 CMAP Congestion Management Process Author: Tom Murtha

i
Table of Contents
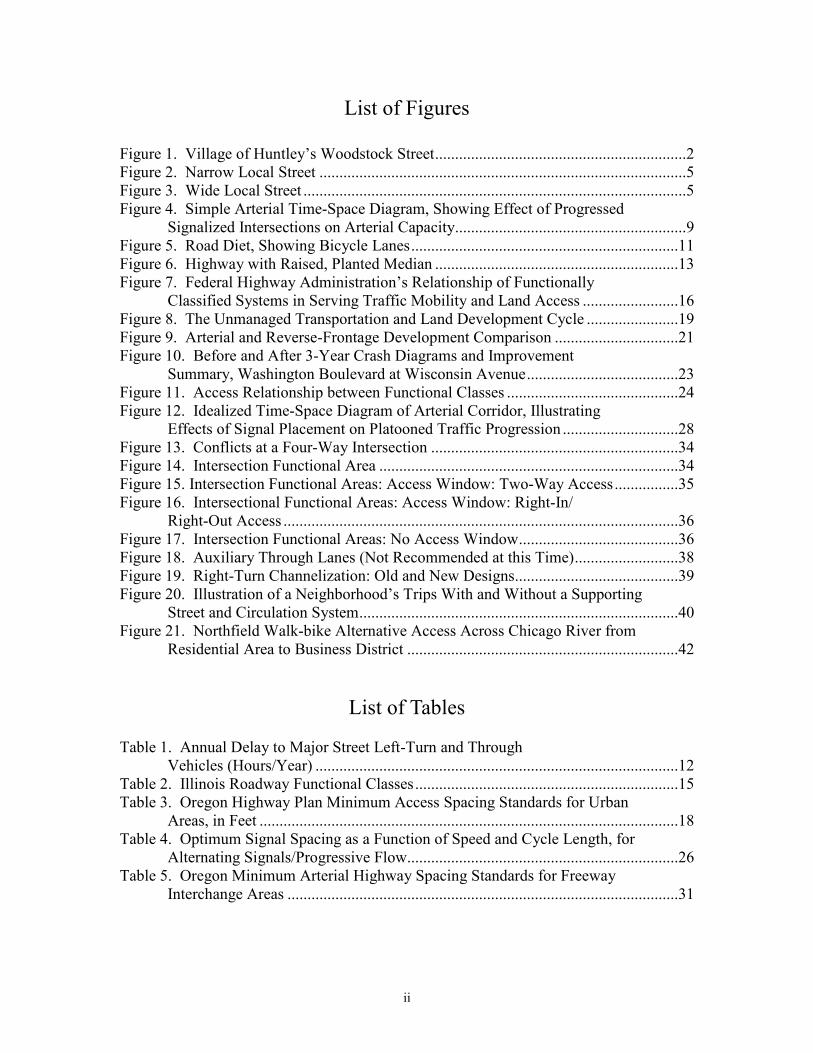
List of Figures ..................................................................................................................... ii
List of Tables ...................................................................................................................... ii
Part I. Pavements
Pavement Management, Preservation, and Life-Cycle Costs
Roadway and Lane Width
Number of Motor Vehicle Traffic Lanes
Median Treatments ..................................................................................................9
Continuous Two-Way Left-Turn Lanes.......................................................9
Road Diets......................................................................................10
Raised Medians..........................................................................................11
Business Access and Exposure ......................................................13
Part II. Access Management ..............................................................................................14
Principle 1: Provide a Specialized Roadway System ............................................15
Modern Functional Classification and Land Development .......................18
Principle 2: Limit Direct Access to Major Roadways ...........................................19
Driveway Access Management: Subdivision Control ...............................20
Reverse Frontage .......................................................................................20
Limiting Lower-Order Roadway Access to Major Roads .........................21
Principle 3: Promote Intersection Hierarchy..........................................................22
Principle 4: Locate Signals to Favor Through Movements ...................................25
Illustration of the Impact of Signal Location on Platoon Progression.......27
Principle 5: Preserve the Functional Areas of Intersections and Interchanges......29
Principles 6: Limit the Number of Conflict Points & 7: Separate Conflict Areas.33
Managing Access in Intersection Functional Areas...................................34
Principle 8: Remove Turning Vehicles from Through-Traffic Lanes ...................37
Auxiliary Through Lanes...........................................................................38
Right-Turn Channelization/Turning Roadways.........................................38
Principle 9: Use Non-Traversable Medians to Manage Left-Turn Movements ....39
Principle 10: Provide a Supporting Street and Circulation System .......................40
Access Management Bottom Line: The Benefits ..................................................42
Access Management Bottom Line: The Regional Role.........................................43
ii
List of Figures
Figure 1. Village of Huntley’s Woodstock Street...............................................................2
Figure 2. Narrow Local Street ............................................................................................5
Figure 3. Wide Local Street ................................................................................................5
Figure 4. Simple Arterial Time-Space Diagram, Showing Effect of Progressed
Signalized Intersections on Arterial Capacity..........................................................9
Figure 5. Road Diet, Showing Bicycle Lanes...................................................................11
Figure 6. Highway with Raised, Planted Median .............................................................13
Figure 7. Federal Highway Administration’s Relationship of Functionally
Classified Systems in Serving Traffic Mobility and Land Access ........................16
Figure 8. The Unmanaged Transportation and Land Development Cycle .......................19
Figure 9. Arterial and Reverse-Frontage Development Comparison ...............................21
Figure 10. Before and After 3-Year Crash Diagrams and Improvement
Summary, Washington Boulevard at Wisconsin Avenue......................................23
Figure 11. Access Relationship between Functional Classes ...........................................24
Figure 12. Idealized Time-Space Diagram of Arterial Corridor, Illustrating
Effects of Signal Placement on Platooned Traffic Progression .............................28
Figure 13. Conflicts at a Four-Way Intersection ..............................................................34
Figure 14. Intersection Functional Area ...........................................................................34
Figure 15. Intersection Functional Areas: Access Window: Two-Way Access................35
Figure 16. Intersectional Functional Areas: Access Window: Right-In/
Right-Out Access ...................................................................................................36
Figure 17. Intersection Functional Areas: No Access Window........................................36
Figure 18. Auxiliary Through Lanes (Not Recommended at this Time)..........................38
Figure 19. Right-Turn Channelization: Old and New Designs.........................................39
Figure 20. Illustration of a Neighborhood’s Trips With and Without a Supporting
Street and Circulation System................................................................................40
Figure 21. Northfield Walk-bike Alternative Access Across Chicago River from
Residential Area to Business District ....................................................................42
List of Tables
Table 1. Annual Delay to Major Street Left-Turn and Through
Vehicles (Hours/Year) ...........................................................................................12
Table 2. Illinois Roadway Functional Classes..................................................................15
Table 3. Oregon Highway Plan Minimum Access Spacing Standards for Urban
Areas, in Feet .........................................................................................................18
Table 4. Optimum Signal Spacing as a Function of Speed and Cycle Length, for
Alternating Signals/Progressive Flow....................................................................26
Table 5. Oregon Minimum Arterial Highway Spacing Standards for Freeway
Interchange Areas ..................................................................................................31

1
Arterials and Streets
Infrastructure and Operations
This paper analyzes potential strategies that may be deployed in northeastern Illinois on
our arterial highway system. The purposes of the each strategy may vary, but the overall
goal of such strategies would be to reduce vehicle delay, reduce crashes, facilitate
economic development, improve reliability, and improve walkability and bikeability.
Physical and operational improvements to the arterial system can improve capacity,
improve travel time reliability and reduce crashes. These strategies may require large
capital outlay to facilitate, and may require a higher on-going commitment to supporting
a cadre of qualified professionals to operate the facility.
For highways, the biggest investments are typically in pavement, structures, and
drainage. However, good physical infrastructure is not sufficient to achieve our regional
vision. Access management, “complete street” elements, technologies, and intersection
operations will also be considered. Pavements and access management will be
considered first, in this document. Successive documents will consider complete streets,
technologies, and intersection operations. Drainage and structures are not a central theme
of these papers, but will be considered as part of other discussions.
Part I. Pavements Pavement designs are specific to the expected use and design life of a facility. Pavement
structures begin with a gravel base resting on a native subgrade, fully cleared and
grubbed. Substantial excavation is usually required, both for the pavement itself and
associated drainage structures. Some subgrades (e.g., clay soils) require stabilization of
the subgrade with Portland cement and/or a thick gravel base.
Asphalt concrete, often called simply “asphalt,” is comprised of a binder and aggregate.
About 95% of roads in the United States are paved with asphalt.1 Asphalt is usually
installed in multiple layers. A thin, smooth asphalt surface is placed on top of a coarse
asphalt base. Applying recent, better understanding of the chemistry of asphalt binders,
which provide the waterproof cohesion of asphalt pavements, has provided a more
durable, cleaner construction input.2 Hot asphalt concrete pavement surfacings are
expected to last 15-20 years, with an excellent ride quality, suitable for high-volume,
high-speed roads.3 A disadvantage of asphalt pavements is that the asphalt binder is a
petroleum derivative, increasingly requiring specified, high-grade, imported petroleum.
1Anderson, Youtcheff, and Zupanic: “Asphalt Binders.” In Transportation in the New Millenium.
Transportation Research Board. http://onlinepubs.trb.org/Onlinepubs/millennium/00006.pdf Accessed
July, 2008. 2 Ibid. 3 Federal Highway Administration, Central Federal Lands Highway Division. “Roadway Surfacing Options
Photo Album.” Companion Document to Context Sensitive Roadway Surfacing Selection Guide. August,
2005. p. 37. Posted at http://www.pavementpreservation.org/toolbox/links/roadway-surfacing-photos.pdf

2
Portland cement concrete pavements, referred to as “concrete,” are composed of Portland
cement, course aggregate, sand, and water. Chemicals are added to the concrete mix to
control the setting and hardening processes and to improve workability and performance.
Concrete is reinforced with treated steel bars.4 Portland cement concrete surfacings are
strong, durable, and have a long life (30-40 years). Portland cement concrete is suitable
for high-volume, high-speed roads. However, concrete has a high initial cost.5
Other pavements are used on low-volume, low-speed roads. The region’s rural roads
may include aggregates with slurry seals or chip seals. Also, some suburban
communities are maintaining or are returning to brick pavements. For example, Huntley
maintains Woodstock Street as a brick pavement (see Figure 1). Wilmette maintains a
number of brick streets; additional asphalt-surfaced streets have a brick base.6 In
addition, Oak Park has recently installed a new brick street in the village’s downtown
after many years of primarily asphalt infrastructure, and is converting existing asphalt
streets to brick.7 In Europe, “silent bricks” with a fine texture and porous top layer have
been evaluated.8 For brick pavements, typical forecast AADT is less than 500, with
speeds less than 37 mph.9 Other pavements include natural stone (AADT < 200, speed <
15 mph); porous unit pavers (AADT < 200, speed < 20 mph, with high maintenance
requirements); and standard unit pavers (speeds < 50 mph).10
Figure 1. Village of Huntley’s Woodstock Street.
Photo: Dan Burden, Glatting Jackson/Walkable Communities
4 Portland Cement Association. “Cement and Concrete Basics.”
http://www.cement.org/basics/concretebasics_concretebasics.asp. Accessed July, 2008. 5 Federal Highway Administration, Central Federal Lands Highway Division. Op. cit., p. 55 6 Village of Wilmette. “Brick Street Atlas.”
http://www.wilmette.com/construction/2005/BrickLocations.pdf. Accessed July, 2008. 7 Village of Oakr ParkPlanning Marion Street. 8 Dutch Innovation Program on Noise Mitigation. “Pavement Noise Translator.”
http://www.noiseinnovationprogramme.eu/data/files/algemeen/RAP-05.000188.pdf Accessed July 2008. 9 Federal Highway Administration, Central Federal Lands Highway Division. Op. cit., p. 95. 10 Ibid., p. 98 ff.

3
Pavement Management, Preservation, and Life-Cycle Costs Good pavement design and pavement management both reduce long-term pavement
costs. Most large agencies and many small agencies have implemented pavement
management systems, a form of asset management, to facilitate better pavement
conditions within constrained maintenance budgets. A sophisticated pavement
management system consists of regular highway condition data collection, a database of
collected information, and analytic capabilities. Analytic capabilities would include
abilities to predict pavement life given likely loads, climate, and other factors; annual
repair costs; and performance. These predictions involve feedback of historic data into
the analyses.11
Pavement management systems have often been implemented on an agency basis. For
example, the Illinois Department of Transportation maintains an extensive, well-
developed pavement management system.12 Alternatively, as in the San Francisco Bay
area, pavement management has been approached from a regional perspective, including
the participation of almost all counties and municipalities.13 The system was put in place
to encourage good management after a 1981 study demonstrated that Bay-area
communities were spending only 60% of the funds necessary to properly maintain
pavements.14 Participation in a pavement management program became a prerequisite
for state or federal funding under California law, with participation required by 1990.15
Pavement management research has shown that good design practices for construction
projects have not been enough to assure good resource allocation, because maintenance
budgets were focused on repairing streets in the worst condition. However, pavement
management research showed that careful planning of maintenance could preserve
pavements, preventing them from falling into poor condition and requiring much more
expensive rehabilitation or reconstruction. As FHWA notes,
Successive years of collecting pavement condition data showed that it was far more
economical to preserve roads than to delay repairs and reconstruct roads. The studies
further showed that as traffic levels increase the costs of delaying repair work increased
greatly. This suggested that the traditional practice of repairing the worst roads first is,
in fact, a very expensive way to operate a highway system.16
Preventive maintenance applies pavement treatments over the life of a pavement to
maintain good condition, extend life, and minimize life-cycle costs. Examples of
11 Federal Highway Administration. Pavement Management Primer. P. 1.
http://www.fhwa.dot.gov/infrastructure/asstmgmt/pmprimer.pdf 12 Bham, Gharaibeh, Darter, Heckel, and Hall. “Illinois’s Experience with Pavement Analysis and
Management Systems.” Transportation Research Board Paper 01-2970.
http://www.mrutc.org/about/00486.pdf 13 http://www.mtcpms.org/index.html. Accessed September, 2008.
14 Metropolitan Transportation Commission. “About PMP.” http://www.mtcpms.org/aboutus/index.html
Accessed September, 2008. 15 Metropolitan Transportation Commission. “Pavement Management Certification Listing.”
http://www.mtcpms.org/ptap/cert.html Accessed September, 2008. 16 Metropolitan Transportation Commission. “Regional Streets and Roads Program.”,
http://www.mtcpms.org/index.html. p. 2

4
treatments for concrete include full-depth concrete repairs, joint sealing, crack sealing,
pavement restoration, and spall repair. Asphalt pavement treatments include milling and
overlays, crack treatments and filling. Recommendations as to the proper time, proper
treatment, and application procedures for a given pavement and pavement condition have
been developed and are available.17 18
Design considerations are important in reducing life-cycle pavement costs. Standard
design procedures consider pavement maintenance needs.19 Several recent projects,
including the I-290 and Dan Ryan Reconstruction Projects, have employed extended-life
pavement experiments, increasing pavement depth to extend the service life of the
pavement.20 For I-290, IDOT stated that the goal of the project’s pavement design was to
“build a highway that will last at least 40 years before major repairs are needed; that is,
double the current 20-year standard.”21
Roadway and Lane Width For urban, low-volume local roads (20-year projected average daily traffic less than 400),
adopted national standards for total roadway width have been set at 20 to 28 feet for
settings with less than two dwelling units per acre. For low-volume roads in areas with
densities of 2.1 to 6 dwelling units per acre, the standard for total roadway widths is 28-
34 feet.22 These standards are sufficient for safe operation, two-way traffic, deliveries,
emergency vehicles, and on-street parking consistent with residential uses; reduced
widths can be instituted where parking is prohibited.23 Adopting a narrow street
standard for local streets reduces long-term maintenance costs of unnecessary
pavement and reduce stormwater management expenses and impacts.
17 Peshkin, Hoerner, and Zimmerman. Optimal Timing of Pavement Preventive Maintenance Treatment
Applications. National Cooperative Highway Research Program Report 523. 2004.
http://onlinepubs.trb.org/Onlinepubs/nchrp/nchrp_rpt_523.pdf Accessed September, 2008. 18 Federal Highway Administration. Pavement Preservation Toolbox. 2006. Posted at
http://www.pavementpreservation.org/toolbox/start.html Accessed September, 2008. 19 Illinois Department of Transportation, Division of Highways. Bureau of Design and Environment
Manual. Chapter 54, Pavement Design. Posted at
http://www.dot.il.gov/desenv/BDE%20Manual/BDE/pdf/chap54.pdf Accessed September, 2008. 20 John Fortmann, Illinois Department of Transportation. “Interstate 90/94 Dan Ryan Expressway
Construction Project.” Presentation. Posted at
http://www.itre.ncsu.edu/ADC10/PDFs/2007_Summer_Conference/EnvAnalysisTour/Dan_Ryan_Express
way_Reconstruction.pdf P. 12 21 Illinois Department of Transportation. “Extended Life Pavement/Auxiliary Lanes.”
http://www.dot.state.il.us/i290/lanes.html. Accessed September, 2008. 22 American Association of State Highway and Transportation Officials (AASHTO). 2001. Guidelines for
Geometric Design of Very Low-Volume Local Roads (ADT <= 400). P. 20. 23 Ibid., p. 19.

5
Figure 2. Narrow Local Street
Photo by Dan Burden Glatting Jackson/Walkable Communities
Figure 3. Wide Local Street
Photo by Dan Burden Glatting Jackson/Walkable Communities
Many local communities in metropolitan Chicago still require 40’ local residential
streets.24 However, McHenry County has adopted a narrow street standard for
conservation design.25 Will County’s subdivision ordinance also allows narrower
24 For local streets, IDOT standards allow either following the ITE Recommended Practice Guidelines for
Residential Subdivision Street Design IDOT BLRS Geometric Design Criteria
(http://www.dot.il.gov/blr/manuals/Chapter%2032.pdf Figure 32-2H). Following the Geometric Design
Criteria can result in local road widths of up to 48 feet (for local roads with parking and shared with
bicycles – as local roads are). 25 McHenry County. McHenry County Subdivision Ordinance: Conservation Design Standards and
Procedures. Adopted February 19, 2008.

6
streets.26 Chicago Wilderness and the Northeastern Illinois Planning Commission
developed model subdivision ordinances for conservation design that include narrow
residential streets.27
Arterial and collector street widths require as much attention as local streets. For many
years, standard arterial lane widths were set at 12 feet, with “safety” being the reason
asserted for the minimum width. However, engineers have indentified many safety
benefits of reallocating space from 12’ lanes to other urban and suburban cross-section
needs. Harwood and Hauer note that these benefits include providing space for medians,
bicycle lanes, curb parking, sidewalks, pedestrian buffers, and clear zones.28.
A comprehensive review of safety data indicates that a nuanced approach to lane widths
is necessary. For rural roads, crash rates are higher for nine- and ten-foot-wide lanes than
for eleven- and twelve-foot-wide lanes. At less than 500 ADT, the accident modification
factor (AMF) for 9-foot travel lanes in rural areas is 1.05 (a multiple of the base case –
the base being 12-foot lanes). This AMF rises as rural ADT increases, so that the
estimated AMF above 2000 ADT is 1.50. The difference between eleven-foot-wide lanes
and twelve-foot-wide lanes in rural areas is not so great; even at higher ADT’s, the AMF
is 1.05.29
For urban roads, research is scarce about the relationship between lane width and crash
rates. However, a recent, rigorous study of crashes and lane widths by Potts, Harwood,
and Richard showed that, for roadway segments:
there was no indication that the use of 3.0 or 3.3m (10- or 11-ft lanes) rather than
3.6m (12-ft ) lanes for midblock segments led to increases in crash frequency.
There are situations in which use of narrower lanes may provide both benefits in
traffic operations, pedestrian safety, or reduced interference with surrounding
development and space for geometric features that enhance safety, such as
medians or turn lanes. The analysis results indicated that narrow lanes can
generally be used to obtain these results without compromising safety.30
The authors recommended caution in using lane widths of 10 feet or less on four-lane
undivided arterial segments, or nine-foot or less on four-lane divided arterial segments.
Additionally, they recommended caution in using lane widths of less than 12 feet where
26 Will County Subdivision Engineering. Subdivision Ordinance. Amended July 18, 2002.
http://www.willcountylanduse.com/SubEng/SubEngDocs/subdivision_ord.pdf 27 Chicago Wilderness and Northeastern Illinois Planning Commission. Conservation Design Resource
Manual: Language and Guidelines for Updating Local Ordinances. 2003.
http://www.chicagowilderness.org/pubprod/miscpdf/CD_Resource_Manual.pdf Accessed September,
2008. 28 Harwood and Hauer, et al. Methodology to Predict the Safety Performance of Urban and Suburban
Arterials. National Cooperative Highway Research Program Project 17-26 Final Report. March, 2007.
Transportation Research Board, NCHRP Web-Only Document 129.
http://onlinepubs.trb.org/onlinepubs/nchrp/nchrp_w129p1&2.pdf 29 Ibid.
30 Potts, Harwood, and Richard. Relationship of Lane Width to Safety on Urban and Suburban Arterials.”
Transportation Research Record 2023. Washington: Transportation Research Board. 2007. p. 81.

7
there are substantial volumes of bicyclists not accommodated by wide outside lane,
bicycle lane, or paved shoulder.31
For intersection approaches, Potts, Harwood, and Richard found that, “with limited
exceptions, there was no consistent, statistically significant relationship between lane
width and safety for approaches to intersections on urban and suburban arterials.”32 The
authors caution the use of lanes of ten feet or less for four-leg, stop controlled
intersections, as well as the use of lanes less than twelve-feet-wide where substantial
numbers of bicyclists share the road with motor vehicles (unless alternative facilities are
provided).33
In cases where there are high bus and truck volumes, twelve-foot lanes may be supported
by a 1994 study of bus crashes by Zegeer et al.34 However, the 1988-1989 Illinois bus
crash data analyzed in the study showed that buses accounted for only 0.2% of all crashes
in the study period.35 In addition, 2006 Illinois data for truck crashes indicates that, while
more substantial in number, truck crashes are concentrated on state highways (including
interstate highways). Thus, truck crash concerns do not provide a sound basis for
widespread use of the twelve-foot lane standard on all roads, given the alternative
treatments’ safety benefits that are more clearly effective.36 Conditions, including truck
and bus volumes and crashes but also information about other modes, needs to be
carefully evaluated for each specific site.
The Institute of Transportation Engineers (ITE) has proposed a recommended practice for
lane widths as part of the Context Sensitive Solutions in Designing Major Urban
Thoroughfares for Walkable Communities.37 The proposal recognizes that, in urban and
suburban contexts, right-of-way is limited and should be allocated to accommodate all
roadway users at the site, rather than using a cookie-cutter approach. The proposed
practice recommends:38
• Consideration of 10-foot lanes for design speeds of 30 mph or less, and 11- 12-foot lanes at design speeds of 35-40mph;
• Design vehicle selection based on vehicle frequency.
• Balance design elements with available right-of-way;
• Consideration of adjacent element widths in selection of the width of an element (e.g., don’t place a narrow bike lane next to a narrow motor-vehicle lane). First
31 Ibid.
32 Ibid.
33 Ibid.
34 Zegeer et al. “Commercial Bus Accident Characteristics and Roadway Treatments.” Transportation
Research Record. No. 1467. 1994. 35 Ibid., p. 17.
36 2006 Illinois data for truck crashes show that tractor-trailers accounted for 16,064 crashes and 139
fatalities. Of these 16,064 tractor-trailer year-2006 crashes, 4,283 (26.7%) were on local roads and streets
in urban areas; 4,179 (26.0%) were on urban interstate highways; and 5,151 (32.1%) were on other urban
marked or unmarked state routes. The remaining crashes (2,451) were on rural highways and roads. Illinois Department of Transportation. Illinois Crash Facts, 2006. 2007. p. 39. 37 Institute of Transportation Engineers. Context Sensitive Solutions in Designing Major Urban
Thoroughfares for Walkable Communities. An ITE Proposed Recommended Practice. 2006. p120. 38 Ibid.

8
consider a wider bike lane; if a design vehicle or design speed justify, widen the
travel lane.
Currently, policies and procedures make lane widths less than 12’ a design exception,
requiring additional engineering justification. These policies should be reconsidered
to allow routine implementation of 11’ lanes and, for lower-speed situations, even 10’
lanes. Implementing such a routine procedure will facilitate more widespread
implementation of other life-saving cross-section elements (e.g., medians, sidewalks).
Number of Motor Vehicle Traffic Lanes The number of motor vehicle traffic lanes has traditionally been treated as an engineering
issue. To conserve resources, to reduce right-of-way costs, and to address community
needs, the number of lanes on an arterial or collector road will increasingly need to be
viewed as a planning issue.
Arterial traffic flows in urban areas are interrupted to accommodate conflicting flows.
Typically, traffic is controlled with stop signs and traffic signals. For arterials, operations
at fixed points, e.g. signal locations, are the primary capacity constraint. At standard-
operation highway traffic signals, through-traffic flows are only a fraction of overall
capacity, because of the need to accommodate left-turns and the other approaches of an
intersection. So a through movement may have a green signal only 40% of the time.
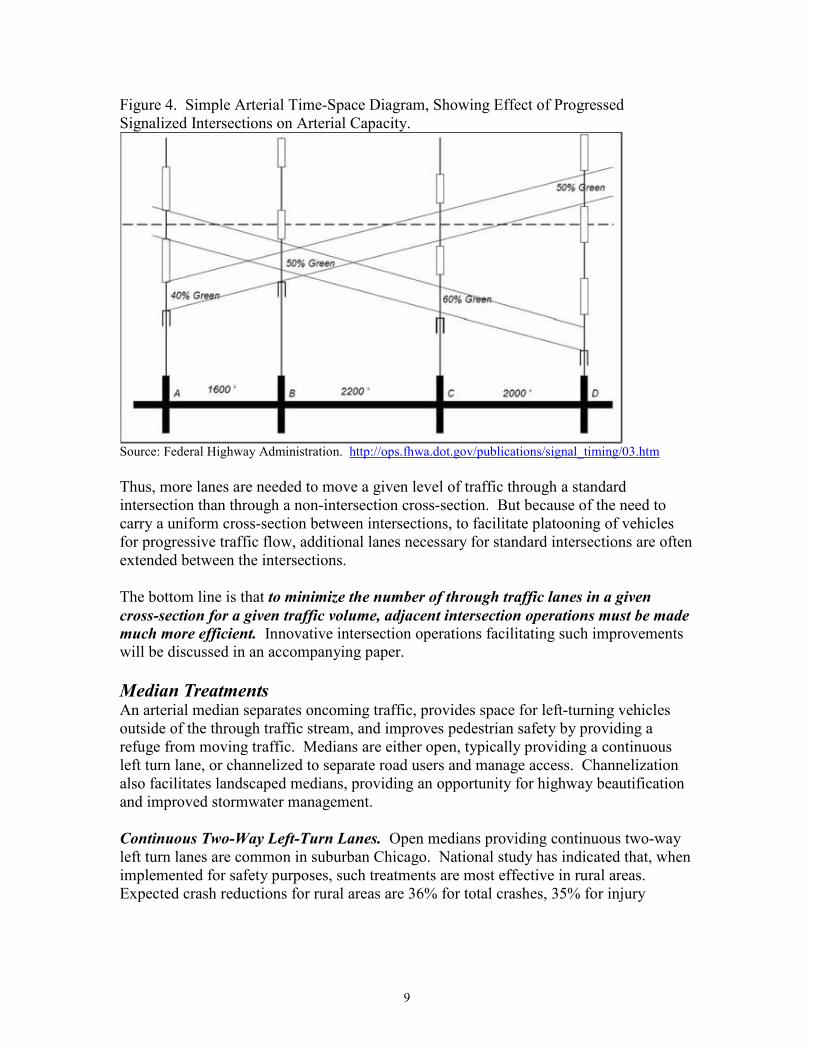
Furthermore, as illustrated in Figure 4, to facilitate progressive flows between signalized
intersections, the effective windows of time when through movements can proceed in
platoons may be limited to the minimum, or critical, value along a corridor.
Figure 4 shows the impact of signal operations on arterial traffic flow, in a space-time
diagram. Platooned vehicles can only progress through the signalized intersections
(A,B,C, and D) in a narrow band of time for each green cycle.
9
Figure 4. Simple Arterial Time-Space Diagram, Showing Effect of Progressed
Signalized Intersections on Arterial Capacity.
Source: Federal Highway Administration. http://ops.fhwa.dot.gov/publications/signal_timing/03.htm
Thus, more lanes are needed to move a given level of traffic through a standard
intersection than through a non-intersection cross-section. But because of the need to
carry a uniform cross-section between intersections, to facilitate platooning of vehicles
for progressive traffic flow, additional lanes necessary for standard intersections are often
extended between the intersections.
The bottom line is that to minimize the number of through traffic lanes in a given
cross-section for a given traffic volume, adjacent intersection operations must be made
much more efficient. Innovative intersection operations facilitating such improvements
will be discussed in an accompanying paper.
Median Treatments An arterial median separates oncoming traffic, provides space for left-turning vehicles
outside of the through traffic stream, and improves pedestrian safety by providing a
refuge from moving traffic. Medians are either open, typically providing a continuous
left turn lane, or channelized to separate road users and manage access. Channelization
also facilitates landscaped medians, providing an opportunity for highway beautification
and improved stormwater management.
Continuous Two-Way Left-Turn Lanes. Open medians providing continuous two-way
left turn lanes are common in suburban Chicago. National study has indicated that, when
implemented for safety purposes, such treatments are most effective in rural areas.
Expected crash reductions for rural areas are 36% for total crashes, 35% for injury

10
crashes, and 47% for rear-end crashes.39 More research is needed to evaluate safety
effects in urban areas; careful selection of applications is recommended.40
Sometimes two-way left turn lanes are an alternative to adding additional traffic lanes.
Though a three-lane cross section does not specifically address delays relating to signal
operations upstream or downstream, the three-lane cross section substantially reduces
delays from turning vehicles compared to a two-lane cross section, and is not
substantially different than a four-lane cross-section below 15,000 ADT.41 Still, above
8,000 ADT, four-lane cross-sections have lower delay than three-lane cross-sections.
The effectiveness of alternative cross-sections is also a function of the land use intensity
and driveways per mile.42
An example of a two-lane to three-lane conversion as an alternative to a four-lane cross-
section occurred in 1981 in Downers Grove. Downers Grove had proposed to add two
through traffic lanes to Fairview Avenue. The proposal was scaled back to only add a
continuous left turn lane. The three-lane alternative allowed for the retention of a
parkway and many street trees, and was a successful safety improvement appropriate for
the projected 16,000 AADT. In this case, crashes fell from 55 in a six-month period
before the improvement to 29 after the improvement, a reduction of 47% that came
despite higher volumes and higher crashes rates village-wide.43
Road Diets. In some cases, in a strategy called a “road diet,” communities are converting
four-lane cross-sections to three-lane cross-sections. Urban and suburban communities
may find this strategy attractive to reduce excessive vehicle speeds and speed variability
in existing four-lane cross sections with appropriate volumes. Road diet case study
analyses by Knapp et al showed that, for volumes of 8,400 up to 24,000 ADT, 85th
percentile speeds fell, typically less than 5 mph, but speeding more than five mph above
the posted limit sometimes fell dramatically.44 Studies of crash reduction effects of road
diets have given mixed results. While some studies have shown safety benefits of road
diets, the most statistically rigorous analysis to date has shown no discernible change in
the number of crashes.45,46 Experience of communities nationwide indicates that road
39 Persaud et al. Safety Evaluation of Installing Center Two-Way Left-Turn Lanes on Two-Lane Roads.
FHWA Report Number FHWA-HRT-08-042. December, 2007. 40 Ibid.
41 Hummer and Lewis. Operational Capacity of Three-Lane Cross Sections. Operational Capacity of
Three-Lane Cross-Sections. Center for Transportation Engineering Studies, Department of Civil
Engineering, North Carolina State University. April, 2000. [Available from National Technical
Information Service.] pp. 32-39. 42 Ibid.
43 John McCree, (Illinois Department of Transportation). “Two-Way Left Turn Lane.” Illinois Municipal
Review. July 1987. p.12. Posted at http://www.lib.niu.edu/1987/im870712.html. Accessed September,
2008. 44 Knapp, Giese, and Lee. “Urban Four-Lane Undivided to Three-Lane Roadway Conversion Guidelines.”
In Proceedings of the 2003 Mid-Continent Transportation Research Symposium. Ames: Iowa State
University. 2003. p. 2. Posted at http://www.ctre.iastate.edu/PUBS/midcon2003/KnappConversion.pdf.
Accessed September, 2008. In two cases, excessive speeding fell 60-70%. 45 Ibid.
46 Huang, Stewart, and Zegeer. “Evaluation of Lane Reduction ‘Road Diet’ Measures on Crashes and
Injuries.” Transportation Research Record 1784. Transportation Research Board, 2002.
11
diets can be applied comfortably to roadways up to 20,000 ADT; above this traffic
volume, communities have been more cautious.47 Overall, “road diet” evaluations should
consider the characteristics of each unique situation, including consideration of excessive
vehicle speeds, crashes, and non-motorized safety. Road diets can be expected to have
traffic calming effects, reducing excessive speeds, above 8,000 ADT.
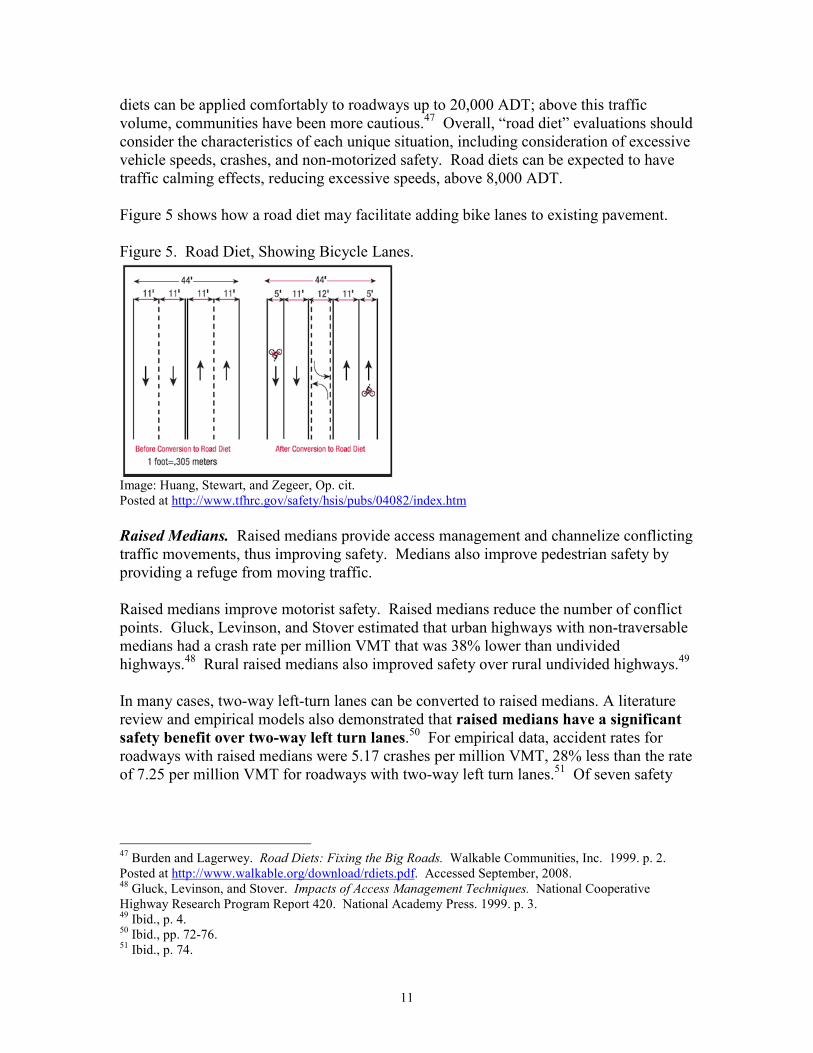
Figure 5 shows how a road diet may facilitate adding bike lanes to existing pavement.
Figure 5. Road Diet, Showing Bicycle Lanes.
Image: Huang, Stewart, and Zegeer, Op. cit.
Posted at http://www.tfhrc.gov/safety/hsis/pubs/04082/index.htm
Raised Medians. Raised medians provide access management and channelize conflicting
traffic movements, thus improving safety. Medians also improve pedestrian safety by
providing a refuge from moving traffic.
Raised medians improve motorist safety. Raised medians reduce the number of conflict
points. Gluck, Levinson, and Stover estimated that urban highways with non-traversable
medians had a crash rate per million VMT that was 38% lower than undivided
highways.48 Rural raised medians also improved safety over rural undivided highways.
49
In many cases, two-way left-turn lanes can be converted to raised medians. A literature
review and empirical models also demonstrated that raised medians have a significant
safety benefit over two-way left turn lanes.50 For empirical data, accident rates for
roadways with raised medians were 5.17 crashes per million VMT, 28% less than the rate
of 7.25 per million VMT for roadways with two-way left turn lanes.51 Of seven safety
47 Burden and Lagerwey. Road Diets: Fixing the Big Roads. Walkable Communities, Inc. 1999. p. 2.
Posted at http://www.walkable.org/download/rdiets.pdf. Accessed September, 2008. 48 Gluck, Levinson, and Stover. Impacts of Access Management Techniques. National Cooperative
Highway Research Program Report 420. National Academy Press. 1999. p. 3. 49 Ibid., p. 4.
50 Ibid., pp. 72-76.
51 Ibid., p. 74.

12
models using a variety of traffic levels, six also showed a substantially lower crash rates
for raised median roadways compared to two-way left-turn lanes.52
Raised medians provide significant reductions in delay compared to undivided highways.
Travel delay for raised medians is similar to that of two-way left turn lanes, though raised
medians may have somewhat higher delay than two-way left turn lanes for very-high-
volume roads. Detailed tables are presented in Tables 2-13 to 2-15 in NCHRP Report
39553. Table 1, below presents a sample of this information from NCHRP Report 410.
Table 1. Annual Delay to Major Street Left-Turn and Through Vehicles (Hours/Year)
Driveways/Mile Undivided Two-Way Left-
Turn Lane
Raised Median
ADT 22,500
30 2,200 1,300 1,300
60 2,200 1,400 1,400
90 2,200 1,400 1,400
ADT 32,500
30 7,100 3,000 3,100
60 7,800 3,200 3,500
90 8,000 3,200 3,400 Source: Reproduced from Gluck, Levinson, and Stover. NCHRP Report 410. Table 65. This example of
results from NCHRP Report 395 assumes 10% left turns per 1320-foot segment.
FHWA has also issued strong support for medians for pedestrian safety purposes:
Background:
Providing raised medians or pedestrian refuge areas at pedestrian crossings at marked
crosswalks has demonstrated a 46% reduction in pedestrian crashes. Installing such raised
channelization on approaches to multi-lane intersections has been shown to be particularly
effective. At unmarked crosswalk locations, medians have demonstrated a 39% reduction in
pedestrian crashes. Medians are especially important in areas where pedestrians access a transit
stop or other clear origin/destinations across from each other.
Guidance Statement/Application: Raised medians (or refuge areas) should be considered in curbed sections of multi-lane roadways
in urban and suburban areas, particularly in areas where there are mixtures of a significant
number of pedestrians, high volumes of traffic (more than 12,000 ADT) and intermediate or high
travel speeds. Medians/refuge islands should be at least 4 feet wide (preferably 8 feet wide for
accommodation of pedestrian comfort and safety) and of adequate length to allow the anticipated
number of pedestrians to stand and wait for gaps in traffic before crossing the second half of the
street.54
52 Ibid., pp 78-79
53 Bonneson and McCoy. Capacity and Operational Effects of Midblock Left-Turn Lanes. National
Cooperative Highway Research Program Report 395. National Academy Press. 1997. pp. 25-27. 54 Jeffrey Lindley, FHWA Associate Administrator for Safety. Guidance Memorandum on Consideration
and Implementation of Proven Safety Countermeasures. July 10, 2008. Posted at
http://safety.fhwa.dot.gov/policy/memo071008.htm
13
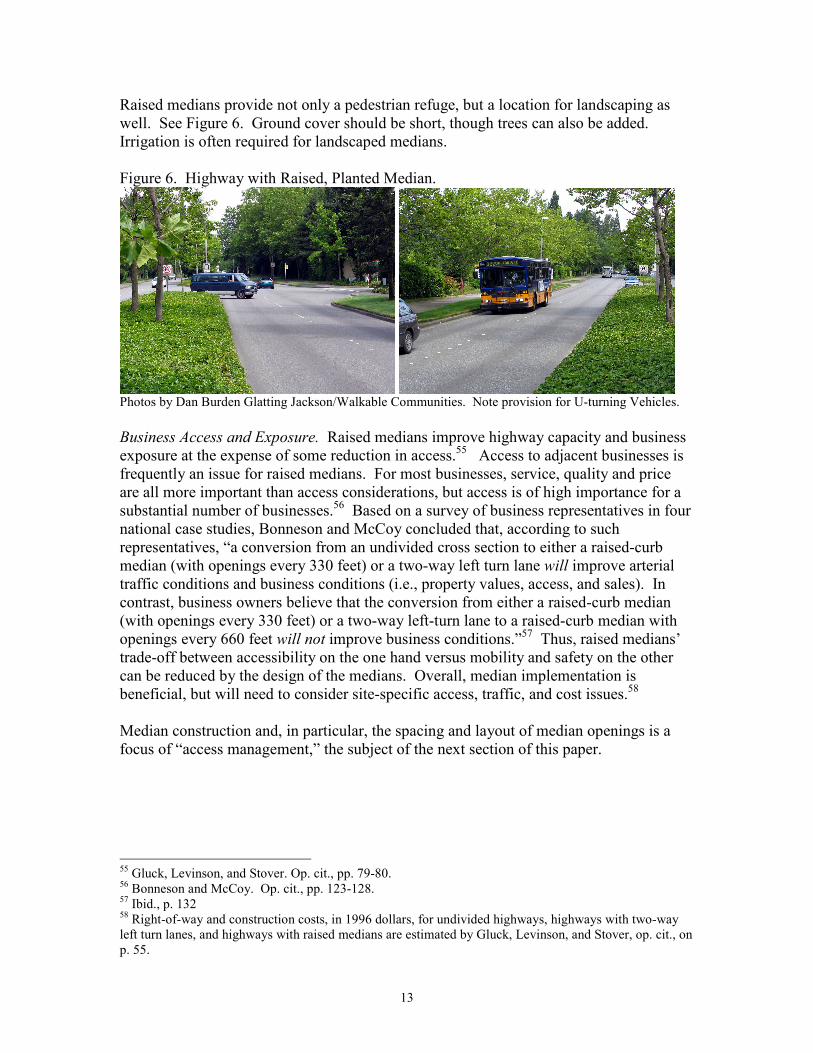
Raised medians provide not only a pedestrian refuge, but a location for landscaping as
well. See Figure 6. Ground cover should be short, though trees can also be added.
Irrigation is often required for landscaped medians.
Figure 6. Highway with Raised, Planted Median.
Photos by Dan Burden Glatting Jackson/Walkable Communities. Note provision for U-turning Vehicles.
Business Access and Exposure. Raised medians improve highway capacity and business
exposure at the expense of some reduction in access.55 Access to adjacent businesses is
frequently an issue for raised medians. For most businesses, service, quality and price
are all more important than access considerations, but access is of high importance for a
substantial number of businesses.56 Based on a survey of business representatives in four
national case studies, Bonneson and McCoy concluded that, according to such
representatives, “a conversion from an undivided cross section to either a raised-curb
median (with openings every 330 feet) or a two-way left turn lane will improve arterial
traffic conditions and business conditions (i.e., property values, access, and sales). In
contrast, business owners believe that the conversion from either a raised-curb median
(with openings every 330 feet) or a two-way left-turn lane to a raised-curb median with
openings every 660 feet will not improve business conditions.”57 Thus, raised medians’
trade-off between accessibility on the one hand versus mobility and safety on the other
can be reduced by the design of the medians. Overall, median implementation is
beneficial, but will need to consider site-specific access, traffic, and cost issues.58
Median construction and, in particular, the spacing and layout of median openings is a
focus of “access management,” the subject of the next section of this paper.
55 Gluck, Levinson, and Stover. Op. cit., pp. 79-80.
56 Bonneson and McCoy. Op. cit., pp. 123-128.
57 Ibid., p. 132
58 Right-of-way and construction costs, in 1996 dollars, for undivided highways, highways with two-way
left turn lanes, and highways with raised medians are estimated by Gluck, Levinson, and Stover, op. cit., on
p. 55.

14
Part II. Access Management The Transportation Research Board’s Access Management Manual defines access
management as “the systematic control of the location, spacing, design, and operation of
driveways, median openings, interchanges, and street connections to a roadway.”59
Access management manages parcel ingress and egress to improve arterial and collector
traffic flow. The challenge of access management is to assure mobility on arterial
highways while providing sufficient access to assure prosperous businesses in planned
commercial and mixed-use districts. Modern reliance on functional classification of
roadways to guide access management has not been sufficient to provide sufficient access
with regional mobility. New techniques and strategies are necessary to provide such
benefits.
Access management “limits and consolidates access along major roadways, while
promoting a supporting street system and unified access and circulation systems for
development.”60 Access management accomplishes this through implementation of the
following ten principles:
1. Provide a specialized roadway system. 2. Limit direct access to major roads. 3. Promote intersection hierarchy. 4. Locate signals to favor through movements. 5. Preserve the functional areas of intersections and interchanges. 6. Limit the number of conflict points. 7. Separate conflict areas. 8. Remove turning vehicles from through-traffic lanes. 9. Use nontraversable medians to manage left-turn movements. 10. Provide a supporting street and circulation system.61
Access management is implemented through the following governmental tools:
1. Policies, directives, and guidelines 2. Access management regulations 3. Acquisition of access rights 4. Land development regulations 5. Development review and impact assessment 6. Geometric design.62
A detailed program of how to implement access management is in the TRB’s Access
Management Manual. In this discussion of access management as a regional planning
strategy, we will review the principles of access management, discussing challenges
where appropriate. We will review particularly important elements applicable in a land
use-transportation planning context. Lastly, we will summarize the benefits of access
management.
59 Committee on Access Management. Access Management Manual. Transportation Research Board.
2003. p. 3 60 Ibid., p. 7.
61 Ibid., pp 8-9.
62 Ibid, pp. 7-8
15
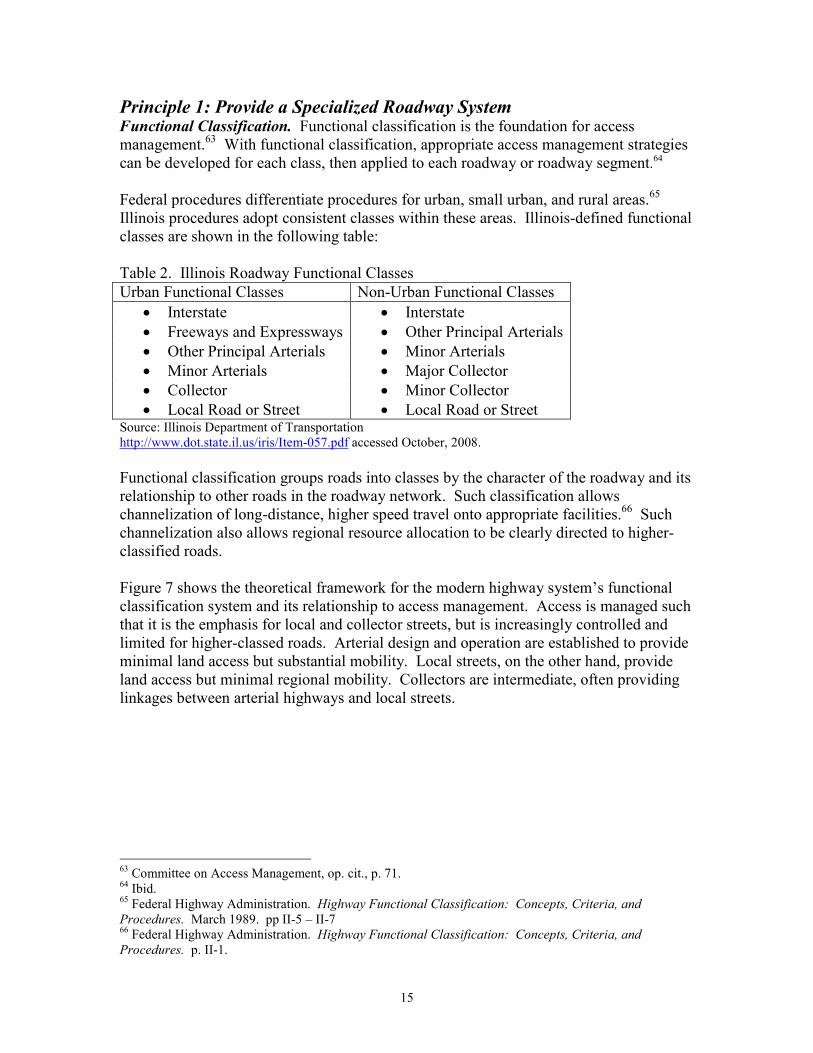
Principle 1: Provide a Specialized Roadway System Functional Classification. Functional classification is the foundation for access
management.63 With functional classification, appropriate access management strategies
can be developed for each class, then applied to each roadway or roadway segment.64
Federal procedures differentiate procedures for urban, small urban, and rural areas.65
Illinois procedures adopt consistent classes within these areas. Illinois-defined functional
classes are shown in the following table:
Table 2. Illinois Roadway Functional Classes
Urban Functional Classes Non-Urban Functional Classes
• Interstate • Interstate
• Freeways and Expressways • Other Principal Arterials
• Other Principal Arterials • Minor Arterials
• Minor Arterials • Major Collector
• Collector • Minor Collector
• Local Road or Street • Local Road or Street Source: Illinois Department of Transportation
http://www.dot.state.il.us/iris/Item-057.pdf accessed October, 2008.
Functional classification groups roads into classes by the character of the roadway and its
relationship to other roads in the roadway network. Such classification allows
channelization of long-distance, higher speed travel onto appropriate facilities.66 Such
channelization also allows regional resource allocation to be clearly directed to higher-
classified roads.
Figure 7 shows the theoretical framework for the modern highway system’s functional
classification system and its relationship to access management. Access is managed such
that it is the emphasis for local and collector streets, but is increasingly controlled and
limited for higher-classed roads. Arterial design and operation are established to provide
minimal land access but substantial mobility. Local streets, on the other hand, provide
land access but minimal regional mobility. Collectors are intermediate, often providing
linkages between arterial highways and local streets.
63 Committee on Access Management, op. cit., p. 71.
64 Ibid.
65 Federal Highway Administration. Highway Functional Classification: Concepts, Criteria, and
Procedures. March 1989. pp II-5 – II-7 66 Federal Highway Administration. Highway Functional Classification: Concepts, Criteria, and
Procedures. p. II-1.

16
Figure 7. Federal Highway Administration’s Relationship of Functionally Classified
Systems in Serving Traffic Mobility and Land Access.
Source: FHWA Functional Classification Guidelines. http://www.fhwa.dot.gov/planning/fcsec2_1.htm
Access Classification. In establishing classifications that are useful for access purposes,
the following should be considered:
• Level of importance of roadways within the jurisdiction;
• Characteristics of system roadways;
• Land use and growth management goals;
• Current and potential future presence of pedestrians, bicycles, and transit.67
Federally- and state-defined functional classes may or may not adequately address the
factors listed above. Thus, a separate access classification for arterial and collector
roadways is strongly recommended. The Access Management Manual notes that
“during the development of transportation plans, the basic roadway functional
classifications are modified and expanded for planning purposes. Access categories
should be internally consistent with agency transportation plans.”68 These classifications
typically include the “degree of urbanization, presence or absence of a median, and
speed. Factors used to differentiate the degree of urbanization include development
intensity, traffic volume, intersection frequency, and speed conditions.”69
Addressing urbanization in an access classification scheme allows access management to
directly address central business district issues appropriately. Subcategories are
suggested for central business districts and main street environments. Here, signal
operations for closely spaced intersections, on-street parking, transit, and pedestrian
needs are integral elements of a traffic environment that is necessarily low-speed. Full
consideration of the needs of such areas facilitates maintaining consistent policies for
other areas.70
67 Committee on Access Management, p. 72.
68 Ibid.
69 Ibid.
70 Ibid., pp 73-74.
17
An example of such a detailed access classification scheme has been developed in
Oregon. There, as part of the Oregon Highway Plan, “special transportation areas,”
“urban business areas,” and “commercial centers” have been designated along the
highway system state-wide, consistent with the Plan’s Land Use and Transportation
Policy.71 These areas are defined as follows:
• Special Transportation Areas (STAs) are designated districts of “compact
development located on a state highway within an urban growth boundary in
which the need for appropriate local access outweighs the considerations of
highway.”72 A limited number of designated freight routes are excepted, and
always have a mobility emphasis.73
• Urban Business Areas (UBAs) are those areas where auto-oriented development
exists, but where the Oregon Highway Plan seeks to “encourage redevelopment
and reinvestment in urban areas” and to shift urbanized land use to reduced auto-
dependence. Urban Business Area designation and applicable regulation is
automatic where the highway is already a low-speed urban road (speed limits of
35 mph or less). For roads with speed limits higher than 35 mph, road segments
may be designated UBAs with ODOT and local jurisdiction approval of a
management plan. Thus, the impact is to concentrate urban development and
urban transportation in areas where highway speeds are already low or where
there is a plan to manage land use, mobility, and access together.74
• Commercial Centers are large, regional centers, with 400,000 square feet or more
of leasable space, with limited access to the Oregon state highway system. For
such centers, walking, bicycling, and transit are accommodated. Through traffic
mobility is maintained, but lower standards may be agreed to through a
management plan.75
For each of the categories above, land use planning guidance is adopted through the
Oregon Highway Plan, and become enforceable through the process for designating the
areas and through associated management plans.76
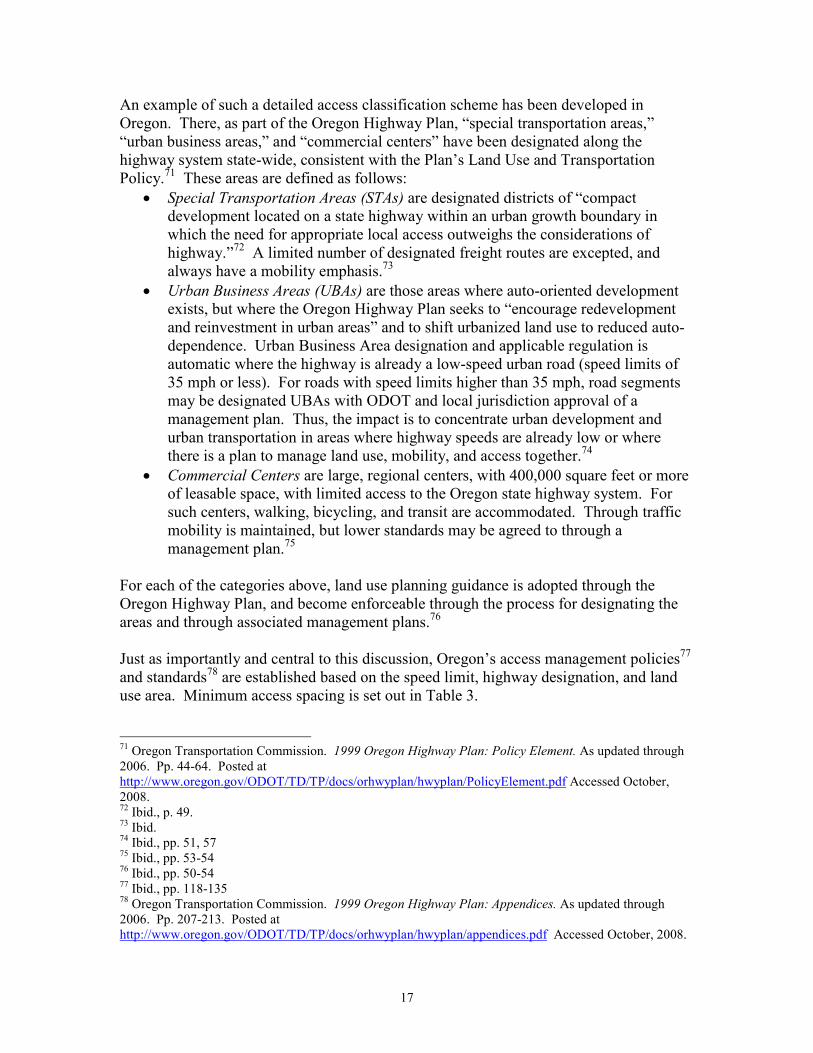
Just as importantly and central to this discussion, Oregon’s access management policies77
and standards78 are established based on the speed limit, highway designation, and land
use area. Minimum access spacing is set out in Table 3.
71 Oregon Transportation Commission. 1999 Oregon Highway Plan: Policy Element. As updated through
2006. Pp. 44-64. Posted at
http://www.oregon.gov/ODOT/TD/TP/docs/orhwyplan/hwyplan/PolicyElement.pdf Accessed October,
2008. 72 Ibid., p. 49.
73 Ibid.
74 Ibid., pp. 51, 57
75 Ibid., pp. 53-54
76 Ibid., pp. 50-54
77 Ibid., pp. 118-135
78 Oregon Transportation Commission. 1999 Oregon Highway Plan: Appendices. As updated through
2006. Pp. 207-213. Posted at
http://www.oregon.gov/ODOT/TD/TP/docs/orhwyplan/hwyplan/appendices.pdf Accessed October, 2008.
18
Table 3. Oregon Highway Plan Minimum Access Spacing Standards for Urban Areas,
in Feet
Posted Speed (mph):
Highway Designation: ≤ 25 30 and
35
40 and
45
50 ≥ 55
Urban Expressway (Controlled Access
Arterial) At-Grade Intersections
and Commercial Centers
- - 2640 2640 2640
Statewide Highways 520 720 990 1100 1320
Regional Highways 350 425 750 830 990
Urban
(See Note 1)
District Highways 350 350 500 550 700
Special Transportation Area See
Note 2
See
Note 2
- - -
Source: Oregon Transportation Commission. 1999 Oregon Highway Plan: Policy Element. Pp. 44-64.
http://www.oregon.gov/ODOT/TD/TP/docs/orhwyplan/hwyplan/PolicyElement.pdf. Accessed October,
2008.
Note 1: “The Urban standard applies in UBAs unless a management plan agreed to by ODOT
and the local government(s) establishes a different standard. Spacing standards on access
controlled facilities are also guided by those controls.”
Note 2: “Minimum access management spacing for public road approaches is the existing city
block spacing or the city block spacing as identified in the local comprehensive plan. Public road
connections are preferred over private driveways and in STAs driveways are discouraged.
However, where driveways are allowed and where land use patterns permit, the minimum access
management spacing for driveways is 175 feet (55 meters) or mid-block if the current city block
is less than 350 feet (110 meters).”
A highway access classification system such as Oregon’s, based not only on
transportation but land use, facilitates the achievement of land use goals while
simultaneously providing a more consistent, enforceable, and effective access
management standard.
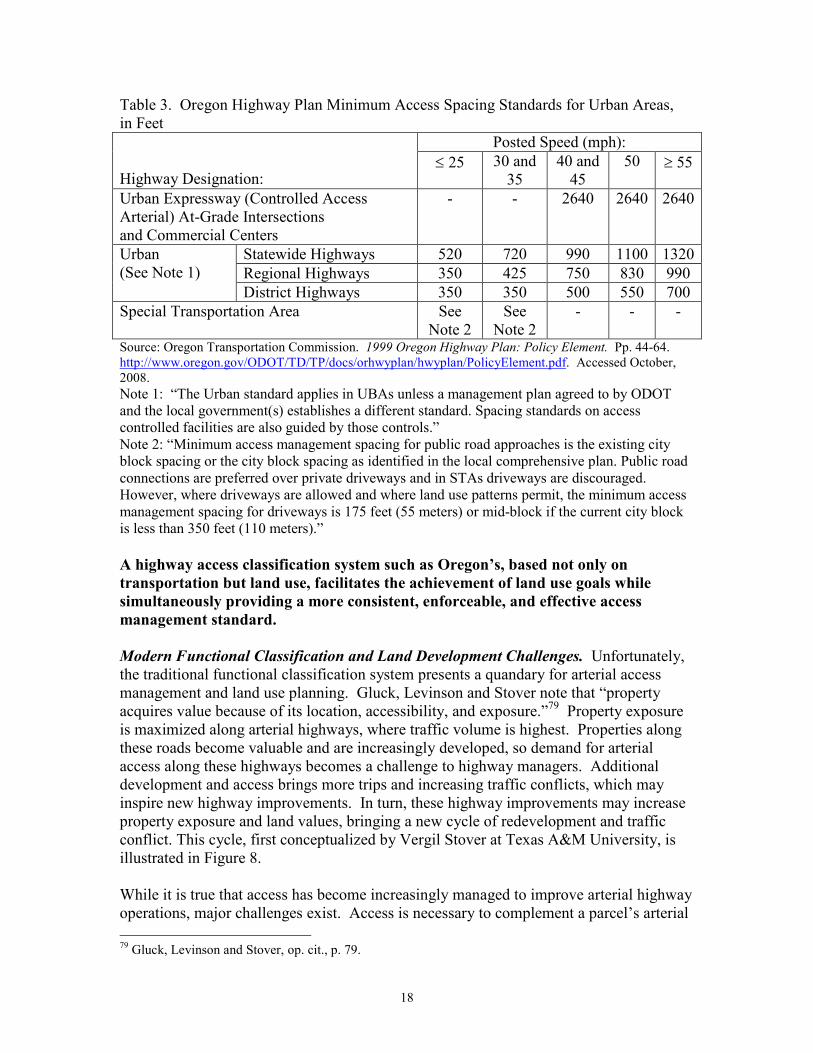
Modern Functional Classification and Land Development Challenges. Unfortunately,
the traditional functional classification system presents a quandary for arterial access
management and land use planning. Gluck, Levinson and Stover note that “property
acquires value because of its location, accessibility, and exposure.”79 Property exposure
is maximized along arterial highways, where traffic volume is highest. Properties along
these roads become valuable and are increasingly developed, so demand for arterial
access along these highways becomes a challenge to highway managers. Additional
development and access brings more trips and increasing traffic conflicts, which may
inspire new highway improvements. In turn, these highway improvements may increase
property exposure and land values, bringing a new cycle of redevelopment and traffic
conflict. This cycle, first conceptualized by Vergil Stover at Texas A&M University, is
illustrated in Figure 8.
While it is true that access has become increasingly managed to improve arterial highway
operations, major challenges exist. Access is necessary to complement a parcel’s arterial
79 Gluck, Levinson and Stover, op. cit., p. 79.
19
traffic exposure, and access to a parcel is still often uniquely from an arterial highway. In
addition, local officials sometimes intervene on the behalf of developers to overrule
established access permit regulations, further sacrificing safety and increasing traffic
delay.80
Figure 8. The Unmanaged Transportation and Land Development Cycle
Source: Adapted from Stover and Koepke, Transportation and Land Development. Institute of
Transportation Engineers. First Edition. 1988. p. 2.
Current arterial access management practices have not been sufficient to assure good
arterial level of service because of the over-reliance on the arterial system for such
access. That is, land is too often platted so that even local trips require arterial highway
travel to access local businesses and other institutions. Thus, management of the arterial
alone is not sufficient to improve safety and mobility – interconnected land development
is critical to making arterial access management work.
Principle 2: Limit Direct Access to Major Roadways Access control preserves the mobility functions for higher-classified roads. Reducing
access points also improves safety substantially.81 There are many techniques to limit
access and several benefits of doing so.
80 Author’s discussions with highway operations and planning staffs.
81 Committee on Access Management. Access Management Manual. Op. cit. pp. 16-17.
Arterial
Improvements
Increased
Accessibility
Increased
Land Value
Land Use
Change
Increased
Traffic
Generation
Increased
Traffic
Conflict
Deterioration in
Level of Service

20
Driveway Access Management Techniques: Subdivision Control. The character of
access control is a function of how land has been subdivided. Highway agency
involvement in subdivision processes would facilitate improved access management.
Coordinated review should not wait for a site plan and development proposal, but should
take place at the time of subdivision to assure adequate access management. For
example, both Wisconsin82 and Michigan
83 require state review of subdivision activity on
state highways and, in Michigan’s case, roads connecting to state highways.
Subdivision and land development strategies to reduce the number of driveways include
the following:
• Increase minimum lot frontage and setback requirements along major roadways.
• Regulate access to outparcels for large land developments.
• Provide an incentive for combining access points or relax parking and dimensional requirements where necessary to achieve shared access.
84
• Optimize driveway location and access design in the development review process.
• Prohibit flag lots.
• Develop access overlay ordinances for high-priority corridors.85
• Develop a connected local road network of side streets and parallel roads to accommodate desired land development along major thoroughfares.
86
Reverse Frontage. In suburban sites, reverse frontage is a widespread strategy to provide
access for residential lots abutting arterial roads not from the arterial road, but from
interior local streets. Increasingly, this is also applying to commercial and industrial
developments.
For reverse frontage development, driveways are eliminated on arterial streets, reducing
crashes and delay. To accomplish this, through lots or corner lots are platted with direct
driveway access on the arterial highway denied in the land record process, a deed
restriction carried with the property from owner to owner.87
While in the past reverse frontage developments have been suburban in character, such
developments can also be high-density, urban developments. The notes to Table 3,
above, show that in Oregon, driveways are avoided in urban “special transportation
areas.” For such developments, the buildings front directly on arterial streets, but parking
and freight loading is in the rear. An illustration of how such development would differ
from the current arterial-oriented driveway practice is shown in Figure 9.
82 Wis. Stat. § 236.12(2)(a) and Wis. Stat. § 236.13(1)(e)
83 Mich. Comp. Laws § 560.115
84 An example covenant is shown in NIPC’s Access Management Handbook. Prepared for the Eastern Will
County Regional Council. 1998. Part V. 85 An example is shown in NIPC’s Access Management Handbook. Op. cit. Part III.
86 Committee on Access Management. Access Management Manual. p. 118.
87 Ibid., pp 101-102.

21
Figure 9. Arterial- (left) and Reverse-Frontage (right) Development Comparison
Source: Dan Burden, Glatting Jackson/Walkable Communities.
Limiting Lower-Order Roadway Access to Major Roads. While an interconnected grid
of streets is beneficial and is a key principle of access management, some access control
from this grid to major arterial streets is often beneficial for safety and traffic flow,
particularly on higher-speed suburban arterial roads. Examples of such restrictions
include the following:
• Right-in/right out roadway access, which eliminate left-turn and through conflicts with arterial traffic.
88
• Simple turn or entry restrictions, sometimes by time-of-day, using signs approved in the MUTCD.
89
• Non-traversible medians, as explained in the “pavements” section of this report, with directional openings and u-turn provisions to provide access.
90
• An extensive collector road system.
• Replacing excessive local roadway access with cul-de-sacs, assuring continued bicycle and pedestrian access with continued sidewalks and, where appropriate,
bikeways.
88 An example is illustrated at
http://www.willcountyillinois.com/Portals/0/highway/pdfs/rightinout010307.pdf 89 Examples are illustrated at http://mutcd.fhwa.dot.gov/htm/2003r1/part6/fig6f-03-1_longdesc.htm.
Source: Federal Highway Administration. Manual on Uniform Traffic Control Devices. 2003. Figure 6F-3. 90 The Access Management Manual (p. 18) notes that “U-turns are generally safer than direct left turns,”
with a 17% lower crash rate and 27.3% lower injury-fatality rate than direct left turns” on six-lane roads.
Further, for driveways, “U-turning drivers experience less delay than those making a direct left turn under
high-volume conditions.”

22
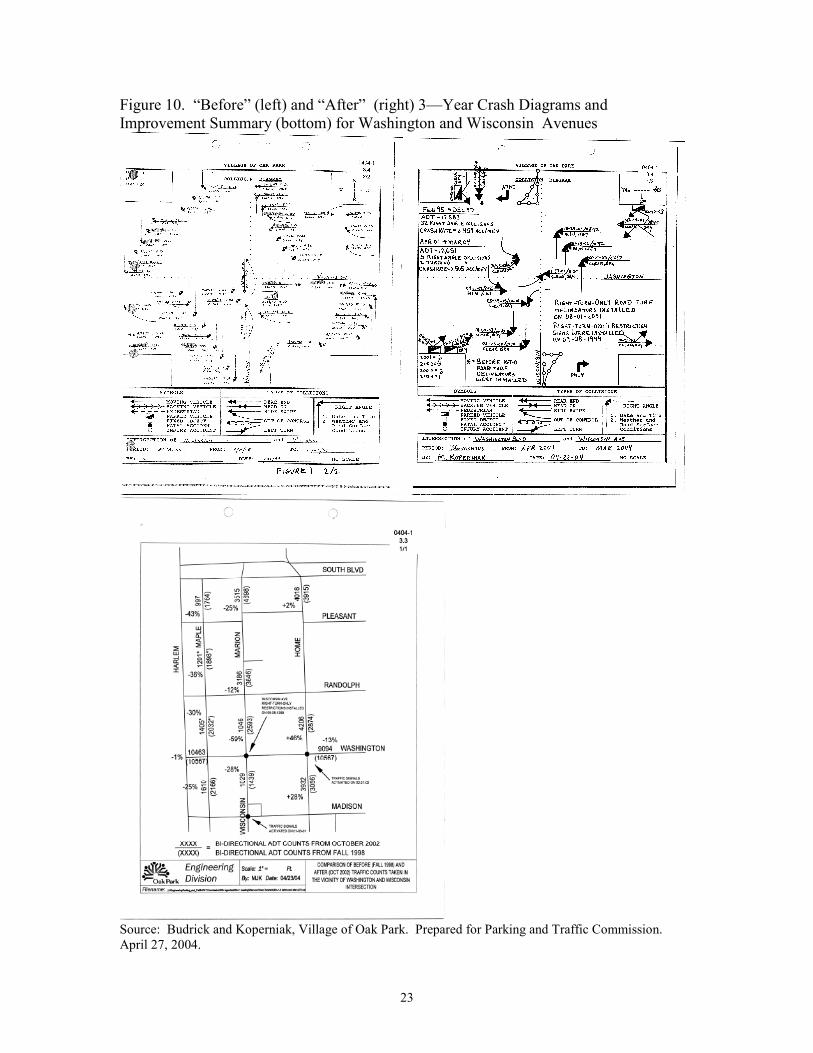
Even in dense urban and suburban areas, roadway access restrictions like those above
may be beneficial and should be evaluated when excessive crashes or congestion is
present. Such an evaluation was conducted along Washington Street in Oak Park by
Budrick and Koperniak in the Traffic Study for the Village of Oak Park.91 The village-
wide traffic study identified high-crash locations from among all of the intersections in
Oak Park. Countermeasures were developed for intersections with high crash rates,
including intersections along Washington Avenue. An example of such a change
included the installation of a right-turn-only diverter for the local street at the
Washington-Wisconsin intersection, and the installation of a traffic signal at the adjacent
Washington-Home intersection. This action resulted in a reduction in the 3-year counts
of dangerous, right-angle “t-bone” crashes from 32 before the improvement to 5 after the
improvement.92 Total crashes at the intersection fell from 49 before the improvement to
16 crashes after the improvement; see Figure 10.
Principle 3: Promote Intersection Hierarchy In its 2004 Green Book,
93 the American Association of State Highway and
Transportation Officials (AASHTO) identifies hierarchies of travel movements:
• main movement,
• transition,
• distribution,
• collection, and
• terminal access.
Typically, for trips that involve high-speed, regional travel, each of these movements
should match a roadway classification. While these movements between freeways and
major activity centers can sometimes be accommodated with direct access (e.g., I-190
access to O’Hare International Airport), such access is the exception and is
accommodated with design transitions on the access road. The Green Book notes that
“the deletion of intermediate facilities does not eliminate the functional need for the
remaining parts of the flow hierarchy or the functional design components, although it
may change their physical characteristics.”94
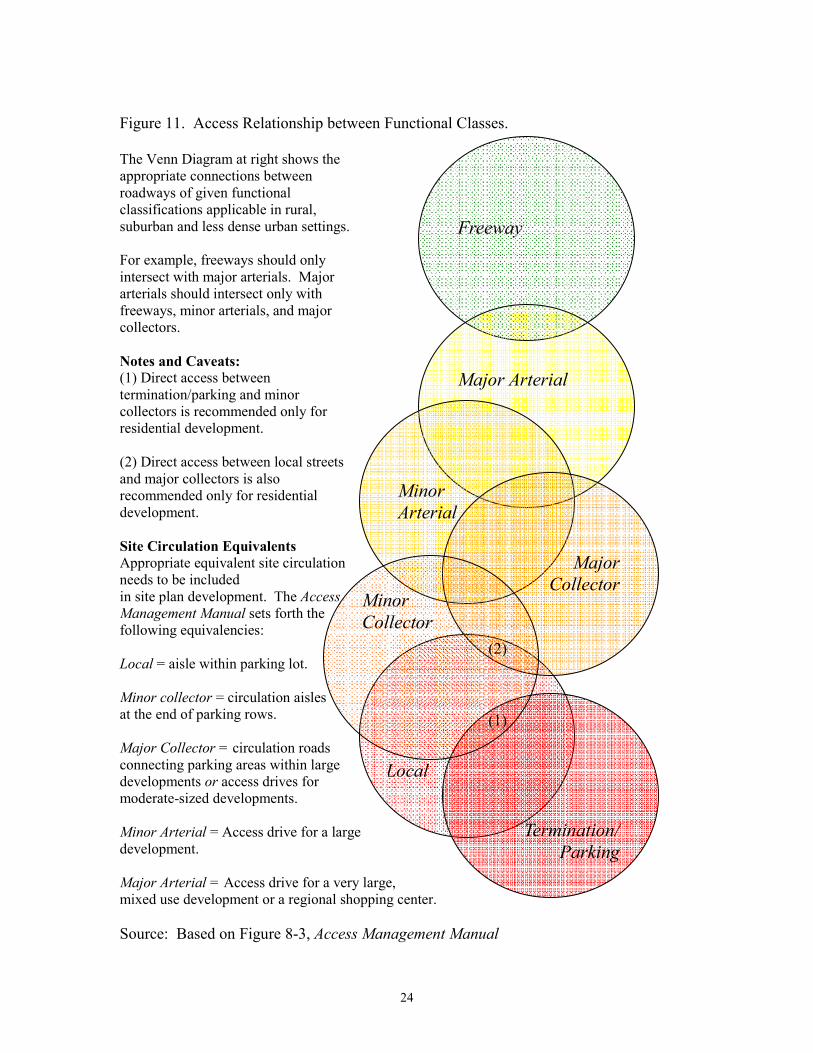
Thus, the Access Management Manual sets out the principle of avoiding intersections
between “a roadway of a lower classification directly to a roadway of much higher
classification.”95 Desired intersections are shown by intersecting circles on the Venn
diagram in Figure 11.
91 Jim Budrick and Michael Koperniak. Traffic Study for the Village of Oak Park. 1998-2001. Prepared
for the Village of Oak Park. 92 Michael Koperniak. “Staff Recommendation and Background Information Regarding the Right-Turn
Only Traffic Diverters on Wisconsin Avenue at Washington Boulevard.” Memo to Parking and Traffic
Commission, April 23, 2004. Note: despite the reduction in crashes, the memo suggested some relaxation
in the restrictions. There were access concerns for a nearby business district. The Parking and Traffic
Commission voted to retain the access management restrictions, a decision based on the safety record, a
recommendation later upheld by the Village’s Board of Trustees. 93 AASHTO. A Policy on Geometric Design of Highways and Streets. 2004. p. 1
94 Ibid., p. 2.
95 Committee on Access Management. Access Management Manual, op. cit., p. 125.
23
Figure 10. “Before” (left) and “After” (right) 3—Year Crash Diagrams and
Improvement Summary (bottom) for Washington and Wisconsin Avenues
Source: Budrick and Koperniak, Village of Oak Park. Prepared for Parking and Traffic Commission.
April 27, 2004.
24
Figure 11. Access Relationship between Functional Classes.
The Venn Diagram at right shows the
appropriate connections between
roadways of given functional
classifications applicable in rural,
suburban and less dense urban settings.
For example, freeways should only
intersect with major arterials. Major
arterials should intersect only with
freeways, minor arterials, and major
collectors.
Notes and Caveats:
(1) Direct access between
termination/parking and minor
collectors is recommended only for
residential development.
(2) Direct access between local streets
and major collectors is also
recommended only for residential
development.
Site Circulation Equivalents
Appropriate equivalent site circulation
needs to be included
in site plan development. The Access
Management Manual sets forth the
following equivalencies:
Local = aisle within parking lot.
Minor collector = circulation aisles
at the end of parking rows.
Major Collector = circulation roads
connecting parking areas within large
developments or access drives for
moderate-sized developments.
Minor Arterial = Access drive for a large
development.
Major Arterial = Access drive for a very large,
mixed use development or a regional shopping center.
Source: Based on Figure 8-3, Access Management Manual
Freeway
Major Arterial
Minor
Arterial
Local
Major
Collector
Termination/
Parking
Minor
Collector
(1)
(2)

25
Principle 4: Locate Signals to Favor Through Movements Traffic signals account for most motorist delay.
96 Gluck, Levinson, and Stover note that
signals constrain capacity, cause queues and spillback to upstream intersections. These
performance problems are magnified when signals are “randomly located, ineffectively
coordinated, or improperly timed. Closely and/or irregularly spaced signals can reduce
arterial travel speeds thereby resulting in an excessive number of stops even under
moderate traffic volume conditions.”97 A key access management technique is to space
signals to reduce intersection delay, to improve platoon progression.98
For central business districts, closely-spaced signals are appropriate. For closely spaced
intersections with balanced flows, the optimal signal timing plan is simultaneous
coordination (signal cycle offsets = 0). With simultaneous coordination, the issue
becomes cycle length and signal splits.99 However, for most suburban and rural arterial
segments, this is not the case and the emphasis is on platoon progression with access
conflicts controlled to facilitate the progression.
Gluck, Levinson and Stover note that the following formulas, based on the dynamics of
vehicle motion, show the long-established relationships between speed (V, in miles per
hour), signal cycle length (C, in seconds), and signal spacing (S, in feet):100
C
SV
681.0= for simultaneous signals (e.g., the Chicago CBD signal system).
C
SV
362.1= for alternating signals (where cycles are offset for progressive flow).
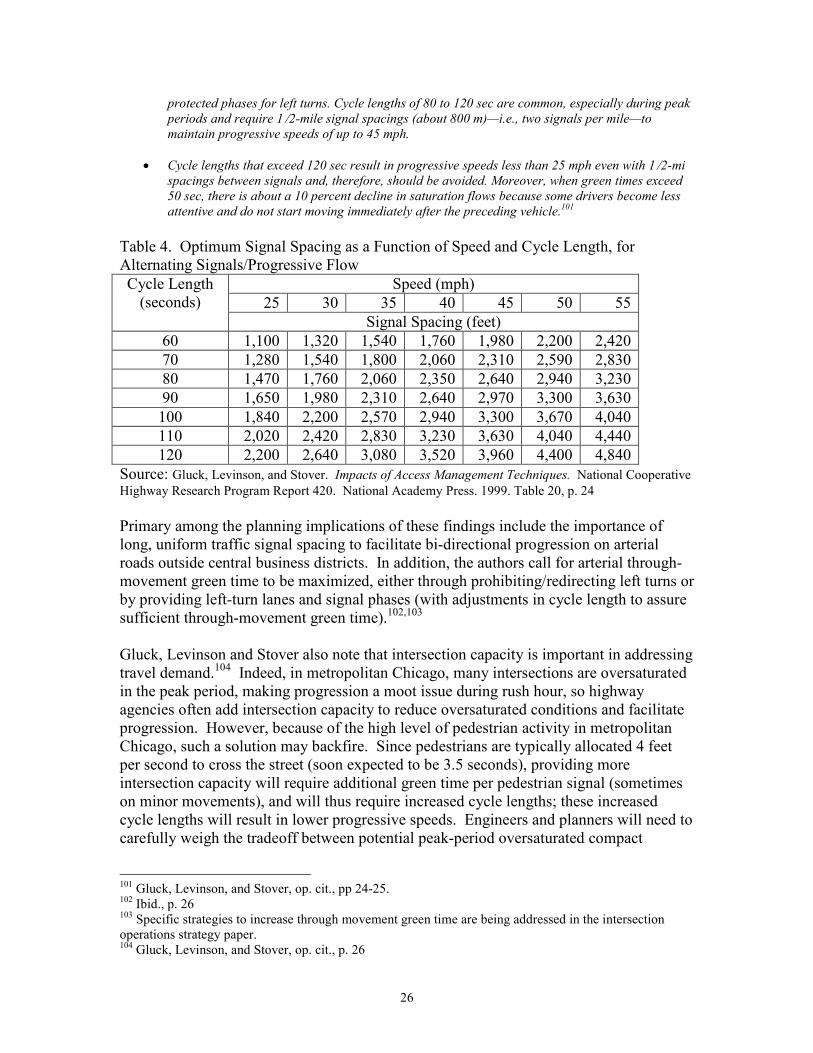
They then invert the formula to derive a table showing optimum signal spacing as a
function of desired speed and cycle length. This is shown below as Table 4. The authors
then provide the following summaries of the impacts:
• Spacings that are less than 1 ⁄4 mi (about 400 m)—i.e., more than four signals per mile—result in
progressive speeds that are too low for urban conditions (except perhaps for central business
districts).
• Signals spaced at about 1 ⁄4 mi (about 400 m) can provide progressive speeds from 26 to 30 mph
at cycle lengths from 60 to 70 sec. These speeds and cycle lengths are acceptable in cities where
traffic volumes are spread over several streets, where two-phase signal operations dominate, and
posted speeds are 35 mph or less.
• Longer signal spacings are necessary along many suburban highways where both traffic volumes
and speeds increase. Longer cycle lengths are commonly used to increase capacity and provide
96 Gluck, Levinson, and Stover. Op. cit., p. 22.
97 Ibid.
98 Improper signal spacing may also be a factor in traffic crashes. There are strategies to improve the safety
of highway traffic signals, discussed separately in the intersection operations section of this strategy paper. 99 Gordon Newell, Theory of Highway Traffic Signals University of California at Berkeley Institute of
Transportation Studies. Course Notes UCB-ITS-CN-89-1. June, 1989, p. 370 100 Gluck, Levinson and Stover, Op. cit., p. 24.
26
protected phases for left turns. Cycle lengths of 80 to 120 sec are common, especially during peak
periods and require 1 ⁄2-mile signal spacings (about 800 m)—i.e., two signals per mile—to
maintain progressive speeds of up to 45 mph.
• Cycle lengths that exceed 120 sec result in progressive speeds less than 25 mph even with 1 ⁄2-mi
spacings between signals and, therefore, should be avoided. Moreover, when green times exceed
50 sec, there is about a 10 percent decline in saturation flows because some drivers become less
attentive and do not start moving immediately after the preceding vehicle.101
Table 4. Optimum Signal Spacing as a Function of Speed and Cycle Length, for
Alternating Signals/Progressive Flow
Speed (mph)
25 30 35 40 45 50 55
Cycle Length
(seconds)
Signal Spacing (feet)
60 1,100 1,320 1,540 1,760 1,980 2,200 2,420
70 1,280 1,540 1,800 2,060 2,310 2,590 2,830
80 1,470 1,760 2,060 2,350 2,640 2,940 3,230
90 1,650 1,980 2,310 2,640 2,970 3,300 3,630
100 1,840 2,200 2,570 2,940 3,300 3,670 4,040
110 2,020 2,420 2,830 3,230 3,630 4,040 4,440
120 2,200 2,640 3,080 3,520 3,960 4,400 4,840
Source: Gluck, Levinson, and Stover. Impacts of Access Management Techniques. National Cooperative Highway Research Program Report 420. National Academy Press. 1999. Table 20, p. 24
Primary among the planning implications of these findings include the importance of
long, uniform traffic signal spacing to facilitate bi-directional progression on arterial
roads outside central business districts. In addition, the authors call for arterial through-
movement green time to be maximized, either through prohibiting/redirecting left turns or
by providing left-turn lanes and signal phases (with adjustments in cycle length to assure
sufficient through-movement green time).102,103
Gluck, Levinson and Stover also note that intersection capacity is important in addressing
travel demand.104 Indeed, in metropolitan Chicago, many intersections are oversaturated
in the peak period, making progression a moot issue during rush hour, so highway
agencies often add intersection capacity to reduce oversaturated conditions and facilitate
progression. However, because of the high level of pedestrian activity in metropolitan
Chicago, such a solution may backfire. Since pedestrians are typically allocated 4 feet
per second to cross the street (soon expected to be 3.5 seconds), providing more
intersection capacity will require additional green time per pedestrian signal (sometimes
on minor movements), and will thus require increased cycle lengths; these increased
cycle lengths will result in lower progressive speeds. Engineers and planners will need to
carefully weigh the tradeoff between potential peak-period oversaturated compact
101 Gluck, Levinson, and Stover, op. cit., pp 24-25.
102 Ibid., p. 26
103 Specific strategies to increase through movement green time are being addressed in the intersection
operations strategy paper. 104 Gluck, Levinson, and Stover, op. cit., p. 26

27
intersections and lower overall progressive travel speeds that may come from adding
intersection capacity.105
Planning issues arising from signal location also include, lastly, tradeoffs in delay from
one approach to another and one intersection to another. A signal established at the
wrong location in a progressive signal system will typically require a trade-off between
minor street green time and major street, through-movement green time to facilitate
adequate progression bandwidth.106 The result can be the inadequate green time seen on
suburban streets in our metropolitan area at major arterial intersections. Alternatively,
progression bandwidth may be adjusted by making changes upstream and downstream.
Again, the result may be inadequate green time and travel delay.
Illustration of Impact of Signal Location on Platoon Progression. Some of these issues
are displayed graphically in Figure 12. Figure 12 shows an arterial corridor with two
existing signal locations (� and � in Figure 12). Ideal, bi-directional progression is
shown as gray bands following black vectors proceeding through the corridor over time.
The placement of signals � and � allow for their signal timing plans to facilitate
platooned vehicle progression with green phases, while allowing minor street traffic
movements during gaps in the platoons (major street signal indications are illustrated
with alternating red and green bands).
105 For a discussion of pedestrian walking speeds, see LaPlante and Kaeser, A History of Pedestrian Signal
Walking Speed Assumptions. Paper presented at 3rd Urban Street Symposium, June 24-27, Seattle. Posted
at http://www.urbanstreet.info/3rd_symp_proceedings/A%20History%20of%20Pedestrian.pdf accessed
November, 2008.
The current approved Manual on Uniform Traffic Control Devices (Federal Highway Administration, 2003,
p. 4E-9, http://mutcd.fhwa.dot.gov/pdfs/2003r1r2/mutcd2003r1r2complet.pdf) governs the cycle times to
be set aside for pedestrian crossings. The current manual provides guidance that “pedestrian clearance time
should be sufficient to allow a pedestrian crossing in the crosswalk who left the curb or shoulder during the
WALKING PERSON (symbolizing WALK) signal indication to travel at a walking speed of 1.2 m (4 ft)
per second, to at least the far side of the traveled way or to a median of sufficient width for pedestrians to
wait.” The proposed revision to the manual reduces the walking speed and makes the cross-section more
challenging, that is, “the pedestrian clearance time should be sufficient to allow a pedestrian crossing in the
crosswalk who left the curb or shoulder at the end of the WALKING PERSON (symbolizing WALK)
signal indication to travel at a walking speed of 1.1 m (3.5 ft) per second to at least the far side of the
traveled way or to a median of sufficient width for pedestrians to wait.… The total of the walk interval and
pedestrian clearance time should be sufficient to allow a pedestrian crossing in the crosswalk who left the
pedestrian detector (or, if no pedestrian detector is present, a location 1.8 m (6 ft) from the face of the curb
or from the edge of the pavement) at the beginning of the WALKING PERSON (symbolizing WALK) signal indication to travel at a walking speed of 0.9 m (3 ft) per second to the far side of the traveled way
being crossed.” (FHWA, 2007 Notice of Proposed Amendments for the Manual on Uniform Traffic Control Devices, p. 322. Posted at http://mutcd.fhwa.dot.gov/resources/proposed_amend/npa_text.pdf, accessed
November, 2008).
The effects of adding intersection capacity on pedestrians is widely discussed, and is noted frequently in
IDOT’s Bureau of Design and Environment Manual (see, for example, Chapter 36, Intersections,
http://www.dot.il.gov/desenv/BDE%20Manual/BDE/pdf/chap36.pdf). However, the negative feedback to
signal operations is less frequently addressed in the available policy guidance.
One operational strategy sometimes implemented in the field for locations that do no have a large number
of pedestrians is to “pre-empt” the signal timing plan and associated platoon progression to accommodate
the pedestrian crossing, as many signalized intersections do for emergency vehicles. Of course, this has
substantial disadvantages from an efficiency perspective. 106 Gluck, Levinson, and Stover, op. cit., p. 26.

28
Figure 12. Idealized Time-Space Diagram of Arterial Corridor Illustrating Effects of
Signal Placement on Platooned Traffic Progression
�
�
�
�
�
Source: Adapted from Stover and Koepke, Transportation and Land Development. ITE, 1988. Figure 4-23
An additional signal is being considered at locations � �, or �. The diagram shows
that a signal at location � or � will result in one of two undesirable signal timing
options. At locations � and �, in the case of a signal without a pedestrian crossing,
�� �� L
ocatio
n along Roadway Corridor �� ��
� Elapsed Time �

29
accommodating the bidirectional platoons will require that an unnecessarily long portion
of the green-time will need to be allocated to the major arterial (this is shown by the top
alternating red and green bands showing signal indications at these locations). In this
case at these locations, the green time for the minor street will be very short (and the red
time for the major street, illustrated by the very short red bands for � and �, will be
correspondingly short).
If a pedestrian signal is required at proposed signal locations � and �, the red signal
phases for the major street will need to be lengthened to accommodate the pedestrian
crossing (the bottom alternating red and green bands at these locations). In this case, the
minor street receives sufficient green time, but the major street’s platooned progression is
significantly disrupted by the new signals – red signal indications straddle the gray
progression bands, blocking flow and causing unnecessary delay. Thus, placing a signal
at either location � or � in Figure 12 will result in suboptimal timing plans. Repeated
cries that “we need better signal timing at this location!,” as so often heard in our region,
cannot be fully realized with such signal placement as � or �. If signals are placed at
these locations, travelers will be stuck with unnecessary delay.
If, instead, the proposed location new signal is placed at location �, both of the
bidirectional platoon flows are accommodated, the minor street receives sufficient green
time, and the red signal indication on the major street is sufficient to allow pedestrian
crossings. Thus, placing a signal at location� in Figure 12 will result in an optimal
signal timing plan.
Figure 12, admittedly idealized, illustrates that a new signal location (or the location of a
new arterial access point that may later require signalization) requires substantial study to
assure minimum delay and maximum efficiency. Also note that, in some circumstances,
such study will find that any new signal, no matter where it is placed, will result in new
unacceptable delay, requiring the investigation of alternatives to signalization.
Summary. Traffic signals cause traffic delay. Travel times for corridors with three
signals per mile will be, on average, nine percent greater than two signals per mile. For
five signals per mile, travel times are 23% higher than two signals per mile; for 8 signals
per mile, travel times are 39% higher than two signals per mile.
Significant variation is possible in these factors. If additional signals are required, delay
can be minimized by careful placement of the signals to optimize through traffic
movements.
Principle 5: Preserve the functional areas of intersections & interchanges. Freeway access along an arterial can be expected to attract highway-oriented uses (gas
stations, fast-food restaurants, motels), or even higher density residential, office, and
commercial development.107 These developments will require careful access
107 Committee on Access Management. Access Management Manual, op. cit., p. 113.
30
management in order to maintain traffic flow not only on the arterial, but the freeway as
well. As noted in the Access Management Manual,
Research has shown that signalized intersections too close to interchange ramps
can cause heavy volumes of weaving traffic, complex traffic signal operations,
and traffic backing up the ramps onto the main line. Curb cuts and median
openings near the interchange ramps further compound these problems.108
Guidelines have recently been developed for access spacing at interchanges. A summary
of Oregon guidelines, as fully developed and clarified in the Access Management
Manual, is below. The engineering work used to develop these guidelines is available in
a paper by Layton.109 The guidelines consider many factors in determining the minimum
access spacing, including merging distances, weaving distances, transition distances,
perception/reaction distances, and left-turn storage/queue distances. Application of these
guidelines to land development, with minor modifications and detailed case studies, is
also available in a Florida guide prepared by Land and Williams.110 The guidelines are
summarized in Table 5.
Layton also recommended several related transportation and access management
strategies in interchange areas. These include:
� Traffic controls, including signal phasing modifications, intersection
channelization, and turn restrictions, all to reduce the likelihood of ramp queue or
congestion spillback onto the mainline freeway. Ramp queue detection with
traffic signal feedback and traffic signal interconnection will also help prevent
backups onto the freeway mainline. Likewise, ramp meters for the freeway
entrance ramps are an access management technique whose function is to prevent
ramp terminal signal platoons from causing a breakdown in freeway traffic flow
as the ramp traffic merges onto the mainline.111
� Circulation/Distribution and Local Roads System, to provide access to land uses
in the interchange area with a minimal impact on the freeway or arterial. Access
between and among these land uses, and to adjacent land uses, should be provided
without needing to travel on the arterial roadway. This system should provide
arterial access subject to the spacing controls in Table 5, as already discussed.112
Furthermore, at arterial intersections, signal phasing priority should be given to
the arterial roadway within one-half mile of the freeway interchange.
108 Ibid.
109 Robert Layton. Background Paper #2: Interchange Access Management. Oregon State University
Department of Civil, Construction, and Environmental Engineering. Prepared for Oregon Department of
Transportation. August 1996. Available at
http://www.oregon.gov/ODOT/HWY/ACCESSMGT/docs/IntAccMgmt.pdf Accessed November, 2008. 110 Laurel Land and Kristine Williams. Land Development and Access Management Strategies for Florida
Interchange Areas. Center for Urban Transportation Research, University of South Florida. Prepared in
Cooperation with the State of Florida Department of Transportation. March, 2000. Available at
http://www.accessmanagement.info/pdf/interchange.pdf. Accessed November, 2008. 111 Layton, op. cit., pp. 2-3.
112 Layton, op. cit., pp. 3-4.

31
Table 5. Oregon Minimum Arterial Highway Spacing Standards for Freeway
Interchange Areas
Fully Developed
Urban
(35 mph – See
Note)
Suburban
(45 mph)
Rural
(55 mph)
Spacing Dimension
2-
Lane
4-Lane
with
Median
2-
Lane
4-Lane
with
Median
2-
Lane
4-Lane
with
Median
Spacing from Ramp
Terminal to First
Drive/Access on the Right
(Right-in/Right-out Only)
(Minimum)
750
feet
750 feet 990
feet
990 feet 1,320
feet
1,320
feet
Spacing between Ramp
Terminal and Nearest Major
Intersection (First 4-Legged
Intersection) (Minimum)
1,320
feet
2,640
feet
1,320
feet
2,640
feet
1320
feet
2,640
feet
Spacing to First Median
Opening from Off-Ramp
Terminal – Access to First
Drive on Left (Minimum)
N.A. 990 feet N.A. 1,320
feet
N.A. 1,320
feet
Spacing between Last
Access Drive and the Start
of Taper for On-Ramp
Terminal (Minimum)
750
feet
990 feet 990
feet
1,320
feet
1,320
feet
1,320
feet
Note: “Free-flow ramps are generally discouraged in fully developed urban areas and are questionable in
suburban/urban areas because pedestrian and bicycle movements are difficult and potentially dangerous.”
Table Source: Committee on Access Management, Access Management Manual. Op cit., p. 161. See also
Layton, op cit.
� Where appropriate, consider additional grade-separated roadway crossings of the
freeway or the intersecting arterials. Such crossings will improve the likelihood
of an acceptable level of service at the freeway interchange and adjacent
intersections by diverting traffic away from the arterial interchange and adjacent
intersections. According to Layton, grade-separated crossings help to “provide
crossing corridors that relieve traffic demand on crossings at interchanges.”113
Such crossings can also facilitate walking and cycling trips where they otherwise
may not be feasible.
� Land Use Controls consistent with the interchange access management
strategy.114
� Balance interchange design with ultimate mainline facility.115
� Protective buying and sale of excess property.116
113 Layton, op. cit., p. 4.
114 Ibid.
115 Ibid.
116 Ibid.
32
� Closure of Interchange or Ramps. Substandard interchanges cause substantial
delay and may cause excessive numbers of traffic crashes. These interchanges
may have substandard on ramp merges, improper arterial intersection spacing,
improper freeway interchange spacing, or arterial delay resulting in ramp
spillback onto the freeway mainline. Such interchanges or ramps may be
closed.117
� Frontage Road Relocation or Closure. Where existing frontage roads do not
meet spacing criteria, and where this is causing excessive delay or crashes,
closing or relocating frontage roads, and providing alternative access, should be
considered.118
Taken together, these actions will assure that freeway-arterial interchanges do not remain
the focus of highway travel delay and crashes.
Interchange area access management plans are one suggested implementation method for
interchange access management.119 According to Land and Williams, such plans
“…target a specialized area and take a comprehensive approach. Like a corridor
plan, an interchange area plan is linked to the roadways and should concentrate on
the interrelationship of land use and access. Because an interchange area shapes
the perception of a community, an interchange area access management plan
gives clear direction for development, provides organizational structure, and is the
basis for achieving a positive, welcome perception of the community. A good
plan will also prevent situations from occurring that will limit economic benefits
to the community.
… Elements that need to be evaluated to assure future access management
include, but are not limited to:
� Site plans (encourage unified development such as shared signage, driveways, and parking);
� Signage (control of billboards and advertisements); � Highway and traffic (road function, access to adjacent land, evaluation of traffic generation versus benefits such as employment generation);
� Access control (minimizes conflict); � Street system (internal, frontage, backage, local, and crossroads); � Setbacks (safety, future construction, aesthetics); � Corner clearance; � Loading on premises (for pickup, delivery, service, and emergency vehicles);
� Consolidated signage; � Pedestrian circulation.
It will also be necessary to assess existing conditions, such as:
117 Ibid., p. 6.
118 Ibid., pp. 5-6
119 Land and Williams, op. cit., pp. 6- 7.

33
� Property ownership and land divisions; � Lot frontage; � Access points; � Transportation characteristics.120
Subdivision and zoning regulations can be employed to implement interchange area
access management plans. Specific zoning applications may include an overlay district
(“interchange overlay district”); specialized districts, as “interchange zoning districts;”
planned unit developments; and special or conditional use permits.121 Land and Williams
also suggest that “developments of regional impact” (DRI) processes can also provide an
“opportunity to require a thorough assessment of site impacts and developer mitigation;”
which, in Florida’s case, such mitigation may be established as a condition of approval.122
Principle 6: Limit the Number of Conflict Points;
And Principle 7: Separate Conflict Areas. The Access Management Manual says “traffic conflicts occur when the paths of vehicles
intersect and may involve merging, diverging, stopping, weaving, or crossing
movements.”123 Limiting the number of conflict points reduces driving complexity,
reduces driver error, and reduces the number of crashes.124 Separating conflict areas
allows drivers to have “sufficient time to address one set of potential conflicts before
facing another.”125
High-volume, high-speed roadways should be a focus of efforts to reduce and separate
conflict points, since the effects of driver error on such facilities are much greater than
would be the case on lower-speed, lower-volume facilities. The Access Management
Manual states that “the necessary spacing between conflict areas increases as travel speed
increases, to provide drivers adequate perception and reaction time.”126
Specific strategies to control conflict points include medians and driveway controls,
both discussed earlier, and intersection design, discussed in detail later in a separate
section. Note here, however, that a typical four-way intersection has 32 vehicle-vehicle
conflicts, plus 24 vehicle-pedestrian conflicts, as shown in Figure 13. Many innovative
intersections discussed later are designed primarily to reduce the number of conflict
points. Here, we concentrate on the relationships among various highway access
elements to reduce conflicts and control their spacing.
An “intersection functional area” is an important concept in defining conflict points and
conflict areas for arterial highways. Access should be managed to limit conflicts in
intersection functional areas.
120 Ibid.
121 Ibid., p. 8
122 Ibid.
123 Committee of Access Management. Access Management Manual. Op. cit., p. 8.
124 Ibid.
125 Ibid.
126 Ibid.

34
Figure 13. Conflicts at a Four-Way Intersection.
Source: Dan Burden, Glatting Jackson/Walkable Communities.
Managing Access in Intersection Functional Areas. Intersection functional areas are
defined to include areas upstream and downstream of the physical area of an intersection.
Moving upstream from an intersection, the functional area includes the queue storage for
the intersection, the deceleration distance for stop maneuvers, and the distance required
for the perception/reaction time for the intersection approach. The functional area
downstream of an intersection is the distance sufficient so a driver may clear the
intersection before needing to react to downstream traffic events.127 See Figure 14.
Figure 14. Intersection Functional Area
Source: Lee A. Rodegerdts, et al. Signalized Intersections: Informational Guide.
127 Lee A. Rodegerdts, et al. Signalized Intersections: Informational Guide. Federal Highway
Administration. Prepared for the Federal Highway Administration. 2004. Based on earlier versions in the
Access Management Manual and Florida Departent of Transportation Procedures. Posted at
http://www.tfhrc.gov/safety/pubs/04091/04091.pdf. Accessed November, 2008.

35
A key strategy for access management is to separate conflict points and conflict areas
from intersection functional areas, where appropriate. For example, AASHTO’s Policy
on Geometric Design of Highways and Streets states “driveways should not be located
witin the functional area of an intersection or in the influence area of another
driveway.”128 Signalized Intersections: Informational Guide and the Access Management
Manual both graphically demonstrate the windows of opportunity for access between
intersection functional areas.129 Figure 15 shows an access window between intersections
with sufficient separation to allow two-way access.
Figure 15. Intersection Functional Areas: Access Window: Two-Way Access.
Source: Lee A. Rodegerdts, et al. Signalized Intersections: Informational Guide.
Figure 16 shows the two intersections with overlapping functional areas. A much more
limited access window is available. To separate traffic conflict areas in such a situation,
consider limiting access to right-in/right-out access in the area indicated. Any traffic
crossing the highway centerline from a new access point will encroach on one of the two
intersection functional areas.
Figure 17 shows the two intersections with further overlapping functional areas. In
Figure 17, there is no access window between the two intersections. Determining
appropriate access in the cases of Figures 16 and 17 requires careful analysis. Often,
alternative access from adjacent collector or local streets is possible. Frontage, backage,
and service roads are also alternatives, with sufficient planning, and due care to separate
conflict areas for such access roads.130 Another alternative is land assembly and
redevelopment, to include merging contiguous parcels and off-street loading and parking
(perhaps off-site parking). However, short street spacings or small parcels may require
that driveway access be permitted, despite the negative safety and congestion impacts.131
128 AASHTO, op. cit., p. 729.
129 Committee on Access Management, Access Management Manual, op. cit., pp. 133-135. Lee A.
Rodegerdts, et al. Signalized Intersections: Informational Guide, op. cit., p. 175. 130 Committee on Access Management, Access Management Manual, op. cit., pp. 189-191.
131 Lee A. Rodegerdts, et al. Signalized Intersections: Informational Guide, op. cit., p. 173.

36
Figure 16. Intersectional Functional Areas: Access Window: Right-In/Right-Out Access.
Source: Lee A. Rodegerdts, et al. Signalized Intersections: Informational Guide.
Figure 17. Intersection Functional Areas: No Access Window.
Source: Lee A. Rodegerdts, et al. Signalized Intersections: Informational Guide.
The Signalized Intersections: Informational Guide cautions about the importance of
analysis of situations like those above. Downstream system effects need special
consideration, since “solving” a problem in one location may create a much worse
problem elsewhere. In addition, the Guide states that “as a general guideline, the
functional area of an intersection is more critical along corridors with high speeds (45
mph or greater) and whose primary purpose is mobility.132
The Access Management Manual addresses further non-signalized access spacing
guidelines based on safety, stopping sight distance, intersection sight distance, functional
132 Ibid.

37
areas, right-turn conflict overlaps, driveway influence distance, and egress capacity.133
The Manual also suggests the following strategies to retrofit existing deficiencies in
access spacing:
� Install a median barrier in high crash locations [discussed previously].
� Work with property owners to obtain permission for driveway closure, reconstruction
of substandard driveways, or relocation during roadway resurfacing or improvement.
� Encourage property owners to allow reconstruction or consolidation of driveway
access during sidewalk maintenance, reconstruction, or additions.
� Adopt an access management policy that addresses the need for improvement of
access and inter-parcel connections during redevelopment or expansion of an
existing use.
� Strategically purchase vacant or abandoned properties and resell them with access
restrictions….
� Place planter boxes along unlimited access points to better define driveways.
� Require consolidation of access where adjacent parcels come under common
ownership.
� Redesign internal road and parking systems.
� Eliminate closely spaced or jogged intersections.134
Principle 8: Remove Turning Vehicles from Through-Traffic Lanes. Removing turning vehicles from traffic lanes is important because people slow down to
make such turns. In slowing down, a conflict is created with following vehicles. The
greater the speed differential between turning vehicles and through movement, the greater
the crash involvement for such turning movements. Turning movements tend to be made
at low speeds, with very low speeds for turns into driveways. While geometric
characteristics of driveways have some effect on the speed of the turning movement
(important for pedestrian safety), this speed change is insignificant in relationship to the
speed differential for most suburban arterial roads. Therefore, the Access Management
Manual concludes that “auxiliary left-turn and right-turn lanes (bays) are the most
effective means of reducing the speed differential between turning vehicles and other
traffic on major roadways.”135
The installation of bays for turning movements is widespread in metropolitan Chicago,
and can still be increased. As a corollary for focusing conflict area improvements on
higher-speed arterials, channelization is likewise most important on such roads.
Specific strategies for providing auxiliary turn lanes include two-way left turn lanes and
medians with appropriate openings, as discussed on pages 10-14. Other strategies
include right-turn bays and turning roadways. For right-turn lanes, the best study
available showed that installation of a single right-turn lane on a major-road approach
133 Committee on Access Management. Access Management Manual. Op. cit., pp 149-155.
134 Ibid., p. 92.
135 Ibid. p. 170. The Manual reviews the impacts of the geometry of driveways, and concludes that
increasing the driveway throat width from 20’ to 35’ raises the turning speed only 1.5 mph. Increasing the
curb return radius from 0’ to 30’ increases turning speed 3mph. For pedestrian operations, this is
significant, but not significant compared to a 45mph operating speed on a suburban arterial. Thus, the
Manual makes a strong call for the use of auxiliary lanes.

38
reduced total crashes at urban signalized intersections by four percent and at rural
unsignalized intersections by 14 percent.136 Separating right turns from through-
movements may also increase capacity, dependent on the inter-relationship of the curb
return radius, pedestrian volumes, and pedestrian crossing distances.
Auxiliary Through Lanes. Often, in the urban parts of the metropolitan Chicago,
“auxiliary through lanes” are implemented at signalized intersections, providing a short,
shared lane for through and right-turn movements. See Figure 18. Downstream of the
intersection, through movements must merge to the left. While these lanes allow through
vehicles to merge effectively as they accelerate downstream from a stop condition at the
signal, auxiliary through lanes may also be used by aggressive drivers to jump a queue in
a saturated condition, which may increase intersection delay and crashes. Detailed
operational and safety information for such lanes is not available, but a formal evaluation
of these lanes is forthcoming.137 However, in the interim, high-crash locations with such
lanes may be evaluated, examining each crash record, to determine whether such lanes
should be replaced with right-turn-only lanes.
Figure 18. Auxiliary Through Lanes (Not Recommended at this Time)
Source: Lee A. Rodegerdts, et al. Signalized Intersections: Informational Guide.
Right-Turn Channelization/Turning Roadways. Another method to separate turning
vehicles from through traffic is with turning roadways, channelizing right turns away
from through-lanes with a “pork chop” island. A typical application is shown in Figure
19. The limited research is available on such turning roads raises questions; indeed, the
research shows that right-turn channelization with turning roadways may, in fact,
increase crash rates for urban and rural, signalized and unsignalized intersections.138
136 Harwood and Bauer, et al. Methodology to Predict the Safety Performance of Urban and Suburban
Arterials. Op. cit., p. 33. Referenced study is Harwood and Bauer et al. (2) Safety Effectiveness of
Intersection Left- and Right-Turn Lanes, Federal Highway Administration, Report No. FHWA-RD-02-089,
July 2002. Posted at http://www.tfhrc.gov/safety/pubs/02089/02089.pdf. Accessed November, 2008. 137 NCHRP 03-98 [Pending] Guidelines on the Use of Auxiliary Through Lanes at Signalized Intersections http://www.trb.org/TRBNet/ProjectDisplay.asp?ProjectID=2492 Accessed November, 2008. Limited
information about such lanes is available in section 12.2.1 of Lee A. Rodegerdts, et al. Signalized
Intersections: Informational Guide, op. cit. 138 Harwood and Bauer et al. (2) Safety Effectiveness of Intersection Left- and Right-Turn Lanes, Federal
Highway Administration, Report No. FHWA-RD-02-089, July 2002. Page A-8. Posted at http://www.tfhrc.gov/safety/pubs/02089/02089.pdf. Accessed November, 2008. Referenced model
(revised) is at Harwood and Bauer (3), Statistical Models of At-Grade Intersection Accidents – Addendum.
Prepared under Auspices of Midwest Research Institute for Federal Highway Administration. See pp. 27,

39
Figure 19. Right-Turn Channelization: Old (Left) and New (Right) Designs
Source: Michael Ronkin and Fred Ranck. “Designing Streets for Pedestrian Safety.” Presentation, June
2006. Chicago, Illinois, Chicago Metropolitan Agency for Planning. Sponsored by Federal Highway
Administration.
Typical designs for turning roadways, shown on the left in Figure 19, have been criticized
and may cause the unexpected higher crash rates. Like auxiliary through lanes, right-turn
channelization is still being researched.139 Newer designs, like those on the right above,
and included in Signalized Intersections: Informational Guide,140 generally address criticisms by putting pedestrian crossings in the normal range of vision of most
approaching motorists, controlling the operating speed of turning vehicles, and providing
a better angle for turning traffic to see cross-traffic (112 degrees instead of 142 degrees).
These new designs are worth evaluating to safely separate conflicting traffic movements.
In addition, well-designed “pork chop” islands are pedestrian refuges, reducing
pedestrian crossing distances and crossing times, and reducing traffic delay.
Principle 9. Use Nontraversable Medians to Manage Left-Turn
Movements This topic was covered in detail on pp 10-14.
39, and 45, as well as the discussion of applicability on pp 51-52. Posted at
http://www.tfhrc.gov/safety/99-094.pdf. Accessed November, 2008. 139 NCHRP Project 03-89. “Design Guidance for Channelized Right-Turn Lanes.
http://www.trb.org/TRBNet/ProjectDisplay.asp?ProjectID=1609 Accessed November, 2008. 140 Op. Cit., Figure 124.
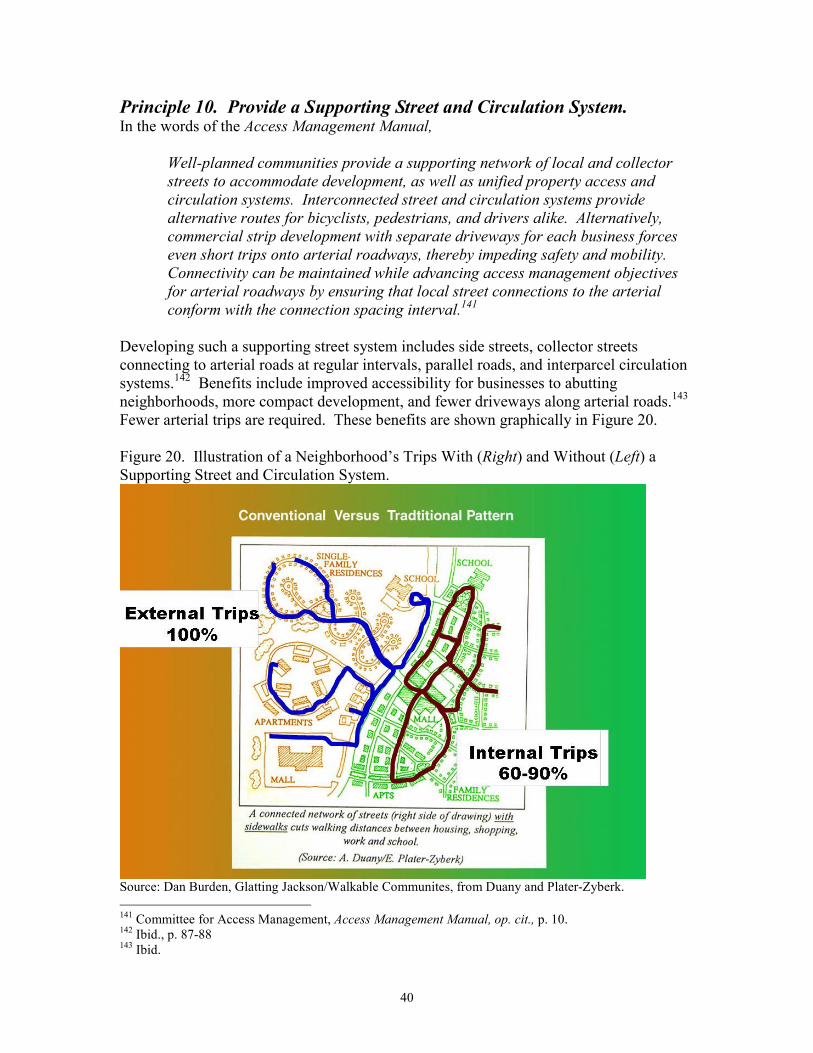
40
Principle 10. Provide a Supporting Street and Circulation System. In the words of the Access Management Manual,
Well-planned communities provide a supporting network of local and collector
streets to accommodate development, as well as unified property access and
circulation systems. Interconnected street and circulation systems provide
alternative routes for bicyclists, pedestrians, and drivers alike. Alternatively,
commercial strip development with separate driveways for each business forces
even short trips onto arterial roadways, thereby impeding safety and mobility.
Connectivity can be maintained while advancing access management objectives
for arterial roadways by ensuring that local street connections to the arterial
conform with the connection spacing interval.141
Developing such a supporting street system includes side streets, collector streets
connecting to arterial roads at regular intervals, parallel roads, and interparcel circulation
systems.142 Benefits include improved accessibility for businesses to abutting
neighborhoods, more compact development, and fewer driveways along arterial roads.143
Fewer arterial trips are required. These benefits are shown graphically in Figure 20.
Figure 20. Illustration of a Neighborhood’s Trips With (Right) and Without (Left) a
Supporting Street and Circulation System.
Source: Dan Burden, Glatting Jackson/Walkable Communites, from Duany and Plater-Zyberk.
141 Committee for Access Management, Access Management Manual, op. cit., p. 10.
142 Ibid., p. 87-88
143 Ibid.
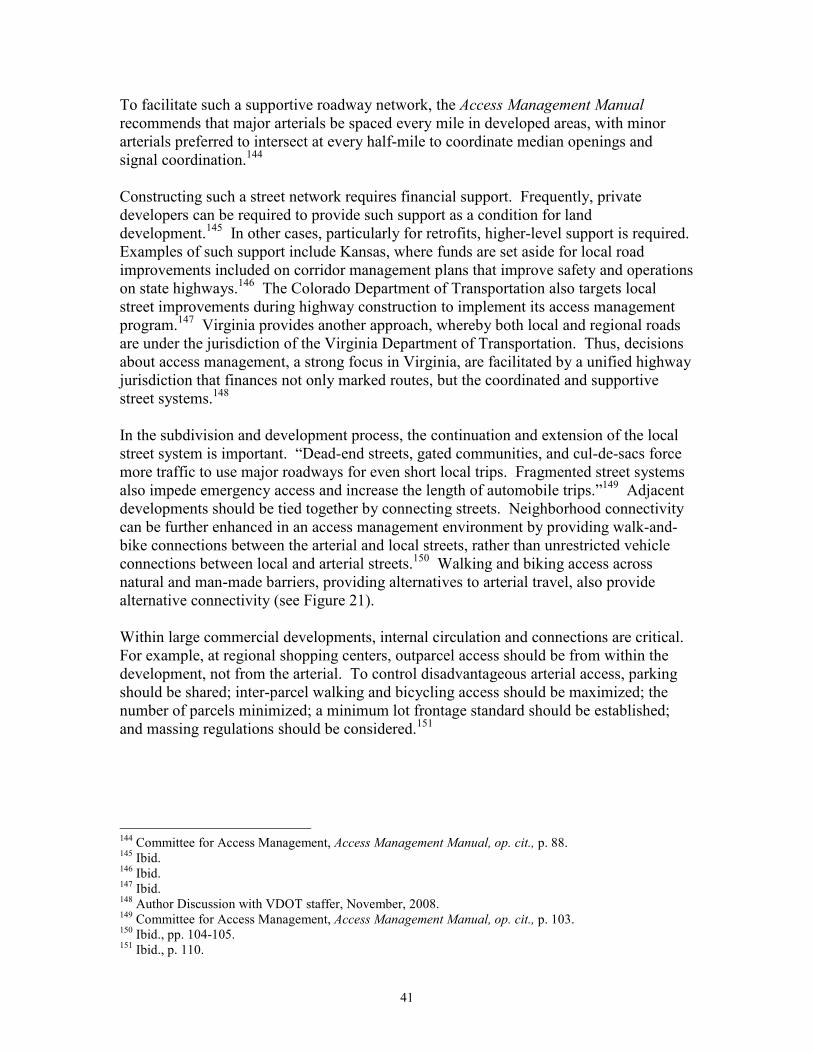
41
To facilitate such a supportive roadway network, the Access Management Manual
recommends that major arterials be spaced every mile in developed areas, with minor
arterials preferred to intersect at every half-mile to coordinate median openings and
signal coordination.144
Constructing such a street network requires financial support. Frequently, private
developers can be required to provide such support as a condition for land
development.145 In other cases, particularly for retrofits, higher-level support is required.
Examples of such support include Kansas, where funds are set aside for local road
improvements included on corridor management plans that improve safety and operations
on state highways.146 The Colorado Department of Transportation also targets local
street improvements during highway construction to implement its access management
program.147 Virginia provides another approach, whereby both local and regional roads
are under the jurisdiction of the Virginia Department of Transportation. Thus, decisions
about access management, a strong focus in Virginia, are facilitated by a unified highway
jurisdiction that finances not only marked routes, but the coordinated and supportive
street systems.148
In the subdivision and development process, the continuation and extension of the local
street system is important. “Dead-end streets, gated communities, and cul-de-sacs force
more traffic to use major roadways for even short local trips. Fragmented street systems
also impede emergency access and increase the length of automobile trips.”149 Adjacent
developments should be tied together by connecting streets. Neighborhood connectivity
can be further enhanced in an access management environment by providing walk-and-
bike connections between the arterial and local streets, rather than unrestricted vehicle
connections between local and arterial streets.150 Walking and biking access across
natural and man-made barriers, providing alternatives to arterial travel, also provide
alternative connectivity (see Figure 21).
Within large commercial developments, internal circulation and connections are critical.
For example, at regional shopping centers, outparcel access should be from within the
development, not from the arterial. To control disadvantageous arterial access, parking
should be shared; inter-parcel walking and bicycling access should be maximized; the
number of parcels minimized; a minimum lot frontage standard should be established;
and massing regulations should be considered.151
144 Committee for Access Management, Access Management Manual, op. cit., p. 88.
145 Ibid.
146 Ibid.
147 Ibid.
148 Author Discussion with VDOT staffer, November, 2008.
149 Committee for Access Management, Access Management Manual, op. cit., p. 103.
150 Ibid., pp. 104-105.
151 Ibid., p. 110.
42
Figure 21. Northfield Walk-bike Alternative Access Across Chicago River from
Residential Area to Business District
Photo by Dan Burden, Glatting Jackson/Walkable Communities.
Access Management Bottom Line: The Benefits The Access Management Manual lists many benefits from a comprehensive access
management strategy.152 Key benefits of access management on the list include the
following:
• extended functional life of roads and highways;
• increased motorist, bicyclist, and pedestrian safety;
• reduced traffic congestion;
• improved appearance and quality of the built environment;
• preserved long-term property values;
• greater fuel efficiency;
• reduced vehicle emissions;
• alternative travel routes for walking and cycling from a fully-developed local street system
Access management is often a concern for business owners. However, as noted for the
discussion about medians (pp. 10-14), the negative business impacts are usually minimal.
More importantly, access management can be an important part of a strategy to increase a
business’s market area. By reducing travel delay, access management increases market
area. Delay that reduces average speeds by 20% reduces the market area by 35%; a 50%
reduction in average speed reduces market area by 75%.153
152 Committee for Access Management, Access Management Manual Op. cit., pp. 4, 19, 20-25.
153 Ibid., pp. 22-23.
43
Access Management Bottom Line (II): The Regional Role. The Access Management Manual suggests the following roles for Metropolitan Planning
Organizations (MPO’s), such as CMAP, in furthering access management:154
• Long-range planning: � Example: (Albany-Troy-Schenectady): Screen projects to assure land use and access management consistency with long range plan
before moving a project to the Transportation Improvement
Program. In addition, “do not identify specific projects in long-
range transportation plan until a local study focused on land use
and transportation issues, which includes detailed consideration of
access management strategies, is completed.”
o Establish goals, objectives, and policies promoting and requiring access management implementation.
o Establish access management as a required project implementation strategy.
o Facilitate and endorse the implementation of the strategies laid out below
• Congestion management and programming: � Example: Metroplan (Orlando) sets aside funds for non-capacity improvements identified in congestion management process.
These often focus on access management.
o Identify access management strategies in congestion management process corridor studies.
o Consider corridor improvement strategies in programming process. o Use CMAQ funds to implement access management strategies.
• Visioning: o Envision land development, access, and transportation solutions together. o Address preferred growth patterns, alternative transportation modes, and quality of life.
o Use visioning to address access management both to complement and to replace more expensive capacity additions.
• Special Studies: � Example: Louisville MPO identified access management, right-of-way preservation, and developer mitigation strategies that could be
implemented at the local level, with subarea plans illustrating the
strategies’ application.
o Corridor studies o Sub-area studies o Thoroughfare plans
• Technical Assistance: � Example: The Northeastern Illinois Planning Commission provided a guide to access management that included a model
ordinance (now outdated).
o Provide “about” and “how-to” information regarding access management techniques to local communities.
154 Committee for Access Management, Access Management Manual Op. cit., pp. 62-64

44
o Provide information for higher-level bodies, including the legislature and departments of transportation, for policy consideration.
• Workshops and Conferences: � Examples: access management workshops have been held by the Little Rock and Kansas City MPO’s.
o Provide educational outreach and training o Form and inform a key group of regional stakeholders and champions.
• Project Review o During any conceptual design review in which the MPO participates, promote access management.