Arterial Spin Labeled MR Perfusion Imaging - ccn.ucla.edu · PDF file2 T1 14% 3 T1 5%...
73
Arterial Spin Labeled MR Perfusion Imaging Danny J. J. Wang, PhD, MSCE Associate Professor Ahmanson-Lovelace Brain Mapping Center Department of Neurology, UCLA www.loft-lab.org
-
Upload
phamnguyet -
Category
Documents
-
view
215 -
download
1
Transcript of Arterial Spin Labeled MR Perfusion Imaging - ccn.ucla.edu · PDF file2 T1 14% 3 T1 5%...

Arterial Spin Labeled MR Perfusion Imaging
Danny J. J. Wang, PhD, MSCE
Associate Professor Ahmanson-Lovelace Brain Mapping Center
Department of Neurology, UCLA
www.loft-lab.org

Outline • Technical principles of ASL perfusion MRI
• Pulsed, continuous and pseudo-continuous • Perfusion quantification • 4D Dynamic flow and perfusion imaging • Vessel selective ASL • Limitations of ASL perfusion MRI
• Clinical applications of ASL perfusion MRI
• Neurological disorders: stroke, brain tumor, dementia • Functional MRI: comparison with BOLD • Neuromodulation and Pharmacological MRI

Perfusion n Perfusion = delivery of nutrients to tissue by means
of blood flow n Definition:
n The volume of blood that flows through the capillaries of a piece of tissue in a specified period of time
n More regionally specific than arterial or venous blood flow
n Measured in ml / (100g min)

Importance of Perfusion Measurement
n Indicates condition of vascular supply network n Indirectly reflects metabolic activity of tissue
n Except in lung, kidneys or when vascular system is injured
n Detects tissue in danger of ischemic damage
n Reflects activity and function of brain and organs (fMRI)

Some Facts of Microvasculature
Carpenter MB. Core text of neuroanatomy

Perfusion is Usually Measured with Tracers
n Tracers vary in transport properties n Diffusible tracers n Intravascular tracers (blood pool) n Microspheres (deposition)
n Tracers vary in stability n Radioactive Tracers (PET, SPECT) n Nuclear magnetic spins (Hyperpolarization) n Stable contrast agents (Gd-DTPA)

Artery Vein
Tracer Introduced
Diffusible Intravascular Microsphere
Tissue

“Gold Standard” of Perfusion Measurement
Kety & Schmidt (1948)

Magnetic Resonance Imaging (MRI)
H1
At 1T, for every million nuclei in the spin-down state, there are about 1 million plus 7 extra nuclei in the spin-up state.

T1 and T2 Relaxation
T2 relaxation (~100ms)
T1 relaxation (1-2s)

Arterial Spin Labeling (Tagging)
n Inflowing Blood Spins are Inverted or Saturated Before Entering the Slice
n Imaging is performed after a delay time that allows labeled blood to flow into tissue
n Tagged Image is Subtracted from Control Image with No Tagging

Imaging Slice!
Arterial Tagging!Plane!
Continuous Adiabatic "Inversion Geometry"
Control Inversion !Plane !
B Fi
eld
Gra
dien
t"
Single Slice"Perfusion Image"about 1% effect"
Control - Label "
Detre et al. MRM 1992, Williams et al. PNAS 1992
ASL Perfusion MRI
CBF in “classical” units of ml/100g/min
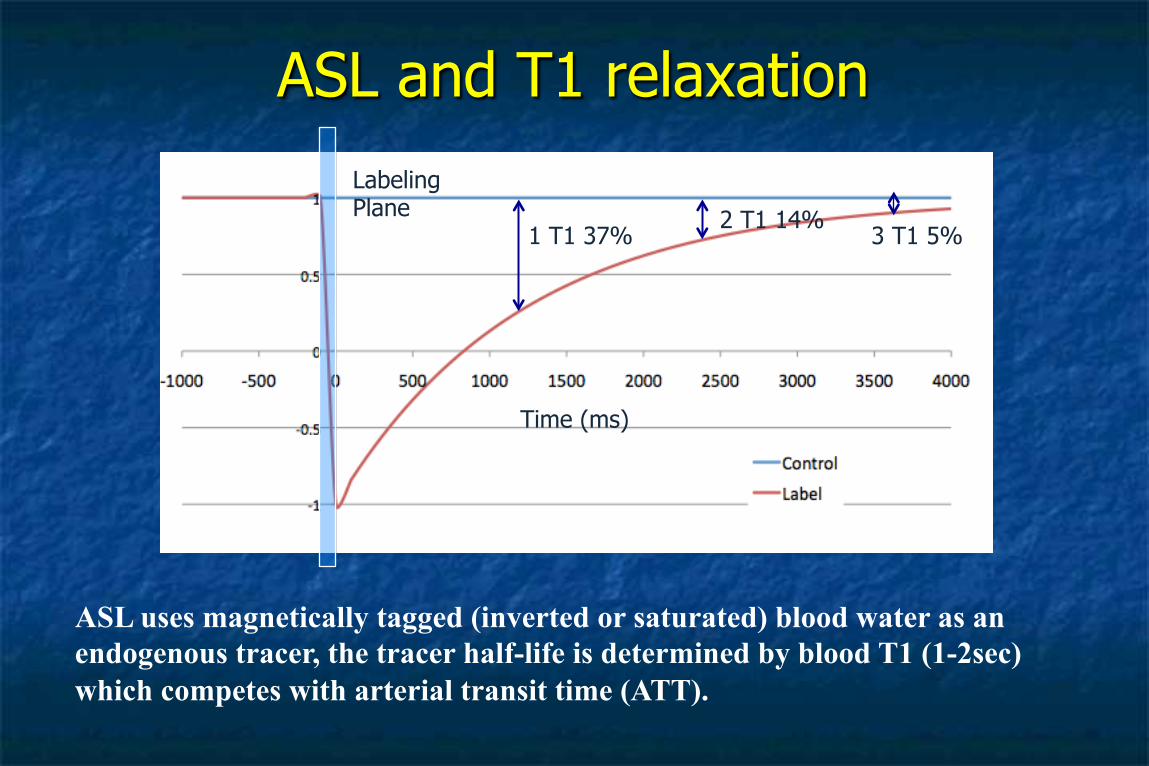
ASL and T1 relaxation
ASL uses magnetically tagged (inverted or saturated) blood water as an endogenous tracer, the tracer half-life is determined by blood T1 (1-2sec) which competes with arterial transit time (ATT).
Time (ms)
Labeling Plane
1 T1 37% 2 T1 14%
3 T1 5%

● Continuous ASL (CASL) vs. Pulsed ASL (PASL) Greater SNR, higher MT effect & SAR, technically challenging ● Pseudo-CASL (pCASL) Combines advantages of PASL and CASL
ASL Strategies

EPISTAR FAIR
Edelman R et al. (1994)
Pulsed ASL (PASL)
Kim SG (1995) Kwong KK et al. (1995)
Spin Tagging Spin Tagging
Spin Tagging
Imaging slice

Continuous ASL (CASL) Flow-driven Adiabatic Inversion
n Constant RF and Gradient Applied n Spins Rotate with Effective Field n Must Be Faster than T2 n Must Be Slower Than Precession Around Effective
Field

Δ Bz B effective
B1
M
Adiabatic Inversion
z
Gz Labeling Plane
Flow

Imaging Slice
Arterial Tagging Plane
Continuous Adiabatic Inversion Geometry
Single Slice Perfusion Image
Control Inversion Plane
B Field Gradient
Williams et al. PNAS 1992
Single Slice CASL

Labeling Geometry Control Geometry
Imaged Slab
Labeling Plane
Alsop DC, Detre JA. Radiology 1998
Amplitude Modulated Control

Perfusion Territory Imaging with Separate Labeling Coil
Zaharchuk G et al MRM 1999

Comparison of PASL and CASL at 3T
CASL improves SNR by 40% compared to PASL, with higher SAR and duty cycle Wang et al. Radiology (2005)

Pseudo-continuous Flow Driven Adiabatic Inversion
Dai et al. MRM 2008; Wu et al. MRM 2007
Use a train of discrete RF and gradient pulses to simulate continuous ASL
CASL
pCASL Label pCASL Control

Δ Bz
B1
Pseudo-continuous Flow Driven Adiabatic Inversion
RF
Gz
label control
RF Gap
Dai et al. MRM 2008; Wu et al. MRM 2007
X
Y

Pseudo-continuous Flow Driven Adiabatic Inversion
n Repeated vs. continuous RF n More compatible with current
MRI RF amplifiers on n Allows product body coil excite/
array receive n 2-3X SNR improvement
n Improved efficiency (~80-90% versus ~70% for AM control) n 2X SNR improvement
Dai et al. MRM 2008; Wu et al. MRM 2007

Vessel Encoding pCASL
Apply Gx or Gy in pCASL to encode L/R ICA and VA using Hadamard scheme
Wong EC MRM (2007)

Transit Time Effects in ASL n Flow is exponentially dependent on transit time n Transit times in human brain are comparable to T1
Wang et al MRM 2002
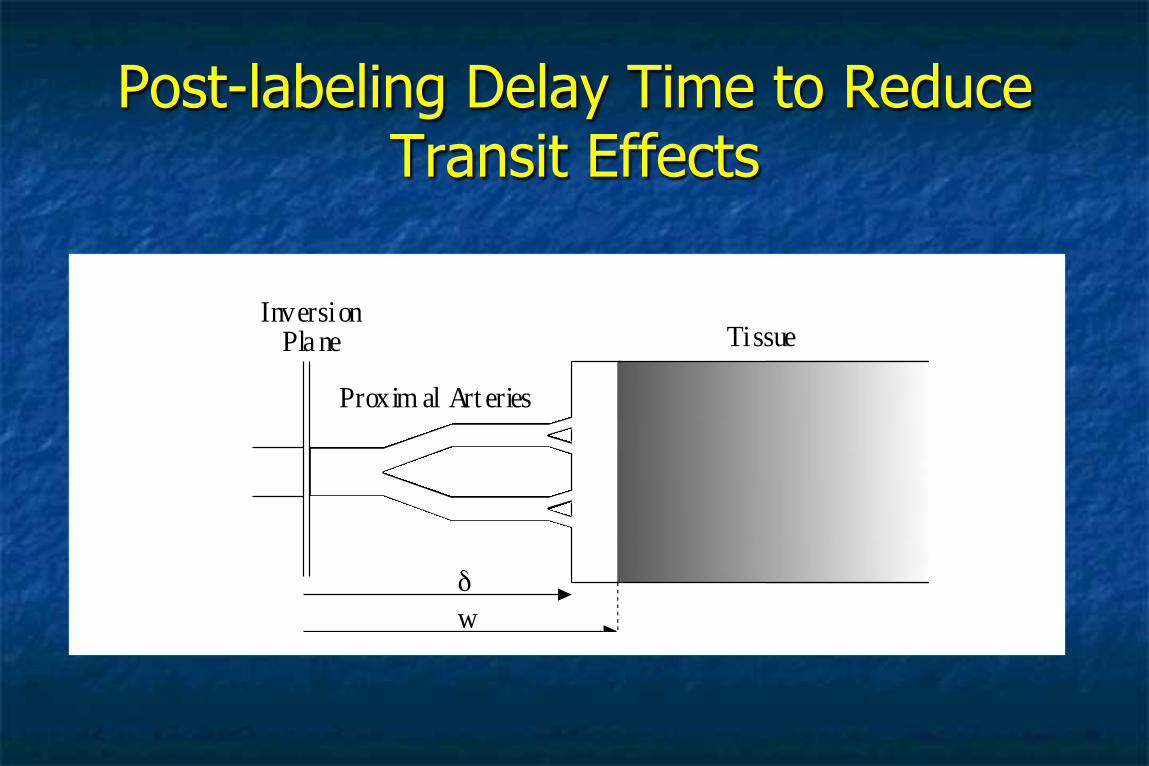
Post-labeling Delay Time to Reduce Transit Effects
δw
Inversion Pla ne Tissue
Proxim al Art eries

Reduced transit artifact with 3T CASL
Improved SNR allows increased delay time to measure perfusion with prolonged transit time
Wang et al. Radiology (2005)

Reduce Temporal Fluctuation using Background Suppression
Ishimori et al Radiol Phys Technol 2011 Fernandez-Seara et al. MRM (2008)

Segmented pCASL 3D BS GRASE
Recommended implementation: 1) pCASL
2) Background suppression
3) Segmented 3D readout without vascular crushing gradients.
Alsop et al MRM (2015) ASL White Paper

Perfusion Model (Single Compartment Instant exchange)
MffMTMM
dtdM
b λ−+
−=
1
0
Detre & Alsop 1999
Venous outflow
Arterial inflow

Perfusion Model (Tracer Kinetic Modeling)
Buxton R et al MRM 1999
dM (t) = 2M0b f C(t)⊗ r(t)•m(t)[ ]{ }
Arterial Input Function
Tissue Residual Function
T1 Relaxation

Dynamic ASL using Look-Locker Sampling
Chen et al. MAGMA (2012)

Limitations of ASL
n Relatively low SNR n ~1% arterial blood signal which relaxes during
arterial transit
n Arterial transit effects
n focal vascular signals and underestimation of tissue perfusion

ASL Benefits from High Fields
Turbo-FLASH based pCASL ASL Signal as a function of field strength
Zuo et al PLoS One 2013
ASL benefits from both increased SNR and prolonged T1 at high field

SMS TFL pCASL with CAIPIRINHA at 3 and 7T
SB
Third-order shimming volume
Imaging slices
Labeling plane
Dielectric pad
MB-3 MB-5
FOV/3 CAIPIRINHA shift
Y. Wang, et al, NeuroImage 113, 2015

SMS TFL pCASL images at 3T Key parameters
• voxel size: 2x2x5 mm3
• post label delay: 1.2 s • background suppression • acquisition time: 5:19min
SB
MB-3 § Identical image acquisition time § Superior pCASL image quality
MB-5 Y. Wang, et al, NeuroImage 113, 2015

SB
MB-3
MB-5
§ Identical image acquisition time § Superior pCASL image quality
Key parameters
• Voxel size: 2x2x5 mm3
• post label delay: 1.2 s
Y. Wang, et al, NeuroImage 113, 2015
SMS TFL pCASL images at 7T

Applications of ASL
• Neurological disorders: stroke, brain tumor, dementia
• Neurodevelopment and genetic effects • Functional and pharmacological MRI:
comparison with BOLD • Neuromodulation

Comparison of 15O-PET and pCASL CBF
pCASL EPI pCASL GRASE PET CBF
Average Pearson correlation (r=0.53, p<0.001) between PET and pCASL CBF
Kilroy et al JMRI (2013)

Comparison of ASL and FDG-PET
CBF (pCASL) CMRglc (FDG-PET)
Cha et al. JCBFM (2013)
20 healthy volunteers (23-59yrs) participated both ASL MRI and FDG-PET scans

Developmental Change of CBF
Representative CBF images across the age span from 3 days to 30yrs acquired using a PASL technique at 1.5T.
Wang et al Clin Dev Neurosci (2009)

3D pCASL GRASE of Infants and Children
Representative CBF maps acquired using pCASL 3D BS GRASE in high risk infants aged 6 weeks and 9 months, and an ASD boy 9yr old.

Serotonin transporter-linked polymorphic region (5-HTTLPR)
• In promoter region of 5-HTT
• Located upstream of transcription initiation site
• Greater 5-HTT mRNA production with l allele
• Greater 5-HT uptake with l allele
Rao et al. Bio Psych (2007)

Representative AIS cases showing hypo-‐perfusion lesions
Wang et al Stroke (2012)

A Pre Post B Pre Post
FLAIR DWI pCASL CBF DSC CBFr0 CBFrm CBV Tmax MTT
Wang et al Stroke (2012)
Representative AIS cases pre and post endovascular intervention

Multi-delay multi-parametric ASL in AIS
Wang et al NI: Clinical (2013)
PCASL GRASE with 4 delays (1.5, 2, 2.5, 3s) allows estimation of
ATT, CBF and arterial CBV (aCBV)

Case 1. CTP shows low perfusion areas in right temporo-patietal lobe with decreased CBF values and elevated MTT and CBV.ASL is in concordance with the results of CTP.
aCBV ATT
Mul$-‐parametric ASL VS. CTP in moya moya disease
Wang et al Eur Radio (2014)
ATT aCBV
Case 2. ASL CBF show hypoperfusion in the right frontal, occipital,temporal-parietal lobes. CTP MTTrha and ASL ATT were prolonged with hypoperfusion on CBF images. ASL aCBV map shows larger hypoperfusion region than CTP CBV.

3T CASL in Brain Tumor
Tumor grading and biopsy guiding Wolf et al. JMRI (2005)
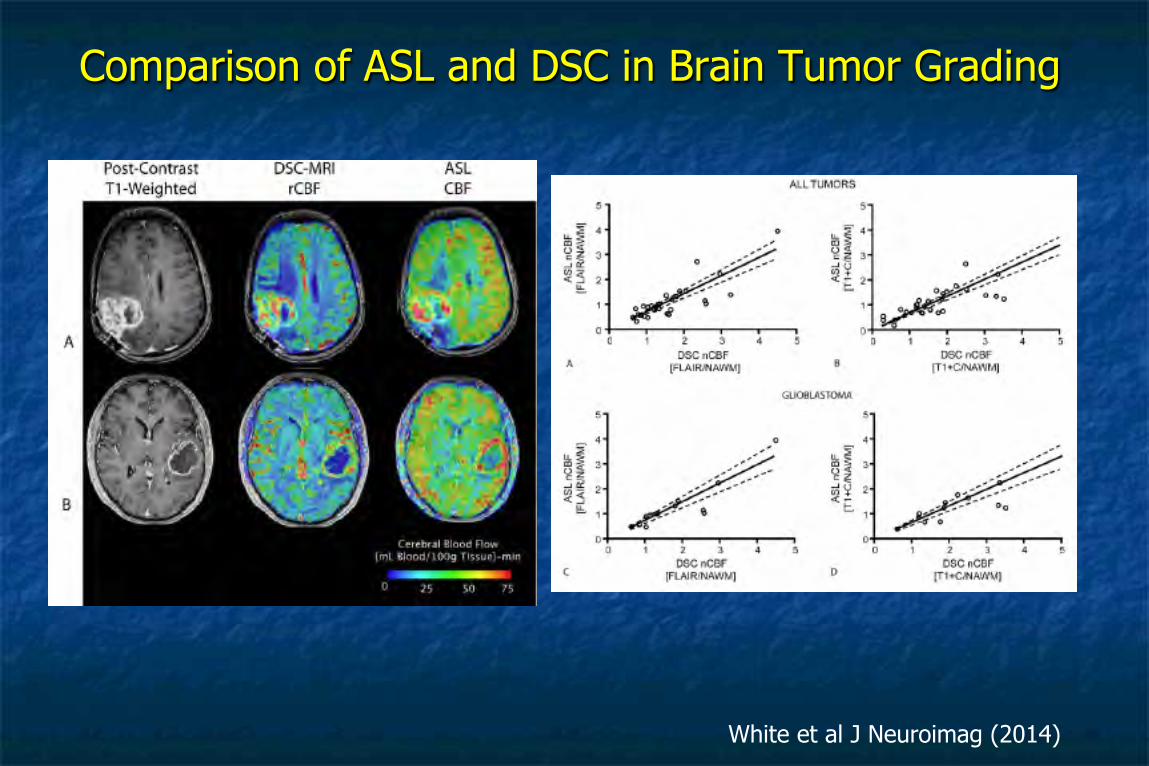
Comparison of ASL and DSC in Brain Tumor Grading
White et al J Neuroimag (2014)

Perfusion MRI in Alzeimer’s Dementia
AD vs. CONTROL
Alsop et al Ann Neuroloy (2000)
AD vs. CONTROL
MCI vs. CONTROL
Johnson et al Radiology (2005) Alsop et al Neuroimage (2008)

behavior"or drug" neural function"
metabolism"
blood flow"
biophysics***"
***site/scan effects"
Physiological Basis of fMRI/phMRI
disease"
blood volume"
BOLD fMRI ASL fMRI

ASL Perfusion fMRI Label
Label
Label
Control
Control
Control
Aguirre et al Neuroimage 2002
Effective TR = 2TR

Temporal Characteristics of Perfusion and BOLD FMRI
1min
N mins (N>5)
30s OFF/ON
1min OFF/ON
2.5min OFF/ON
5min OFF/ON
Nmin OFF/ON(N>5)
OFF ON
Experimental design
24 hr"
ASL"
Wang et al. MRM (2003)

Improved Coverage in Orbitofrontal and Temporal Cortex using ASL
3T ASL perfusion acquired using SE-EPI showing reduced susceptibility artifact compared to BOLD
Wang et al Dev Clin Neurosci (2008)

Spatial Localization Using ASL vs. BOLD fMRI
Detre & Wang, Clinical Neurophysiology 2002

Imaging Session Timeline
Smoke Break ( - 30 ~ min)
➤ Scan 1 Localizer and Resting Baseline Scan
Pre - Cue Craving Questionnaire
CASL Perfusion fMRI (10 min Smoking or Neutral Cues)
Post - Cue Craving Questionnaire
High Resolution Structural Scan
Smoke Break ( -30 ~ min)
➤ Scan 2 Localizer and Resting Baseline Scan
Pre - Cue Craving Questionnaire
CASL Perfusion fMRI (10 min Smoking Cue or Neutral Cue)
Post - Cue Craving Questionnaire
Diffusion Tensor Imaging (DTI) Scan
Perfusion fMRI of cigarette-induced craving
Franklin et al. NPP 2007

Neural Substrate of Psychological Stress
" Pressured subtraction task " 23 Subjects (25.5 ± 2.5 y, 11F) " 7 Control subjects (4F) " 3T CASL, AMC, PLD=1sec " 4 X 8 min scans
– Baseline – Low stress – High stress – Baseline
" Self rating of stress and anxiety " Salivary cortisol " Heart rate
Wang et al. PNAS 2005

Correlation of CBF and Stress: RPFC
Wang et al. PNAS 2005

Neural Correlates of Mental Fatigue
Lim et al. Neuroimage 2010
PVT vs. Baseline
Post-task CBF vs. Pre-task CBF

Similarity and Reliability of Resting Brain Networks in ASL and BOLD rs-fMRI
Jann et al. NeuroImage (2015)
Test-retest analyses indicated more reliable networks in BOLD (average ICC: 0.905±0.033 between sessions; 0.885±0.052 between scanners) than ASL (0.545±0.048 / 0.575±0.059). ASL provided highly reproducible network-specific CBF measurements (average ICC: 0.956±0.010 / 0.939±0.026).

Altered Perfusion and Functional Connectivity in Autism Spectrum Disorders
Jann et al. Brain & Behavior (2015)
17 youth with ASD (13.8±2.0yrs; 4F) and 22 matched typically developing (12.8±3.6yrs; 3F) children.
• Frontotemporal hyperperfusion and hypoperfusion in the dorsal anterior cingulate cortex.
• Suggest delayed development of frontotemporal regions

Altered Perfusion and Functional Connectivity in Autism Spectrum Disorders
Jann et al. Brain & Behavior (2015)
Increased local FC in the anterior module of the default mode network (DMN) accompanied by decreased CBF in the same area.
ASD exhibits increased functional connectivity (FC) along with reduced cerebral blood flow (CBF) in the dorsal anterior cingulate cortex (dACC)

Advantages of ASL perfusion for phMRI
Diagram of Neurovascular Coupling Iadecola & Nedergaard, Nat Neurosci 2007
• CBF is a quantitative physiological parameter
• Coupled to neuronal activity through neurovascular coupling
• BOLD reflects complex interplay of CBF, CBV and CMRO2
• ASL CBF can quantify brain activity both during resting state baseline (trait) and task activation (state)
• BOLD lacks absolute quantification of the “baseline” state.

Cortical responses to amphetamine exposure studied by pCASL MRI
Nortin et al, Neuroimage, 2012
TIME
DV
subject 1
TIME
DV
0 2 4 6 8 10
subject 2
TIME
DV
3050
70
subject 3
TIME
DV
3050
70
subject 4
TIME
DV
subject 5
TIME
DV
subject 6
TIME
DV
subject 7
TIME
DV
subject 8
TIME
DV
3050
70
subject 9
TIME
DV
0 2 4 6 8 10
3050
70
subject 10
TIME
DV
subject 11
TIME
DV
0 2 4 6 8 10
subject 12Cer
ebra
l Blo
od F
low
(m
L/10
0g/m
in)
Time after dose (h)
• 12 healthy subjects double blinded design • 6 20mg d-amphetamine; 6 placebo • ASL and blood samples were collected 10 time points during 10hr after dose

Modulatory effects of ketamine, risperidone and lamotrigine on resting brain perfusion
Shcherbinin et al, Psychopharmology, 2015
• 16 healthy subjects double blinded design
• Ketamine infusion paired with Risperidone, Lamotrigine, or placebo
Ketamine Risperidone
GPC CBF rCBF
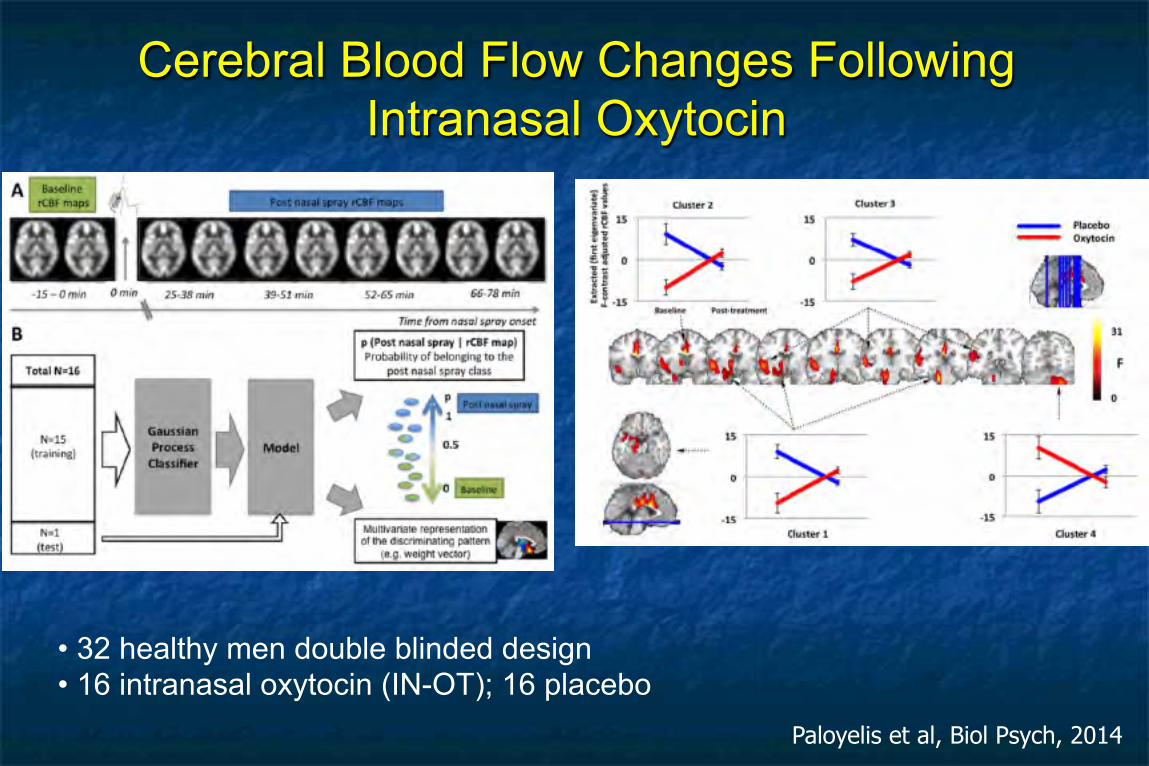
Cerebral Blood Flow Changes Following Intranasal Oxytocin
Paloyelis et al, Biol Psych, 2014
• 32 healthy men double blinded design • 16 intranasal oxytocin (IN-OT); 16 placebo

CBF changes of tDCS
Anodal tDCS increased 17.1% in rCBF during stimulation and increase during off, while cathodal tDCS increased 5.6% in rCBF during stimulation but decrease during post-stimulus period.
Zheng et al Neuroimage 2012

CBF changes of tDCS
Anodal tDCS induced CBF changes are correlated with current intensity while cathodal tDCS induced CBF are not correlated with current
Zheng et al Neuroimage 2012

Neurophysiological Effect of tDCS Assessed by ASL Perfusion MRI
Jog et al ISMRM 2016
Dose response curves of increased CBF induced by tDCS * Indicates significant ANOVA (*) indicates trend
Anode Cathode

tDCS Effects on Stress
Antel et al HBM 2014
Red: Anode > Cathode Green: Anode > Sham Saliva cortisol response
CBF
Right mPFC anodal tDCS reduce stress while cathodal increase stress responses

Concurrent ASL/BOLD fMRI
Yan, Jog et al NeuroImage (Under revision)
Dual-echo pCASL fMRI of 2-back working memory in 91 children 7-17yrs age

Take Home Messages n ASL white paper recommends pCASL with
background suppressed 3D acquisitions n ASL perfusion fMRI is an important
quantitative tool complementing BOLD fMRI n ASL perfusion fMRI has unique value in
characterizing state/trait effects and pharmacological and neuromodulation
n Further technical developments allow increased sensitivity and spatiotemporal resolution