
ART - AAQR
13
ART Aerosol and Air Quality Research, 19: 2518–2530, 2019 Copyright © Taiwan Association for Aerosol Research ISSN: 1680-8584 print / 2071-1409 online doi: 10.4209/aaqr.2019.05.0276 Source Identification on High PM 2.5 Days Using SEM/EDS, XRF, Raman, and Windblown Dust Modeling Jeff Wagner * , Zhong-Min Wang, Sutapa Ghosal, Stephen Wall † Environmental Health Laboratory, California Department of Public Health, Richmond, CA 94804, USA ABSTRACT When community exposures to PM 2.5 are high, identification of the particle sources enables more effective control and assessment of health impacts. This study demonstrates forensic particle analysis methods that can be used when only limited, archived samples are available. Federal reference method (FRM) filters from seven high PM 2.5 days were analyzed using optical and electron microscopy, X-ray fluorescence, and Raman micro-spectroscopy to determine individual particle morphology and composition, together with supplemental wind roses, GIS mapping, FRM inlet penetration calculations, and windblown dust modeling. This approach identified three distinct sources of high PM 2.5 measurements: 1) local, wind- blown dust from an atypical direction, consistent with modeling predictions for a normally operating PM 2.5 inlet challenged with a high concentration of windblown dust particles, potentially enhanced by re-entrainment of particles from within the inlet, 2) wintertime, regional, hygroscopic, nitrogen- and sulfur-rich salts, consistent with ammonium nitrate and ammonium sulfate, and 3) sampling or documentation error. This approach can be used in any location in which regulatory PM filters and other air quality data are available. Keywords: Air quality; Area sources, Mineral dust; Measurement techniques; PM 2.5 ; Secondary aerosol; Source apportionment. INTRODUCTION Rural communities can be exposed to airborne particulate matter with aerodynamic diameters less than 2.5 μm (PM 2.5 ) from a range of compositions and sources, including windblown dust, biological and plant aerosols, crop burning, and diesel exhaust from construction and vehicles (Record and Baci, 1980; Watson and Chow, 2001; Harnly et al., 2012). When measurements of community exposures to PM 2.5 are determined to be high compared to health standards, identification of the most prominent PM 2.5 sources enables more effective control and assessment of potential health impacts. Where feasible, high PM 2.5 measurements of concern can be augmented with additional air measurements, known source profiles, and chemical mass balance (CMB) or positive matrix factorization (PMF) modeling to quantify the relative PM 2.5 source contributions statistically (Oh et al., 2011; Wang et al., 2012). In some cases, however, limited resources may preclude any supplemental sampling. In addition, if an † currently retired. * Corresponding author. Tel.: 1-510-620-2816 E-mail address: [email protected] investigation occurs years after the original measurements, new measurements may no longer be relevant to the historical conditions. Further, if the high PM 2.5 measurements of concern were made with regulatory monitors, the data may only exist for specific, scheduled days and locations. When CMB and PMF analyses are not possible due to the availability of just a few samples, alternative methods that can provide insight into likely sources are needed, even if semi-quantitative. PM 2.5 data from monitoring networks of U.S. EPA Federal Reference Method (FRM) samplers are one example of data that are routinely reviewed to understand local air quality and develop control strategies (U.S. EPA, 2008). Conventional FRM gravimetric filter analyses yield only total PM mass, however, and are of limited value in assessing PM 2.5 source contributions. Bulk filter analysis by inductively coupled plasma mass spectrometry or X-ray fluorescence (XRF) are standard methods for determining composition on PM 2.5 filters, are capable of integrating over the entire filter, and are useful for broad source attributions (Ham et al., 2010). Scanning electron microscopy plus energy-dispersive x-ray spectroscopy (SEM/EDS) additionally enables characterization of individual particle size, morphology, and elemental composition, which can be used to provide more detailed source inferences (Watson et al., 2012; Wagner et al., 2013). Raman micro-spectroscopy can also be used to characterize individual particles’ molecular chemistry, including organic compounds and specific mineral
Transcript of ART - AAQR

ART
Aerosol and Air Quality Research, 19: 2518–2530, 2019 Copyright © Taiwan Association for Aerosol Research ISSN: 1680-8584 print / 2071-1409 online doi: 10.4209/aaqr.2019.05.0276
Source Identification on High PM2.5 Days Using SEM/EDS, XRF, Raman, and Windblown Dust Modeling Jeff Wagner*, Zhong-Min Wang, Sutapa Ghosal, Stephen Wall†
Environmental Health Laboratory, California Department of Public Health, Richmond, CA 94804, USA ABSTRACT
When community exposures to PM2.5 are high, identification of the particle sources enables more effective control and assessment of health impacts. This study demonstrates forensic particle analysis methods that can be used when only limited, archived samples are available. Federal reference method (FRM) filters from seven high PM2.5 days were analyzed using optical and electron microscopy, X-ray fluorescence, and Raman micro-spectroscopy to determine individual particle morphology and composition, together with supplemental wind roses, GIS mapping, FRM inlet penetration calculations, and windblown dust modeling. This approach identified three distinct sources of high PM2.5 measurements: 1) local, wind-blown dust from an atypical direction, consistent with modeling predictions for a normally operating PM2.5 inlet challenged with a high concentration of windblown dust particles, potentially enhanced by re-entrainment of particles from within the inlet, 2) wintertime, regional, hygroscopic, nitrogen- and sulfur-rich salts, consistent with ammonium nitrate and ammonium sulfate, and 3) sampling or documentation error. This approach can be used in any location in which regulatory PM filters and other air quality data are available. Keywords: Air quality; Area sources, Mineral dust; Measurement techniques; PM2.5; Secondary aerosol; Source apportionment. INTRODUCTION
Rural communities can be exposed to airborne particulate matter with aerodynamic diameters less than 2.5 µm (PM2.5) from a range of compositions and sources, including windblown dust, biological and plant aerosols, crop burning, and diesel exhaust from construction and vehicles (Record and Baci, 1980; Watson and Chow, 2001; Harnly et al., 2012). When measurements of community exposures to PM2.5 are determined to be high compared to health standards, identification of the most prominent PM2.5 sources enables more effective control and assessment of potential health impacts.
Where feasible, high PM2.5 measurements of concern can be augmented with additional air measurements, known source profiles, and chemical mass balance (CMB) or positive matrix factorization (PMF) modeling to quantify the relative PM2.5 source contributions statistically (Oh et al., 2011; Wang et al., 2012). In some cases, however, limited resources may preclude any supplemental sampling. In addition, if an † currently retired. * Corresponding author. Tel.: 1-510-620-2816 E-mail address: [email protected]
investigation occurs years after the original measurements, new measurements may no longer be relevant to the historical conditions. Further, if the high PM2.5 measurements of concern were made with regulatory monitors, the data may only exist for specific, scheduled days and locations. When CMB and PMF analyses are not possible due to the availability of just a few samples, alternative methods that can provide insight into likely sources are needed, even if semi-quantitative.
PM2.5 data from monitoring networks of U.S. EPA Federal Reference Method (FRM) samplers are one example of data that are routinely reviewed to understand local air quality and develop control strategies (U.S. EPA, 2008). Conventional FRM gravimetric filter analyses yield only total PM mass, however, and are of limited value in assessing PM2.5 source contributions. Bulk filter analysis by inductively coupled plasma mass spectrometry or X-ray fluorescence (XRF) are standard methods for determining composition on PM2.5 filters, are capable of integrating over the entire filter, and are useful for broad source attributions (Ham et al., 2010). Scanning electron microscopy plus energy-dispersive x-ray spectroscopy (SEM/EDS) additionally enables characterization of individual particle size, morphology, and elemental composition, which can be used to provide more detailed source inferences (Watson et al., 2012; Wagner et al., 2013). Raman micro-spectroscopy can also be used to characterize individual particles’ molecular chemistry, including organic compounds and specific mineral

Wagner et al., Aerosol and Air Quality Research, 19: 2518–2530, 2019 2519
groups (Batonneau et al., 2006; Reid et al., 2007; Ghosal and Wagner, 2013). SEM/EDS and Raman methods typically examine regular arrays or randomly-selected sub-regions of a sample only, so assumptions must be made that these regions are representative of the entire sample. Any inferences about likely sources gained from the above laboratory results can be further evaluated against publicly available databases of regional meteorology, PM2.5 trends, land cover, and area sources (Wagner and Casuccio, 2013), in addition to knowledge of any potential artifacts associated with the sampling devices used.
This work presents a forensic analysis approach that integrates laboratory analyses, publicly available data, and PM2.5 sampling considerations to identify the likely sources of high PM2.5 in a community when only limited, archived samples are available. The approach is demonstrated on FRM PM2.5 air samples from a rural California community on seven targeted, high-PM2.5 days in 2013–2015. Individual particles on these filters were analyzed using a combination of optical microscopy, SEM/EDS, and Raman micro-spectroscopy to determine inferences based on particle morphology and composition. These results were combined with bulk XRF filter analyses, supplemental wind roses, geospatial database mapping, and FRM inlet and windblown dust modeling to aid in interpretation of the microscopy data. METHODS
Twelve 24-hour FRM PM2.5 samples collected on 37 mm diameter Teflon filters (Table 1) were shipped to the lab in standard, barcoded, plastic Petri-slide containers. The local monitoring agency that collected them provided gravimetric PM2.5 concentrations, site operator notes, and a PM2.5 filter blank. The filters had been collected by the local air district using FRM samplers with very sharp cut cyclone (VSCC) PM2.5 inlets.
The location at which seven high PM2.5 values were recorded was sited at a municipal airport and was denoted Location A. The FRM at this site was at ground level, with an inlet height of approximately 2 m. A comparison FRM PM2.5 site within the same town, approximately 7 miles
northwest, was employed as a reference site and was denoted Location B. The FRM at this site was on a rooftop, with an inlet height 6 m above ground.
The first filter targeted for analysis was filter A2, collected in May 2013 at Location A on a high PM2.5 day. Five other FRM filters were analyzed for comparison: filters A1 and A3, collected on lower PM2.5 days immediately before and after A2 at the same site, and filters B1, B2, and B3, collected on the same days at the reference site. Six additional high-PM2.5 filters collected from Location A in winter 2013–2014 (A4–A6) and winter 2014–2015 (A7–A9) were analyzed as well.
Filters were first documented photographically, then inspected using a low-power, Leica SD6 stereozoom reflecting light microscope. Subsequently, non-destructive surveys were conducted on the uncut, whole filters using scanning electron microscopy (SEM)/energy-dispersive spectroscopy (EDS), X-ray fluorescence (XRF), and Raman microspectroscopy (RMS).
SEM/EDS analysis was conducted with a FEI XL30 Environmental SEM with tungsten source and Thermo Fisher Scientific Noran System 7 EDS system. No conductive coating was applied to facilitate the use of multiple analytical techniques. Improved image resolution and particle stability were achieved relative to typical high-vacuum SEM by injecting an atmosphere of 0.5–1 mBar of water vapor. Manual analyses were conducted with a back-scattered electron (BSE) detector to identify major constituents and any distinctive trace species (e.g., heavy metals.) EDS spectra were obtained from both single particles and larger integrated areas 100–200 µm across. The EDS weight percent calculations excluded oxygen, as well as carbon and fluorine from the Teflon filter background. As such, any carbon contribution from particulate soot or organic matter could not be measured in these samples. EDS measurements were calibrated with a NIST 2066 standard, but are only semi quantitative for non-flat specimens. In addition, higher resolution SEM imaging also was conducted with a second instrument, a Tescan MIRA3 field emission SEM (FESEM) in high vacuum mode with a BSE detector.
XRF analysis was performed on select samples with a Panalytical Epsilon 5 (Panalytical Inc. Westborough, MA)
Table 1. Analyzed FRM filters (37 mm diameter Teflon) and PM2.5 values recorded by monitoring agency. Filters denoted with * were targeted as high PM2.5 days.
Sampling Location Filter ID Sampling Date PM2.5 (µg m–3) A A1 5/4/13 18.6 A A2* 5/5/13 167.3 A A3 5/6/13 11.0 B B1 5/4/13 20.0 B B2 5/5/13 24.0 B B3 5/6/13 8.3 A A4* 12/18/13 111.0 A A5* 1/2/14 76.7 A A6* 1/5/14 69.5 A A7* 11/1/14 81.6 A A8* 11/7/14 91.0 A A9* 1/9/15 83.2
Wagner et al., Aerosol and Air Quality Research, 19: 2518–2530, 2019 2520
to determine the integrated composition of the entire filter for comparison to the more localized SEM/EDS data. The XRF was calibrated with commercially available air filter standards and a blank sample from Micromatter (Vancouver, Canada). The standards were composed of pure elements and compounds deposited on 37 mm Nucleopore filters. The sample air filters were placed in a customized stainless steel air filter sample holder (Panalytical Inc.) along with an X-ray monitor, an air filter monitor, and the filter blank, and were analyzed using an automated sequence.
RMS analysis was conducted to identify particle mineral phases on three FRM PM2.5 filters from May 2013 (A1, A2, B2). Particles were transferred from randomly selected filter areas by touching either carbon tabs or aluminum foil mounted on SEM stubs to the filter surface. The spatial resolution of Raman acquisitions with the 100x objective was typically on the order of 1 µm. Analyses were performed using either a Renishaw inVia or Bruker Senterra dispersive Raman microscope with both 785 nm and 532 nm lasers. Particles were identified using an automated spectral search algorithm against a spectral library of known compounds (GRAMS Spectral ID).
Supplemental wind roses were generated using public, hourly wind data from the Location B station in 2013 (http://www.arb.ca.gov/aqmis2/aqmis2.php and http://www. airnowtech.org) and a custom Microsoft Excel spreadsheet. Wind data for location A could not be used for generating wind roses due to missing data for several dates in 2013. In instances when the data was available at both sites simultaneously, wind directions and lower wind speed magnitudes were generally consistent. In instances of higher winds, Location A tended to record higher speeds than Location B. Publicly available FRM PM2.5 data at Locations A and B and beta attenuation monitor (BAM) PM2.5 data at Location B were obtained from the U.S. EPA AQS Data Mart (https://aqs.epa.gov/api) for comparison purposes. Geographic information systems (GIS) mapping was used as an aid to interpret the wind data and the impact of local surroundings. Public data from the Landsat satellite-based GAP National Land Cover Database (U.S. Geological Survey, 2011) were imported and mapped with ArcMap (ESRI, Redlands, CA).
Modeling was conducted to calculate the theoretical penetration of windblown dust particles through a FRM PM10 head preceding a VSCC PM2.5 inlet. The particle size distribution input to the model was a trimodal aerosol common to many measured windblown dusts worldwide (Alfaro et al., 1998). The mass median diameter for the three modes of this trimodal aerosol were 1.5 µm, 6.7 µm, and 14.2 µm, respectively, and the geometric standard deviations were 1.7, 1.6, and 1.5. Two high-wind cases were modeled, also derived from Alfaro et al’s measurements of windblown dust size distributions: a) turbulent friction velocity = u* = 66 cm s–1, for which the mass percentages of the three modes are 20%, 70%, and 10%, respectively, and b) u* = 52 cm s–1, for which the mass percentages of the three modes are 0%, 80%, and 20%, respectively. These trimodal distributions were then multiplied by an empirical PM10 inlet penetration curve (Keywood, 1999) and an approximation to the ideal well impactor ninety-six (WINS) PM2.5 inlet efficiency
curve (Zeng, 2006), the latter of which is very similar to measured VSCC data (Kenny et al., 2004). Aerodynamic particle sizes were converted to physical sizes and masses using an assumed dynamic shape factor, volume shape factor, and particle density of 1.36, 1.34, and 2.0 g cm–3, respectively (Wagner and Leith, 2001). Finally, the overall magnitude of the size distribution was adjusted for each the two tested wind speed cases so that PM2.5 = 167 µg m–3, corresponding to sample A2. RESULTS Stereozoom Microscopy
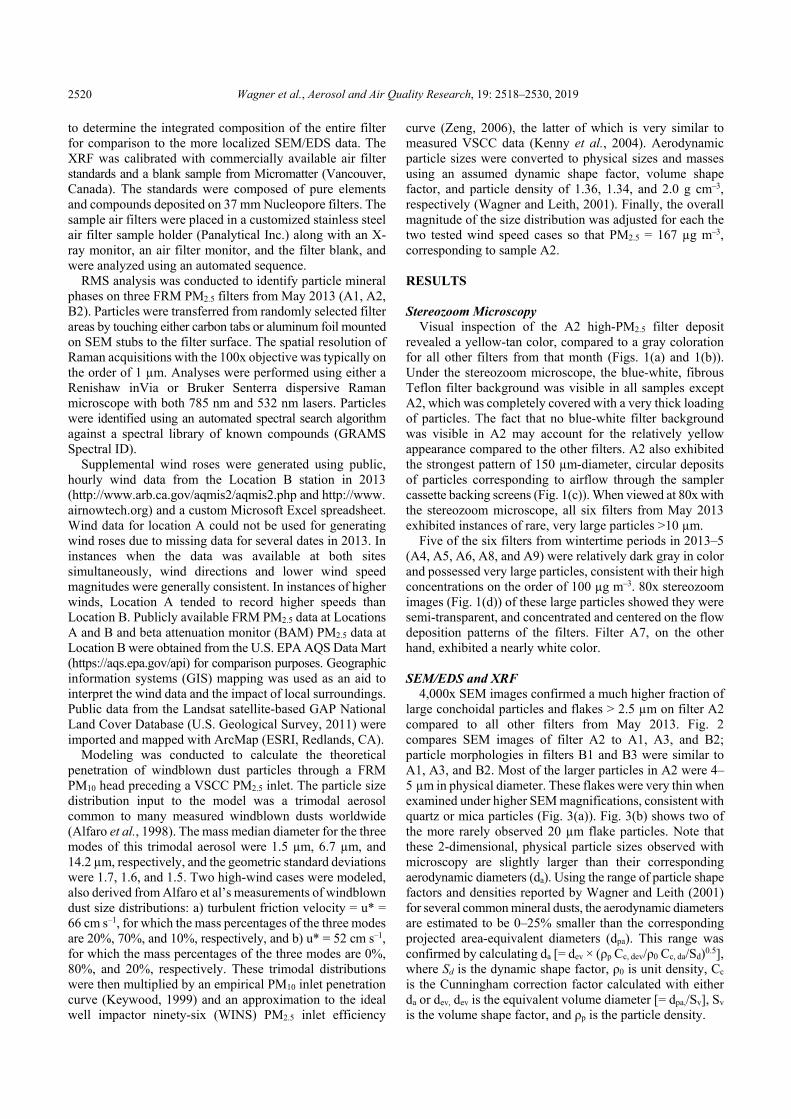
Visual inspection of the A2 high-PM2.5 filter deposit revealed a yellow-tan color, compared to a gray coloration for all other filters from that month (Figs. 1(a) and 1(b)). Under the stereozoom microscope, the blue-white, fibrous Teflon filter background was visible in all samples except A2, which was completely covered with a very thick loading of particles. The fact that no blue-white filter background was visible in A2 may account for the relatively yellow appearance compared to the other filters. A2 also exhibited the strongest pattern of 150 µm-diameter, circular deposits of particles corresponding to airflow through the sampler cassette backing screens (Fig. 1(c)). When viewed at 80x with the stereozoom microscope, all six filters from May 2013 exhibited instances of rare, very large particles >10 µm.
Five of the six filters from wintertime periods in 2013–5 (A4, A5, A6, A8, and A9) were relatively dark gray in color and possessed very large particles, consistent with their high concentrations on the order of 100 µg m–3. 80x stereozoom images (Fig. 1(d)) of these large particles showed they were semi-transparent, and concentrated and centered on the flow deposition patterns of the filters. Filter A7, on the other hand, exhibited a nearly white color. SEM/EDS and XRF
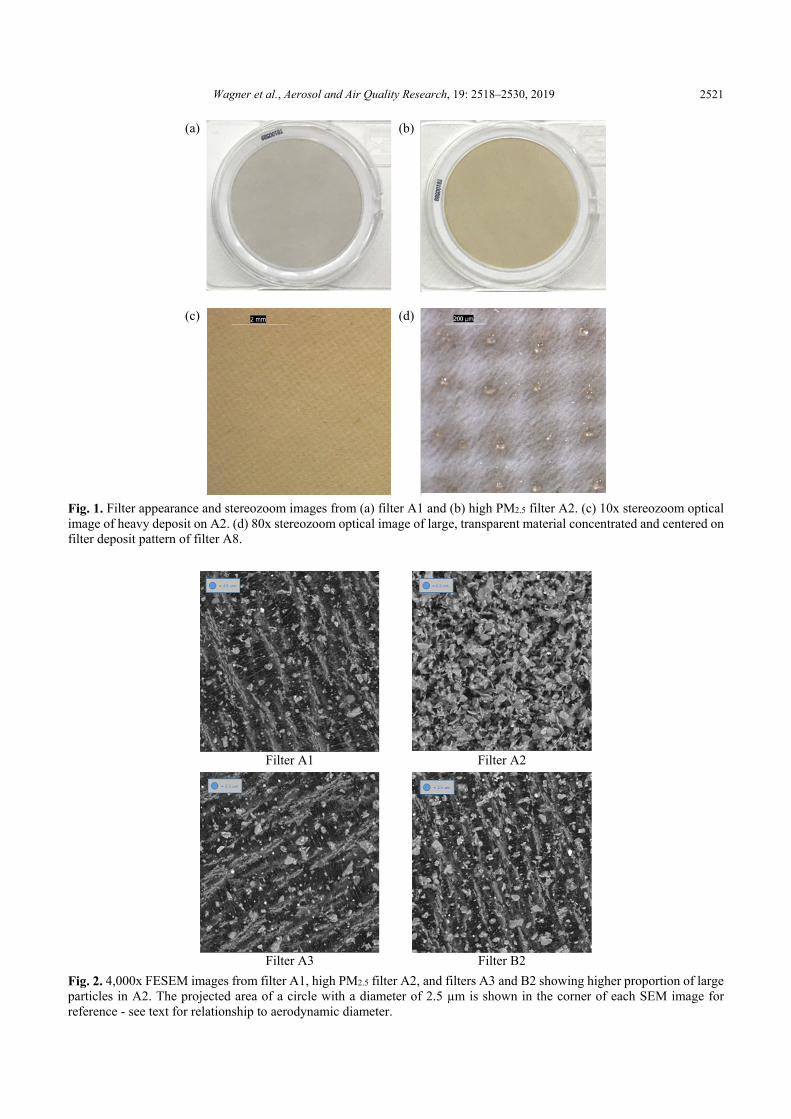
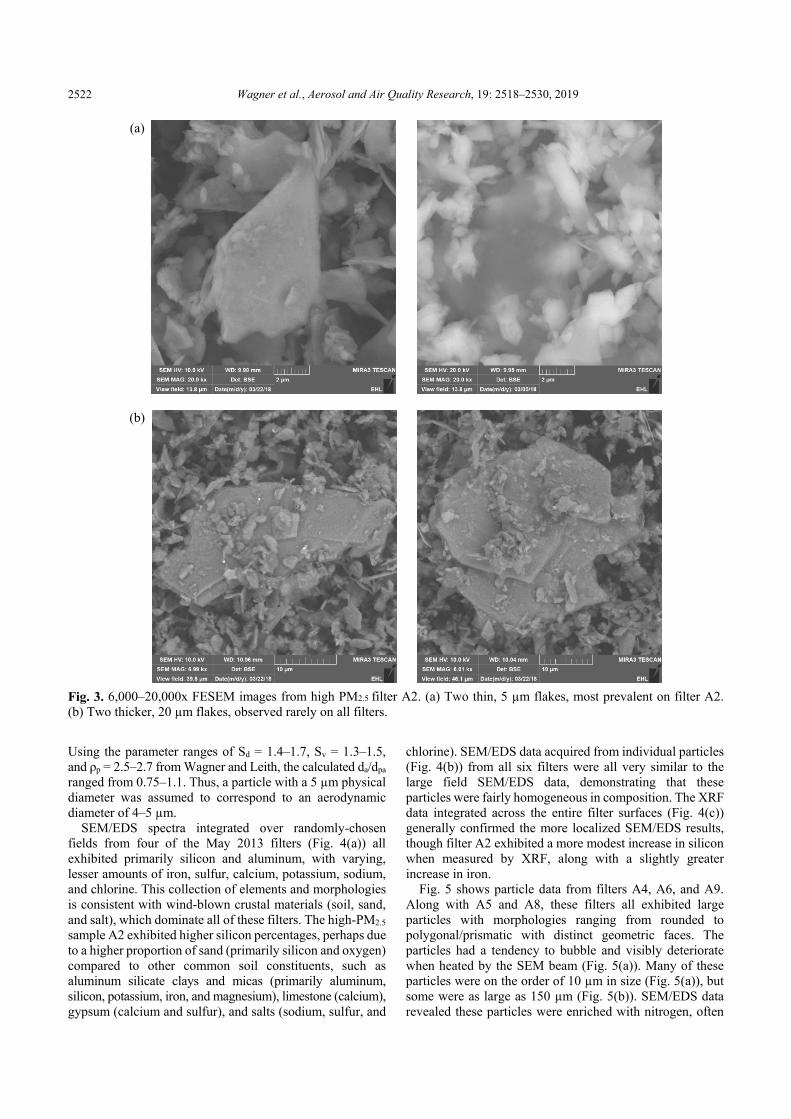
4,000x SEM images confirmed a much higher fraction of large conchoidal particles and flakes > 2.5 µm on filter A2 compared to all other filters from May 2013. Fig. 2 compares SEM images of filter A2 to A1, A3, and B2; particle morphologies in filters B1 and B3 were similar to A1, A3, and B2. Most of the larger particles in A2 were 4–5 µm in physical diameter. These flakes were very thin when examined under higher SEM magnifications, consistent with quartz or mica particles (Fig. 3(a)). Fig. 3(b) shows two of the more rarely observed 20 µm flake particles. Note that these 2-dimensional, physical particle sizes observed with microscopy are slightly larger than their corresponding aerodynamic diameters (da). Using the range of particle shape factors and densities reported by Wagner and Leith (2001) for several common mineral dusts, the aerodynamic diameters are estimated to be 0–25% smaller than the corresponding projected area-equivalent diameters (dpa). This range was confirmed by calculating da [= dev × (ρp Cc, dev/ρ0 Cc, da/Sd)0.5], where Sd is the dynamic shape factor, ρ0 is unit density, Cc is the Cunningham correction factor calculated with either da or dev, dev is the equivalent volume diameter [= dpa,/Sv], Sv is the volume shape factor, and ρp is the particle density.
Wagner et al., Aerosol and Air Quality Research, 19: 2518–2530, 2019 2521
(a) (b)
(c) (d)
Fig. 1. Filter appearance and stereozoom images from (a) filter A1 and (b) high PM2.5 filter A2. (c) 10x stereozoom optical image of heavy deposit on A2. (d) 80x stereozoom optical image of large, transparent material concentrated and centered on filter deposit pattern of filter A8.
Filter A1 Filter A2
Filter A3 Filter B2
Fig. 2. 4,000x FESEM images from filter A1, high PM2.5 filter A2, and filters A3 and B2 showing higher proportion of large particles in A2. The projected area of a circle with a diameter of 2.5 µm is shown in the corner of each SEM image for reference - see text for relationship to aerodynamic diameter.
Wagner et al., Aerosol and Air Quality Research, 19: 2518–2530, 2019 2522
(a)
(b)
Fig. 3. 6,000–20,000x FESEM images from high PM2.5 filter A2. (a) Two thin, 5 µm flakes, most prevalent on filter A2. (b) Two thicker, 20 µm flakes, observed rarely on all filters.
Using the parameter ranges of Sd = 1.4–1.7, Sv = 1.3–1.5, and ρp = 2.5–2.7 from Wagner and Leith, the calculated da/dpa ranged from 0.75–1.1. Thus, a particle with a 5 µm physical diameter was assumed to correspond to an aerodynamic diameter of 4–5 µm.
SEM/EDS spectra integrated over randomly-chosen fields from four of the May 2013 filters (Fig. 4(a)) all exhibited primarily silicon and aluminum, with varying, lesser amounts of iron, sulfur, calcium, potassium, sodium, and chlorine. This collection of elements and morphologies is consistent with wind-blown crustal materials (soil, sand, and salt), which dominate all of these filters. The high-PM2.5 sample A2 exhibited higher silicon percentages, perhaps due to a higher proportion of sand (primarily silicon and oxygen) compared to other common soil constituents, such as aluminum silicate clays and micas (primarily aluminum, silicon, potassium, iron, and magnesium), limestone (calcium), gypsum (calcium and sulfur), and salts (sodium, sulfur, and
chlorine). SEM/EDS data acquired from individual particles (Fig. 4(b)) from all six filters were all very similar to the large field SEM/EDS data, demonstrating that these particles were fairly homogeneous in composition. The XRF data integrated across the entire filter surfaces (Fig. 4(c)) generally confirmed the more localized SEM/EDS results, though filter A2 exhibited a more modest increase in silicon when measured by XRF, along with a slightly greater increase in iron.
Fig. 5 shows particle data from filters A4, A6, and A9. Along with A5 and A8, these filters all exhibited large particles with morphologies ranging from rounded to polygonal/prismatic with distinct geometric faces. The particles had a tendency to bubble and visibly deteriorate when heated by the SEM beam (Fig. 5(a)). Many of these particles were on the order of 10 µm in size (Fig. 5(a)), but some were as large as 150 µm (Fig. 5(b)). SEM/EDS data revealed these particles were enriched with nitrogen, often

Wagner et al., Aerosol and Air Quality Research, 19: 2518–2530, 2019 2523
sulfur, and occasionally aluminum (Figs. 4(d) and 4(e)). The higher resolution FESEM revealed a similar substance, apparently coalesced into a liquid-like form across some of the PTFE filter fibers (Fig. 5(c)). The lower resolution of the SEM/EDS technique could not clearly image these coalesced inter-fiber areas, but did confirm small EDS nitrogen peaks in the apparent deposit regions. This collection of morphologies and chemical elements is consistent with hygroscopic,
nitrogen-rich salts such as ammonium nitrate and ammonium sulfate, and possibly aluminum sulfate. XRF of filters A4, A5, A8, and A9 confirmed the dominance of sulfur (Fig. 4(f)); nitrogen is not detectable with this XRF method. Filter A9 additionally exhibited particles with a needle morphology and stronger sulfur peaks, as well as less prevalent combustion PM with soot morphology (Fig. 5(d)).
Filter A7 exhibited very few particles in the SEM (Fig. 5(e)).
Fig. 4. Elemental compositions of PM2.5 filter particles for major elements excluding carbon, oxygen, and fluorine. (a) SEM/EDS large area acquisitions from May 2013, with error bars representing the standard deviations of multiple acquisitions from the same filter. (b) Typical single particle SEM/EDS from high PM2.5 filter A2. (c) XRF whole-filter acquisitions from May 2013 filters. (d)–(e) Single particle SEM/EDS from filter A4 particles in Fig. 5(b) showing nitrogen and sulfur peaks. (f) XRF whole-filter acquisitions from four wintertime 2013–2015.

Wagner et al., Aerosol and Air Quality Research, 19: 2518–2530, 2019 2524
(a) (b)
(c) (d)
(e) (f)
Fig. 5. Data from 2013–2015 high PM2.5 wintertime filters. (a) Large, nitrogen-enriched particle in filter A6 with prismatic geometry (8kx FESEM) (b) Large and smaller particles on filter A4 (500x SEM; see Figs. 4(d) and 4(e) for EDS). (c) Coalesced material along filter fibers in filter A9 (8kx FESEM). (d) Filter A9 soot agglomerates from combustion (60kx FESEM). PTFE filter structures dominated in (e) Filter A7 (8kx FESEM), and (f) PM2.5 filter blank (4kx FESEM).
The low particle loading on filter A7 revealed mostly PTFE background structures, comparable to the PM2.5 filter blank (Fig. 5(f)). Raman Micro-spectroscopy
Initial RMS analyses of filters A2 and B2 using 532 nm laser indicated the presence of carbon. However, an overwhelming fluorescence response made the analyses challenging. Subsequent analyses with 785 nm laser improved the data quality. Filter A2 was marked by the presence of crustal minerals such as mica, hematite, aluminosilicates and titania (Fig. 6(a)). Quartz, which has a distinct RMS profile
was not detected in any of the analyzed particles. Filter B2 exhibited a higher proportion of dark colored particles with carbonaceous spectra (Fig. 6(b)), and a lower proportion of mineral particles. DISCUSSION Filters from May 2013
Together, the observations of particles on filter A2 using optical microscopy, SEM, and XRF suggest that this filter was very heavily loaded with wind-blown dust, with a substantially greater proportion of 2.5–5 µm (physical

Wagner et al., Aerosol and Air Quality Research, 19: 2518–2530, 2019 2525
(a)
(b)
Fig. 6. RMS spectra of select particles transferred onto aluminum foil from filters (a) A2 and (b) B2, analyzed using the 785 nm laser. Measured spectra are red and library spectra are blue.
diameter) PM, compared to filters from other dates or nearby locations. The exact proportions could not be quantified by automated image analysis, due to the overlapping particles in A2 and background filter structures in the others. However, the approximate proportion of 2.5–5 µm PM in A2 by visual estimation is on the order of 50% of the total. This is approximately 10 times higher than the roughly 5% proportion of 2.5–5 µm PM observed on Location A filters from other days in May 2013 or at nearby Location B.
Because particle mass depends on particle diameter cubed, particles even slightly larger than the nominal cut point can have a substantial impact on PM2.5.
Public wind data supports the hypothesis of an unusual source of large, windblown soil particles at Location A on May 5, 2013. Wind data from May 5 reveal high regional winds above 8 m s–1, and speeds at Location A were even higher, peaking at over 16 m s–1. The high winds on May 5 came predominantly from the SSE, which contributed 86%

Wagner et al., Aerosol and Air Quality Research, 19: 2518–2530, 2019 2526
of hourly winds in the highest wind category (3.6–8.9 m s–1) and 54% of all winds (Fig. 7(a)). In contrast, the highest winds on the previous day were < 5 m s–1 and exclusively from the NW (100%), as were the majority of all winds that day (25%) (Fig. 7(b)). For Jan.–Oct. 2013 in general, SSE winds were uncommon (5% in the highest speed category and 2% overall), and most were again from the NW (36% in the highest speed category and 24% overall) (Fig. 7(c)). Thus, winds at on May 5 were from an unusual direction, and extremely high.
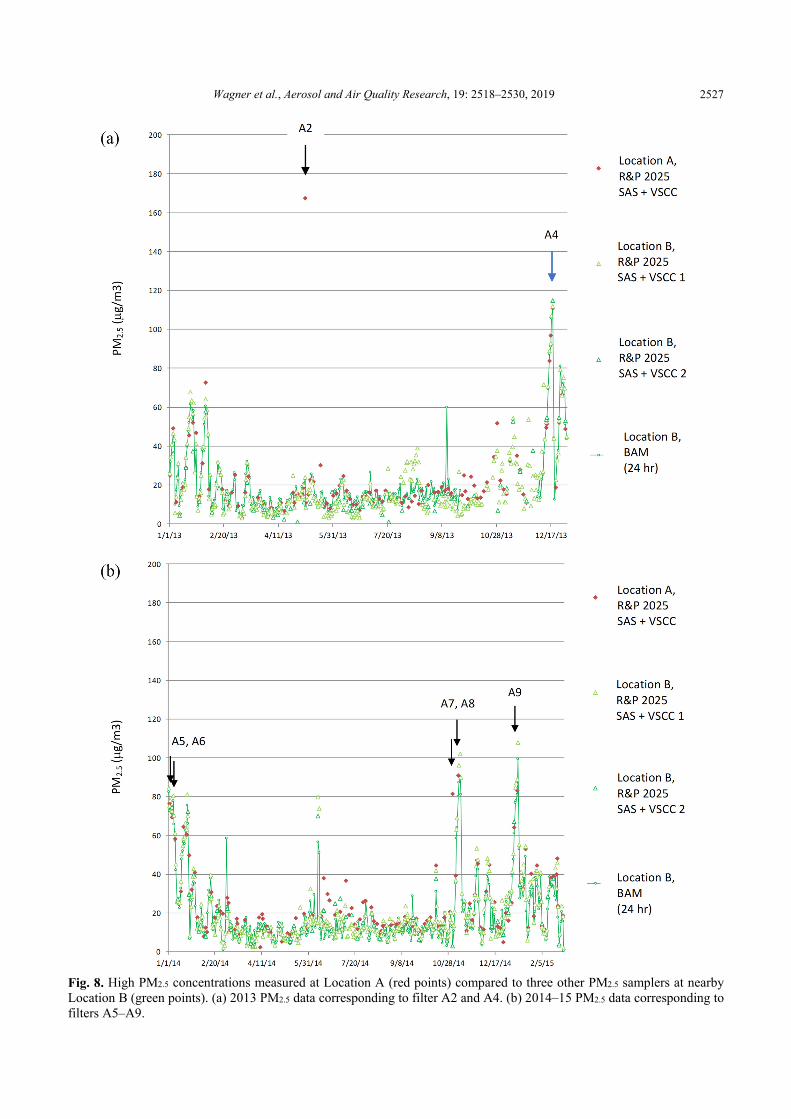
Corresponding to this regional shift to strong SSE winds, the one-hour BAM PM2.5 at Location B rose only slightly, and no filters at Location B recorded PM2.5 levels comparable to those measured at Location A (Fig. 8(a)). This disparity between sites may have been caused by local PM sources specific to Location A in the presence of unusual regional winds. Publicly available satellite maps show unpaved areas immediately SSE of the Location A FRM sampler, including
sections adjacent to an aircraft runway and a vehicle parking lot. The ground cover GIS map in Fig. 7(d) shows the local region < 1 mile SSE of the Location A monitor is classified as “cropland,” including exposed dirt. Location B, in contrast, is surrounded by urban areas classified as “developed”. The local surroundings of Location A thus have the potential to generate dusts which could be raised aloft by high winds. In addition, the near-ground level inlet height of the sampler at Location A could increase the potential impact of local dust intrusion. No soil samples were available from the studied time period to confirm this hypothesis further.
FRM PM2.5 sampler performance or calibration issues could potentially enhance collection of large particles. Even when operated properly, the S-shaped cut-point curves of the PM10 and PM2.5 inlets are designed to admit a small but non-zero fraction of particles larger than their nominal cut-points (Wagner and Casuccio, 2014). The PM2.5 VSCC modeling calculations show that particles slightly greater than the
(a) (b)
(c) (d)
Fig. 7. Wind roses for Location B wind speeds measured on (a) May 5 2013, (b) May 4 2013, and (c) January–October 2013. Radial bars represent percentages of wind measurements from each direction, each subdivided into three speed categories: 0–2.2 m s–1, 2.2–3.6 m s–1, and 3.6–8.9 m s–1. (d) GIS map of ground cover types surrounding locations A and B.
0%
10%
20%
30%
40%
50%
60%N (0)
nne
NE
ene
E (90)
ese
SE
sse
S (180)
ssw
SW
wsw
W (270)
wnw
NW
nnw
8 ‐ 20 MPH
5 ‐ 8 MPH
0 ‐ 5 MPH0 – 2.2 m/s
2.2 – 3.6 m/s
3.6 – 8.9 m/s
0%
5%
10%
15%
20%
25%N (0)
nne
NE
ene
E (90)
ese
SE
sse
S (180)
ssw
SW
wsw
W (270)
wnw
NW
nnw
8 ‐ 20 MPH
5 ‐ 8 MPH
0 ‐ 5 MPH0 – 2.2 m/s
2.2 – 3.6 m/s
3.6 – 8.9 m/s
0%
5%
10%
15%
20%
25%N (0)
nne
NE
ene
E (90)
ese
SE
sse
S (180)
ssw
SW
wsw
W (270)
wnw
NW
nnw
8 ‐ 20 MPH
5 ‐ 8 MPH
0 ‐ 5 MPH
5/5/13
0 – 2.2 m/s
2.2 – 3.6 m/s
3.6 – 8.9 m/s
Wagner et al., Aerosol and Air Quality Research, 19: 2518–2530, 2019 2527
Fig. 8. High PM2.5 concentrations measured at Location A (red points) compared to three other PM2.5 samplers at nearby Location B (green points). (a) 2013 PM2.5 data corresponding to filter A2 and A4. (b) 2014–15 PM2.5 data corresponding to filters A5–A9.
Wagner et al., Aerosol and Air Quality Research, 19: 2518–2530, 2019 2528
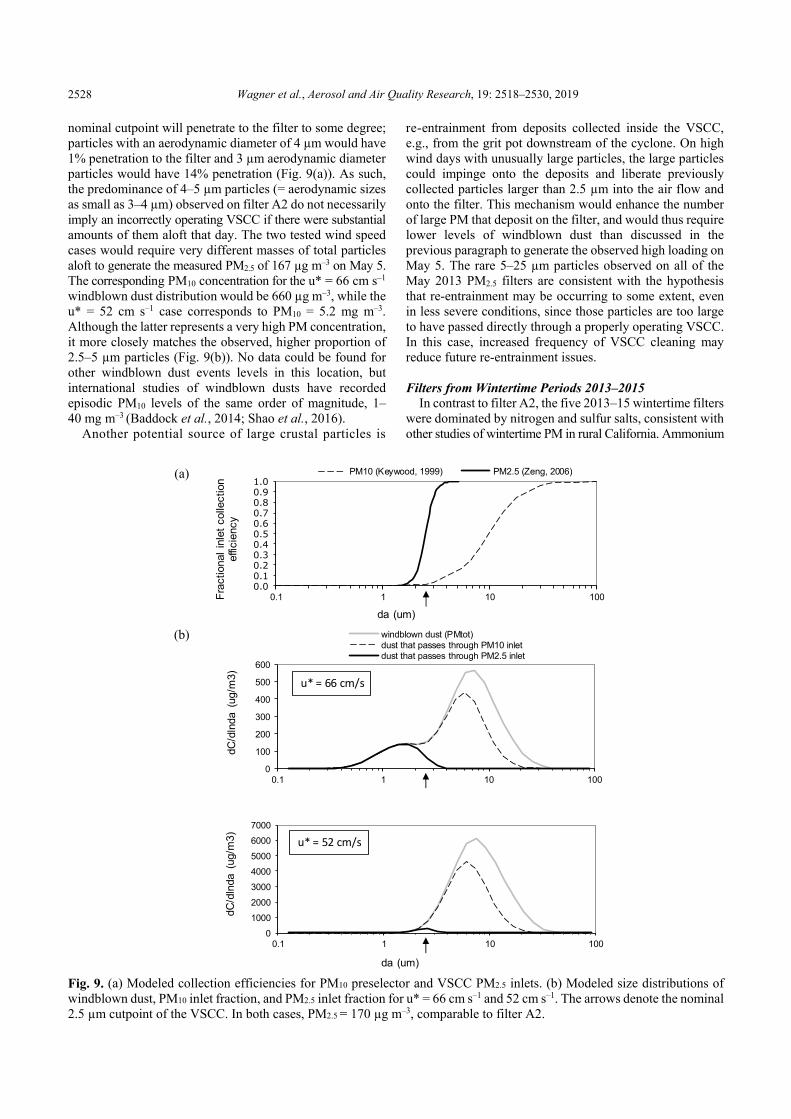
nominal cutpoint will penetrate to the filter to some degree; particles with an aerodynamic diameter of 4 µm would have 1% penetration to the filter and 3 µm aerodynamic diameter particles would have 14% penetration (Fig. 9(a)). As such, the predominance of 4–5 µm particles (= aerodynamic sizes as small as 3–4 µm) observed on filter A2 do not necessarily imply an incorrectly operating VSCC if there were substantial amounts of them aloft that day. The two tested wind speed cases would require very different masses of total particles aloft to generate the measured PM2.5 of 167 µg m–3 on May 5. The corresponding PM10 concentration for the u* = 66 cm s–1 windblown dust distribution would be 660 µg m–3, while the u* = 52 cm s–1 case corresponds to PM10 = 5.2 mg m–3. Although the latter represents a very high PM concentration, it more closely matches the observed, higher proportion of 2.5–5 µm particles (Fig. 9(b)). No data could be found for other windblown dust events levels in this location, but international studies of windblown dusts have recorded episodic PM10 levels of the same order of magnitude, 1–40 mg m–3 (Baddock et al., 2014; Shao et al., 2016).
Another potential source of large crustal particles is
re-entrainment from deposits collected inside the VSCC, e.g., from the grit pot downstream of the cyclone. On high wind days with unusually large particles, the large particles could impinge onto the deposits and liberate previously collected particles larger than 2.5 µm into the air flow and onto the filter. This mechanism would enhance the number of large PM that deposit on the filter, and would thus require lower levels of windblown dust than discussed in the previous paragraph to generate the observed high loading on May 5. The rare 5–25 µm particles observed on all of the May 2013 PM2.5 filters are consistent with the hypothesis that re-entrainment may be occurring to some extent, even in less severe conditions, since those particles are too large to have passed directly through a properly operating VSCC. In this case, increased frequency of VSCC cleaning may reduce future re-entrainment issues. Filters from Wintertime Periods 2013–2015
In contrast to filter A2, the five 2013–15 wintertime filters were dominated by nitrogen and sulfur salts, consistent with other studies of wintertime PM in rural California. Ammonium
(a)
(b)
Fig. 9. (a) Modeled collection efficiencies for PM10 preselector and VSCC PM2.5 inlets. (b) Modeled size distributions of windblown dust, PM10 inlet fraction, and PM2.5 inlet fraction for u* = 66 cm s–1 and 52 cm s–1. The arrows denote the nominal 2.5 µm cutpoint of the VSCC. In both cases, PM2.5 = 170 µg m–3, comparable to filter A2.
0.00.10.20.30.40.50.60.70.80.91.0
0.1 1 10 100Fra
ctio
nal
inle
t co
llect
ion
effic
ienc
y
da (um)
PM10 (Keywood, 1999) PM2.5 (Zeng, 2006)
0
100
200
300
400
500
600
0.1 1 10 100
dC/d
lnda
(ug
/m3)
windblown dust (PMtot)dust that passes through PM10 inletdust that passes through PM2.5 inlet
u* = 66 cm/s
0
1000
2000
3000
4000
5000
6000
7000
0.1 1 10 100
dC/d
lnda
(ug
/m3)
da (um)
u* = 52 cm/s

Wagner et al., Aerosol and Air Quality Research, 19: 2518–2530, 2019 2529
nitrate and ammonium sulfate are common atmospheric reaction products and significant contributors to PM2.5 in wintertime California air (Chow et al., 2006). Both are also used in fertilizer products and the construction industry. As described in the inlet modeling discussion, particles as large as 150 µm are unlikely to penetrate through a normally operating FRM PM2.5 sampler. Given the observed coalesced and crystallized morphologies, it is possible that these large salt particles were collected as much smaller particles. When exposed to high humidity, these salts could deliquesce and combine into larger salt droplets on the filter, and later dry as large crystals. The fact that single deposits were centered on each spot of the flow deposition patterns of the filters (Fig. 1(d)) is consistent with this hypothesis.
2013–2015 wintertime PM2.5 data from Location A and Location B (Figs. 8(a) and 8(b)) show that PM2.5 levels were elevated at both locations during all five of these periods. Thus, unlike the high PM2.5 in May 2013 (filter A2), which appears to have been a local phenomenon, the nitrogen rich salt loadings observed on these wintertime 2013–2015 filters apparently correspond to regional PM events.
Because the November 1 filter did not possess a heavy particle loading, it is possible that this high PM2.5 value is due to a problem with the recorded filter pre-weight or ID, or sampler flow or duration. The operator notes for this sample observed a power outage and “elapsed sample time out of spec.” CONCLUSIONS
Forensic particle analyses including optical and electron microscopy, X-ray fluorescence, and Raman micro-spectroscopy were combined with publicly available data analyses and windblown dust model calculations to determine three different sources of high PM2.5 filter measurements in rural California. This work presents an analysis approach that can be used to determine likely particle sources when only limited, archived samples are available.
One heavily loaded PM2.5 filter from Location A in May 2013 likely was dominated by wind-blown dust from an unusual direction (SSE), with a substantially greater proportion of PM between 2.5 and 5 µm (physical diameter; their corresponding aerodynamic diameters may be as small as 2–4 µm), compared to five other filters from adjacent locations and dates. The observed particle sizes are consistent with modeling predictions for a normally operating PM2.5 inlet challenged with a high concentration of large particles, potentially enhanced by re-entrainment of particles from collected deposits within the VSCC inlet. Dust control measures in the local area to the SSE and more frequent VSCC inlet cleanings may help reduce these issues.
In contrast, five other high-PM2.5 filters from wintertime 2013–2015 were likely caused by hygroscopic nitrogen- and sulfur-rich salts, consistent with ammonium nitrate and ammonium sulfate formed in the atmosphere. Unlike the high-PM2.5 May 2013 filter, which appears to have been a local phenomenon, the heavy nitrogen rich salt loadings observed on these five 2013–2015 filters are consistent with regional PM events.
Finally, the November 2014 filter exhibited a low loading of particles, so this high PM2.5 value may correspond to an erroneous filter ID, weight, sampler flow, or duration measurement.
The Teflon filters analyzed in this study prevented automated, quantitative SEM/EDS due to their obtrusive, fibrous backgrounds. Future deployments of inexpensive, passive PM samplers with smooth substrates optimized for microscopy would enable more detailed investigations (Wagner et al., 2012). In addition, future measurements of windblown dust size distributions >10 µm in this region would enable more realistic input into the combined FRM PM2.5 inlet model to more accurately predict increased PM2.5 on windy days. ACKNOWLEDGEMENTS
The authors thank San Joaquin Valley Air Pollution Control District for their assistance with this project. Funding was provided by San Joaquin Valley Air Pollution Control District Agreement 2017-06-22. REFERENCES Alfaro, S.C., Gaudichet, A., Gomes, L. and Maillé, M.
(1998). Mineral aerosol production by wind erosion: Aerosol particle sizes and binding energies. Geophys. Res. Lett. 25: 991–994.
Baddock, M.C., Strong, C.L., Leys, J.F., Heidenreich, S.K., Tews, E.K. and McTainsh, G.H. (2014). A visibility and total suspended dust relationship. Atmos. Environ. 89: 329–336.
Batonneau, Y., Sobanska, S., Laureyns, J. and Bremard, C. (2006). Confocal microprobe Raman imaging of urban tropospheric aerosol particles. Environ. Sci. Technol. 40: 1300–1306.
Chow, J.C., Chen, L.W.A., Watson, J.G., Lowenthal, D.H., Magliano, K.A., Turkiewicz, K. and Lehrman, D.E. (2006). PM2.5 chemical composition and spatiotemporal variability during the California Regional PM10/PM2.5 Air Quality Study (CRPAQS). J. Geophys. Res. 111: D10S04.
Ghosal, S. and Wagner, J. (2013). Correlated Raman micro-spectroscopy and scanning electron microscopy analyses of flame retardants in environmental samples: A micro-analytical tool for probing chemical composition, origin and spatial distribution. Analyst 138: 3836–3844.
Ham, W.A., Herner, J.D., Green, P.G. and Kleeman, M.J. (2010). Size distribution of health-relevant trace elements in airborne particulate matter during a severe winter stagnation event: Implications for epidemiology and inhalation exposure studies. Aerosol Sci. Technol. 44: 753–765.
Harnly, M., Naik-Patel, K., Wall, S., Quintana, P.J.E., Pon, D. and Wagner, J. (2012). Agricultural burning monitored for air pollutants in Imperial County; exposure reduction recommendations developed. Calif. Agric. 66: 85–90.
Kenny, L.C., Merrifield, T., Mark, D., Gussman, R. and Thorpe, A. (2004). The development and designation testing of a new USEPA-approved fine particle inlet: A

Wagner et al., Aerosol and Air Quality Research, 19: 2518–2530, 2019 2530
study of the USEPA designation process. Aerosol Sci. Technol. 38: 15–22.
Keywood, M.D. (1999) An evaluation of PM10 and PM2.5 size selective inlet performance using ambient aerosol. Aerosol Sci. Technol. 30: 401–407.
Oh, M., Lee, T. and Kim, D. (2011). Quantitative source apportionment of size-segregated particulate matter at urbanized local site in Korea. Aerosol Air Qual. Res. 11: 247–264.
Record, F.A. and Baci, L.A. (1980). Evaluation of the contribution of wind blown dust from the desert to levels of particulate matter in desert communities. U.S. EPA Report. Report No.: EPA-450/2-80-078.
Reid, J.P., Meresman, H., Mitchem, L. and Symes, R. (2007). Spectroscopic studies of the size and composition of single aerosol droplets. Int. Rev. Phys. Chem. 26: 139–192.
Shao, J. and Mao, J. (2016). Dust particle size distributions during spring in Yinchuan, China. Adv. Meteorol. 2016: 6940502.
U.S. Environmental Protection Agency (U.S. EPA) (2008). Ambient air monitoring strategy for state, local, and tribal air agencies. Office of Air Quality Planning and Standards, Research Triangle Park, NC.
U.S. Geological Survey (2011). Gap Analysis Program (GAP), National Land Cover, Version 2, U.S. Geological Survey.
Wagner, J. and Leith, D. (2001). Passive aerosol sampler. Part I: Principle of operation. Aerosol Sci. Technol. 34: 186–192.
Wagner, J., Naik-Patel, K., Wall, S. and Harnly, M. (2012). Measurement of ambient particulate matter concentrations and particle types near agricultural burns using electron microscopy and passive samplers. Atmos. Environ. 54:
260–271. Wagner, J., Ghosal, S., Whitehead, T. and Metayer, C.
(2013). Morphology, spatial distribution, and concentration of flame retardants in consumer products and environmental dusts using scanning electron microscopy and Raman micro-spectroscopy. Environ. Int. 59: 16–26.
Wagner, J. and Casuccio, G. (2014). Spectral imaging and passive sampling to investigate particle sources in urban desert regions. Environ. Sci. Processes Impacts 16: 1745–53.
Wang, Z.S., Wu, T., Shi, G.L., Fu, X., Tian, Y.Z., Feng, Y.C., Wu, X.F., Wu, G., Bai, Z.P. and Zhang, W.J. (2012). Potential source analysis for PM10 and PM2.5 in autumn in a northern city in China. Aerosol Air Qual. Res. 12: 39–48.
Watson, J.G. and Chow, J.C. (2001). Source characterization of major emission sources in the Imperial and Mexicali Valleys along the US/Mexico border. Sci. Total Environ. 276: 33–47.
Watson, J., Chow, J., Chen, L., Kohl, S., Casuccio, G., Lersch, T. and Langston, R. (2012). Elemental and morphological analyses of filter tape deposits from a beta attenuation monitor. Atmos. Res. 106: 181–189.
Zeng, Y. (2006). A comprehensive particulate matter monitoring system and dosimetry-based ambient particulate matter standards. J. Air Waste Manage. Assoc. 56: 518–529.
Received for review, May 29, 2019 Revised, September 11, 2019
Accepted, October 9, 2019