ARSESP Regulatory Agency of Sanitation and … Regulatory Agency of Sanitation and Energy of the...
25
ARSESP Regulatory Agency of Sanitation and Energy of the State of São Paulo Final Technical Note RTS/004/2015 SABESP Tariff Adjustment—2015 May 2015 TABLE OF CONTENTS 1. INTRODUCTION 1.1 GENERAL BACKGROUND—BRIEF HISTORY 2. AN EXTRAORDINARY TARIFF REVIEW REQUESTED BY SABESP 2.1 INCREASED ELECTRICITY COST—BASICS 2.2 REDUCED DEMAND ARISING OUT OF THE WATER CRISIS—BASICS 3. ARSESP ANALYSIS ON SABESP’S EXTRAORDINARY TARIFF REVIEW REQUEST 3.1 ELECTRICITY COST VARIATIONS 3.2 WATER AND SEWAGE DEMAND VARIATIONS 4. CONTRIBUTIONS RECEIVED FROM THE PUBLIC CONSULTATION/HEARING AND ACCEPTED BY ARSESP 5. THE TARIFF ADJUSTMENT 5.1 EVALUATION PRESENTED IN THE PRELIMINARY TECHNICAL NOTE 5.2 FINAL TARIFF ADJUSTMENT BREAKDOWN 5.3 TOTAL TARIFF ADJUSTMENT 6. CONCLUSION 1. INTRODUCTION The purpose of this Technical Note is to present the final results for SABESP’s Tariff Adjustment— 2015, including: • Annual tariff adjustment for 2015; • Tariff remainder from the Ordinary Tariff Review (RTO) complete in April 2014 and applied in December 2014; and • Extraordinary Tariff Adjustment (RTE) repositioning index requested by the utility company through the Official Letter P-0096/2015, dated March 6, 2015, arising mainly out of increased electricity costs and reduced supply due to the water crisis and decreasing demand.
Transcript of ARSESP Regulatory Agency of Sanitation and … Regulatory Agency of Sanitation and Energy of the...
ARSESP
Regulatory Agency of Sanitation and Energy of the State of São Paulo
Final Technical Note
RTS/004/2015
SABESP Tariff Adjustment—2015
May 2015
TABLE OF CONTENTS
1. INTRODUCTION
1.1 GENERAL BACKGROUND—BRIEF HISTORY
2. AN EXTRAORDINARY TARIFF REVIEW REQUESTED BY SABESP
2.1 INCREASED ELECTRICITY COST—BASICS
2.2 REDUCED DEMAND ARISING OUT OF THE WATER CRISIS—BASICS
3. ARSESP ANALYSIS ON SABESP’S EXTRAORDINARY TARIFF REVIEW REQUEST
3.1 ELECTRICITY COST VARIATIONS
3.2 WATER AND SEWAGE DEMAND VARIATIONS
4. CONTRIBUTIONS RECEIVED FROM THE PUBLIC CONSULTATION/HEARING AND ACCEPTED BY ARSESP
5. THE TARIFF ADJUSTMENT
5.1 EVALUATION PRESENTED IN THE PRELIMINARY TECHNICAL NOTE
5.2 FINAL TARIFF ADJUSTMENT BREAKDOWN
5.3 TOTAL TARIFF ADJUSTMENT
6. CONCLUSION
1. INTRODUCTION
The purpose of this Technical Note is to present the final results for SABESP’s Tariff Adjustment—2015, including:
• Annual tariff adjustment for 2015;
• Tariff remainder from the Ordinary Tariff Review (RTO) complete in April 2014 and applied in December 2014; and
• Extraordinary Tariff Adjustment (RTE) repositioning index requested by the utility company through the Official Letter P-0096/2015, dated March 6, 2015, arising mainly out of increased electricity costs and reduced supply due to the water crisis and decreasing demand.

Through the Preliminary Technical Note RTS/003/2015, ARSESP presented an initial proposal for SABESP’s total tariff adjustment and opened the public consultation process No. 02/2015 requesting contributions on this subject, which was completed with the public hearing No. 001/2015, held on April 15, 2015.
In this Final Technical Note, ARSESP analysis results on all contributions received during the public consultation/hearing process were taken into account, as per the detailed report presented by the agency, which includes the justifications for the contributions acceptance or rejection.
The RTE calculation basis was the Ordinary Tariff Review (RTO) Business Plan, completed in April 2014, associated with the new estimates that accompanied SABESP’s request, found in the Administrative Proceeding 0052-2015, as well as with data and information submitted in contributions received during the public consultation/hearing process.
In the Extraordinary Tariff Adjustment, the methodology used in the First Ordinary Tariff Review was maintained, whose results were presented in the Final Technical Note RTS/004/2014 and published in ARSESP Resolution No. 484/2014, available on the Agency website - www.arsesp.sp.gov.br.
1.1 GENERAL BACKGROUND—BRIEF HISTORY
The State Supplementary Law 1,025 of 2007 states that it is ARSESP’s responsibility to regulate and supervise basic sanitation services, including pricing issues.
Based on these assignments and under the law, ARSESP started in 2011 the First SABESP’s Tariff Review process for the tariff cycle comprising the period from 2012 to 2016.
Due to problems encountered by SABESP and the ARSESP during this process development, particularly with respect to the asset base collection and validation, ARSESP completed the tariff review in April 2014, by determining a 5.4408% tariff repositioning index compared to the tariffs then in force, thus ensuring the utility company economic and financial balance during the tariff cycle, and by setting a 0.9386% efficiency factor (X Factor) to be applied to the next annual adjustments, to take place in April 2015 and April 2016. The results were published by ARSESP in its Resolution No. 484/2014 and in the Final Technical Note RTS/004/2014.
However, due to the unfavorable water conditions, early in 2014 SABESP requested from ARSESP the authorization to implement an Incentive Program for Water Consumption Reduction aimed at consumers served by the Cantareira System, in order to ensure water supply.
This program, approved by ARSESP Resolution No. 469/2014, dated February 2014, aimed to grant a 30% tariff discount for users that reduced by at least 20% their monthly consumption, compared to the average consumption in the February/2013 to January/2014 period.
The persistent water crisis resulted in the extended application of the Incentive Program for Water Consumption Reduction to all municipalities within the Metropolitan Region of São Paulo served by SABESP, which was approved by ARSESP Resolution No. 480, dated April 2014.
Later, ARSESP authorized SABESP to categorize its Incentive Program for Water Consumption Reduction tariff bonus ranges, including bonuses granted to users with a greater than 10% reduction in consumption from November 1, 2014, pursuant to ARSESP Resolution No. 514, dated October 2014.
Considering the water crisis context and the adoption of measures to stimulate water saving at the time of the First SABESP’s Tariff Review result publication in April 2014, ARSESP allowed the utility company to apply, in a future date, the repositioning index resulting from the tariff review, as set out in item II of art. 1 of ARSESP Resolution No. 484/2014, which approved the Ordinary Tariff Review (RTO) then completed.

It was also established, in item III, art. 1 of ARSESP Resolution No. 484/2014, that the next annual tariff adjustments should occur on April 11, 2015 and April 11, 2016, and the next tariff review, on April 11, 2017.
In November 2014, SABESP requested ARSESP the application of the RTO results approved in April 2014, with the amount recalculation due to the application in December 2014.
Thus, ARSESP authorized SABESP to apply, from December 27, 2014 on, a 6.4952% index, corresponding to the 5.4408% index approved at the tariff review end in April plus 1% as a partial provisional compensation for its application postponement, as published in ARSESP Resolution No. 520, dated December 2014.
It is noteworthy that this authorized index did not include any compensation to SABESP for loss of income resulting from the Incentive Program for Water Consumption Reduction then in force. Tariff discounts in relation to the maximum tariff approved by the regulatory agency may be granted by the utility company, but they do not allow any request for compensation.
In January 2015, in result of the continued water crisis, ARSESP authorized SABESP to apply the Contingency Tariff for users already covered by the Incentive Program for Water Consumption Reduction who exceed the established consumption average, under ARSESP Resolution No. 545, dated January 2015.
2. AN EXTRAORDINARY TARIFF REVIEW REQUESTED BY SABESP
The application of an extraordinary tariff review is a mechanism provided for in item II, art. 38 of Federal Law 11,445/2007, which states that it will include a reassessment of the service provision conditions and tariffs charged “when facts not mentioned in the contract, outside of the service provider’s control, occur that affect its economic and financial balance”.
ARSESP, at the publication of the Final Technical Note RTS/01/2012, about the detailed methodology for SABESP’s tariff review process, determined that the events originating an extraordinary review are characterized by the following:
• occurrence during the Tariff Cycle;
• are, in most part, not under the company control;
• are not included in the tariff review; and
• have a significant impact on the balance.
It was also established that, when the extraordinary review request was started by SABESP, the request should be submitted to ARSESP in a document listing:
• the extraordinary event(s) that occurred;
• the balance equation elements affected in result of the event (i.e., different from the tariff review estimate);
• a preliminary measurement of (significant) impact on the company economic and financial balance.
Thus, on March 6, 2015, through the Official Letter P-0096/2015, SABESP filed with ARSESP an Extraordinary Tariff Review request, with an attached Technical Note containing detailed information.
The events resulting in the extraordinary review requested by SABESP are:
• Increased electricity cost; and
• Reduction in demand due to the water crisis that restricted the water supply. These items are detailed
below.
2.1 Increased Electricity Cost—Basics
Two facts generated increased electricity generation and distribution costs: the water crisis affecting the hydroelectric energy production (which also negatively affects water production and distribution by SABESP) and its combination with the aftereffects of the Federal Law 12,783/2013, which originated the Provisional Presidential Decree No. 579/2012.
The following are the detailed criteria and assumptions considered by SABESP to calculate the estimated expenditures for 2015 and 2016. For 2013 and 2014, the amounts shown in Table 2.1 (see below) have already been realized.
• In 2014, 55% of the electricity used by SABESP was provided by electricity distributors (ACR - Regulated Market Environment) and 45% from ACL (Free Market Environment), in a total of 2,387 GWh;
• Electricity adjustments by the distributors to which SABESP is connected, due to the increased prices of energy purchased by these distributors in the Short-Term Market during 2015 and 2016;
• The Tariff Flag system introduction, in 2015, in the electricity bills, based on the National System Operator (ONS) evaluation that determines the best strategy for power generation meeting the demand by using thermoelectric power plants. SABESP adopted the red flag premise for most of 2015 and yellow flag for 2016;
• The 15% discount not granted for the sanitation sector on the additional amount related to tariff flags, from March 2015, as determined in the ANEEL resolution, resulting in increased cost for SABESP;
• Application by ANEEL, in February 2015, of an Extraordinary Tariff Review for all 58 electricity distributors;
• Application of adjustment, based on the inflation estimate (as per the IPCA), to the TUSD (Distribution System Use Tariff) and TE (Power Tariff) tariffs applicable to the amounts of energy purchased in the ACR for 2015. For 2016, the IPCA was applied once again, in addition to the expected payment of the loans for helping the electricity distributors;
• Conventional tariff mode extinction by ANEEL, in the distributors’ captive market where SABESP operates, which allowed contracting energy with a voltage exceeding 1 kV under more attractive prices. The conventional tariff mode extinction in 2015 implies the inclusion in the blue or green seasonal tariff mode, resulting in increased costs;
• The premise for costs related to energy contracts in the Free Market Environment (ACL) is that energy for the estimated load is adjusted by IGP-M. The existing contracts are in force until December 2015. New contracts will take effect in January 2016;
• For 2016, SABESP has ACL contracts to supply 40% of the estimated load, with IGP-M adjustments;
• The remaining 60% supplied by ACL shall be contracted, with higher prices anticipated due to the current market conditions, with high prices and low liquidity. The power management strategy adopted by SABESP in ACL states that the company does not work with exposure (no contract) to the Electric Energy Trading Chamber (CCEE);
• As for the free market energy TUSD, the IPCA is expected to be applied to TUSD tariffs, using the same tariff adjustment parameters to ACR, TUSD, and TE; and
• Increased energy consumption in 2015 and 2016:
- In 2015, SABESP estimates a 1.87% consumption increase compared to 2014, corresponding to 2,432 GWh (57% in ACR and 43% in ACL), resulting from the operation start of new sewage pumping stations and the maintenance of consumption levels in municipalities outside the Metropolitan Region of São Paulo;
- In 2016, the electricity consumption estimate is 2,681 GWh, representing an approximate 10.26% increase compared to 2015, due to the water consumption levels being resumed.
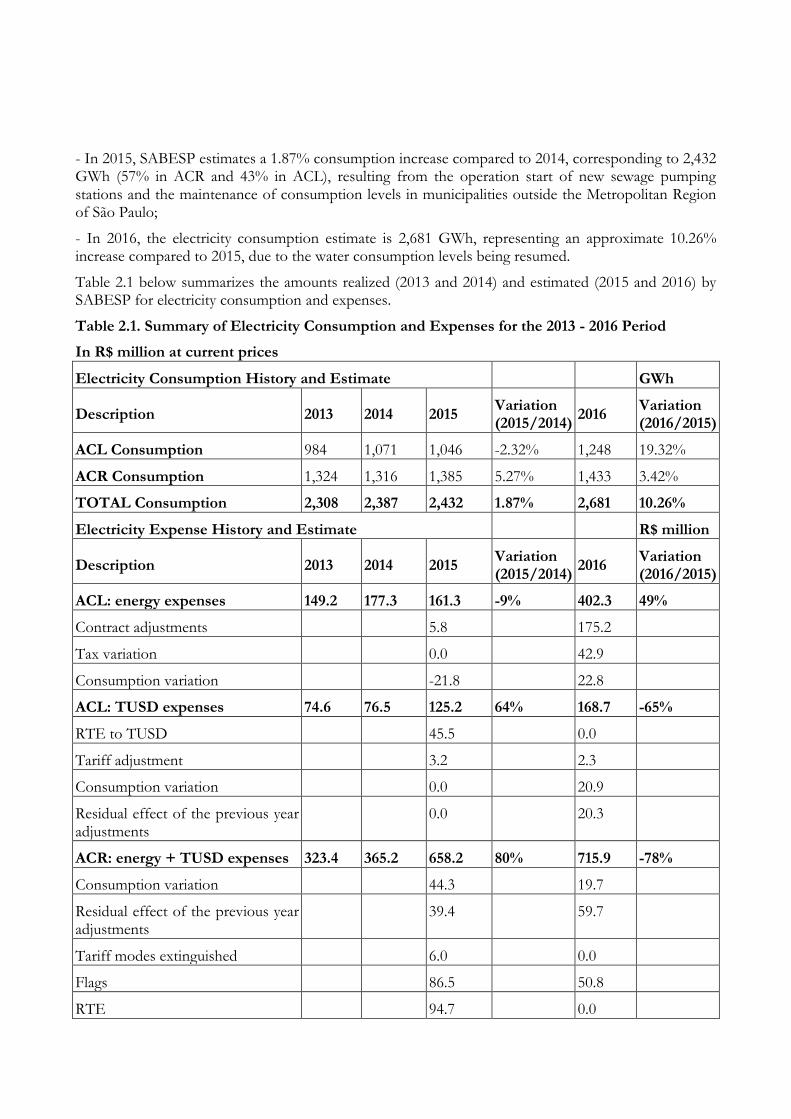
Table 2.1 below summarizes the amounts realized (2013 and 2014) and estimated (2015 and 2016) by SABESP for electricity consumption and expenses.
Table 2.1. Summary of Electricity Consumption and Expenses for the 2013 - 2016 Period
In R$ million at current prices
Electricity Consumption History and Estimate GWh
Description 2013 2014 2015 Variation (2015/2014)
2016 Variation (2016/2015)
ACL Consumption 984 1,071 1,046 -2.32% 1,248 19.32%
ACR Consumption 1,324 1,316 1,385 5.27% 1,433 3.42%
TOTAL Consumption 2,308 2,387 2,432 1.87% 2,681 10.26%
Electricity Expense History and Estimate R$ million
Description 2013 2014 2015 Variation (2015/2014)
2016 Variation (2016/2015)
ACL: energy expenses 149.2 177.3 161.3 -9% 402.3 49%
Contract adjustments 5.8 175.2
Tax variation 0.0 42.9
Consumption variation -21.8 22.8
ACL: TUSD expenses 74.6 76.5 125.2 64% 168.7 -65%
RTE to TUSD 45.5 0.0
Tariff adjustment 3.2 2.3
Consumption variation 0.0 20.9
Residual effect of the previous year adjustments
0.0 20.3
ACR: energy + TUSD expenses 323.4 365.2 658.2 80% 715.9 -78%
Consumption variation 44.3 19.7
Residual effect of the previous year adjustments
39.4 59.7
Tariff modes extinguished 6.0 0.0
Flags 86.5 50.8
RTE 94.7 0.0

Tariff adjustments published until Mar/15
8.0 0.0
Estimated tariff adjustment 14.0 14.0
TOTAL Expenses 547.2 619.1 944.7 53% 1,286.9 36%
As shown in table 2.2 below, in 2013 and 2014, the amounts realized are about 1.5% above those estimated in the RTO Business Plan. For 2015 and 2016, SABESP estimated a 55.5% and 96.2% increase, respectively, compared to previously estimated amounts.
Table 2.2. Comparison of SABESP’s Realized and Estimated Energy Costs: 2013 - 2016
In R$ million at prices in effect in December 2012
Breakdown Electricity costs (R$ thousand)
Realized Estimated
2013 2014 2015 2016
Business Plan (RTO) 527,713 537,738 548,113 561,359
SABESP Realized and Estimated (RTE) 535,939 545,738 808,750 1,040,110
Variation (RTE/RTO) 1.56% 1.49% 47.55% 85.28%
2.2 Reduced Demand Arising Out of the Water Crisis—Basics
According to the Technical Note submitted by SABESP, in addition to the Official Letter P-0096/2015, the monthly inflow comparison in the Cantareira System in 2014 shows a significant decrease in this flow, characterized as a rare and extreme event, with no defined periodicity and therefore unpredictable.
As a result of this water restriction, there was an approximate 25% reduction in water production in the Metropolitan Region of São Paulo, from 70 cum/sec in January 2013 to 52 cum/sec in January 2015. This event then caused a change in consumer demand, who received economic incentives (bonuses and contingency tariff) to lower consumption as an alternative to the deployment of a more drastic supply constraint.
The variation between the estimated and realized amounts of physical data about the 2012-2014 period demand is listed in table 2.3. As for 2014, a 7.85% reduction was found in the total measured volume in comparison with the volume estimated in the Business Plan approved in RTO.
SABESP also submitted a new physical data estimate on the demand for the remainder of the tariff cycle (2015 and 2016), listed in table 2.4.
To determine the new estimated physical data, SABESP assumed no reversal, but instead increase in measured volume reduction in 2015. In 2016, the volume shall grow compared to 2015, without reaching the estimated consumption levels before the crisis, though.
Table 2.3 - Demand Data: Business Plan Estimated X Realized - 2012 to 2014
Breakdown WATER SEWER TOTAL
2012 2013 2014 2012 2013 2014 2012 2013 2014
Connections Business
Plan
7,013,260 7,182,670 7,356,128 5,692,333 5,995,650 6,245,153 12,705,593 13,179,320 13,601,281
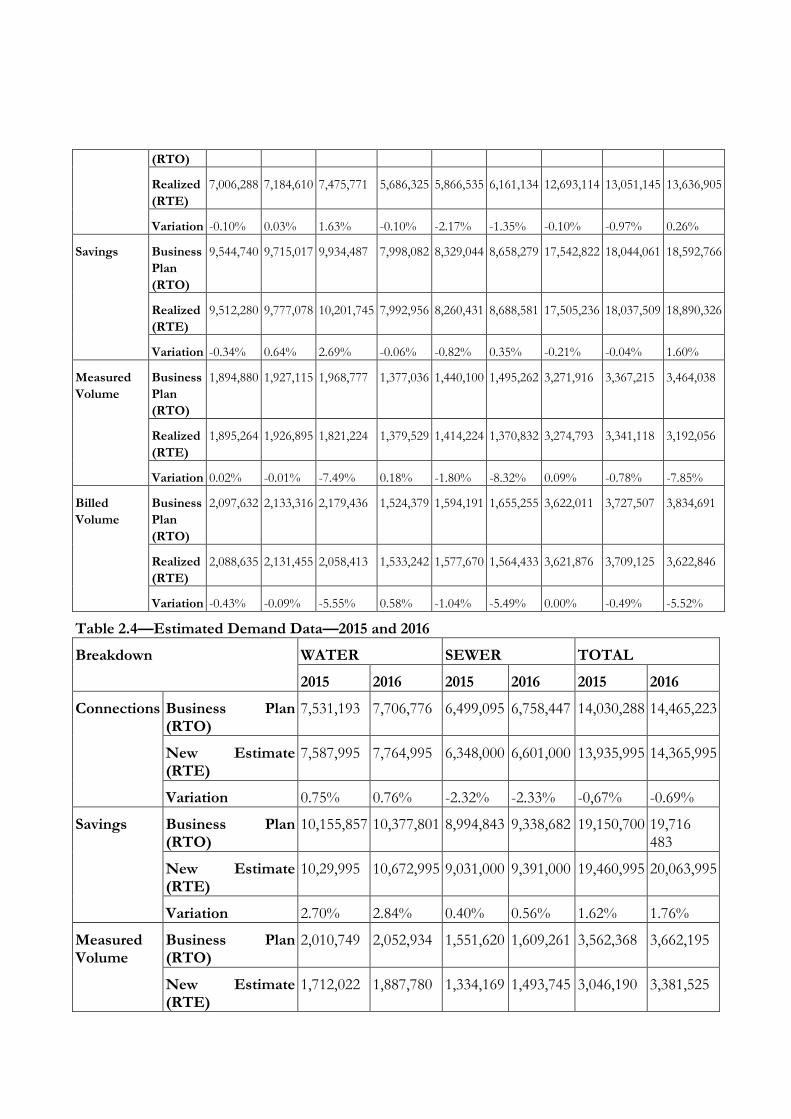
(RTO)
Realized
(RTE)
7,006,288 7,184,610 7,475,771 5,686,325 5,866,535 6,161,134 12,693,114 13,051,145 13,636,905
Variation -0.10% 0.03% 1.63% -0.10% -2.17% -1.35% -0.10% -0.97% 0.26%
Savings Business
Plan
(RTO)
9,544,740 9,715,017 9,934,487 7,998,082 8,329,044 8,658,279 17,542,822 18,044,061 18,592,766
Realized
(RTE)
9,512,280 9,777,078 10,201,745 7,992,956 8,260,431 8,688,581 17,505,236 18,037,509 18,890,326
Variation -0.34% 0.64% 2.69% -0.06% -0.82% 0.35% -0.21% -0.04% 1.60%
Measured
Volume
Business
Plan
(RTO)
1,894,880 1,927,115 1,968,777 1,377,036 1,440,100 1,495,262 3,271,916 3,367,215 3,464,038
Realized
(RTE)
1,895,264 1,926,895 1,821,224 1,379,529 1,414,224 1,370,832 3,274,793 3,341,118 3,192,056
Variation 0.02% -0.01% -7.49% 0.18% -1.80% -8.32% 0.09% -0.78% -7.85%
Billed
Volume
Business
Plan
(RTO)
2,097,632 2,133,316 2,179,436 1,524,379 1,594,191 1,655,255 3,622,011 3,727,507 3,834,691
Realized
(RTE)
2,088,635 2,131,455 2,058,413 1,533,242 1,577,670 1,564,433 3,621,876 3,709,125 3,622,846
Variation -0.43% -0.09% -5.55% 0.58% -1.04% -5.49% 0.00% -0.49% -5.52%
Table 2.4—Estimated Demand Data—2015 and 2016
Breakdown WATER SEWER TOTAL
2015 2016 2015 2016 2015 2016
Connections Business Plan (RTO)
7,531,193 7,706,776 6,499,095 6,758,447 14,030,288 14,465,223
New Estimate (RTE)
7,587,995 7,764,995 6,348,000 6,601,000 13,935,995 14,365,995
Variation 0.75% 0.76% -2.32% -2.33% -0,67% -0.69%
Savings Business Plan (RTO)
10,155,857 10,377,801 8,994,843 9,338,682 19,150,700 19,716 483
New Estimate (RTE)
10,29,995 10,672,995 9,031,000 9,391,000 19,460,995 20,063,995
Variation 2.70% 2.84% 0.40% 0.56% 1.62% 1.76%
Measured Volume
Business Plan (RTO)
2,010,749 2,052,934 1,551,620 1,609,261 3,562,368 3,662,195
New Estimate (RTE)
1,712,022 1,887,780 1,334,169 1,493,745 3,046,190 3,381,525
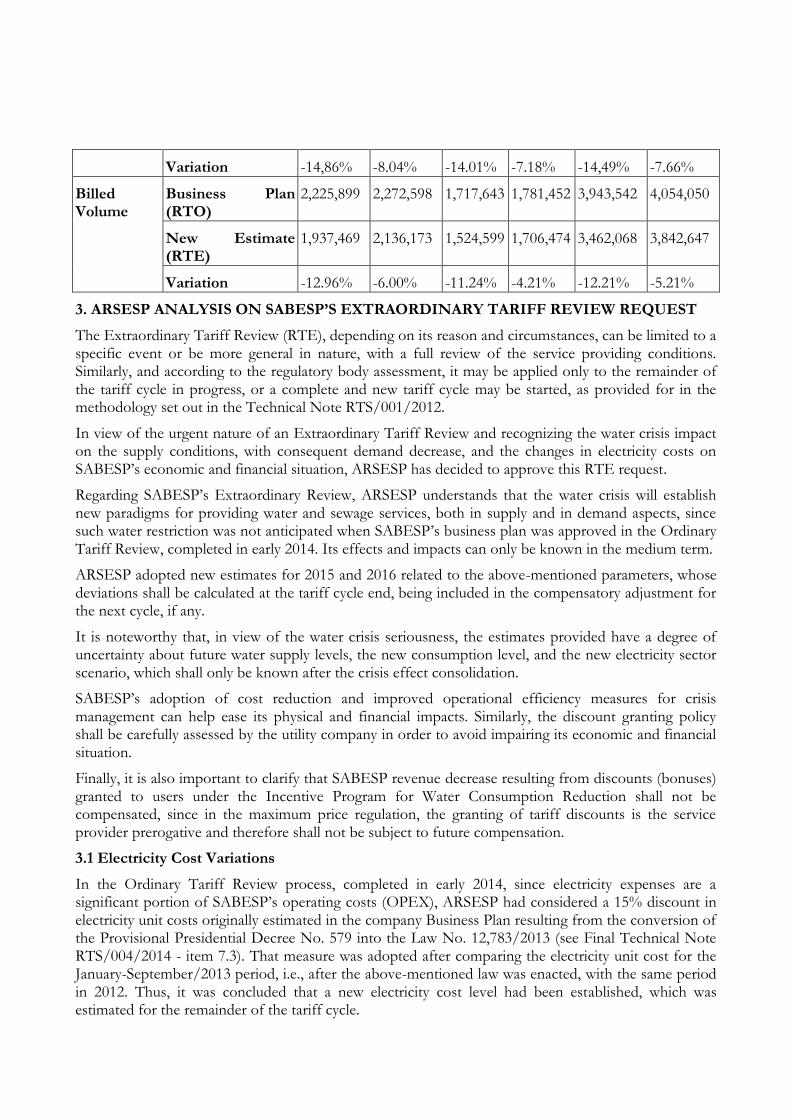
Variation -14,86% -8.04% -14.01% -7.18% -14,49% -7.66%
Billed Volume
Business Plan (RTO)
2,225,899 2,272,598 1,717,643 1,781,452 3,943,542 4,054,050
New Estimate (RTE)
1,937,469 2,136,173 1,524,599 1,706,474 3,462,068 3,842,647
Variation -12.96% -6.00% -11.24% -4.21% -12.21% -5.21%
3. ARSESP ANALYSIS ON SABESP’S EXTRAORDINARY TARIFF REVIEW REQUEST
The Extraordinary Tariff Review (RTE), depending on its reason and circumstances, can be limited to a specific event or be more general in nature, with a full review of the service providing conditions. Similarly, and according to the regulatory body assessment, it may be applied only to the remainder of the tariff cycle in progress, or a complete and new tariff cycle may be started, as provided for in the methodology set out in the Technical Note RTS/001/2012.
In view of the urgent nature of an Extraordinary Tariff Review and recognizing the water crisis impact on the supply conditions, with consequent demand decrease, and the changes in electricity costs on SABESP’s economic and financial situation, ARSESP has decided to approve this RTE request.
Regarding SABESP’s Extraordinary Review, ARSESP understands that the water crisis will establish new paradigms for providing water and sewage services, both in supply and in demand aspects, since such water restriction was not anticipated when SABESP’s business plan was approved in the Ordinary Tariff Review, completed in early 2014. Its effects and impacts can only be known in the medium term.
ARSESP adopted new estimates for 2015 and 2016 related to the above-mentioned parameters, whose deviations shall be calculated at the tariff cycle end, being included in the compensatory adjustment for the next cycle, if any.
It is noteworthy that, in view of the water crisis seriousness, the estimates provided have a degree of uncertainty about future water supply levels, the new consumption level, and the new electricity sector scenario, which shall only be known after the crisis effect consolidation.
SABESP’s adoption of cost reduction and improved operational efficiency measures for crisis management can help ease its physical and financial impacts. Similarly, the discount granting policy shall be carefully assessed by the utility company in order to avoid impairing its economic and financial situation.
Finally, it is also important to clarify that SABESP revenue decrease resulting from discounts (bonuses) granted to users under the Incentive Program for Water Consumption Reduction shall not be compensated, since in the maximum price regulation, the granting of tariff discounts is the service provider prerogative and therefore shall not be subject to future compensation.
3.1 Electricity Cost Variations
In the Ordinary Tariff Review process, completed in early 2014, since electricity expenses are a significant portion of SABESP’s operating costs (OPEX), ARSESP had considered a 15% discount in electricity unit costs originally estimated in the company Business Plan resulting from the conversion of the Provisional Presidential Decree No. 579 into the Law No. 12,783/2013 (see Final Technical Note RTS/004/2014 - item 7.3). That measure was adopted after comparing the electricity unit cost for the January-September/2013 period, i.e., after the above-mentioned law was enacted, with the same period in 2012. Thus, it was concluded that a new electricity cost level had been established, which was estimated for the remainder of the tariff cycle.

However, there was a significant change in this scenario as early as the end of 2013, as indicated in item 2.1 of this TN, increasing SABESP’s estimated electricity cost level. Nominal unit costs resulting from the amounts listed in Table 2.1 are:
• R$237.09/MWh in 2013;
• R$259.36/MWh in 2014;
• R$388.44/MWh in 2015; and
• R$480.00/MWh in 2016.
To quantify such increased cost impact on SABESP’s maximum tariff (P0), ARSESP reassessed the Discounted Cash Flow for the 2012-2017 period submitted in the Ordinary Tariff Review (Table 12.1 of Technical Note RTS/004/2014).
To this end, the agency used the new SABESP realized (2012-2014) and estimated (2015- 2016) electricity unit costs, as mentioned above, for determining the annual actual unit cost variation, used as an indicator of such cost increase.
Table 3.1 below shows the annual actual variations in electricity unit costs at constant prices of Dec/2012 (currency used in the Discounted Cash Flow submitted in the Ordinary Tariff Review), obtained from the above-mentioned unit costs, considering IPCA variations used in SABESP estimates.
Table 3.1—Actual Increase in Energy Unit Costs
Year IPC A Energy Cost (R$/MWh)
Dec/Dec Variation (*)
Dec. Index (*)
Annual Average Index
Nominal Actual** - Dec/12 Prices
Actual Δ on the Previous Year
Accumulated Actual Δ
2012 5.84% 3,602.46 3,503.10 248.86 255.92
2013 5.91% 3,815.39 3,708.93 237.09 230.28 -10.02% -10.02%
2014 6.27% 4,054.61 3,935.00 259.36 237.44 3.11% -7.22%
2013 6.29% 4,309.65 4,182.13 388.44 334.60 40.92% 30.74%
2016 5.50% 4,546.68 4,428.17 480.00 390.50 16.71% 52.59%
(*) Used by SABESP in electricity cost estimate
(**) Actual electricity cost at Dec/2012 prices = annual nominal cost X (annual average index/ Dec/12 index)
In the Preliminary Technical Note RTS/003/2015, these actual variations were applied to all electricity unit costs used by ARSESP’s Economic and Financial Model in calculating new energy expenses considered in this Extraordinary Tariff Review IRT for the 2013-2016 period.
In this Final Technical Note, however, in view of the contributions received and to maintain the methodology used in RTO, ARSESP decided to consider these electricity unit cost increases only in the remaining 2015-2016 Business Plan period, as explained in item 5.2.3 below.
3.2 Water and Sewage Demand Variations
ARSESP’s Economic and Financial Model used in the tariff review process prepares the market
estimates found in SABESP’s Business Plan, based on estimates of unit consumption for residential users and annual growth rates for non-residential users and permittees.
It is noteworthy that, at the time of the Ordinary Tariff Review (RTO) results publication, the 2011 and 2012 demand data were already known and therefore were taken into account in P0 calculation.
ARSESP evaluated the measured and total billed volumes realized in this tariff cycle and found that RTO estimates for 2013 complied with the actually realized amounts. However, in 2014, 7.85% and 5.52% decreases were found in the total measured and billed volumes, respectively, in comparison with those estimated in the Business Plan. Such reduction arises only from the supply constraint caused by the water crisis (see Table 2.3).
After analyzing the observed data, ARSESP has considered acceptable the demand estimates submitted by SABESP and understands that the current scenario does not allow yet a final consolidated position to be determined on the water crisis effects.
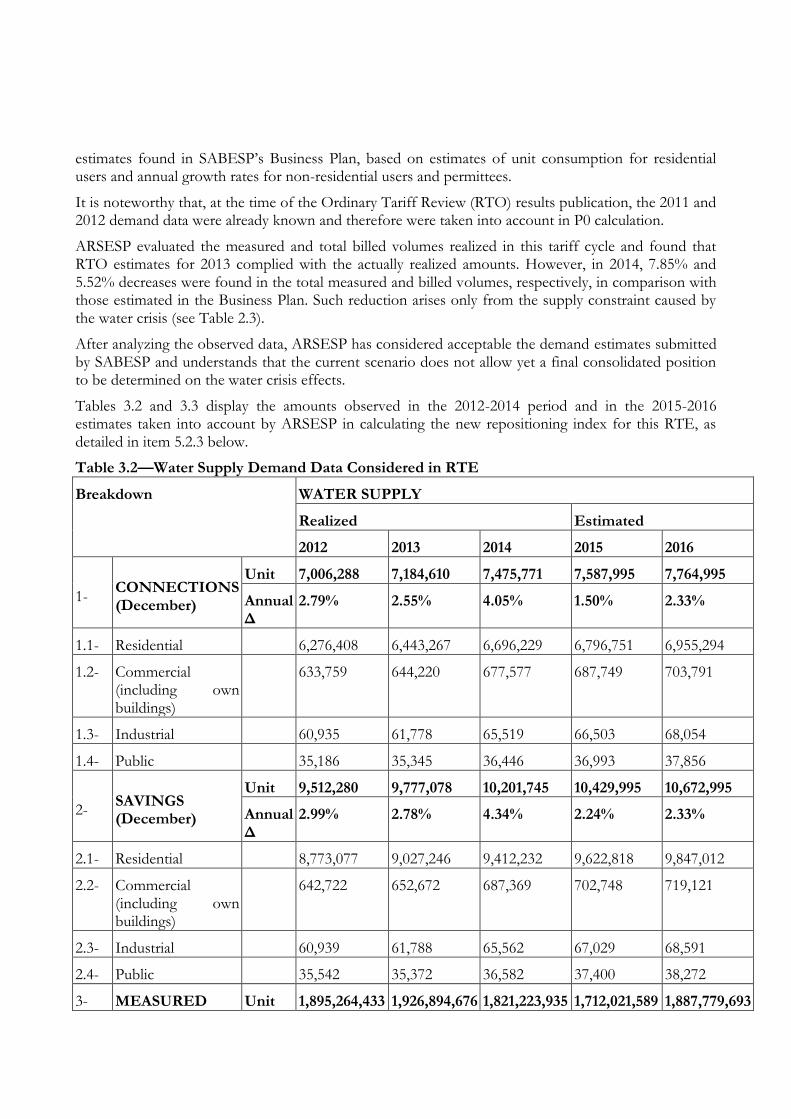
Tables 3.2 and 3.3 display the amounts observed in the 2012-2014 period and in the 2015-2016 estimates taken into account by ARSESP in calculating the new repositioning index for this RTE, as detailed in item 5.2.3 below.
Table 3.2—Water Supply Demand Data Considered in RTE
Breakdown WATER SUPPLY
Realized Estimated
2012 2013 2014 2015 2016
1- CONNECTIONS (December)
Unit 7,006,288 7,184,610 7,475,771 7,587,995 7,764,995
Annual Δ
2.79% 2.55% 4.05% 1.50% 2.33%
1.1- Residential 6,276,408 6,443,267 6,696,229 6,796,751 6,955,294
1.2- Commercial (including own buildings)
633,759 644,220 677,577 687,749 703,791
1.3- Industrial 60,935 61,778 65,519 66,503 68,054
1.4- Public 35,186 35,345 36,446 36,993 37,856
2- SAVINGS (December)
Unit 9,512,280 9,777,078 10,201,745 10,429,995 10,672,995
Annual Δ
2.99% 2.78% 4.34% 2.24% 2.33%
2.1- Residential 8,773,077 9,027,246 9,412,232 9,622,818 9,847,012
2.2- Commercial (including own buildings)
642,722 652,672 687,369 702,748 719,121
2.3- Industrial 60,939 61,788 65,562 67,029 68,591
2.4- Public 35,542 35,372 36,582 37,400 38,272
3- MEASURED Unit 1,895,264,433 1,926,894,676 1,821,223,935 1,712,021,589 1,887,779,693

VOLUMES (Annual Total - cum)
Annual Δ
2.22% 1.67% -5.48% -6.00% 10.27%
3.1- Retail 1,598,252,774 1,627,462,343 1,574,385,433 1,492,228,440 1,648,077,572
3.1.1- Residential 1,361,433,616 1,387,703,486 1,346,842,446 1,276,559,450 1,409,883,998
3.1.2- Commercial (including own buildings)
148,554,846 148,788,850 141,979,133 134,570,160 148,624,739
3.1.3- Industrial 35,400,586 38,244,817 35,444,563 33,594,941 37,103,614
3.1.4- Public 52,863,726 52,725,190 50,119,291 47,503,889 52,465,221
3.2- Permittees 297,011,659 299,432,333 246,838,502 219,793,148 239,702,121
4-
BILLED VOLUME (Annual Total - cum)
Unit 2,088,634,690 2,131,455,167 2,058,412,660 1,937,469,145 2,136,172,859
Annual Δ
1.76% 2.05% -3.43% -5.88% 10.26%
Table 3.3—Sewage Demand Data Considered in RTE
Breakdown SEWAGE
Realized Estimated
2012 2013 2014 2015 2016
1- CONNECTIONS (December)
Unit 5,686,826 5,866,535 6,161,134 6,348,000 6,601,000
Annual Δ
3.53% 3.16% 5.02% 3.03% 3.99%
1.1- Residential 5,052,136 5,218,653 5,476,169 5,642,260 5,867,133
1.2- Commercial (including own buildings)
555,980 568,114 600,626 618,843 643,507
1.3- Industrial 51,356 52,000 55,414 57,095 59,370
1.4- Public 27,354 27,768 28,925 29,802 30,990
2- SAVINGS (December)
Unit 7,992,956 8,260,431 8,688,581 9,031,000 9,391,000
Annual Δ
3.72% 3.35% 5.18% 3.94% 3.99%
2.1- Residential 7,348,998 7,603,897 7,993,484 8,308,509 8,639,709
2.2- Commercial (including own buildings)
565,221 576,744 610,620 634,685 659,985
2.3- Industrial 51,356 52,000 55,448 57,633 59,931
2.4- Public 27,381 27,790 29,029 30,173 31,376
3- MEASURED Unit 1,379,528,939 1,414,223,665 1,370,832,391 1,334,168,539 1,493,745,048

VOLUMES (Annual Total - cum)
Annual Δ
7.18% 2.51% -3.07% -2.67% 11.96%
3.1- Retail 1,352,192,731 1,384,827,669 1346,593,765 1,291,450,599 1,447,155,370
3.1.1- Residential 1,131,388,974 1,159,657,391 1,130,982,110 1,084,668,265 1,215,442,160
3.1.2- Commercial (including own buildings)
140,705,753 142,029,601 137,155,410 131,538,881 147,397,971
3.1.3- Industrial 38,758,701 41,769,828 39,417,425 37,803,277 42,361,059
3.1.4- Public 41,339,303 41,370,849 39,038,820 37,440,176 41,954,181
3.2- Permittees 27,336,208 29,395,996 24,238,626 42,717,940 46,589,678
4- BILLED VOLUME (Annual Total - cum)
Unit 1,533,241,743 1,577,669,916 1,564,433,350 1,524,599,169 1,706,473,757
Annual Δ
7.61% 2.90% -0.84% -2.55% 11.93%
In the Preliminary Technical Note RTS/003/2015, the amounts from tables 3.2 and 3.3., related to the 2013-2016 period demand, were used in ARSESP’s Economic and Financial Model.
In this Final Technical Note, however, in view of the contributions received and to maintain the methodology used in RTO, ARSESP decided to consider the demand variation only in the remaining 2015-2016 Business Plan period, as explained in item 5.2.3 below.
4. CONTRIBUTIONS RECEIVED FROM THE PUBLIC CONSULTATION/HEARING AND ACCEPTED BY ARSESP
The Detailed Report prepared by ARSESP analyzes all contributions received during the public consultation/hearing process and provides justifications for their acceptance or rejection.
Please note in that report that ARSESP considered the following contributions acceptable:
i) SABESP: tariff remainder from RTO application postponement in Dec/2014 (the tariff remainder application request, as per the Resolution 484 and 520/2014, consists of contributions sent by SABESP);
ii) FIESP: application of the RTE Tariff Replacement Index only to future years (2015-2016), maintaining the 2013-2014 RTO Business Plan.
Thus, such contributions were taken into account in the SABESP’s total tariff adjustment Final Calculation, found in item 5.2.
Moreover, the COLETIVO DE LUTA PELA ÁGUA contribution related to changes in the tariff structure was partially accepted. ARSESP considers it necessary to review the current tariff structure and, therefore, has requested SABESP to submit the proposal of a new structure, along with its deployment plan. Due to its complexity, the structure change will not be included in this Technical Note, since the studies are still in progress.
5. THE TARIFF ADJUSTMENT
5.1 EVALUATION PRESENTED IN THE PRELIMINARY TECHNICAL NOTE
In the approach considered by ARSESP in the Preliminary Technical Note, the new maximum price (P0) level established for RTE incorporated the cumulative effect on the Discounted Cash Flow of the

two components that gave rise to it, that is:
i) adjustments due to service demand decrease, caused by the water crisis related supply constraint; and
ii) adjustments due to increased electricity costs caused by changes in the power sector environment.
For generating the RTE Discounted Cash Flow, the changes made to the original RTO Business Plan refer only to water and sewage service demand and electricity cost variations, as above-mentioned.
With regard to demand (connections, savings, and volumes), the 2013 and 2014 realized data and new estimates for 2015 and 2016 were used, as shown above.
To determine new electricity costs, the actual increases found in item 3.1 herein were applied to the unit costs related to the estimate base used in RTO (2012). It should be noted that other OPEX components had been redesigned by the Economic and Financial Model based on the new demand considered.
For other components used in calculating the maximum price (asset base, investments, and other items not affected by demand variations), the Business Plan amounts approved for the Ordinary Tariff Review were maintained. Any changes to these items were not the RTE request object, and a new Business Plan was not generated.
Every Discounted Cash Flow (FCD) estimate still makes reference to the Dec/2012 prices, the original currency used in the Business Plan for the First Ordinary Tariff Review.
Table 5.1 below shows the FCD with adjustments to the electricity demand and cost, the RTE object, as well as their effects on other components used in the maximum price (P0) calculation.
As noted, the maximum price resulting from SABESP’s Business Plan adjustments, considered in the Preliminary Technical Note RTS/003/2015, at Dec/2012 prices, is R$2.67739/cum, which, when compared to the First Ordinary Tariff Review amount (R$2.51734/cum) results in a 6.3576% impact on the initial maximum price (P0).
With this approach, ARSESP—not having a new Business Plan reflecting the data actually realized in 2013-2014 (revenues, costs, and investments) and the new scenario for the post-crisis service supply and demand and, therefore, suitable for a more accurate utility company economic and financial balance assessment—presented this variation in P0 (6.3576%), as a Tariff Repositioning Index resulting from RTE, in the public consultation/hearing process, considering that the remaining economic and financial balance issues would be properly evaluated at the cycle end for compensation in the next cycle, as provided in the methodology approved for the Ordinary Tariff Review.
Table 5.1—Discounted Cash Flow—RTE
Breakdown Formula Elements
Current Amount—2012
Tariff Cycle (R$1000—Dec/2012)
2013 2014 2015 2016
Billed Volume (A+E) - (1000cum)
VF 12,096,945 3,709,125 3,622,846 3,462,068 3,842,647
+ Direct (Tariff) Required Revenue
RRD 32,388,192 9,930,760 9,699,758 9,269,294 10,288,249
+ Indirect Revenue
RI 632,274 194,615 189,586 180,538 200,079
+ Other RN 46,296 13,997 13,997 13,997 13,997

Revenues
- COFINS/PASEP
COP 2,413,874 740,174 722,944 690,859 766,670
- Operating Expenses (OPEX) OPEX 14,275,518 4,165,454 4,144,735 4,300,613 4,721,822
- Unrecoverable Revenue INC 652,460 218,477 200,785 179,824 185,188
- Income Tax/Social Contrib. IRCS 4,315,208 1,411,289 1,341,448 1,141,354 1,303,316
- Investments CAPEX 7,596,528 2,403,450 2,275,913 2,126,199 2,370,128
- Regulatory Progress Interests JOAR 459,210 145,289 137,579 128,529 143,274
- Working Capital Variation DWK 43,421 134,957 -23,544 -91,608 15,400
- Initial Capital Base BRL0 26,733,934 0 0 0 0
+ Final Capital Base BRLT 23,423,390 0 0 0 31,938,139
= Free Cash Flow + Bdk VPL =
0.00 -26,733,934 920,282 1,103,480 988,059 32,934,664
Calculated Po (Dec/12 prices) =
2.67739 R$/cum TIR = 8.060%
Besides the RTE impact, the total tariff adjustment presented in the Preliminary Technical Note accumulated the RTE tariff repositioning index (6.3576%) with the annual 2015 adjustment, calculated based on the IPCA variation from March 2014 to March 2015, discounting the X Factor.
5.2 Final Tariff Adjustment Breakdown
After the detailed analysis of contributions received from the public consultation, ARSESP reviewed its tariff adjustment calculation approach for a better match between the RTE cause impacts and the utility company economic and financial balance during the cycle as a whole.
On one hand, it maintained the tariff level authorized by the RTO for the first two years of the Business Plan (2013-2014), recognizing the existence of a tariff remainder in the application delay recalculation (from May to December 2014), to be offset in the rest of the cycle; and, on the other hand, it took into account the RTE cause impacts only to the remaining period (2015-2016).
By adding this tariff remainder and this RTE time reassessment, the total tariff adjustment to be authorized by ARSESP is now composed by the cumulating effects of the following components:
a. The Annual Tariff Adjustment for 2015, as set out in ARSESP Resolution 484/2014.
b. The tariff remainder from the Ordinary Review Tariff Repositioning Index (IRT-RTO) recalculation for application on December 26, 2014, in view of the provisions in item II of Article 1 of ARSESP Resolution No. 484 (allowing later RTO application) and in Article 2 of ARSESP Resolution No. 520 (granting 1% more as partial provisional compensation for delay in implementing the RTO).
c. The Extraordinary Tariff Review Tariff Repositioning Index (IRT-TEN), whose maximum price is to be calculated considering the economic and financial balance for the remaining two years of the Business Plan (2015-2016), considering the impact of the events giving rise to this RTE (electricity and demand) in this period only.
It is noteworthy that the post-crisis scenario has not stabilized yet to allow the development of a new Business Plan that reliably reflects the new service supply and demand conditions. Thus, for 2015-2016,

only the impacts from increased electricity costs and supply/demand reduction, which are the objects of this RTE, were incorporated to the original Business Plan. For the initial two years of the Business Plan (2013-2014), the RTO original FCD amounts values were kept fully.
Thus, ARSESP understands that, with the above-mentioned tariff adjustment, it will preserve the economic and financial balance under the RTO terms since:
i) The rules and procedures established in the First Ordinary Tariff Review were preserved, whose authorized tariff level (P0), upon its completion in April 2014, already incorporated the compensatory adjustment due to the 20 month delay in the completion thereof;
ii) The now approved tariff level includes the not compensated remainder from the loss of income arising from SABESP’s RTO postponement to Dec/2014; and
iii) The impacts on the maximum price of the causes giving rise to this Extraordinary Tariff Review (electricity and demand costs) are being considered for the remaining Business Plan period (2015-2016).
Therefore (except for the effects of the cost and demand management policies that SABESP has been implementing for facing the crisis, whose net result is still uncertain), the economic and financial balance from a regulatory point of view is assured for the cycle as a whole, and any deviations found—inherent to the regulation model adopted—shall be evaluated as provided for the cycle end, with possible compensation in the next cycle.
5.2.1 Annual Tariff Adjustment for 2015
In April 2014, when the 5.4408% Tariff Repositioning Index was published, to be applied to the then-in-force tariffs, due to the RTO result and whose application was authorized for May 11, 2014, the tariffs were adjusted for inflation based on the IPCA variation until March 2014. The next annual tariff adjustment was planned for April 11, 2015, effective from May 11 on, as published in ARSESP Resolution No. 484/2014.
It is therefore necessary to adjust for inflation the Maximum Price (P0) in force for the March 2015 price, corresponding to the 12 month period since the Ordinary Tariff Review approval. According to the RTO provisions, this inflation adjustment is based on the IPCA variation for the March 2014 to March 2015 period.
The variation between IBGE’s Broad Consumer Price Index (IPCA) in March 2014 (3898.38) and in March 2015 (4215.26) was 8.1285%.
According to the Technical Note RTS/004/2014, at every tariff adjustment such inflationary variation shall be reduced by an annual 0.9386% X Factor, corresponding to the regulatory efficiency gains that the company shall transfer annually to the users. Therefore, the annual adjustment to be applied in 2015 is 7.1899%.
5.2.2 Tariff Remainder from IRT Recalculation upon the RTO Application in Dec./2014
At the conclusion of the Ordinary Tariff Review in April 2014, ARSESP authorized the application of a 5.4408% Tariff Repositioning Index (IRT) in May 2014 but, in view of the existing water crisis and of then-in-force water saving measures, it allowed the utility company to apply it at a better future date, at such moment when ARSESP would recalculate it, to compensate for the loss of income resulting from such postponement (see art. 1 of ARSESP Resolution 484/2014 and its items).
By the time of SABESP’s request to apply such IRT from Dec/2014, ARSESP, due to a lack of information allowing an accurate calculation of the appropriate compensation, besides the persistent and worsening water crisis, granted a 1% cumulative index for IRT-RTO, as a partial provisional

measure. Thus, the total authorized index in Dec/2014 was 6.4952% (1.054408 x 1.01 - 1). SABESP, however, should timely submit the additional information for calculating the final index (see Articles 2, 3, and 4 of ARSESP Resolution 520/2014).
The request for including the tariff remainder from the mentioned recalculation was submitted by SABESP along with the RTE public consultation contributions.
Since it was necessary for the cycle economic and financial balance equation, ARSESP accepted SABESP’s request and that final adjustment is included with the annual tariff adjustment, whose calculation is detailed in Table 5.2 below.
Since the P0 corresponding to tariffs in force before applying the RTO was R$2.61081/cum (see item 5 in Table 13.2 of the TN RTS/004/2014), after the IRT application in Dec/2014, this maximum price became R$2.78039, i.e., the tariffs currently in force.
From the Original Business Plan billed volume data and the maximum prices, authorized and practiced so far, we have determined the tariff revenue levels due and practiced for each period included in Table 5.2.
Table 5.2—Tariff Remainder Calculation Resulting from the RTO Application Delay
Period Period Days
Billed Volume (A+E)
Maximum Price Po RTO Direct Revenue
Applied Direct Revenue
Daily Average
Period—1000cum
RTO—R$/cum
Applied—R$/cum
R$1,000 VPL R$1,000 VPL
1) May 11, 2014 to Dec. 26, 2014
230 10,506 2,416,380 2.75286 2.61081 6,651,957 6,816,371 6,308,710 6,464,641
2) Dec. 27, 2014 to Dec. 31, 2014
5 10,506 52,530 2.75286 2.78039 144,608 137,772 146,054 139,150
3) Jan. 1, 2015 to May 25, 2015
145 10,804 1,566,612 2.75286 2.78039 4,312,665 4,166,093 4,355,794 4,207,756
4) May 26, 2015 to Dec. 31, 2015
220 10,804 2,376,929 2.75286 2.79589 6,543,354 6,178,612 6,645,634 6,275,191
5) Jan. 1, 2016 to Dec. 31, 2016
366 11,077 4,054,050 2.75286 2.79589 11,160,231 10,218,330 11,334,679 10,378,055
6) Jan. 1, 2017 to May 10, 2017
130 11,341 1,474,270 2.75286 2.79589 4,058,459 3,351,407 4,121,898 3,403,793
TOTAL 1,096 65,038 11,940,772 2.75286 2.75634 32,871,273 30,868,585 32,912,768 30,868,585
The price highlighted in Table 5.2 above (R$2.79589) is the maximum price which will equalize the current value of the due and practiced revenue flows (38,868,585) from the RTO application authorized date (May 11, 2014) to the end of the current tariff cycle (May 10, 2017). Thus, the loss of income found in the RTO application postponement period (from May 11, 2014 do Dec. 26, 2014) will be fully recovered in the remainder of the cycle.

The ratio between this maximum price (R$2.79589) and the one currently in force (R$2.78039) corresponds to the index to be considered for tariff remainder in question, which is 0.5575%.
5.2.3 Determining the RTE Repositioning Index
After analyzing the contributions from the public consultation No. 02/2015, for determining the new tariff level due to the RTE impacts, ARSESP adopted the utility company economic and financial balance assumption in the last two years of the Business Plan (2015-2016)
Thus, ARSESP adjusted the initial approach presented in the Preliminary Technical Note RTS/004/2015 and used the FCD last two years shown in Table 5.1, in which, on the RTO original FCD, the impacts of increased electricity cost and supply/demand reduction that resulted in this RTE were taken into account.
The final values used for determining the new tariff level for this RTE are shown in Table 5.3. Note that the maximum price ensuring SABESP economic and financial balance for those two years, evaluated at Dec/2012 prices, is R$2.76559/cum.
Table 5.3—RTE Discounted Cash Flow—Remaining Cycle Period: 2015-2016
Breakdown Formula Elements
Current Amount
R$1000—Dec/2012
2015 2016
Billed Volume (A+E) - (1000cum) VF 6,494,632 3,462,068 3,842,647
+ Direct (Tariff) Required Revenue RRD 17,961,502 9,574,669 10,627,193
+ Indirect Revenue RI 338,417 180,538 200.079
+ Other Revenues RN 24,939 13,997 13.997
- COFINS/PASEP COP 1,295,895 690,859 766.670
- Operating Expenses (OPEX) OPEX 8,023,545 4,300,613 4,721,822
- Unrecoverable Revenue INC 325,005 179,824 185,188
- Income Tax/Social Contrib. IRCS 2,172,366 1,141,354 1,303,316
- Investments CAPEX 3,997,356 2,126,199 2,370,128
- Regulatory Progress Interests JOAR 241,640 128,529 143,274
- Working Capital Variation ΔWK -71,587 -91,608 15,400
- Initial Capital Base BRL0 29,667,990 0 0
+ Final Capital Base (1) BRLT 27,327,352 0 31,910,050
= Free Cash Flow + Bdk VPL = 0.00 -29,667,990 1,293,434 33,245,520
Calculated Po (Dec/12 prices) = 2.76559 TIR = 8.060%
(1) Technical Depreciation (Table 5.8 in RTS/004/2014) 1,181,846 1,268,015
Table 5.4 below shows the actual maximum price evolution (always at Dec/2012 prices) from the time the RTO completion results were disclosed in April 2014.
Table 5.4—RTE Tariff Repositioning Index
Breakdown Unit Amount

Dec/2012 Price
1) Initial Po FCD-RTO (1) R$/cum 2.51734
2) Po FCD-RTO with ACR (1) R$/cum 2.56110
3) Current Po (ACR+1%) - Dec/2014 R$/cum 2.58671
4) Po RTE: 2015-2016 (Table 5.3) R$/cum 2.76559
5) Tariff Repositioning Index—RTE 6.9154%
(1) Source: Table 13.2 in RTS/004/2014
As shown in Table 5.4, we start from the RTO initial P0, shown in Table 12.1 of Technical Note RTS/004/2014 in April 2014 (R$2.51734/cum) - item 1; add the Retroactive Compensatory Adjustment (ACR) effect referred to in item 13.1 of the above-mentioned Technical Note (Table 13.2), resulting in R$2.56110/cum - item 2; we then add 1% granted at the RTO application in Dec/2014 (art. 2 of ARSESP Resolution 520/2014), obtaining a R$2.58671/cum amount, which is the maximum price for tariffs currently in force, expressed and actual in Dec/2012 - item 3; we then determine the balance maximum price for 2015-2016 amounting to R$2.76559/cum, considering the RTE impacts - item 4. This price, when compared to the corresponding maximum price for the tariffs in force (item 3 of Table 5.4 - R$2.58671/cum), results in a 6.9154% RTE Tariff Repositioning Index.
5.3 Total Tariff Adjustment
Considering the cumulative effect of the 2015 annual adjustment, the tariff remainder, and the IRT Extraordinary Tariff Review, described in items 5.2.1, 5.2.2, and 5.2.3, respectively, the total tariff adjustment is 15.2414%, as shown in Table 5.5 below.
This total tariff adjustment was applied to tariffs currently in force, whose resulting amounts are listed in Exhibit I herein. These tariffs may be applied 30 days after their publication, under the Law 11,445/2007.
Table 5.5—Total Tariff Adjustment
Breakdown Amount
Dec/2012 Price
1) 2015 Tariff Adjustment 7.1899%
a) IPCA Variation: Mar. 14-Mar. 15 8.1285%
b) X Factor (deduction) 0.9386%
2) Tariff Remainder from RTO Application 0.5575%
3) Tariff Repositioning Index—RTE 6.9154%
4) Total Tariff Adjustment 15.2414%
5) Authorized maximum price (R$/cum) 3.20416
6. CONCLUSION
After examining the Extraordinary Tariff Review request submitted by SABESP and the contributions received during the public consultation/hearing process, ARSESP has decided to authorize a total 15.2414% adjustment in SABESP’s tariff, linearly applied on the current tariff values.

Such tariff adjustment includes the 2015 annual adjustment, the granting of the RTO remainder, and the RTE impact.
ARSESP changed in electricity unit costs and the demand components in the business plan, keeping the methodology used in the First Ordinary Tariff Review, completed in April 2014.
This tariff adjustment result refers to the remaining period of the tariff cycle in force, and it may be applied within 30 days of its publication.
It is important to stress that, for the extraordinary tariff review there is no minimum frequency established by law, so it can occur at any time, regardless of the date of previous tariff adjustments.
Note that part of the methodology is the assessment of amounts realized by the tariff cycle end, with adjustments, if necessary, for compensation in the next cycle.
We stress that the loss of income from bonuses granted by the utility company is not considered in this RTE, and is not subject to compensation through tariffs. Maintaining the discount policy, which is a utility company prerogative, shall be evaluated by SABESP, in the face of the service providing balance. So ARSESP allows the utility company, when deemed necessary, to extinguish the discounts that have been granted since the start of the water crisis.
Table 1
METROPOLITAN BOARD—GT-M
MC, ML (includes the Municipality of Guararema), MO, MN (except the following municipalities: Bragança Paulista, Joanópolis, Nazaré Paulista, Pedra Bela, Pinhalzinho, Piracaia, Socorro, and Vargem), and MS.
RESIDENTIAL COMMERCIAL / INDUSTRIAL / PUBLIC
Social Tariff Commercial / Industrial / Public without Contract
Consumption Ranges (cum) Water Sewer Consumption Ranges (cum) Water Sewer
0 to 10 R$/month 7.00 7.00 0 to 10 R$/month 41.45 41.45
11 to 20 R$/cum 1.21 1.21 11 to 20 R$/cum 8.07 8.07
21 to 30 R$/cum 4.28 4.28 21 to 50 R$/cum 15.45 15.45
31 to 50 R$/cum 6.10 6.10 Above 50 R$/cum 16.10 16.10
above 50 R$/cum 6.74 6.74
Favela Tariff Commercial: Social Welfare Entities
Consumption Ranges (cum) Water Sewer Consumption Ranges (cum) Water Sewer
0 to 10 R$/month 5.34 5.34 0 to 10 R$/month 20.72 20.72
11 to 20 R$/cum 0.61 0.61 11 to 20 R$/cum 4.03 4.03
21 to 30 R$/cum 2.02 2.02 21 to 50 R$/cum 7.76 7.76
31 to 50 R$/cum 6.10 6.10 above 50 R$/cum 8.06 8.06
above 50 R$/cum 6.74 6.74
Normal Tariff Public with contract Tariff

Consumption Ranges (cum) Water Sewer Consumption Ranges (cum) Water Sewer
0 to 10 R$/month 20.64 20.64 0 to 10 R$/month 31.06 31.06
11 to 20 R$/cum 3.23 3.23 11 to 20 R$/cum 6.04 6.04
21 to 50 R$/cum 8.07 8.07 21 to 50 R$/cum 11.63 11.63
above 50 R$/cum 8.89 8.89 above 50 R$/cum 12.08 12.08
OTHER SERVICES Tariff
Water Sewer
Water Truck: Third Parties
R$/cum 32.87
Water Truck: SABESP
R$/cum 80.67
Permittees R$/1000cum 1812.29 1167.64
METROPOLITAN BOARD: GT-MN
MN - only for municipalities in the Bragança Paulista region (Bragança Paulista, Joanópolis, Nazaré Paulista, Pedra Bela, Pinhalzinho, Piracaia, Socorro, and Vargem)
RESIDENTIAL COMMERCIAL / INDUSTRIAL / PUBLIC
Social Tariff Normal Commercial / Industrial / Public without Contract
Consumption Ranges (cum) Water Sewer Consumption Ranges (cum) Water Sewer
0 to 10 R$/month 7.00 5.60 0 to 10 R$/month 41.45 33.14
11 to 20 R$/cum 1.09 0.88 11 to 20 R$/cum 4.91 3.90
21 to 30 R$/cum 2.37 1.88 21 to 50 R$/cum 7.92 6.34
31 to 50 R$/cum 3.37 2.71 Above 50 R$/cum 9.30 7.42
above 50 R$/cum 4.01 3.22
Normal Tariff Commercial / Social Welfare Entities
Consumption Ranges (cum) Water Sewer Consumption Ranges (cum) Water Sewer
0 to 10 R$/month 20.64 16.55 0 to 10 R$/month 20.72 16.57
11 to 20 R$/cum 2.88 2.28 11 to 20 R$/cum 2.47 1.95
21 to 50 R$/cum 4.43 3.53 21 to 50 R$/cum 4.00 3.20
above 50 R$/cum 5.29 4.21 above 50 R$/cum 4.67 3.72
OTHER SERVICES Tariff Public with contract Tariff
Water Sewer Consumption Ranges (cum) Water Sewer
Water Truck: Third Parties
R$/cum 32.87 0 to 10 R$/month 31.06 24.86
Water Truck: SABESP
R$/cum 80.67 11 to 20 R$/cum 3.66 2.94
Permittees R$/1000cum 1812.29 1167.64 21 to 50 R$/cum 5.97 4.75
above 50 R$/cum 6.96 5.59
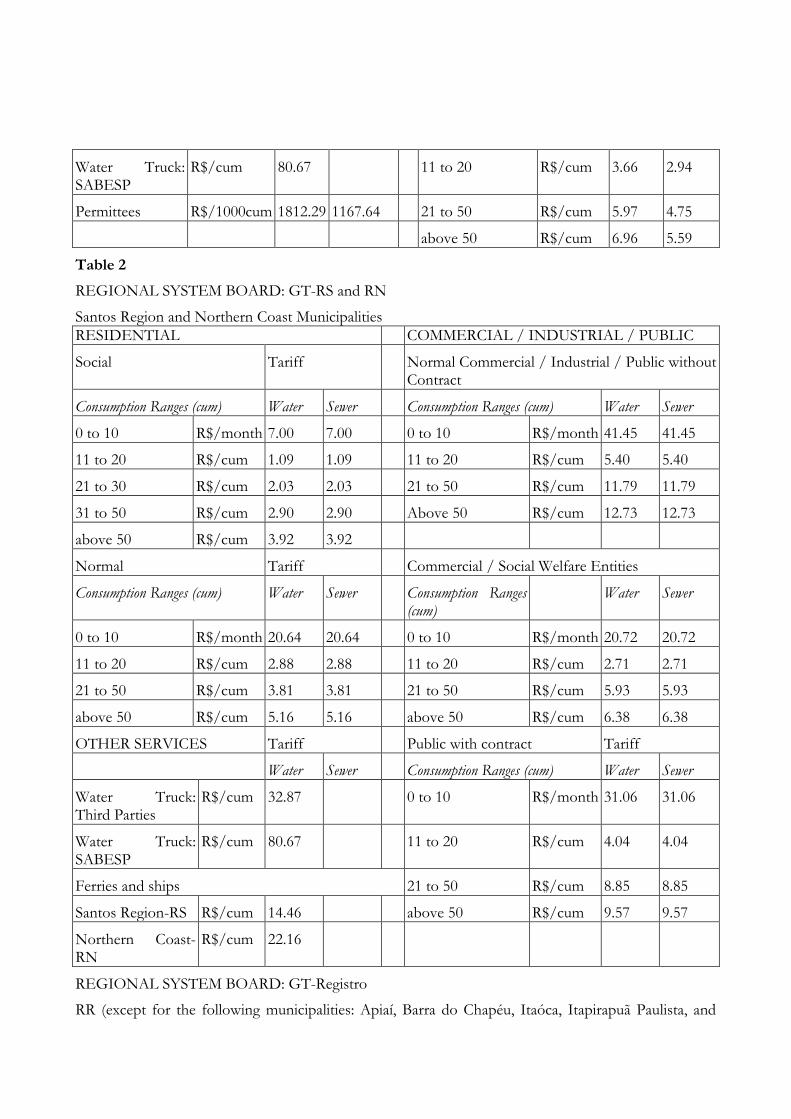
Table 2
REGIONAL SYSTEM BOARD: GT-RS and RN
Santos Region and Northern Coast Municipalities
RESIDENTIAL COMMERCIAL / INDUSTRIAL / PUBLIC
Social Tariff Normal Commercial / Industrial / Public without Contract
Consumption Ranges (cum) Water Sewer Consumption Ranges (cum) Water Sewer
0 to 10 R$/month 7.00 7.00 0 to 10 R$/month 41.45 41.45
11 to 20 R$/cum 1.09 1.09 11 to 20 R$/cum 5.40 5.40
21 to 30 R$/cum 2.03 2.03 21 to 50 R$/cum 11.79 11.79
31 to 50 R$/cum 2.90 2.90 Above 50 R$/cum 12.73 12.73
above 50 R$/cum 3.92 3.92
Normal Tariff Commercial / Social Welfare Entities
Consumption Ranges (cum) Water Sewer Consumption Ranges (cum)
Water Sewer
0 to 10 R$/month 20.64 20.64 0 to 10 R$/month 20.72 20.72
11 to 20 R$/cum 2.88 2.88 11 to 20 R$/cum 2.71 2.71
21 to 50 R$/cum 3.81 3.81 21 to 50 R$/cum 5.93 5.93
above 50 R$/cum 5.16 5.16 above 50 R$/cum 6.38 6.38
OTHER SERVICES Tariff Public with contract Tariff
Water Sewer Consumption Ranges (cum) Water Sewer
Water Truck: Third Parties
R$/cum 32.87 0 to 10 R$/month 31.06 31.06
Water Truck: SABESP
R$/cum 80.67 11 to 20 R$/cum 4.04 4.04
Ferries and ships 21 to 50 R$/cum 8.85 8.85
Santos Region-RS R$/cum 14.46 above 50 R$/cum 9.57 9.57
Northern Coast-RN
R$/cum 22.16
REGIONAL SYSTEM BOARD: GT-Registro
RR (except for the following municipalities: Apiaí, Barra do Chapéu, Itaóca, Itapirapuã Paulista, and

Ribeira)
RESIDENTIAL COMMERCIAL / INDUSTRIAL / PUBLIC
Social Tariff Normal Commercial / Industrial / Public without Contract
Consumption Ranges (cum) Water Sewer Consumption Ranges (cum) Water Sewer
0 to 10 R$/month 7.00 7.00 0 to 10 R$/month 41.45 41.45
11 to 20 R$/cum 1.09 1.09 11 to 20 R$/cum 4.91 4.91
21 to 30 R$/cum 2.37 2.37 21 to 50 R$/cum 8.27 8.27
31 to 50 R$/cum 3.37 3.37 Above 50 R$/cum 10.50 10.50
above 50 R$/cum 4.01 4.01
Normal Tariff Commercial / Social Welfare Entities
Consumption Ranges (cum) Water Sewer Consumption Ranges (cum)
Water Sewer
0 to 10 R$/month 20.64 20.64 0 to 10 R$/month 20.72 20.72
11 to 20 R$/cum 2.88 2.88 11 to 20 R$/cum 2.47 2.47
31 to 50 R$/cum 4.43 4.43 21 to 50 R$/cum 4.17 4.17
above 50 R$/cum 5.29 5.29 above 50 R$/cum 5.28 5.28
OTHER SERVICES Tariff Public with contract Tariff
Water Sewer Consumption Ranges (cum) Water Sewer
Water Truck: Third Parties
R$/cum 32.87 0 to 10 R$/month 31.06 31.06
Water Truck: SABESP
R$/cum 80.67 11 to 20 R$/cum 3.66 3.66
Ferries and ships 21 to 50 R$/cum 6.22 6.22
Santos Region-RS R$/cum 14.46 above 50 R$/cum 7.89 7.89
Northern Coast-RN
R$/cum 22.16
Table 3
REGIONAL SYSTEM BOARD: GT-Interior
RA, RB, RG (except Itapira), RJJ, RM (except Torrinha), RR (for the following municipalities: Apiaí, Barra do Chapéu, Itaóca, Itapirapuã Paulista, and Ribeira) and RT (except the municipalities of Lins, Magda, and Glicério)
RESIDENTIAL COMMERCIAL / INDUSTRIAL / PUBLIC
Social Tariff Normal Commercial / Industrial / Public without Contract
Consumption Ranges (cum) Water Sewer Consumption Ranges (cum) Water Sewer

0 to 10 R$/month 7.00 5.60 0 to 10 R$/month 41.45 33.14
11 to 20 R$/cum 1.09 0.88 11 to 20 R$/cum 4.91 3.90
21 to 30 R$/cum 2.37 1.88 21 to 50 R$/cum 7.92 6.34
31 to 50 R$/cum 3.37 2.71 Above 50 R$/cum 9.30 7.42
above 50 R$/cum 4.01 3.22
Normal Tariff Commercial / Social Welfare Entities
Consumption Ranges (cum) Water Sewer Consumption Ranges (cum) Water Sewer
0 to 10 R$/month 20.64 16.55 0 to 10 R$/month 20.72 16.57
11 to 20 R$/cum 2.88 2.28 11 to 20 R$/cum 2.47 1.95
21 to 50 R$/cum 4.43 3.53 21 to 50 R$/cum 4.00 3.20
above 50 R$/cum 5.29 4.21 above 50 R$/cum 4.67 3.72
OTHER SERVICES Tariff Public with contract Tariff
Water Sewer Consumption Ranges (cum) Water Sewer
Water Truck: Third Parties
R$/cum 32.87 0 to 10 R$/month 31.06 24.86
Water Truck: SABESP
R$/cum 80.67 11 to 20 R$/cum 3.66 2.94
21 to 50 R$/cum 5.97 4.75
above 50 R$/cum 6.96 5.59
REGIONAL SYSTEM BOARD: Vale do Paraiba (RV)
RV (except the Municipality of Guararema where the tariff applied is RMSP-ML)
RESIDENTIAL COMMERCIAL / INDUSTRIAL / PUBLIC
Social Tariff Normal Commercial / Industrial / Public without Contract
Consumption Ranges (cum) Water Sewer Consumption Ranges (cum) Water Sewer
0 to 10 R$/month 7.00 5.60 0 to 10 R$/month 41.45 33.14
11 to 20 R$/cum 1.09 0.88 11 to 20 R$/cum 4.91 3.90
21 to 30 R$/cum 2.37 1.88 21 to 50 R$/cum 8.18 6.55
31 to 50 R$/cum 3.37 2.71 Above 50 R$/cum 10.36 8.26
above 50 R$/cum 4.01 3.22
Normal Tariff Commercial / Social Welfare Entities
Consumption Ranges (cum) Water Sewer Consumption Ranges (cum) Water Sewer
0 to 10 R$/month 20.64 16.55 0 to 10 R$/month 20.72 16.57
11 to 20 R$/cum 2.88 2.28 11 to 20 R$/cum 2.47 1.95

21 to 50 R$/cum 4.43 3.53 21 to 50 R$/cum 4.11 3.27
above 50 R$/cum 5.29 4.21 above 50 R$/cum 5.14 4.15
OTHER SERVICES Tariff Public with contract Tariff
Water Sewer Consumption Ranges (cum) Water Sewer
Water Truck: Third Parties
R$/cum 32.87 0 to 10 R$/month 31.06 24.86
Water Truck: SABESP
R$/cum 80.67 11 to 20 R$/cum 3.66 2.94
21 to 50 R$/cum 6.12 4.93
above 50 R$/cum 7.78 6.22
Table 4
REGIONAL SYSTEM BOARD
RB: Municipalities of Adamantina and Pirapozinho
Special Commercial
Consumption Ranges (cum) Water Sewer
0 to 10 R$/month 31.09 24.87
11 to 20 R$/cum 3.68 2.90
21 to 50 R$/cum 7.92 6.34
above 50 R$/cum 9.30 7.42
Note: For other categories, the Exhibit III tariffs are applicable.
RB: Municipalities of Presidente Prudente
Special Residential
Consumption Ranges (cum) Water Sewer
0 to 10 R$/month 17.55 14.06
11 to 20 R$/cum 2.45 1.94
21 to 50 R$/cum 4.43 3.53
above 50 R$/cum 5.29 4.21
Special Commercial
Consumption Ranges (cum) Water Sewer
0 to 10 R$/month 31.09 24.87
11 to 20 R$/cum 3.68 2.90
21 to 50 R$/cum 7.92 6.34
above 50 R$/cum 9.30 7.42
Note: For other categories, the Exhibit III tariffs are applicable.
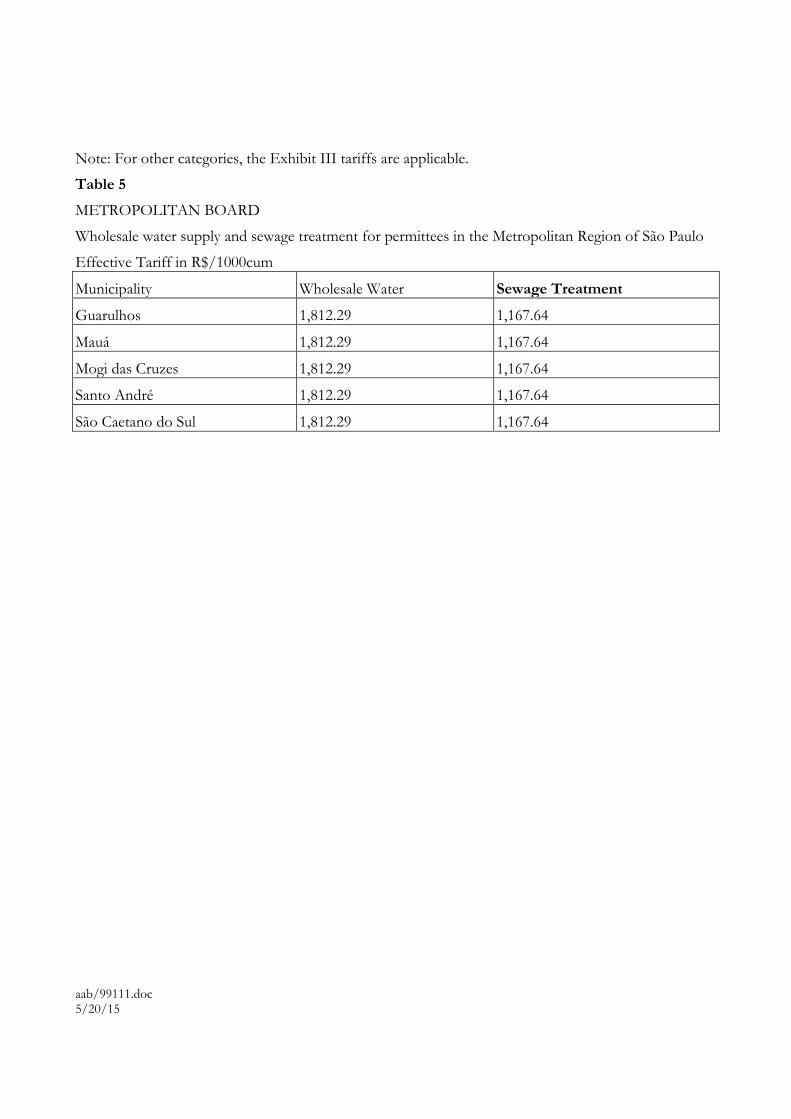
Table 5
METROPOLITAN BOARD
Wholesale water supply and sewage treatment for permittees in the Metropolitan Region of São Paulo
Effective Tariff in R$/1000cum
Municipality Wholesale Water Sewage Treatment
Guarulhos 1,812.29 1,167.64
Mauá 1,812.29 1,167.64
Mogi das Cruzes 1,812.29 1,167.64
Santo André 1,812.29 1,167.64
São Caetano do Sul 1,812.29 1,167.64
aab/99111.doc 5/20/15