
Arrays
18
Arrays
-
Upload
keith-norris -
Category
Documents
-
view
29 -
download
0
description
Arrays. Review of last lecture. Overview of IDL Strength of IDL: (1) Interactive/compiled modes; (2) Array-oriented; (3) Variables easily redefined; (4) Many built-in subroutines Open and run IDL Variables and data types Operators Line plots: basics and cosmetics. - PowerPoint PPT Presentation
Transcript of Arrays

Arrays

Review of last lecture
• Overview of IDL• Strength of IDL: (1) Interactive/compiled
modes; (2) Array-oriented; (3) Variables easily redefined; (4) Many built-in subroutines
• Open and run IDL• Variables and data types• Operators• Line plots: basics and cosmetics

General structure of an IDL program
Define variables and arrays Read input data Process data Output results and/or make plots End
Note: 1. Use semicolon ; to add comments after it2. Use $ to break a long line into multiple
lines3. Can use read, x to pause the program for
example between different plots

Introduction to Arrays
• Two most compelling reasons to use arrays in IDL
1. Array operations are much faster than loops
2. Array syntax is more compact than a corresponding loop construct
• One of the secrets to becoming an effective IDL programmer is learning how to use arrays effectively

Creating arrays
• Functions for creating arrays (1-8 dimensions)
zeroed arrays: intarr( ), fltarr( ), strarr( )
index arrays: indgen( ), findgen( ), sindgen( )
Note in IDL, index starts from 0 instead of 1
• Use index array to create a evenly-spaced array
n=10
x0=5
dx=10
arr=x0+findgen(n)*dx
print, arr
Please try to create all the arrays at the beginning of your program
Creating arrays (cont.)
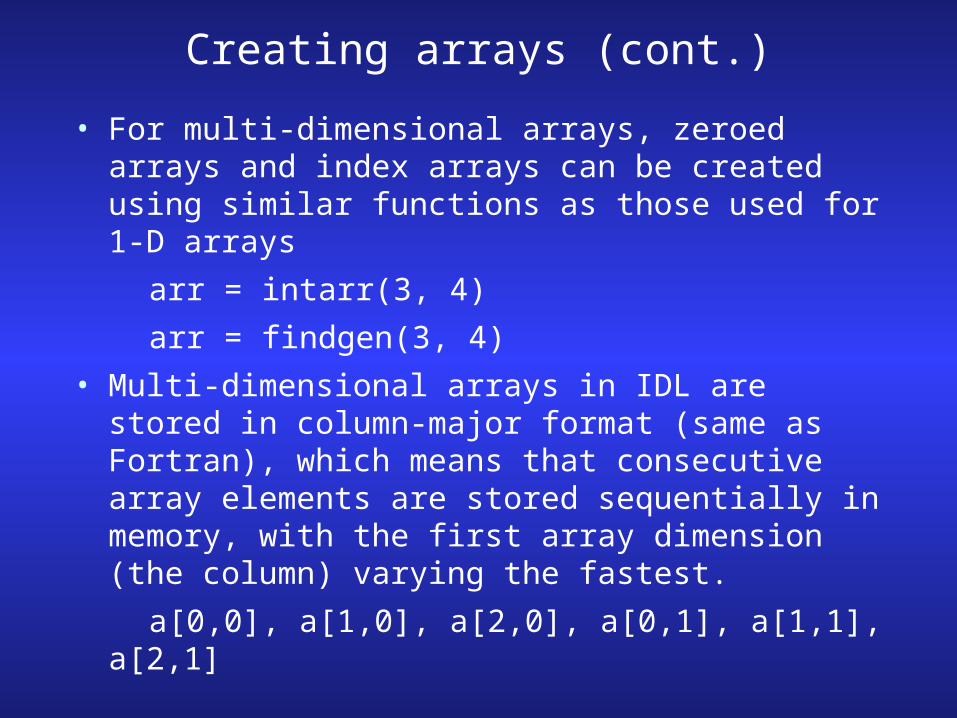
• For multi-dimensional arrays, zeroed arrays and index arrays can be created using similar functions as those used for 1-D arrays
arr = intarr(3, 4)
arr = findgen(3, 4)
• Multi-dimensional arrays in IDL are stored in column-major format (same as Fortran), which means that consecutive array elements are stored sequentially in memory, with the first array dimension (the column) varying the fastest.
a[0,0], a[1,0], a[2,0], a[0,1], a[1,1], a[2,1]

Extract a sub-array using index• 1-D Scalar index: print, arr[6] Index range: print, arr[0:3] All indices: print, arr[*] All indices from a specific index to the last index: print, arr[5:*] Indices given by a variable expression: I=3 print, arr[I-1:I+1] Indices specified by an array: index=indgen(3)*2 print, index print, arr[index]

Extract a sub-array using index (cont.)
• Multi-dimensional
One element: print, arr(i, j)
All elements in a row: print, arr[*,0]
All elements in a column: print, arr[0,*]
Index range over two dimensions: print, arr[0:3,1:2]

Extract a sub-array with values meeting a certain criteria
• Use the function “where”
arr = indgen(10)*2
print, arr
index = where(arr gt 5)
print, index
print, arr[index]
index = where(arr ne 8)
print, index
print, arr[index]

Initialize an array or sub-array with certain values
• All elements: Arr[*] = -9999.0• One element: Arr[0] = 3.0• Subset range: Arr[5:*] = 2.0• Subset specified by an array
index=indgen(3)*2
print, index
arr[index] = 4.0
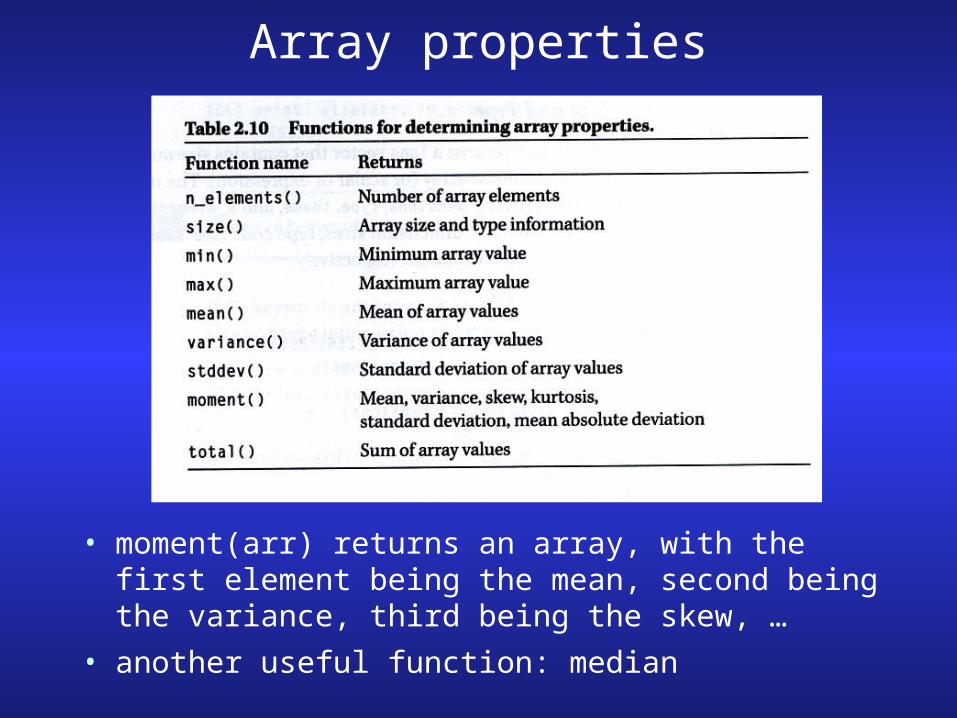
Array properties
• moment(arr) returns an array, with the first element being the mean, second being the variance, third being the skew, …
• another useful function: median

Array reordering• Changing array dimensions (reform)
automatically remove dimensions with a size of 1
arr=findgen(3,5)
arr2=arr(0,*)
help, arr2
arr2=reform(arr2)
help, arr2
• Shifting array elements (shift)
Syntax: shift(array, shift_value)
arr=indgen(5)
print, arr
print, shift(arr, 1)
print, shift(arr, -2)
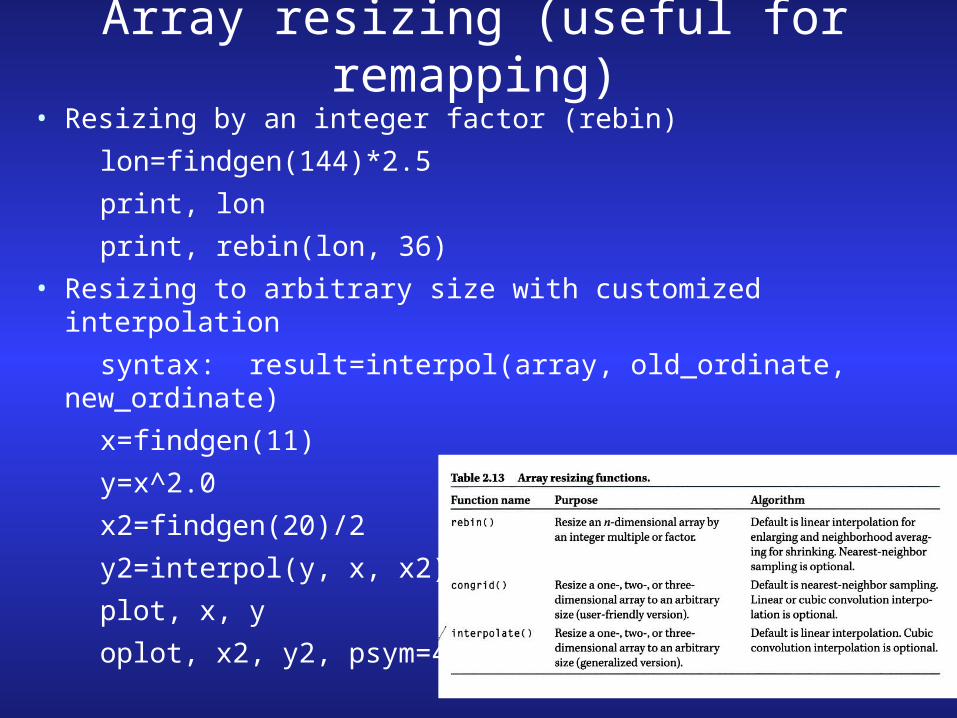
Array resizing (useful for remapping)
• Resizing by an integer factor (rebin)
lon=findgen(144)*2.5
print, lon
print, rebin(lon, 36)
• Resizing to arbitrary size with customized interpolation
syntax: result=interpol(array, old_ordinate, new_ordinate)
x=findgen(11)
y=x^2.0
x2=findgen(20)/2
y2=interpol(y, x, x2)
plot, x, y
oplot, x2, y2, psym=4

Plot: Omitting default axes
• Plot, x, y, xstyle=4 (or 8), ystyle=4 (or 8)

Creating customized axes• The axis procedure may be used to create customized axes on
existing plots. Often used when one or more variables with different units are plotted with respect to the same ordinates
axis, [x or y]axis=[0 or 1], [xy]range= …, [xy]title=…
(where xaxis=0 bottom, xaxis=1 top, yaxis=0 left, yaxis=1 right)
• Example:
t=findgen(11)
g=9.8
v=g*t
x=0.5*g*t^2.0
plot, t, v, /nodata, ystyle=4, xtitle=“Time”
axis, yaxis=0, yrange=[0,100], /save, ytitle=“Velocity”
oplot, t, v
axis, yaxis=1, yrange=[0, 500], /save, ytitle=“Distance”
oplot, t, x, linestyle=2

Multiple panels and plot positioning
• Global system variables
• Multiple panels !p.multi=[0, n_columns, n_rows, 0, 0] To disable multiple panels: !p.multi=0• Plot positioning !p.position=[x1, y1, x2, y2]
Summary
• Creating arrays• Extract a sub-array using index• Initialize an array• Array properties: n_elements, size, max,
min, moment, total• Array reordering: reform, reverse,
rotate, transpose, shift, sort, unique• Array resizing: rebin, congrid,
interpolate

In-class assignment II• Create a 3x3 snake array. Calculate and print (1)
mean, variance, and total of the array; (2) rotate the array by 90 and 180 degrees; (3) transpose the array; and (4) shift the first index of the array by 2.
• Assume time t=findgen(12)+1 is the 12 months of a year, the GDP index is GDP1=2sin(t/2.0)+5 for country A and GDP2=3cos(t/3.0)+5 for country B, while the stock index is STOCK1=5sin(t/2.5)+7 for country A and STOCK2=4cos(t/3.5)+8 for country B. Please make a 5-panel plot with each time series in one separate panel, and all four time series in the last panel. Please adjust the titles and axes to make the plots look good. The ticknames for x axis should be “Jan”, “Feb”, …, “Dec”.


![Java Script: Arrays (Chapter 11 in [2]). 2 Outline Introduction Introduction Arrays Arrays Declaring and Allocating Arrays Declaring and Allocating Arrays.](https://static.fdocuments.in/doc/165x107/56649ed85503460f94be6c77/java-script-arrays-chapter-11-in-2-2-outline-introduction-introduction.jpg)


