Around the world in 80 days - ULI...
17
David Morley February 09 2010 Around the world in 80 days Africa
Transcript of Around the world in 80 days - ULI...

David Morley
February 09 2010
Around the world in 80 days Africa
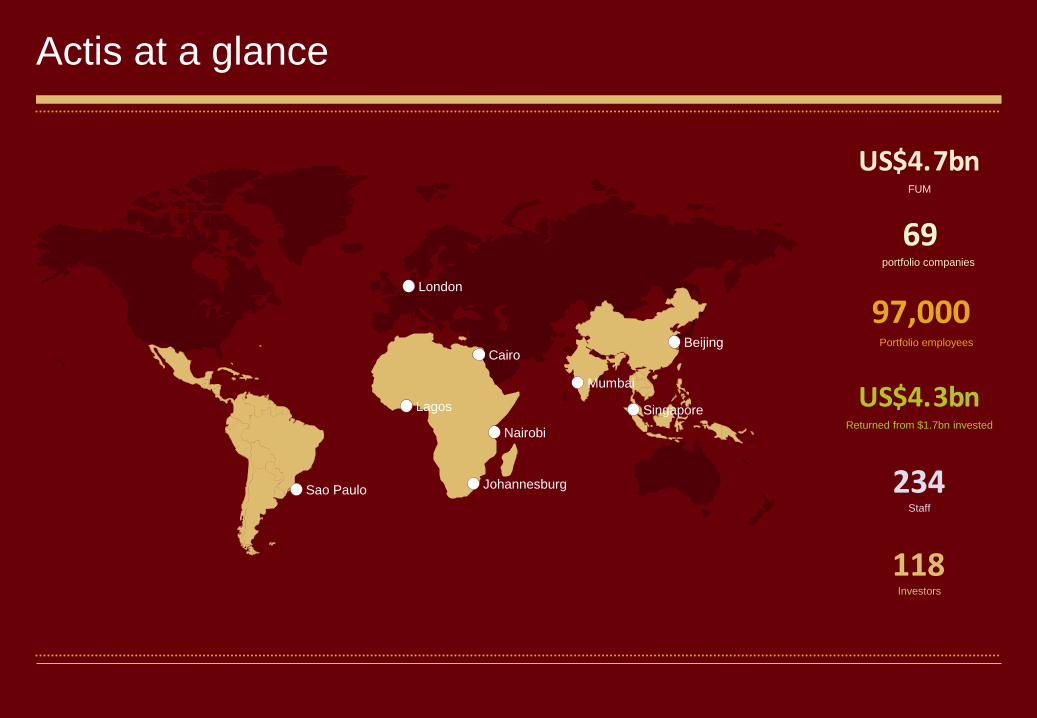
Actis at a glance
Sao Paulo
London
Cairo
Lagos
Johannesburg
Nairobi
Mumbai
Singapore
Beijing Portfolio employees
Returned from $1.7bn invested
FUM
portfolio companies
Investors
Staff

Africa may not be China but.....
0% 5% 10%
OECD
MENA
Brazil
Russia
SSA
SSA (ex-SA)
China
India
2011 GDP growth
Inflation
31.0%
12.0%
1990s
2000s
Current account deficit
External debt as % of GDP
(2.4)%
(0.5)%
1990s
2000s
64.0%
42.0%
1990s
2000s

... Same emerging market drivers
Source: UNCTAD; IMF; Grail analysis
4.0%
3.2%
3.1%
2.6%
2.5%
1.9%
1.4%
0.2%
0% 1% 2% 3% 4% 5%
SSA
China
E, S & SE Asia
MENA
India
S & C America +Caribbean
N America
EU
0
100
200
300
400
500
600
1995 2000 2005 2010E 2015E
To
tal u
rba
n p
op
ula
tio
n (
m)
SSA
Developed economies: America
Developed economies: Europe
By 2015, the urban population in
SSA will be greater than that in
developed countries in Europe
In 2005, the urban population in
SSA exceeded that in developed
countries in America

Urban areas in 2020
Source: http://www.citymayors.com/statistics/urban_2020_1.html
0
5
10
15
20
25
mill
ions

Clear opportunity
Source: UNCTAD; IMF; Grail analysis
1.6m
2.5m
17.0m
2.3m
1.0m
0 2 4 6
Uganda
Tanzania
Nigeria
Kenya
Ghana
69
1
1
2
1
0 20 40 60 80
Jo'burg
Kampala
Lagos
Nairobi
Accra
0.003
0.004
0.041
0.032
0.047
0 0.02 0.04 0.06
Tokyo
South Africa
Tanzania
Ghana
Nigeria
Housing deficit (m units) Office rental per GNI per
capita
Number of A-grade
shopping malls

Without the wall of capital
Source: EMPEA
0 20 40 60 80 100 120 140
Africa
Emerging markets
Global
$bn

Fragmented markets (Mckinsey)
Diversified economies Oil exporters
Transition economies Pre-transition economies

Where we play

Lagos Growth
mill
ions
0
4
8
12
16
20
24

Lagos

Office stock
0 5 10 15 20 25 30
Lagos
Barcelona
Milan
Rome
Madrid
Frankfurt
London
Berlin
Munich
Paris
million m2

The second A grade mall

Perceived risks
Limited number of
established GPs
Political risk
Weak exit environments
Challenging regulatory /
tax environments
Scale of opportunity to
invest is too small 27%
29%
34%
58%
60%
2010 EMPEA/Coller Capital Survey % respondents

And what do we think about it?
Execution
Liquidity
ESG
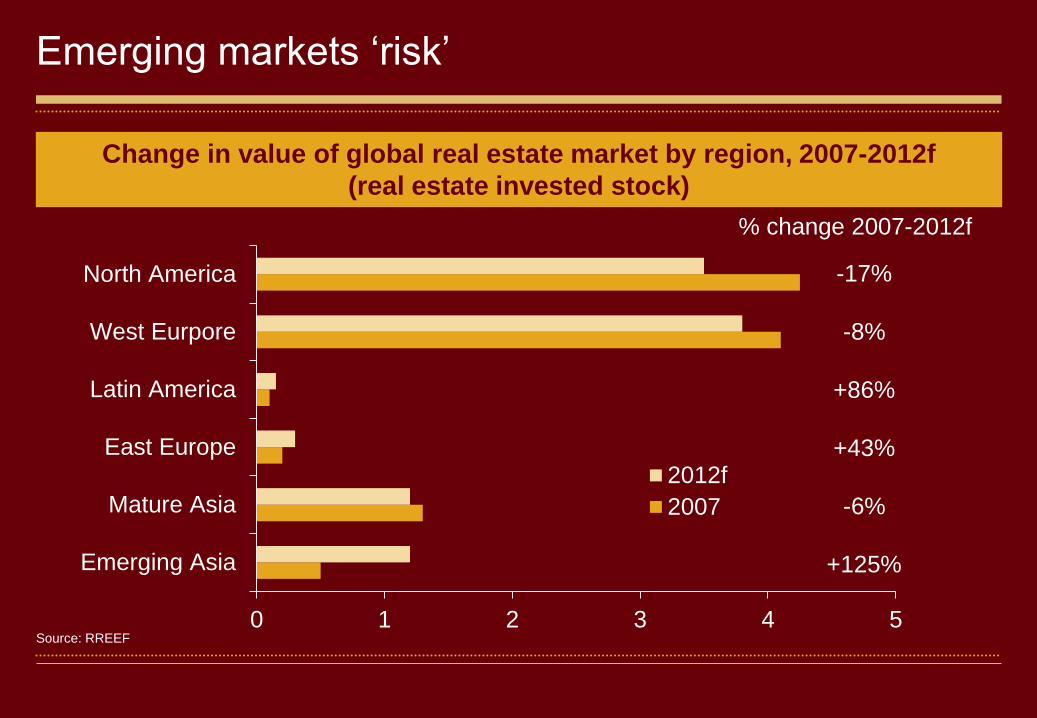
Emerging markets ‘risk’
Source: RREEF 0 1 2 3 4 5
Emerging Asia
Mature Asia
East Europe
Latin America
West Eurpore
North America
2012f
2007
Change in value of global real estate market by region, 2007-2012f
(real estate invested stock)
% change 2007-2012f
-17%
-8%
+86%
+43%
-6%
+125%

Thank you