AROTECH CORPORATION · Other accounts payable and accrued expenses 5,243,990 5,597,558 Current ......
25
OMB APPROVAL OMB Number: 3235-0070 Expires: September 30, 2018 Estimated average burden hours per response 187.43 UNITED STATES SECURITIES AND EXCHANGE COMMISSION Washington, D.C. 20549 FORM 10-Q ☒ QUARTERLY REPORT PURSUANT TO SECTION 13 OR 15(d) OF THE SECURITIES EXCHANGE ACT OF 1934 FOR THE QUARTERLY PERIOD ENDED September 30, 2017 . Commission file number: 0-23336 AROTECH CORPORATION (Exact name of registrant as specified in its charter) Delaware 95-4302784 (State or other jurisdiction of incorporation or organization) (I.R.S. Employer Identification No.) 1229 Oak Valley Drive, Ann Arbor, Michigan 48108 (Address of principal executive offices) (Zip Code) (800) 281-0356 (Registrant’s telephone number, including area code) ______________________________________________________________________________________ (Former name, former address and former fiscal year, if changed since last report) Indicate by check mark whether the registrant (1) has filed all reports required to be filed by Section 13 or 15(d) of the Securities Exchange Act of 1934 during the preceding 12 months (or for such shorter period that the registrant was required to file such reports), and (2) has been subject to such filing requirements for the past 90 days. Yes ☒ No ☐ Indicate by check mark whether the registrant has submitted electronically and posted on its corporate Web site, if any, every Interactive Data File required to be submitted and posted pursuant to Rule 405 of Regulation S-T (§ 232.405 of this chapter) during the preceding 12 months (or for such shorter period that the registrant was required to submit and post such files). Yes ☒ No ☐ Indicate by check mark whether the registrant is large accelerated filer, an accelerated filer, a non-accelerated filer, smaller reporting company, or an emerging growth company. See definition of “large accelerated filer,” accelerated filer” “smaller reporting company,” and “emerging growth company” in Rule 12b-2 of the Exchange Act: Large accelerated filer: £ Accelerated filer: T Non-accelerated filer: £ (Do not check if a smaller reporting company) Smaller reporting company: £ Emerging growth company: £ If an emerging growth company, indicate by check mark if the registrant has elected not to use the extended transition period for complying with any new or revised financial accounting standards provided pursuant to Section 13(a) of the Exchange Act. £ Indicate by check mark whether the registrant is a shell company (as defined in Rule 12b-2 of the Exchange Act). Yes £ No T The number of shares outstanding of the issuer’s common stock as of November 3, 2017 was 26,395,048 . SEC 1296 (01-12) Potential persons who are to respond to the collection of information contained in this form are not required to respond unless the form displays a currently valid OMB control number.
Transcript of AROTECH CORPORATION · Other accounts payable and accrued expenses 5,243,990 5,597,558 Current ......

OMB APPROVALOMB Number: 3235-0070Expires: September 30, 2018Estimated average burdenhours per response 187.43
UNITED STATESSECURITIES AND EXCHANGE COMMISSION
Washington, D.C. 20549
FORM 10-Q
☒ QUARTERLY REPORT PURSUANT TO SECTION 13 OR 15(d) OF THE SECURITIES EXCHANGE ACT OF 1934FOR THE QUARTERLY PERIOD ENDED September 30, 2017.
Commission file number: 0-23336
AROTECH CORPORATION(Exact name of registrant as specified in its charter)
Delaware 95-4302784(State or other jurisdiction ofincorporation or organization)
(I.R.S. EmployerIdentification No.)
1229 Oak Valley Drive, Ann Arbor, Michigan 48108(Address of principal executive offices) (Zip Code)
(800) 281-0356(Registrant’s telephone number, including area code)
______________________________________________________________________________________(Former name, former address and former fiscal year, if changed since last report)
Indicate by check mark whether the registrant (1) has filed all reports required to be filed by Section 13 or 15(d) of the SecuritiesExchange Act of 1934 during the preceding 12 months (or for such shorter period that the registrant was required to file such reports), and(2) has been subject to such filing requirements for the past 90 days. Yes ☒ No ☐
Indicate by check mark whether the registrant has submitted electronically and posted on its corporate Web site, if any, every InteractiveData File required to be submitted and posted pursuant to Rule 405 of Regulation S-T (§ 232.405 of this chapter) during the preceding 12months (or for such shorter period that the registrant was required to submit and post such files). Yes ☒ No ☐
Indicate by check mark whether the registrant is large accelerated filer, an accelerated filer, a non-accelerated filer, smaller reportingcompany, or an emerging growth company. See definition of “large accelerated filer,” accelerated filer” “smaller reporting company,” and“emerging growth company” in Rule 12b-2 of the Exchange Act:
Large accelerated filer: £ Accelerated filer: TNon-accelerated filer: £
(Do not check if a smaller reporting company)Smaller reporting company: £
Emerging growth company: £
If an emerging growth company, indicate by check mark if the registrant has elected not to use the extended transition period forcomplying with any new or revised financial accounting standards provided pursuant to Section 13(a) of the Exchange Act. £
Indicate by check mark whether the registrant is a shell company (as defined in Rule 12b-2 of the Exchange Act). Yes £ No T
The number of shares outstanding of the issuer’s common stock as of November 3, 2017 was 26,395,048 .
SEC 1296 (01-12)Potential persons who are to respond to the collection of information contained in this form are not
required to respond unless the form displays a currently valid OMB control number.

TABLE OF CONTENTS
Item PagePART I - FINANCIAL INFORMATION
Item 1 – Financial Statements (Unaudited): 3Condensed Consolidated Balance Sheets at September 30, 2017 and December 31, 2016 3Condensed Consolidated Statements of Comprehensive Income for the Three and Nine Months Ended September 30, 2017and 2016
5
Condensed Consolidated Statements of Cash Flows for the Three and Nine Months Ended September 30, 2017 and 2016 6Notes to the Interim Condensed Consolidated Financial Statements 8Item 2 – Management’s Discussion and Analysis of Financial Condition and Results of Operations 14Item 3 – Quantitative and Qualitative Disclosures about Market Risk 19Item 4 – Controls and Procedures 19
PART II - OTHER INFORMATION
Item 6 – Exhibits 20
SIGNATURES 21
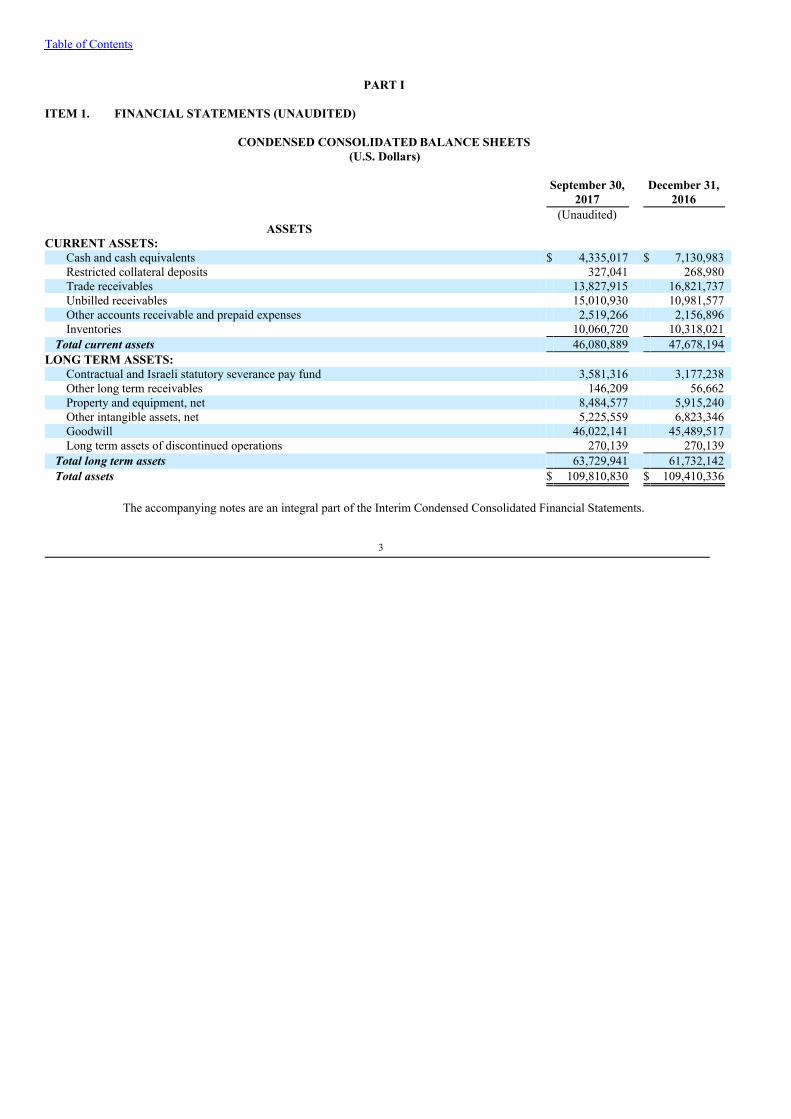
Table of Contents
PART I
ITEM 1. FINANCIAL STATEMENTS (UNAUDITED)
CONDENSED CONSOLIDATED BALANCE SHEETS(U.S. Dollars)
September 30,
2017 December 31,
2016 (Unaudited)
ASSETS CURRENT ASSETS:
Cash and cash equivalents $ 4,335,017 $ 7,130,983 Restricted collateral deposits 327,041 268,980 Trade receivables 13,827,915 16,821,737 Unbilled receivables 15,010,930 10,981,577 Other accounts receivable and prepaid expenses 2,519,266 2,156,896 Inventories 10,060,720 10,318,021
Total current assets 46,080,889 47,678,194 LONG TERM ASSETS:
Contractual and Israeli statutory severance pay fund 3,581,316 3,177,238 Other long term receivables 146,209 56,662 Property and equipment, net 8,484,577 5,915,240 Other intangible assets, net 5,225,559 6,823,346 Goodwill 46,022,141 45,489,517 Long term assets of discontinued operations 270,139 270,139
Total long term assets 63,729,941 61,732,142 Total assets $ 109,810,830 $ 109,410,336
The accompanying notes are an integral part of the Interim Condensed Consolidated Financial Statements.
3

Table of Contents
CONDENSED CONSOLIDATED BALANCE SHEETS(U.S. Dollars, except share data)
September 30,
2017 December 31,
2016 (Unaudited)
LIABILITIES AND STOCKHOLDERS’ EQUITY CURRENT LIABILITIES:
Trade payables $ 6,095,039 $ 4,362,804 Other accounts payable and accrued expenses 5,243,990 5,597,558 Current portion of long term debt 2,248,417 1,828,840 Short term bank credit 3,077,959 2,973,032 Severance payable – 2,577,472 Deferred revenues 4,590,088 6,421,271
Total current liabilities 21,255,493 23,760,977 LONG TERM LIABILITIES:
Contractual and accrued Israeli statutory severance pay 4,530,550 3,891,710 Long term portion of debt 9,131,490 8,703,736 Deferred income tax liability 8,554,033 7,868,125 Other long term liabilities 99,782 100,742
Total long-term liabilities 22,315,855 20,564,313 Total liabilities 43,571,348 44,325,290
STOCKHOLDERS’ EQUITY: Share capital – Common stock – $0.01 par value each;Authorized: 50,000,000 shares as of September 30, 2017 and December 31, 2016;Issued and outstanding: 26,395,048 shares and 26,438,234 shares as ofSeptember 30, 2017 and December 31, 2016, respectively 263,951 264,382 Preferred shares – $0.01 par value each;Authorized: 1,000,000 shares as of September 30, 2017 and December 31, 2016;No shares issued or outstanding as of September 30, 2017 and December 31, 2016 – – Additional paid-in capital 250,714,497 250,405,012 Accumulated deficit (185,977,610) (185,402,893)Notes receivable from stockholders (908,054) (908,054)Accumulated other comprehensive income 2,146,698 726,599
Total stockholders’ equity 66,239,482 65,085,046 Total liabilities and stockholders’ equity $ 109,810,830 $ 109,410,336
The accompanying notes are an integral part of the Interim Condensed Consolidated Financial Statements.
4

Table of Contents
CONDENSED CONSOLIDATED STATEMENTS OF COMPREHENSIVE INCOME(UNAUDITED)
(U.S. Dollars, except share data)
Nine months ended September
30, Three months ended September
30, 2017 2016 2017 2016 Revenues $ 69,726,579 $ 71,486,478 $ 25,930,441 $ 24,300,120 Cost of revenues 50,007,949 48,933,171 18,673,955 16,436,276 Research and development expenses 2,791,519 2,367,964 1,031,669 752,847 Selling and marketing expenses 5,674,653 4,913,076 1,707,209 1,458,622 General and administrative expenses 8,588,759 11,149,640 2,732,171 3,122,853 Amortization of intangible assets 1,728,956 2,164,937 509,303 698,297 Total operating costs and expenses 68,791,836 69,528,788 24,654,307 22,468,895 Operating income 934,743 1,957,690 1,276,134 1,831,225 Other income (expense), net (13,498) 49,913 (23,758) 3,481 Financial expense, net (749,967) (769,328) (200,923) (227,474)Total other expense (763,465) (719,415) (224,681) (223,993)Income from continuing operations before income taxexpense 171,278 1,238,275 1,051,453 1,607,232 Income tax expense 745,995 684,272 263,235 101,992 Income (loss) from continuing operations (574,717) 554,003 788,218 1,505,240 Loss from discontinued operations – (1,361,787) – (869,302)Net income (loss) (574,717) (807,784) 788,218 635,938 Other comprehensive income (loss), net of income tax: Foreign currency translation adjustment 1,420,099 406,892 (166,075) 344,837 Comprehensive income (loss) $ 845,382 $ (400,892) $ 622,143 $ 980,775 Income (loss) per share of common stock: Basic – continuing operations $ (0.02) $ 0.02 $ 0.03 $ 0.06 Basic – discontinued operations $ – $ (0.05) $ – $ (0.04)Basic net income (loss) per share $ (0.02) $ (0.03) $ 0.03 $ 0.02 Diluted – continuing operations $ (0.02) $ 0.02 $ 0.03 $ 0.06 Diluted – discontinued operations $ – $ (0.05) $ – $ (0.04)Diluted net income (loss) per share $ (0.02) $ (0.03) $ 0.03 $ 0.02 Weighted average number of shares used in computing basic
net income (loss) per share 26,202,386 25,410,494 26,394,613 26,215,049 Weighted average number of shares used in computing
diluted net income (loss) per share 26,202,386 25,410,494 26,394,613 26,215,049
The accompanying notes are an integral part of the Interim Condensed Consolidated Financial Statements.
5

Table of Contents
CONSOLIDATED STATEMENT OF CASH FLOWS (UNAUDITED)(U.S. Dollars)
Nine months ended September
30, 2017 2016 CASH FLOWS FROM OPERATING ACTIVITIES: Net loss $ (574,717) $ (807,784)Adjustments required to reconcile net loss to net cash provided by (used in) operating activities:
Depreciation 1,277,985 1,322,595 Amortization of intangible assets 1,728,956 2,164,937 Stock based compensation 309,053 785,738 Deferred tax provision 685,908 607,925
Changes in operating assets and liabilities: Trade receivables 3,416,571 372,779 Unbilled receivables (4,008,309) 433,010 Other accounts receivable and prepaid expenses (391,646) (1,420,274)Inventories 620,751 (819,411)Severance pay, net (1,981,943) 436,682 Trade payables 1,815,709 (1,166,222)Other accounts payable and accrued expenses (223,856) (341,418)Deferred revenues (1,831,183) (1,071,511)
Net cash provided by operating activities 843,279 497,046 CASH FLOWS FROM INVESTING ACTIVITIES:
Decrease in restricted collateral deposits (33,398) (139,192)Purchase of property and equipment (3,733,323) (1,108,356)Additions to capitalized software (131,169) (27,951)
Net cash used in investing activities $ (3,897,890) $ (1,275,499)
The accompanying notes are an integral part of the Interim Condensed Consolidated Financial Statements.
6

Table of Contents
CONSOLIDATED STATEMENT OF CASH FLOWS (UNAUDITED)(U.S. Dollars)
Nine months ended September
30, 2017 2016 CASH FLOWS FROM FINANCING ACTIVITIES:
Proceeds from long term debt $ 2,150,000 $ 11,000,000 Repayment of long term debt (1,284,278) (16,380,225)Proceeds from the issuance of common stock – 2,952,999 Change in short term bank credit 104,927 3,349,208
Net cash provided by financing activities 970,649 921,982 INCREASE (DECREASE) IN CASH AND CASH EQUIVALENTS (2,083,962) 143,529 CASH DIFFERENCES DUE TO EXCHANGE RATE DIFFERENCES (712,004) (429,371)CASH AND CASH EQUIVALENTS AT THE BEGINNING OF THE PERIOD 7,130,983 10,608,420 CASH AND CASH EQUIVALENTS AT THE END OF THE PERIOD $ 4,335,017 $ 10,322,578 SUPPLEMENTARY CASH FLOW INFORMATION:
Interest paid during the period $ 531,210 $ 574,547 Taxes paid on income during the period $ 152,444 $ 111,441
The accompanying notes are an integral part of the Interim Condensed Consolidated Financial Statements.
7
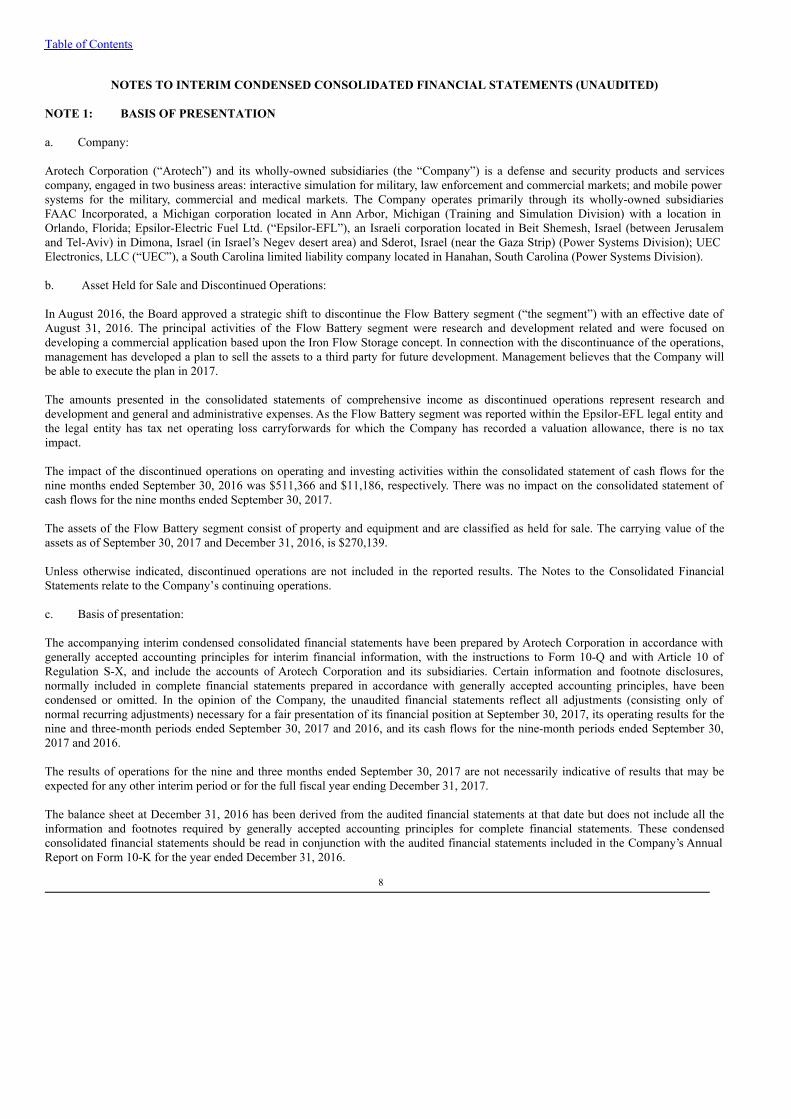
Table of Contents
NOTES TO INTERIM CONDENSED CONSOLIDATED FINANCIAL STATEMENTS (UNAUDITED)
NOTE 1: BASIS OF PRESENTATION
a. Company:
Arotech Corporation (“Arotech”) and its wholly-owned subsidiaries (the “Company”) is a defense and security products and servicescompany, engaged in two business areas: interactive simulation for military, law enforcement and commercial markets; and mobile powersystems for the military, commercial and medical markets. The Company operates primarily through its wholly-owned subsidiariesFAAC Incorporated, a Michigan corporation located in Ann Arbor, Michigan (Training and Simulation Division) with a location inOrlando, Florida; Epsilor-Electric Fuel Ltd. (“Epsilor-EFL”), an Israeli corporation located in Beit Shemesh, Israel (between Jerusalemand Tel-Aviv) in Dimona, Israel (in Israel’s Negev desert area) and Sderot, Israel (near the Gaza Strip) (Power Systems Division); UECElectronics, LLC (“UEC”), a South Carolina limited liability company located in Hanahan, South Carolina (Power Systems Division).
b. Asset Held for Sale and Discontinued Operations:
In August 2016, the Board approved a strategic shift to discontinue the Flow Battery segment (“the segment”) with an effective date ofAugust 31, 2016. The principal activities of the Flow Battery segment were research and development related and were focused ondeveloping a commercial application based upon the Iron Flow Storage concept. In connection with the discontinuance of the operations,management has developed a plan to sell the assets to a third party for future development. Management believes that the Company willbe able to execute the plan in 2017.
The amounts presented in the consolidated statements of comprehensive income as discontinued operations represent research anddevelopment and general and administrative expenses. As the Flow Battery segment was reported within the Epsilor-EFL legal entity andthe legal entity has tax net operating loss carryforwards for which the Company has recorded a valuation allowance, there is no taximpact.
The impact of the discontinued operations on operating and investing activities within the consolidated statement of cash flows for thenine months ended September 30, 2016 was $511,366 and $11,186, respectively. There was no impact on the consolidated statement ofcash flows for the nine months ended September 30, 2017.
The assets of the Flow Battery segment consist of property and equipment and are classified as held for sale. The carrying value of theassets as of September 30, 2017 and December 31, 2016, is $270,139.
Unless otherwise indicated, discontinued operations are not included in the reported results. The Notes to the Consolidated FinancialStatements relate to the Company’s continuing operations.
c. Basis of presentation:
The accompanying interim condensed consolidated financial statements have been prepared by Arotech Corporation in accordance withgenerally accepted accounting principles for interim financial information, with the instructions to Form 10-Q and with Article 10 ofRegulation S-X, and include the accounts of Arotech Corporation and its subsidiaries. Certain information and footnote disclosures,normally included in complete financial statements prepared in accordance with generally accepted accounting principles, have beencondensed or omitted. In the opinion of the Company, the unaudited financial statements reflect all adjustments (consisting only ofnormal recurring adjustments) necessary for a fair presentation of its financial position at September 30, 2017, its operating results for thenine and three-month periods ended September 30, 2017 and 2016, and its cash flows for the nine-month periods ended September 30,2017 and 2016.
The results of operations for the nine and three months ended September 30, 2017 are not necessarily indicative of results that may beexpected for any other interim period or for the full fiscal year ending December 31, 2017.
The balance sheet at December 31, 2016 has been derived from the audited financial statements at that date but does not include all theinformation and footnotes required by generally accepted accounting principles for complete financial statements. These condensedconsolidated financial statements should be read in conjunction with the audited financial statements included in the Company’s AnnualReport on Form 10-K for the year ended December 31, 2016.
8

Table of Contents
d. Goodwill and other long-lived assets:
Goodwill and indefinite-lived intangible assets are tested for impairment at least annually and between annual tests in certaincircumstances, and written down when impaired. Goodwill is tested for impairment by comparing the fair value of the Company’sreporting units with the carrying value. The Training and Simulation and the Power Systems reporting units have goodwill.
As of its last annual impairment test at December 31, 2016, the Company determined that the goodwill for both reporting units was notimpaired.
Consistent with previous interim reporting periods, the Company monitors qualitative and quantitative factors, including internalprojections, periodic forecasts, and actual results of the reporting unit. Based upon this interim review, the Company does not believe thatgoodwill or its indefinite-lived intangible assets related to either reporting unit is impaired.
e. Reclassification:
Certain comparative data in these financial statements may have been reclassified to conform to the current year’s presentation. Theresulting reclassifications have not resulted in a change to total assets, net income, or stockholders’ equity.
f. Contingencies
The Company is from time to time involved in legal proceedings and other claims. The Company is required to assess the likelihood ofany adverse judgments or outcomes to these matters, as well as potential ranges of probable losses. The Company has not made anymaterial changes in the accounting methodology used to establish its self-insured liabilities during the past three fiscal years.
A determination of the amount of reserves required, if any, for any contingencies is made after careful analysis of each individual issue.The required reserves may change due to future developments in each matter or changes in approach, such as a change in the settlementstrategy in dealing with any contingencies, which may result in higher net loss.
g. Certain relationships and related transactions
On February 2, 2016, the Company entered into a three-year consulting agreement with a business controlled by a member of the Boardof Directors. In exchange, the Company pays an annual fee equal to the Board member in the amount of the difference between totalaccrued compensation of the Board member and $125,000.
In December 2016, the Company and its former Chief Executive Officer (“former Executive”) agreed to terms whereby the Company andits former Executive agreed to early termination of the former Executive’s employment agreement. As of December 31, 2016, the amountdue to the estate of the former Executive was approximately $2.6 million. The Company paid approximately $1.8 million to the estate ofthe former Executive in March 2017. The remainder of $800,000 payable to the local taxing authorities was remitted in April 2017.
h. Accounting for stock-based compensation:
For the three months ended September 30, 2017 and 2016 the compensation expense recorded related to restricted stock units andrestricted shares was $116,127 and $137,252, respectively. For the nine months ended September 30, 2017 and 2016 the compensationexpense recorded related to restricted stock units and restricted shares was $309,053 and $410,738, respectively. The remaining totalcompensation cost related to share awards not yet recognized in the income statement as of September 30, 2017 was $250,946. Theweighted average period over which this compensation cost is expected to be recognized is approximately one and one-half years. As theCompany is in a net operating loss position, the Company has recorded a full valuation allowance on the deferred tax impact of its stockbased compensation.
On February 2, 2016, the Company and an investor (the “Investor”) entered into a Stock Purchase Agreement (the “InvestmentAgreement”) providing for the sale to the Investor of a total of 1,500,000 shares of the Company’s common stock at a price valued at$1.99 per share. As the Investor was also given the right to nominate a member of the Board of Directors pursuant to the terms of theInvestment Agreement, and the shares were issued at a discount to the then-market price, this resulted in additional stock compensationexpense in the first nine months of 2016 of $375,000.
9

Table of Contents
i. Basic and diluted net income per share:
Basic net income per share is computed based on the weighted average number of shares of common stock and participating securitiesoutstanding during each year. Diluted net income per share includes the dilutive effect of additional potential common stock issuableunder our share-based compensation plans, using the “treasury stock” method. Unvested restricted stock issued to our employees anddirectors are “participating securities” and as such, are included, net of estimated forfeitures, in the total shares used to calculate theCompany’s basic and diluted net income per share. In the event of a net loss, unvested restricted stock awards are excluded from thecalculation of both basic and diluted net loss per share. The total weighted average number of shares related to the outstanding commonstock equivalents excluded from the calculations of diluted net loss per share for the three and nine month periods ended September 30,2017 and 2016, were none and 172,793; and none and 715,325, respectively.
NOTE 2: FAIR VALUE MEASUREMENT
The carrying value of short term assets and liabilities in the accompanying condensed consolidated balance sheets for cash and cashequivalents, restricted collateral deposits, trade receivables, unbilled receivables, inventories, prepaid and other assets, trade payables,accrued expenses, deferred revenues and other liabilities as of September 30, 2017 and December 31, 2016, approximate fair valuebecause of the short maturity of these instruments. The carrying amounts of long term debt approximates the estimated fair values atSeptember 30, 2017, based upon the Company’s ability to acquire similar debt at similar maturities.
NOTE 3: INVENTORIES
Inventories are stated at net realizable value. Cost is determined using the average cost method or the FIFO method. The Companyperiodically evaluates the quantities on hand relative to current and historical selling prices and historical and projected sales volume.Based on these evaluations, provisions are made in each period to write down inventory to its net realizable value. Inventory write-offsare provided to cover risks arising from slow-moving items, technological obsolescence, excess inventories, and for market prices lowerthan cost. Inventories in the Training and Simulation Division decreased $147,000 from December 31, 2016 to September 30, 2017 anddecreased $110,000 in the Power Systems Division in that same time period:
September 30,
2017 December 31,
2016 (Unaudited) Raw and packaging materials $ 8,031,884 $ 8,512,006 Work in progress 1,322,200 917,582 Finished products 706,636 888,433 Total: $ 10,060,720 $ 10,318,021
NOTE 4: SEGMENT INFORMATION
a. The Company and its subsidiaries operate in two business segments. The two segments are also treated by the Company asreporting units for goodwill impairment evaluation purposes. The goodwill amounts associated with the Training and Simulation Divisionand the Power Systems Division were determined and valued when the specific businesses were purchased.
The Company’s reportable segments have been determined in accordance with the Company’s internal management structure, which isorganized based on operating activities. The accounting policies of the reportable segments are the same as those used by the Company inthe preparation of its annual financial statements. The Company evaluates performance based on two primary factors, one is thesegment’s operating income and the other is the segment’s contribution to the Company’s future strategic growth.
b. The following is information about reported segment revenues, income (losses) from continuing operations, and total assets as ofand for the periods ended September 30, 2017 and 2016:
10

Table of Contents
Training andSimulation
Division Power Systems
Division CorporateExpenses
TotalCompany
Nine months ended September 30, 2017 Revenues from outside customers $ 35,139,969 $ 34,586,610 $ – $ 69,726,579 Depreciation and amortization expense(1) (772,736) (2,230,750) (3,455) (3,006,941)Direct expenses(2) (29,723,546) (33,425,392) (2,649,455) (65,798,393)
Segment operating income (loss) $ 4,643,687 $ (1,069,532) $ (2,652,910) $ 921,245 Financial income (expense) (77,975) (170,381) (501,611) (749,967)Income tax expense (105,000) 44,913 (685,908) (745,995)Income (loss) from continuing operations $ 4,460,712 $ (1,195,000) $ (3,840,429) $ (574,717)Segment assets(3) $ 48,550,296 $ 57,675,628 $ 3,314,767 $ 109,540,691 Additions to long-lived assets $ 2,454,099 $ 1,410,393 $ – $ 3,864,492 Nine months ended September 30, 2016 Revenues from outside customers $ 36,519,124 $ 34,967,354 $ – $ 71,486,478 Depreciation and amortization expense(1) (825,178) (2,649,545) (12,809) (3,487,532)Direct expenses(2) (29,218,054) (32,217,155) (4,556,134) (65,991,343)
Segment operating income (loss) $ 6,475,892 $ 100,654 $ (4,568,943) $ 2,007,603 Financial income (expense) (29,593) (58,858) (680,877) (769,328)Income tax expense 51,285 (127,632) (607,925) (684,272)Income (loss) from continuing operations $ 6,497,584 $ (85,836) $ (5,857,745) $ 554,003 Segment assets(3) $ 46,650,797 $ 61,131,101 $ 8,681,031 $ 116,462,929 Additions to long-lived assets $ 236,866 $ 668,854 $ – $ 905,720 Three months ended September 30, 2017 Revenues from outside customers $ 14,596,967 $ 11,333,474 $ – $ 25,930,441
Depreciation and amortization expense(1) (224,611) (698,939) (1,183) (924,733)
Direct expenses(2) (11,672,943) (11,269,961) (810,428) (23,753,332)Segment operating income (loss) $ 2,699,413 $ (635,426) $ (811,611) $ 1,252,376
Financial income (expense) (40,706) 7,367 (167,584) (200,923)Income tax expense (35,000) 401 (228,636) (263,235)Income (loss) from continuing operations $ 2,623,707 $ (627,658) $ (1,207,831) $ 788,218 Three months ended September 30, 2016 Revenues from outside customers $ 11,871,987 $ 12,428,133 $ – $ 24,300,120 Depreciation and amortization expense(1) (276,151) (874,163) (2,552) (1,152,866)Direct expenses(2) (8,795,338) (11,451,439) (1,065,771) (21,312,548)
Segment operating income (loss) $ 2,800,498 $ 102,531 $ (1,068,323) $ 1,834,706 Financial income (expense) (14,782) (23,830) (188,862) (227,474)Income tax expense 144,915 (18,271) (228,636) (101,992)Income (loss) from continuing operations $ 2,930,631 $ 60,430 $ (1,485,821) $ 1,505,240 (1) Includes depreciation of property and equipment and amortization expenses of intangible assets.(2) Including, inter alia, sales and marketing, general and administrative.(3) Out of those amounts, goodwill in the Company’s Training and Simulation and Power Systems Divisions totaled $24,435,641 and
$21,586,500, respectively, as of September 30, 2017 and $24,435,641 and $21,191,580, respectively, as of September 30, 2016.
NOTE 5: BANK FINANCING
The Company maintains credit facilities with JPMorgan Chase Bank, N.A. (“Chase”), whereby Chase provides (i) a $15,000,000revolving credit facility (“Revolver”), (ii) a $10,000,000 Term Loan (“Term Loan A”), (iii) a $1,358,000 Mortgage Loan (“Term LoanB”) and (iv) a $1,730,895 Mortgage Loan (“Term Loan C”); collectively referred to as the “Credit Facilities.”
The maturity of the Revolver is March 11, 2021. The Revolver maintains an interest rate on a scale ranging from LIBOR plus 1.75% up toLIBOR plus 3.00%. The effective interest rate for the revolver at September 30, 2017 was 4.75%. The balance at September 30, 2017 andDecember 31, 2016 was $3.1 million and $3.0 million, respectively.
11

Table of Contents
The maturity of the Term Loan is March 11, 2021. The Term Loan maintains an interest rate on a scale ranging from LIBOR plus 2.0%up to LIBOR plus 3.25%. The repayment of the Term Loan consists of 60 consecutive monthly payments of principal plus accruedinterest based on annual principal reductions of 10% during the first year, 20% during the second through fourth years, and 30% duringthe fifth year. The effective interest rate for the Term Loan at September 30, 2017 was 4.75%. The balance at September 30, 2017 andDecember 31, 2016 was $8.2 million and $9.3 million, respectively.
During the quarter ended June 30, 2017, the Company purchased land and a building, previously leased by our Training and SimulationDivision, in Ann Arbor, Michigan. As a result, the Company now maintains two Mortgage Loans (“Term Loans B and C”). Thematurities of Term Loans B and C are June 1, 2024 and maintain an interest rate on a scale identical to Term Loan A. The monthlypayments on Term Loan B and Term Loan C are $7,212 and $5,660, respectively, in principal plus accrued interest, with balloonpayments due on the maturity date. The effective interest rate for the Mortgage Loans at September 30, 2017 was 5.0%. The balance ofboth loans at September 30, 2017 and December 31, 2016 was $3.0 million and $967,000, respectively.
The Credit Facilities maintain certain reporting requirements, conditions precedent, affirmative covenants and financial covenants. TheCompany is required to maintain certain financial covenants that include a Maximum Debt to EBITDA ratio of 3.00 to 1.00 and aMinimum Fixed Charge Coverage Ratio of 1.20 to 1.00. The Company was in compliance with its covenants at September 30, 2017.
The Credit Facilities are secured by the Company’s assets and the assets of the Company’s domestic subsidiaries.
NOTE 6: IMPACT OF RECENTLY ISSUED ACCOUNTING STANDARDS In May 2014, the Financial Accounting Standards Board (“FASB”) issued Accounting Standards Update (“ASU”) No. 2014-09, Revenuefrom Contracts with Customers, as a new Topic, Accounting Standards Codification (“ASC”) 606. The new revenue recognition standardrelates to revenue from contracts with customers, which, along with amendments issued in 2015 and 2016, will supersede nearly allcurrent U.S. GAAP guidance on this topic and eliminate industry-specific guidance. The underlying principle is to use a five-step analysisof transactions to recognize revenue when promised goods or services are transferred to customers in an amount that reflects theconsideration that is expected to be received for those goods or services. Additionally, the new standard requires enhanced disclosuresabout the nature, amount, timing, and uncertainty of revenue and cash flows arising from customer contracts, including revenuerecognition policies to identify performance obligations, assets recognized from costs incurred to obtain and fulfill a contract, andsignificant judgments in measurement and recognition. The Company’s task force has identified significant contracts with customers andthe promised goods and/or services associated with the revenue streams for each segment. The Company is evaluating the distinctperformance obligations and the pattern of revenue recognition of these significant contracts in advance of the implementation of thestandard. It is also determining the impact of adopting the standard on its control framework and may require changes to its system andother controls process. The standard, as amended, will be effective for annual periods beginning after December 15, 2017, includinginterim periods within that reporting period. The Company will adopt the standard on a modified retrospective basis in 2018. In February 2016, the FASB issued ASU No. 2016-02, Leases. The new standard establishes a right-of-use (ROU) model that requires alessee to record a ROU asset and a lease liability on the balance sheet for all leases with terms longer than 12 months. Leases will beclassified as either finance or operating, with classification affecting the pattern of expense recognition in the income statement. The newstandard is effective for fiscal years beginning after December 15, 2018, including interim periods within those fiscal years. A modifiedretrospective transition approach is required for lessees for capital and operating leases existing at, or entered into after, the beginning ofthe earliest comparative period presented in the financial statements, with certain practical expedients available. Upon adoption, theCompany expects that the ROU asset and lease liability will be recognized in the balance sheets in amounts that will be material. In March 2016, the FASB issued ASU No. 2016-09, Compensation – Stock Compensation (Topic 718): Improvements to EmployeeShare-Based Payment Accounting. The new standard introduces targeted amendments intended to simplify the accounting for stockcompensation. Among other things, the ASU requires all excess tax benefits and tax deficiencies to be recognized as income tax expenseor benefit in the income statement. The amendments are effective for annual periods beginning after December 15, 2016, and interimperiods within those annual periods. The adoption of this new standard was not material to the consolidated financial statements.
In August 2016, the FASB issued ASU No. 2016-15 (Topic 230): Classification of Certain Cash Receipts and Cash Payments. Theamendments provide guidance on eight specific cash flow issues for which the current accounting framework does not provide specificguidance. The amendments are effective for annual periods beginning after December 15, 2017. Early adoption is permitted, includingadoption in an interim period. The Company is currently evaluating the impact of its pending adoption of the new standard on itsconsolidated financial statements.
12

Table of Contents
In January 2017, the FASB issued ASU No. 2017-04, Intangibles – Goodwill and Other (Topic 350): Simplifying the Test for GoodwillImpairment. The new standard simplifies the subsequent measurement of goodwill and eliminates Step 2 from the goodwill impairmenttest and requires businesses to perform its annual goodwill impairment test by comparing the fair value of a reporting unit with itscarrying amount and recognizing an impairment charge for the amount by which the carrying amount exceeds the reporting unit’s fairvalue. The amendments are effective for annual periods beginning after December 15, 2019 with early adoption permitted for goodwillimpairment tests performed on testing dates after January 1, 2017. The Company is currently evaluating the impact of its pendingadoption of the new standard on its consolidated financial statements.
In January 2017, the FASB issued ASU No. 2017-01, Business Combinations (Topic 805): Clarifying the Definition of a Business. Theamendments provide a more robust framework to use in determining when a set of assets and activities is a business. The amendments areeffective for annual periods beginning after December 15, 2017 with a limited scope of early adoption. The Company is currentlyevaluating the impact of its pending adoption of the new standard on its consolidated financial statements.
For information about previous new accounting pronouncements and the potential impact on the Company’s Consolidated FinancialStatements, see Note 2 of the Notes to Consolidated Financial Statements in the Company’s 2016 Form 10-K.
13
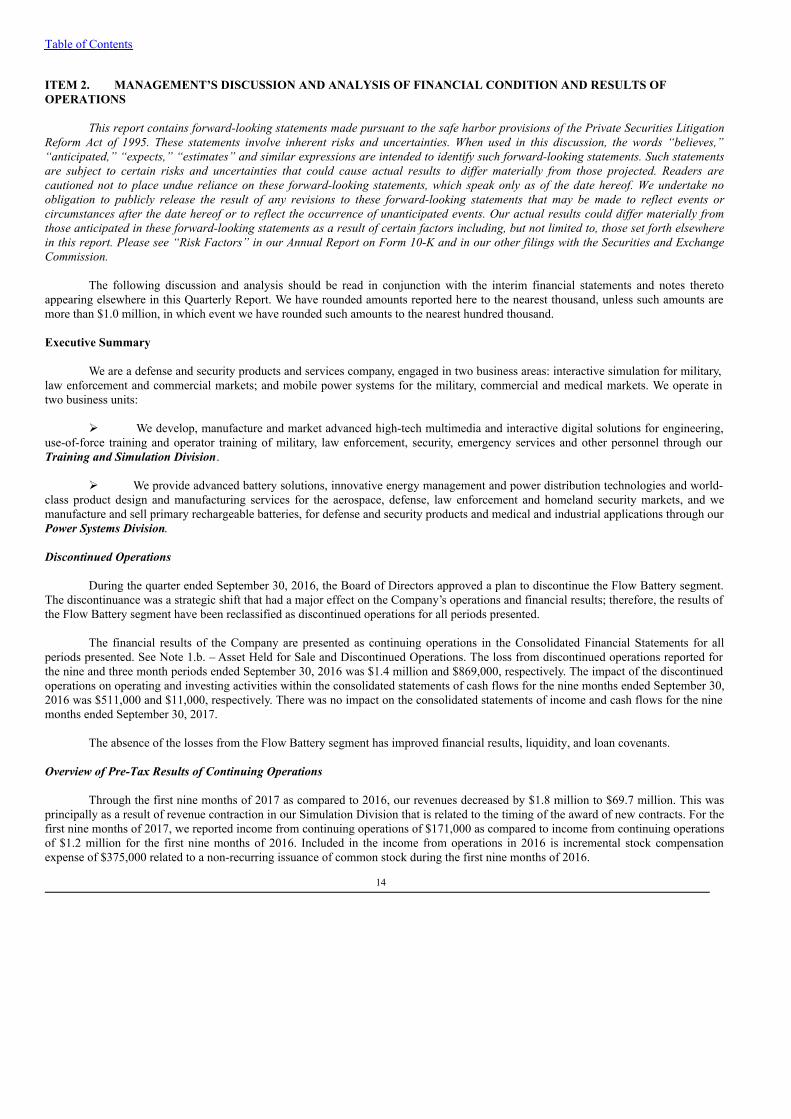
Table of Contents
ITEM 2. MANAGEMENT’S DISCUSSION AND ANALYSIS OF FINANCIAL CONDITION AND RESULTS OFOPERATIONS
This report contains forward-looking statements made pursuant to the safe harbor provisions of the Private Securities LitigationReform Act of 1995. These statements involve inherent risks and uncertainties. When used in this discussion, the words “believes,”“anticipated,” “expects,” “estimates” and similar expressions are intended to identify such forward-looking statements. Such statementsare subject to certain risks and uncertainties that could cause actual results to differ materially from those projected. Readers arecautioned not to place undue reliance on these forward-looking statements, which speak only as of the date hereof. We undertake noobligation to publicly release the result of any revisions to these forward-looking statements that may be made to reflect events orcircumstances after the date hereof or to reflect the occurrence of unanticipated events. Our actual results could differ materially fromthose anticipated in these forward-looking statements as a result of certain factors including, but not limited to, those set forth elsewherein this report. Please see “Risk Factors” in our Annual Report on Form 10-K and in our other filings with the Securities and ExchangeCommission.
The following discussion and analysis should be read in conjunction with the interim financial statements and notes theretoappearing elsewhere in this Quarterly Report. We have rounded amounts reported here to the nearest thousand, unless such amounts aremore than $1.0 million, in which event we have rounded such amounts to the nearest hundred thousand.
Executive Summary
We are a defense and security products and services company, engaged in two business areas: interactive simulation for military,law enforcement and commercial markets; and mobile power systems for the military, commercial and medical markets. We operate intwo business units:
Ø We develop, manufacture and market advanced high-tech multimedia and interactive digital solutions for engineering,use-of-force training and operator training of military, law enforcement, security, emergency services and other personnel through ourTraining and Simulation Division.
Ø We provide advanced battery solutions, innovative energy management and power distribution technologies and world-class product design and manufacturing services for the aerospace, defense, law enforcement and homeland security markets, and wemanufacture and sell primary rechargeable batteries, for defense and security products and medical and industrial applications through ourPower Systems Division.
Discontinued Operations
During the quarter ended September 30, 2016, the Board of Directors approved a plan to discontinue the Flow Battery segment.The discontinuance was a strategic shift that had a major effect on the Company’s operations and financial results; therefore, the results ofthe Flow Battery segment have been reclassified as discontinued operations for all periods presented.
The financial results of the Company are presented as continuing operations in the Consolidated Financial Statements for allperiods presented. See Note 1.b. – Asset Held for Sale and Discontinued Operations. The loss from discontinued operations reported forthe nine and three month periods ended September 30, 2016 was $1.4 million and $869,000, respectively. The impact of the discontinuedoperations on operating and investing activities within the consolidated statements of cash flows for the nine months ended September 30,2016 was $511,000 and $11,000, respectively. There was no impact on the consolidated statements of income and cash flows for the ninemonths ended September 30, 2017.
The absence of the losses from the Flow Battery segment has improved financial results, liquidity, and loan covenants.
Overview of Pre-Tax Results of Continuing Operations
Through the first nine months of 2017 as compared to 2016, our revenues decreased by $1.8 million to $69.7 million. This wasprincipally as a result of revenue contraction in our Simulation Division that is related to the timing of the award of new contracts. For thefirst nine months of 2017, we reported income from continuing operations of $171,000 as compared to income from continuing operationsof $1.2 million for the first nine months of 2016. Included in the income from operations in 2016 is incremental stock compensationexpense of $375,000 related to a non-recurring issuance of common stock during the first nine months of 2016.
14

Table of Contents
Overview of Operating Performance and Backlog
Overall, our pre-tax income from continuing operations for the nine months ended September 30, 2017 was $171,000 onrevenues of $69.7 million, compared to pre-tax income from continuing operations of $1.2 million on revenues of $71.5 million duringthe nine months ended September 30, 2016. Our overall backlog at the end of the third quarter of 2017 totaled $69.5 million, compared to$55.0 million at the end of the third quarter of 2016.
In our Training and Simulation Division, revenues for the nine months ended September 30, 2017 were $35.1 million, comparedto $36.5 million during the nine months ended September 30, 2016. As of September 30, 2017, our backlog for our Training andSimulation Division totaled $41.5 million, compared to $22.0 million at the end of the third quarter of 2016.
In our Power Systems Division, revenues for the nine months ended September 30, 2017 were $34.6 million, compared to $35.0million during the nine months ended September 30, 2016. As of September 30, 2017, our backlog for our Power Systems Divisiontotaled $28.0 million, compared to $33.0 million at the end of the third quarter of 2016.
The table below details the percentage of total recognized revenue by type of arrangement for the nine months ended September30, 2017 and 2016:
Nine months ended September 30, Type of Revenue 2017 2016
Sale of products 96.7% 95.3%Maintenance and support agreements 3.3% 4.4%Long term research and development contracts – 0.3%Total 100.0% 100.0%
Functional Currency
We consider the United States dollar to be the currency of the primary economic environment in which we and EFL operate and,therefore, both we and EFL have adopted and are using the United States dollar as our functional currency. Transactions and balancesoriginally denominated in U.S. dollars are presented at the original amounts. Gains and losses arising from non-dollar transactions andbalances are included in net income.
The majority of financial transactions of Epsilor is in New Israeli Shekels (“NIS”) and a substantial portion of Epsilor’s costs isincurred in NIS. Management believes that the NIS is the functional currency of Epsilor. Accordingly, the financial statements of Epsilorhave been translated into U.S. dollars. All balance sheet accounts have been translated using the exchange rates in effect at the balancesheet date. Statement of comprehensive income amounts have been translated using the average exchange rate for the period. Theresulting translation adjustments are reported as a component of accumulated other comprehensive loss in stockholders’ equity.
Results of Operations
Three months ended September 30, 2017 compared to the three months ended September 30, 2016.
Revenues. Revenues totaled $25.9 million during the third quarter of 2017, compared to $24.3 million in the third quarter of2016, an increase of $1.6 million, or 6.7%. In the third quarter of 2017, revenues were $14.6 million for the Training and SimulationDivision, compared to $11.9 million in the third quarter of 2016, an increase of $2.7 million, or 23.0% due primarily to higher revenue inour Use of Force and our Air Warfare Simulation product areas; and $11.3 million for the Power Systems Division, compared to $12.4million in the third quarter of 2016, a decrease of $1.1 million, or 8.8%, due primarily to lower revenues in the U.S. operations of ourPower Systems Division.
Cost of revenues. Cost of revenues totaled $18.7 million during the third quarter of 2017, compared to $16.4 million in the thirdquarter of 2016, an increase of $2.3 million or 13.6%, due primarily to an increase in revenues in our Training and Simulation Division aswell as an increase in project-related investments within our Power Systems Division. Cost of revenues were $8.8 million for the Trainingand Simulation Division, compared to $6.1 million in the third quarter of 2016, an increase of $2.7 million, or 44.5%, due primarily tohigher costs associated with higher revenues; and $9.9 million for the Power Systems Division, compared to $10.4 million in the thirdquarter of 2016, a decrease of $468,000, or 4.5%, due primarily to lower revenues and increased investment by the U.S. operations of ourPower Division.
15
Table of Contents
Research and development expenses. Research and development expenses totaled $1.0 million during the third quarter of 2017,compared to $753,000 for the third quarter of 2016, an increase of $279,000, or 37.0%, due primarily to increased development activitiesin our Vehicle Simulation product area offset by an increase in project-related investment in our U.S. operations of our Power SystemsDivision.
Selling and marketing expenses . Selling and marketing expenses for the third quarter of 2017 were $1.7 million, compared to$1.5 million in the third quarter of 2016, an increase of $249,000, or 17.0%, due primarily to increase selling and marketing efforts in ourdomestic and international businesses through increased staffing and other business development activities.
General and administrative expenses . General and administrative expenses for the third quarter of 2017 were $2.7 million,compared to $3.1 million in the third quarter of 2016, a decrease of $391,000, or 12.5%, due primarily to lower salaries resulting from theseparation of the former Chief Executive Officer, as well as other measures taken to reduce expenses in third quarter of 2017.
Amortization of intangible assets. Amortization of intangible assets totaled $509,000 in the third quarter of 2017, compared to$698,000 in the third quarter of 2016, a decrease of $189,000, or 27.1%, due primarily to higher amortization expense recognized in 2016pertaining to shorter lived intangible assets.
Other expense, net. Other expense totaled $225,000 in the third quarter of 2017, compared to other expense of $224,000 in thethird quarter of 2016.
Income taxes. We recorded $263,000 in tax expense in the third quarter of 2017, compared to $102,000 in tax expense in thethird quarter of 2016, an increase of $161,000. This expense includes “naked” credits (“naked” credits occur when deferred tax liabilitiesthat are created by indefinite-lived assets such as goodwill cannot be used as a source of taxable income to support the realization ofdeferred tax assets) of $228,000 in non-cash expenses in the third quarter of 2017 and 2016, respectively. The 2016 expense amount wasoffset by income tax benefits recorded in our domestic subsidiaries.
Income from continuing operations. Due to the factors cited above, we went from an income from continuing operations of $1.5million in the third quarter of 2016 to income from continuing operations of $790,000 in the third quarter of 2017, a decrease of $710,000.
Nine months ended September 30, 2017 compared to the nine months ended September 30, 2016.
Revenues. Revenues for the nine months ended September 30, 2017 totaled $69.7 million, compared to $71.5 million in thecomparable period in 2016, a decrease of $1.8 million, or 2.5%. In the first nine months of 2017, revenues were $35.1 million for theTraining and Simulation Division, compared to $36.5 million in the first nine months of 2016, a decrease of $1.4 million, or 3.8% dueprimarily to lower revenue in our Vehicle Simulation product area; and $34.6 million for the Power Systems Division, compared to $35.0million in the first nine months of 2016, a decrease of $381,000, or 1.1%.
Cost of revenues. Cost of revenues totaled $50.0 million during the first nine months of 2017, compared to $48.9 million in thefirst nine months of 2016, an increase of $1.1 million, or 2.2%, due primarily to an increase in project related investments of our U.S.operations of our Power Systems Division. Cost of revenues were $20.2 million for the Training and Simulation Division, compared to$20.7 million in the first nine months of 2016, a decrease of $507,000, or 2.5%, due primarily to lower costs associated with lowerrevenues; and $29.8 million for the Power Systems Division, compared to $28.3 million in the first nine months of 2016, an increase of$1.5 million, or 5.6%, due primarily to an increase in project-related investments within our Power Systems Division.
Research and development expenses. Research and development expenses totaled $2.8 million during the first nine months of2017, compared to $2.4 million for the first nine months of 2016, an increase of $424,000, or 17.9% due primarily to increaseddevelopment activities in our Vehicle Simulation product area offset by an increase in project-related investment in our U.S. operations ofour Power Systems Division.
16

Table of Contents
Selling and marketing expenses . Selling and marketing expenses for the first nine months of 2017 were $5.7 million, comparedto $4.9 million in the first nine months of 2016, an increase of $762,000, or 15.5%, due primarily to increase selling and marketing effortsin our Vehicle Simulation product area as well as increased efforts in our Use-of-Force product areas.
General and administrative expenses . General and administrative expenses for the first nine months of 2017 were $8.6 million,compared to $11.1 million in the first nine months of 2016, a decrease of $2.6 million, or 23.0%, due primarily to lower stockcompensation resulting from a share issuance to a member of the Board of Directors, lower salaries resulting from the separation of theformer Chairman of the Board of Directors and the former Chief Executive Officer, and lower performance-based bonuses recognized inthe first nine months of 2017.
Amortization of intangible assets. Amortization of intangible assets totaled $1.7 million in the first nine months of 2017,compared to $2.2 million in the first nine months of 2016, a decrease of $436,000, or 20.1%, due primarily to higher amortization expenserecognized in 2016 pertaining to shorter lived intangible assets.
Other expense, net. Other expense totaled $763,000 in the first nine months of 2017, compared to other expense of $719,000 inthe first nine months of 2016, an increase of $44,000, or 6.1%.
Income taxes. We recorded $746,000 in tax expense in the first nine months of 2017, compared to $684,000 in tax expense in thefirst nine months of 2016, an increase of $62,000, or 9.0%. This expense includes “naked” credits (“naked” credits occur when deferredtax liabilities that are created by indefinite-lived assets such as goodwill cannot be used as a source of taxable income to support therealization of deferred tax assets) which totaled $686,000 and $608,000 in non-cash expenses in the first nine months of 2017 and 2016,respectively. The 2016 expense amount was offset by income tax benefits recorded in our domestic subsidiaries.
Income (loss) from continuing operations. Due to the factors cited above, we went from an income from continuing operationsof $554,000 in the first nine months of 2016 to a loss from continuing operations of $(574,000) in the first nine months of 2017, a decreaseof $1.1 million.
Liquidity and Capital Resources
As of September 30, 2017, we had $4.3 million in cash and $327,000 in restricted collateral deposits, as compared to December31, 2016, when we had $7.1 million in cash and $269,000 in restricted collateral deposits. We also had $8.5 million in available, unusedbank lines of credit with our main bank as of September 30, 2017, under a $15.0 million credit facility.
We maintain credit facilities with JPMorgan Chase Bank, N.A. (“Chase”), whereby Chase provides (i) a $15,000,000 revolvingcredit facility (“Revolver”), (ii) a $10,000,000 Term Loan (“Term Loan A”), (iii) a $1,358,000 Mortgage Loan (“Term Loan B”) and (iv)a $1,730,895 Mortgage Loan (“Term Loan C”); collectively referred to as the “Credit Facilities.”
The maturity of the Revolver is March 11, 2021. The Revolver maintains an interest rate on a scale ranging from LIBOR plus1.75% up to LIBOR plus 3.00%. The effective interest rate for the revolver at September 30, 2017 was 4.75%.
The maturity of Term Loan A is March 11, 2021. This Term Loan maintains an interest rate on a scale ranging from LIBOR plus2.0% up to LIBOR plus 3.25%. The repayment of this Term Loan consists of 60 consecutive monthly payments of principal plus accruedinterest based on annual principal reductions of 10% during the first year, 20% during the second through fourth years, and 30% duringthe fifth year. The effective interest rate for this Term Loan at September 30, 2017 was 4.75%.
17

Table of Contents
During the quarter ended September 30, 2017, we purchased land and a building previously leased by our Training andSimulation Division in Ann Arbor, Michigan for $2.1 million. As a result, we now have two Mortgage Loans (“Term Loans B and C”).The maturities of the Mortgage Loans are June 1, 2024 and maintain an interest rate on a scale identical to the Term Loan. The monthlypayments on the Mortgage Loans are $12,872 in principal plus accrued interest, with balloon payments due at the maturity date. Theeffective interest rate for the Mortgage Loans at September 30, 2017 was 5.0%.
The Credit Facilities maintain certain reporting requirements, conditions precedent, affirmative covenants and financialcovenants. We are required to maintain certain financial covenants that include a Maximum Debt to EBITDA ratio of 3.00 to 1.00 and aMinimum Fixed Charge Coverage Ratio of 1.20 to 1.00. We were in compliance with our covenants at September 30, 2017.
The Credit Facilities are secured by our assets and the assets of our domestic subsidiaries.
We used available funds in the nine months ended September 30, 2017 primarily for working capital needs, including the $2.6million severance payment to our former Chief Executive Officer, and investment in fixed assets. We purchased the land and buildingreferred to above for $2.2 million as well as $1.6 million of fixed assets during the nine months ended September 30, 2017. Our net fixedassets amounted to $8.5 million at quarter end.
Net cash provided by operating activities for the nine months ended September 30, 2017 was $843,000. Net cash provided byoperating activities for the nine months ended September 30, 2016 was $497,000, representing a net change year over year of $346,000.The increase in cash provided by operations is primarily attributable to an increase in cash generated by net operating assets and liabilitiesof $4.0 million which was partially offset by severance paid to our former Chief Executive Officer in the first quarter of 2017 of $2.6million as well as a reduction in non-cash expenses of $1.0 million.
Net cash used in investing activities for the nine months ended September 30, 2017 was $3.9 million. Net cash used in investingactivities for the nine months ended September 30, 2016 was $1.3 million, representing a year over year change of $2.6 million. Thisdifference was due primarily to the $2.2 million building purchase and investments in fixed assets referred to above.
Net cash provided by financing activities for the nine months ended September 30, 2017 and 2016 was $1.0 million and$900,000, an increase of $100,000. In 2016, we refinanced our long-term debt resulting in a payment of $5.2 million as well as obtainedan investment from a member of our Board of Directors of $3.0 million. In 2017, we obtained financing of $2.2 million for the buildingpurchase, paid long-term debt of $1.3 million and increased the utilization on our line of credit by $100,000.
As of September 30, 2017, we had approximately $3.1 million in short-term bank debt under our credit facility and $11.4 millionin long-term loans outstanding. This is in comparison to December 31, 2016, when we had $3.0 million in short-term bank debt under ourcredit facility and $10.5 million in long-term debt outstanding.
Subject to all of the reservations regarding “forward-looking statements” set forth above, we believe that our present cashposition, anticipated cash flows from operations and availability under our lines of credit should be sufficient to satisfy our currentestimated cash requirements through the next twelve months. In this connection, we note that from time to time our working capital needsare partially dependent on our and/or our subsidiaries’ lines of credit.
18

Table of Contents
ITEM 3. QUANTITATIVE AND QUALITATIVE DISCLOSURES ABOUT MARKET RISK.
Interest Rate Risk
It is our policy not to enter into interest rate derivative financial instruments, except for hedging of foreign currency exposuresdiscussed below. We do not currently have any significant interest rate exposure.
Foreign Currency Exchange Rate Risk
We consider the United States dollar (U.S. dollar) to be the currency of the primary economic environment in which our U.S.subsidiaries operate and have adopted the U.S. dollar as the functional currency for these businesses. Since a significant part of our salesand expenses are denominated in U.S. dollars, we have experienced only minor foreign exchange gains and losses to date, and do notexpect to incur significant operating gains and losses affecting net income in 2017.
The majority of financial transactions of our Israel-based subsidiary, Epsilor-EFL (“Epsilor”), are in New Israeli Shekels (“NIS”)and a substantial portion of Epsilor’s costs are incurred in NIS. Therefore, we have adopted the NIS as the functional currency of Epsilor.Accordingly, the financial statements of Epsilor have been translated into United States dollars. The effect of this translation is reportedas a component of accumulated other comprehensive income in stockholders’ equity. Depending upon the prevailing exchange rate, thistranslation can be significant.
While we conduct our business primarily in U.S. dollars, some of our agreements are denominated in foreign currencies, whichcould have an adverse effect on the revenues that we incur in foreign currencies. We do not hold or issue derivative financial instrumentsfor trading or speculative purposes.
ITEM 4. CONTROLS AND PROCEDURES.
As of the end of the period covered by this report, an evaluation was carried out by the Company’s management, with theparticipation of our acting Chief Executive Officer and our Chief Financial Officer, of the effectiveness of our disclosure controls andprocedures (as defined in Rule 13a-15(e) under the Securities Exchange Act of 1934). Based upon that evaluation, our acting ChiefExecutive Officer and our Chief Financial Officer concluded that these disclosure controls and procedures were effective as of the end ofthe period covered by this report. In addition, no change in our internal control over financial reporting (as defined in Rule 13a-15(f)under the Securities Exchange Act of 1934) occurred during our most recent fiscal quarter that has materially affected, or is reasonablylikely to materially affect, our internal control over financial reporting.
19

Table of Contents
PART II
ITEM 6. EXHIBITS.
The following documents are filed as exhibits to this report:
Exhibit Number Description31.1 Certification of Chief Executive Officer pursuant to Section 302 of the Sarbanes-Oxley Act of 200231.2 Certification of Chief Financial Officer pursuant to Section 302 of the Sarbanes-Oxley Act of 200232.1 Certification of Chief Executive Officer pursuant to Section 906 of the Sarbanes-Oxley Act of 200232.2 Certification of Chief Financial Officer pursuant to Section 906 of the Sarbanes-Oxley Act of 2002 101.INS XBRL Instance Document101.SCH XBRL Taxonomy Extension Schema Document101.CAL XBRL Taxonomy Extension Calculation Linkbase Document101.DEF XBRL Taxonomy Extension Definition Linkbase Document101.LAB XBRL Taxonomy Extension Label Linkbase Document101.PRE XBRL Taxonomy Extension Presentation Linkbase Document
20

Table of Contents
SIGNATURES
Pursuant to the requirements of the Securities Exchange Act of 1934, the registrant has duly caused this report to be signed on itsbehalf by the undersigned, thereunto duly authorized.
Dated: November 9, 2017
AROTECH CORPORATION By: /s/ Dean M. Krutty Name:Dean M. Krutty Title: Executive Vice President and acting CEO (Principal Executive Officer)
By: /s/ Thomas J. Paup Name:Thomas J. Paup Title: Senior Vice President – Finance and CFO (Principal Financial Officer)
21

Exhibit 31.1
CERTIFICATION
I, Dean M. Krutty, certify that:
1. I have reviewed this quarterly report on Form 10-Q of Arotech Corporation;
2. Based on my knowledge, this quarterly report does not contain any untrue statement of a material fact or omit to state amaterial fact necessary to make the statements made, in light of the circumstances under which such statements were made, notmisleading with respect to the period covered by this quarterly report;
3. Based on my knowledge, the financial statements, and other financial information included in this quarterly report, fairlypresent in all material respects the financial condition, results of operations and cash flows of the registrant as of, and for, the periodspresented in this quarterly report;
4. The registrant’s other certifying officer and I are responsible for establishing and maintaining disclosure controls andprocedures (as defined in Exchange Act Rules 13a-15(e) and 15d-15(e)) and internal control over financial reporting (as defined inExchange Act Rules 13a-15(f) and 15d-15(f)) for the registrant and we have:
(a) designed such disclosure controls and procedures, or caused such disclosure controls and procedures to be designed underour supervision, to ensure that material information relating to the registrant, including its consolidated subsidiaries, is madeknown to us by others within those entities, particularly during the period in which this quarterly report is being prepared;
(b) designed such internal control over financial reporting, or caused such internal control over financial reporting to bedesigned under our supervision, to provide reasonable assurance regarding the reliability of financial reporting and thepreparation of financial statements for external purposes in accordance with generally accepted accounting principles;
(c) evaluated the effectiveness of the registrant’s disclosure controls and procedures and presented in this quarterly report ourconclusions about the effectiveness of the disclosure controls and procedures as of the end of the period covered by thisquarterly report based on such evaluation; and
(d) disclosed in this quarterly report any change in the registrant’s internal control over financial reporting that occurred duringthe registrant’s most recent fiscal quarter (the registrant’s fourth quarter in the case of an annual report) that has materiallyaffected, or is reasonably likely to materially affect, the registrant’s internal control over financial reporting; and
5. The registrant’s other certifying officer and I have disclosed, based on our most recent evaluation of internal control overfinancial reporting, to the registrant’s auditors and the audit committee of registrant’s board of directors (or persons performing theequivalent function):
(a) all significant deficiencies and material weaknesses in the design or operation of internal control over financial reportingwhich are reasonably likely to adversely affect the registrant’s ability to record, process, summarize and report financialinformation; and
(b) any fraud, whether or not material, that involves management or other employees who have a significant role in theregistrant’s internal controls over financial reporting.
Dated: November 9, 2017 /s/ Dean M. Krutty Dean M. Krutty, Executive Vice President and acting CEO (Principal Executive Officer)
A signed original of this written statement required by Section 302 has been provided to Arotech Corporation and will be
retained by Arotech Corporation and furnished to the Securities and Exchange Commission or its staff upon request.
The foregoing certification is being furnished solely pursuant to Section 302 of the Sarbanes-Oxley Act of 2002 (subsections (a)and (b) of Section 1350, Chapter 63 of Title 18, United States Code) and is not being filed as part of the Form 10-Q or as a separatedisclosure document.
Exhibit 31.2
CERTIFICATION
I, Thomas J. Paup, certify that:
1. I have reviewed this quarterly report on Form 10-Q of Arotech Corporation;
2. Based on my knowledge, this quarterly report does not contain any untrue statement of a material fact or omit to state amaterial fact necessary to make the statements made, in light of the circumstances under which such statements were made, notmisleading with respect to the period covered by this quarterly report;
3. Based on my knowledge, the financial statements, and other financial information included in this quarterly report, fairlypresent in all material respects the financial condition, results of operations and cash flows of the registrant as of, and for, the periodspresented in this quarterly report;
4. The registrant’s other certifying officer and I are responsible for establishing and maintaining disclosure controls andprocedures (as defined in Exchange Act Rules 13a-15(e) and 15d-15(e)) and internal control over financial reporting (as defined inExchange Act Rules 13a-15(f) and 15d-15(f)) for the registrant and we have:
(a) designed such disclosure controls and procedures, or caused such disclosure controls and procedures to be designed underour supervision, to ensure that material information relating to the registrant, including its consolidated subsidiaries, is madeknown to us by others within those entities, particularly during the period in which this quarterly report is being prepared;
(b) designed such internal control over financial reporting, or caused such internal control over financial reporting to bedesigned under our supervision, to provide reasonable assurance regarding the reliability of financial reporting and thepreparation of financial statements for external purposes in accordance with generally accepted accounting principles;
(c) evaluated the effectiveness of the registrant’s disclosure controls and procedures and presented in this quarterly report ourconclusions about the effectiveness of the disclosure controls and procedures as of the end of the period covered by thisquarterly report based on such evaluation; and
(d) disclosed in this quarterly report any change in the registrant’s internal control over financial reporting that occurred duringthe registrant’s most recent fiscal quarter (the registrant’s fourth quarter in the case of an annual report) that has materiallyaffected, or is reasonably likely to materially affect, the registrant’s internal control over financial reporting; and
5. The registrant’s other certifying officer and I have disclosed, based on our most recent evaluation of internal control overfinancial reporting, to the registrant’s auditors and the audit committee of registrant’s board of directors (or persons performing theequivalent function):
(a) all significant deficiencies and material weaknesses in the design or operation of internal control over financial reportingwhich are reasonably likely to adversely affect the registrant’s ability to record, process, summarize and report financialinformation; and
(b) any fraud, whether or not material, that involves management or other employees who have a significant role in theregistrant’s internal controls over financial reporting.
Dated: November 9, 2017 /s/ Thomas J. Paup Thomas J. Paup, Senior Vice President – Finance and CFO (Principal Financial Officer)
A signed original of this written statement required by Section 302 has been provided to Arotech Corporation and will be
retained by Arotech Corporation and furnished to the Securities and Exchange Commission or its staff upon request.
The foregoing certification is being furnished solely pursuant to Section 302 of the Sarbanes-Oxley Act of 2002 (subsections (a)and (b) of Section 1350, Chapter 63 of Title 18, United States Code) and is not being filed as part of the Form 10-Q or as a separatedisclosure document.

Exhibit 32.1
WRITTEN STATEMENT
In connection with the Quarterly Report of Arotech Corporation (the “Company”) on Form 10-Q for the quarterly period endedSeptember 30, 2017 filed with the Securities and Exchange Commission (the “Report”), I, Dean M. Krutty, Executive Vice President andacting Chief Executive Officer of the Company, pursuant to 18 U.S.C. Section 1350, as adopted pursuant to Section 906 of the Sarbanes-Oxley Act of 2002, hereby certify that to my knowledge, the Report fully complies with the requirements of Section 13(a) or 15(d) of theSecurities Exchange Act of 1934, and the information contained in the Report fairly presents, in all material respects, the consolidatedfinancial condition of the Company and its subsidiaries as of the dates presented and the consolidated results of operations of theCompany and its subsidiaries for the periods presented.
Dated: November 9, 2017 /s/ Dean M. Krutty Dean M. Krutty, Executive Vice President and acting CEO (Principal Executive Officer)
A signed original of this written statement required by Section 906 has been provided to Arotech Corporation and will beretained by Arotech Corporation and furnished to the Securities and Exchange Commission or its staff upon request.
The foregoing certification is being furnished solely pursuant to Section 906 of the Sarbanes-Oxley Act of 2002 (subsections (a)and (b) of Section 1350, Chapter 63 of Title 18, United States Code) and is not being filed as part of the Form 10-Q or as a separatedisclosure document.

Exhibit 32.2WRITTEN STATEMENT
In connection with the Quarterly Report of Arotech Corporation (the “Company”) on Form 10-Q for the quarterly period endedSeptember 30, 2017 filed with the Securities and Exchange Commission (the “Report”), I, Thomas J. Paup, Senior Vice President –Finance and Chief Financial Officer of the Company, pursuant to 18 U.S.C. Section 1350, as adopted pursuant to Section 906 of theSarbanes-Oxley Act of 2002, hereby certify that to my knowledge, the Report fully complies with the requirements of Section 13(a) or15(d) of the Securities Exchange Act of 1934, and the information contained in the Report fairly presents, in all material respects, theconsolidated financial condition of the Company and its subsidiaries as of the dates presented and the consolidated results of operations ofthe Company and its subsidiaries for the periods presented.
Dated: November 9, 2017 /s/ Thomas J. Paup Thomas J. Paup, Senior Vice President –
Finance and CFO (Principal Financial Officer)
A signed original of this written statement required by Section 906 has been provided to Arotech Corporation and will beretained by Arotech Corporation and furnished to the Securities and Exchange Commission or its staff upon request.
The foregoing certification is being furnished solely pursuant to Section 906 of the Sarbanes-Oxley Act of 2002 (subsections (a)and (b) of Section 1350, Chapter 63 of Title 18, United States Code) and is not being filed as part of the Form 10-Q or as a separatedisclosure document.