Armstrong World Industries -...
54
Armstrong World Industries Analysts’ Meeting, NYC September 29, 2008
Transcript of Armstrong World Industries -...

Armstrong World Industries
Analysts’ Meeting, NYC September 29, 2008

2
Safe Harbor Statement
This presentation contains “forward-looking statements”
related to Armstrong World Industries, Inc.’s future financial performance. Our results could differ materially from the results discussed in these forward-looking statements due to known and unknown risks and uncertainties. A more detailed discussion of the risks and uncertainties that may affect our ability to achieve the projected performance
is included in the “Risk Factors”
and “Management’s Discussion and Analysis”
sections of our recent reports on Forms 10-K and 10-Q filed with the SEC. We undertake no obligation to update any forward-looking statement.
In addition, we will be referring to non-GAAP financial measures within the meaning of SEC Regulation G. A reconciliation of the differences between these measures with the most directly comparable financial measures calculated in accordance with GAAP is available on the Investor Relations page of our website at www.armstrong.com.

3
Mike LockhartChairman & Chief Executive Officer
Company Overview

4
Armstrong at a Glance
Leading global manufacturer of floors and ceilings for use in renovation and new construction. Significant U.S. cabinets business.
$3.5 billion in salesServing global customers from 10 countries40 manufacturing locationsApproximately 12,700 employees
$2 billion market capitalization57 million diluted shares outstanding
250k average daily trading volume 66% owned by Armstrong Asbestos Trust
‘AWI’ on the NYSESince October 2006 emergence from asbestos-related bankruptcy
Company Overview

5
History
In 1998: Residential sales 65% of total
By 2008: Residential sales 40% of total
Significant geographic and product line expansion with the purchase of Triangle Pacific (Hardwood floors & Cabinets) and DLW (European flooring)
Asbestos-related bankruptcyManufacturing and overhead restructuringSignificant growth in Commercial products
Strategic review process, Commercial volume growth, improved product mix and manufacturing productivity contribute to earnings growth despite difficult domestic residential markets
Strategic focus on profitable growth and managing the domestic market downturn
Thomas Armstrong’s cork-
making business evolves into linoleum flooring, acoustic ceiling tiles, then vinyl flooring
Armstrong’s Evolution
1900-1997 1998 2001-2006 2007 2008
Company Overview

6
Business Segment Profile
Building Products$1,292
36%
Wood Flooring$79222%
Resilient Flooring$1,23135%
Cabinets$2357%
Building Products$21866%
Wood Flooring
$6520%
Resilient Flooring
$4112%
Cabinets$62%
(Ceilings)
#1 in businesses representing 80% of sales
2007 Sales 2007 Operating Income Adjusted – see website for reconciliation
– Excludes unallocated corporate expense
Company Overview
(Ceilings)

7
Business Segment and End-Use Profile: 2007 Sales
Diversified End Markets Reduce Impact of Cycles
Cabinets Resilient Flooring(Europe)
Resilient Flooring(U.S.)
HardwoodFlooring
BuildingProducts(Ceilings)
Consolidated
Residential new Residential renovation Commercial new Commercial renovation
75%25% 60%
25%
45%
50%
5%38%
42%
12%
60%
30%
10%
25%
20%
20%
35%$1,300
$800$800
$350$250
$3,500
15%
8%
Company Overview

8
Industry Structure/Competitive Position
U.S. ResilientEuropean Resilient Hardwood
Building Products Cabinets
Market Leadership
Competitor Concentration
Barriers to Entry
Industry Capacity Utilization
AWI is Low-Cost Manufacturer
Armstrong is positioned to capitalize on positive AND negative competitive dynamics
Key Favorable Neutral Unfavorable
Company Overview

9
Key Investment Catalysts
Market Leadership: #1 in businesses representing 80% of sales
Diversified end markets, product portfolios and geographies
Sales and margin growth potential
Well-positioned for recoveries in domestic markets
Low-cost manufacturing and advantageous footprint
Strong cash flow sufficient to capture all expected opportunities
Company Overview

10
Steve SenkowskiExecutive Vice President
Building Products

11
ABP 2007 Sales by Geography (Ceilings & Grid)
0
200
400
600
800
1000
1200
Americas W. Europe E. Europe/MiddleEast
Asia
($-Billions)
Operating Profit 22% 13% 2% 14%
Asia and Eastern European growth opportunities
Building Products
Sales Are >90% Commercial
$1.6B in sales is a full consolidation of WAVE and the Building Products segment (ABP) and is, therefore, greater than reported ABP sales

12
ABP Product Categories – Core Ceilings
Key CharacteristicsMineral fiber – wet felt/soft fiber (fiberglass)●
Acoustics●
Durability●
Surface Pattern
GridLoad ratingFace width/design
Installed (NYC) cost:$5.50 - $8.50/sq. ft.
Armstrong selling price:$0.78 - $2.75/sq. ft.
Building Products

13
Installed (NYC) cost:$11 - $120/sq. ft.
Armstrong selling price:$8 - $100/sq. ft.
Architectural Specialties42% annual growth since 20032007 ●$32M sales●$9M operating profit
ABP Product Categories – Specialties
Design Accents Acoustical Accents
Expanded product portfolio
Building Products

14
Commercial Construction Selling Process
ArchitectExperience levelEase of doing businessAcoustical design expertise
Ceilings-only sales force focused on specific customer groups
Ceiling SubcontractorEase of doing businessExperience levelCompetitive prices
DistributorPricing processPlant serviceArmstrong sales rep
Owner Architect General Contractor
Ceiling Subcontractor Distributor Manufacturer
U.S. Key Drivers of Loyalty/Satisfaction
Building Products

15
Mineral Fiber Ceilings Manufacturing Locations
ABP has broadest presence
* Low-end Chinese manufacturers not included (≈60)
Americas Europe Asia*Wet Felt Mineral Fiber
ABPCompetition●
Number of plants●
Number of competitors
6
52
3
22
1
22
Soft FiberABPCompetition●
Number of plants●
Number of competitors
1
1–
–
92
N/A
N/A–
Building Products

16
Commercial Ceiling Coverage by Material Category
Size of Market (B sq. ft.) 2.3 2.0 0.7 6.0
% Market
75
32
69
9
4
18
5
9
1018
30
13
77
11 7
1
7
2 3
0
20
40
60
80
100
Americas W. Europe Russia ChinaWet Felt Soft Fiber Metal Drywall Other
Exposed structure (no ceiling) is 12% of U.S. total ceiling areaRussia is second largest mineral fiber ceiling market
Mineral fiber ceilings the top choice in most markets
Building Products

17
0
20
40
60
Armstrong USG CertainTeed
Mineral Fiber Commercial Ceilings Market Shares
North America
*Russia market share is 23%*China market share is 20%Low-end Chinese share in Russia is 60% and China is 50%
ABP is global leader in mineral fiber category
Western Europe
*Armstrong is No. 1
0
10
20
30
40
Armstrong Rockfon OWA AMF Ecophon
Building Products
Wet Felt Only Soft Fiber Only

18
Commercial Market Segments
U.S. office construction downturn will have limited effect on volume
36 4063
18 16
710 14
825 14
11 16 202
0
20
40
60
80
100
Americas W. Europe ChinaOffice Education Healthcare Retail Other
Renovation is the majority of the opportunity in the U.S. and Western Europe
%
Building Products
30% 43% >90%% New Construction

19
WAVE
2000 2004 2007
Sales ($) 208 277 380
Operating Profit (%) 19 22 30
2000to
2004
2000to
2004
2004to
2007
2004to
2007
Product innovation to improve usability, reduce cost, increase market share and enhance margins
Product innovation - cost reduction and share gainSteel/product pricing
Manufacturing consolidationShare gainSteel/product pricing
Building Products

20
U.S. Commercial Ceilings Downturn
Disciplined pricing and new product initiatives produce solid margins in commercial downturn
2000 - 2003
15%
100%
50%
3%
2%
19%
14%
What’s Changed
Pricing discipline
Market share gain
Architectural Specialties growth
2008 First Half
5%
100+%
4%
25%Operating Profit
VolumeDecline
Price vs. Inflation
Mix
Building Products

21
Key Strengths and Growth Strategies
Continued new product development plus manufacturing investments in developing markets
1 Best Product Portfolio
European soft fiberLocal Asian productsSpecialties – new materialsCore ceilings and grid – new product leadership
2 Complete Market Coverage
Expand distribution in RussiaGrow use of acoustical ceilings in China
3 Low-Cost Manufacturing
Build manufacturing plant in RussiaExpand manufacturing capacity in China
4 Best-In-Class Service/Quality
Build manufacturing plant in RussiaExpand manufacturing capacity in China
5 Disciplined “Premium”’ Pricing
Building Products

22
Frank J. ReadyExecutive Vice President - AWI &
CEO North American Floor Products
North American Floor Products and Cabinets

23
Business Overview
Vinyl/Laminate Sales Mix
Hardwood Residential – 95%
Commercial 46%
Residential 54%
Tile9%
Tile37%
Sheet Vinyl9%
Sheet Vinyl30%
Laminate15%
Other9%
Engineered30%
Solids61%
2007 Actual ($ Millions)
Net Sales $826 $792Operating Income $50 $65ROC % 16.4% 9.2%
North American Floor Products

24
2007 Segment/Channel Overview
Resilient Net Sales = $826M
Hardwood Net Sales = $792M
Channel Breakdown% of 2007 Sales
Resilient HardwoodDistribution 71 65Big Box 29 35
Res'l - Remodel
42%
Comm'l - Renovation
38%
Comm'l - New8%
Res'l - New12%
Res'l - Remodel
45%
Comm'l - 5%
Res'l - New50%
North American Floor Products
25
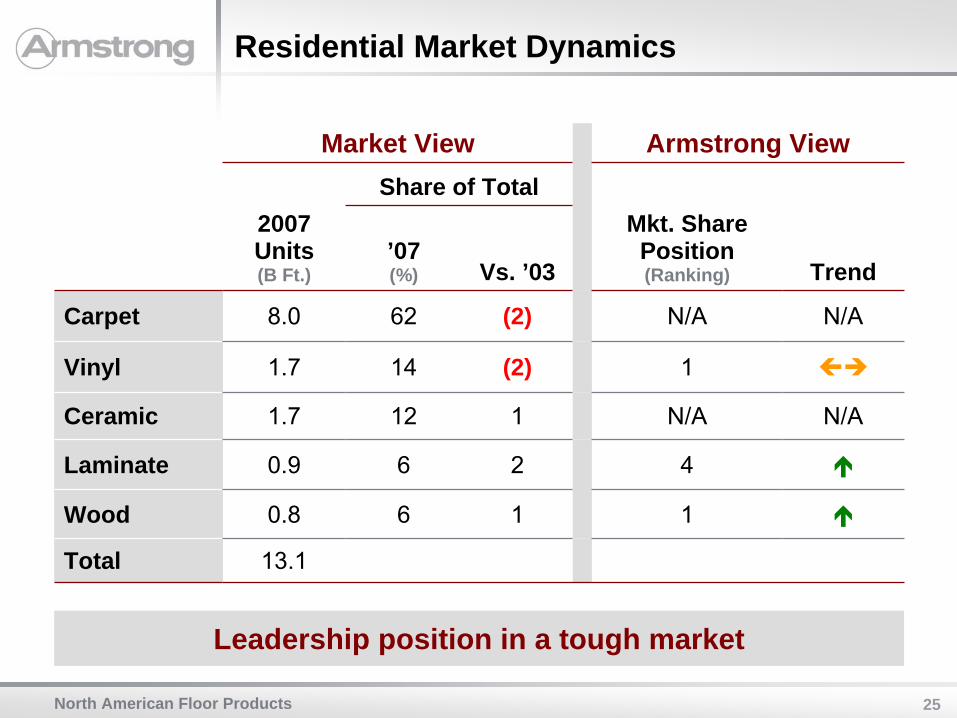
Residential Market Dynamics
Market View Armstrong ViewShare of Total
2007 Units(B Ft.)
’07(%) Vs. ’03
Mkt. Share Position(Ranking) Trend
Carpet 8.0 62 (2) N/A N/A
Vinyl 1.7 14 (2) 1
Ceramic 1.7 12 1 N/A N/A
Laminate 0.9 6 2 4
Wood 0.8 6 1 1
Total 13.1
Leadership position in a tough market
North American Floor Products

26
Commercial Market Dynamics
Market View Armstrong ViewShare of Total
2007 Units (B Ft.)
’07 (%) Vs. ’03
Mkt. Share Position (Ranking) Trend
Carpet 4.4 70 1 N/A N/A
Vinyl 1.2 19 (1) 1
Wood 0.1 2 – 2
Ceramic 0.5 7 – N/A N/A
Other 0.1 2 – N/A N/A
Total 6.3
Armstrong has #1 position in Commercial Vinyl segment
North American Floor Products

27
Industry Structure/Competitive Position
Resilient Hardwood
Residential Commercial
Tile Sheet Tile Sheet
Industry Capacity Utilization
Number of Competitors
Barriers to Entry
Armstrong Cost vs. Competition
Opportunity is industry consolidation in Residential Sheet Vinyl
Key Favorable Neutral Unfavorable
North American Floor Products

28
Production System
Armstrong produces 90% of what it sells… Laminate and LVT are the exception
% of VolumeArmstrong Third Party
# of Domestic Plants Domestic Global
CommercialVCTLVTSheetLinoleum
4–1–
100–10–
––55100
–10035–
ResidentialSheet VinylVinyl TileEngineered WoodSolid WoodLaminate
2346–
85909097–
15–5––
–1053
100
North American Floor Products

29
What We Have Done
Improved design capability
New products
Better commercial portfolio
Reduced footprintLancaster
This is a better business…
Expanded product line
Improved quality/service
AcquisitionsCapella
HomerWood
Reduced footprintClosed 3 plants
Added China plant
Resilient Hardwood
North American Floor Products

30
Financial Trends
Improved financial performance despite tough market conditions
2003 2005 2007Resilient
Op. Margin % 8.0 3.1 6.0
ROC % 15.2 7.6 16.4
Hardwood
Op. Margin % 5.1 10.5 8.2
ROC % 6.7 14.2 9.2
North American Floor Products

31
Competitive Dynamics
Resilient Hardwood
Residential Commercial
Market
Raw Material Inflation
Price
Productivity
Challenging markets and Vinyl raw material inflation partially offset by price and productivity
Key Favorable Neutral Unfavorable
North American Floor Products

32
Resilient Strategy
VinylOffer broadest assortmentReduce manufacturing costRationalize industry capacity
LaminateLeverage design leadership positionLower-cost sourcing
Residential Resilient Sales
Expand product range in higher margin categoriesEnvironmental/Non-PVCSheet Vinyl…lower product costs
Commercial
Comm'l Vinyl46%
Res'l Vinyl39%
Laminate 15%
North American Floor Products

33
Hardwood Strategy
Offer the broadest assortment of species/colors
Improve mix…Wide widthExotics
Lower manufacturing costsOn-going productivityFootprint changes
Reduce working capitalYard productivity
Focus on Improving ROC…
North American Floor Products

34
Cabinets
Small player…<5% shareFocus on small/medium size builderGo-to-Market
Current Situation 2007 Sales = $235M
Product/service executionImprove Service Center productivityReduce manufacturing costs
Strategy
Remodel25%
New75%
% of SalesCompany-Owned Service Centers 55%
Distribution 25%Multi-Family 20%
Cabinets

35
Mike LockhartChairman & Chief Executive Officer
European Floor Products

36
European Resilient
Vinyl30%
Other17%
Linoleum38%
Vinyl15%
Commercial 85%
Residential 15%
Linoleum is the most desirable business
2007Sales $330M
Operating Loss $ 20M
European Floor Products

37
Situation Overview
ChallengesAcquired #4 market competitor in 1998Greatest exposure is to the German commercial market
Declined an average 5% per year for 7 years following acquisition
Scale disadvantage in manufacturing and SG&AOutdated manufacturing processes in all but Linoleum
OpportunitiesSG&A: reduced spending, outsourcing to India plus consolidation in Eastern EuropeClosing unprofitable plants; investing to make plants competitive
Independently or through combination with a competitor
Selling assets
Have a credible plan by the end of the year
European Floor Products

38
F. Nicholas GrasbergerSenior VP & CFO
Financial Review

39
($-Millions) 2005 2006 2007 2008E
Net Sales 3,427 3,532 3,579 3,500% Change 3% 1% (2%)
Operating Income 183 272 307 275% Change 49% 13% (10%)% Margin 5% 8% 9% 8%
Cash Flow 98 117 511 175
Net Debt/EBITDA NM 1.7 0.3 0.6
Return on Capital 4% 6% 7% 6%
* Figures are normalized for unusual gains and expenses, foreign
currency and fresh start accounting.
Key Metrics* (2005-2008E)
Financial Review

40
185 (125)
70200
(195)
120 20 275
2005 Price Volume Mix Inflation Mfg +SG&A
WAVE 2008E
($-Millions)
Operating Income Bridge (2005-2008E)
Financial Review

41
Key Assumptions (2009-2011)
End Markets
US Residential recovers mid-2010
US Commercial recovers late-2010
Europe weak through 2010
European Floor Loss eliminated in 2010
Price vs. Inflation Neutral
Manufacturing Productivity $50-75 million cost reduction
SG&A 16-17% of sales
Capital SpendingCeilings plants in Russia and China
US/Europe vinyl footprint changes
Domestic NOL Utilized by end of 2011
Financial Review

42
Financial Outlook (2008E-2011)
2008E 2011
Net Sales $3.5 billion $3.7-3.8 billion
Operating Margin 8% 10-11%
Free Operating Cash Flow $500-600 million
Return on Capital 6% 11-12%
Financial Review
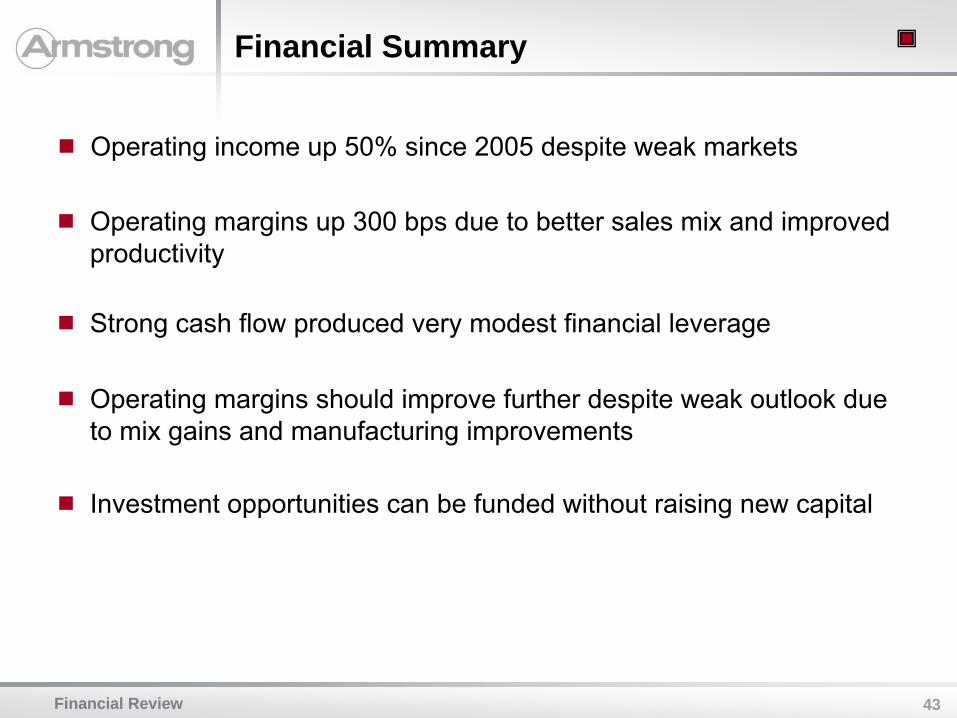
43
Operating income up 50% since 2005 despite weak markets
Operating margins up 300 bps due to better sales mix and improved productivity
Strong cash flow produced very modest financial leverage
Operating margins should improve further despite weak outlook due to mix gains and manufacturing improvements
Investment opportunities can be funded without raising new capital
Financial Summary
Financial Review

44
Price/Volume/Mix (2006-2008E)
2%
(1)%
2% 2%
(2)%
2% 2%
(6)%
2%
2006 2007 2008E
Price Volume Mix
Financial Review

45
Sales Change by Segment (2006-2008E)
9% 9%
1%
(2)%
2%
9%
(6)%
(1)%
(19)%
5%
(15)%
2%
2006 2007 2008E
Resilient Flooring
Wood Flooring
Building Products Cabinets
Financial Review

46
25
(15)
40
1515
(10)
40
(15)
(30)
15
(10)
2006 2007 2008E
Resilient Flooring
Wood Flooring
Building Products Cabinets
($-Millions)
Profit Change by Segment (2006-2008E)
Financial Review
47
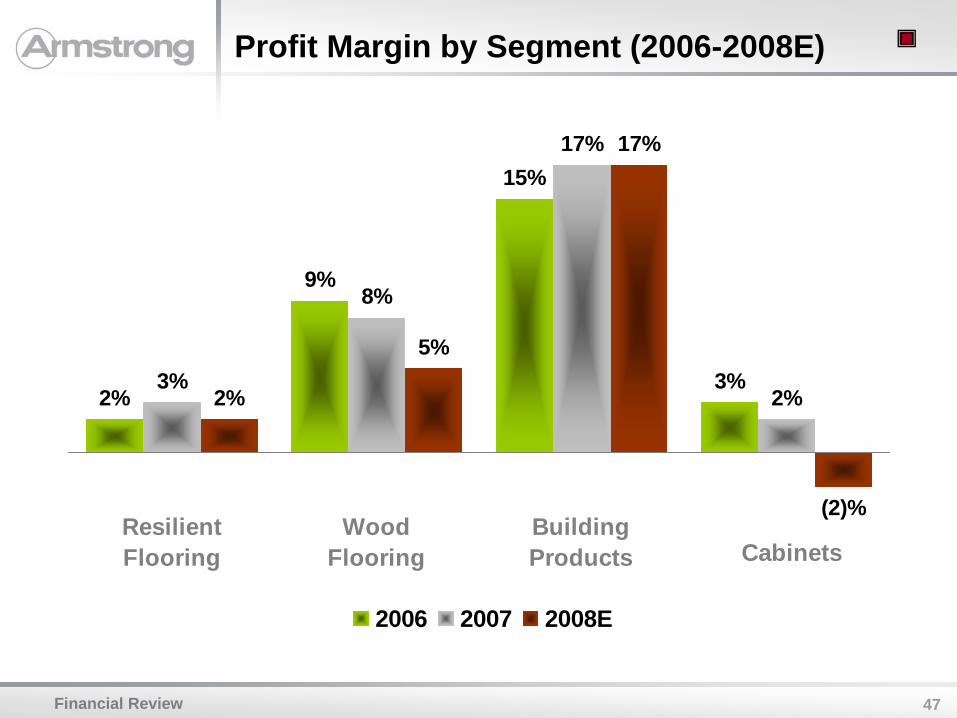
Profit Margin by Segment (2006-2008E)
3%
15%
9%
2% 2%
17%
8%
3%
(2)%
17%
5%
2%
2006 2007 2008E
Resilient Flooring
Wood Flooring
Building Products Cabinets
Financial Review

48
Cash Flow (2006-2008E)
($-Millions)
Cash Earnings (Pre-Tax) 800
Tax Refunds/(Payments) 100
Working Capital (50)
WAVE Dividends 200
Cash Flow from Operations 1,050
Capital Spending (net) (250)
Free Operating Cash Flow 800
Dividends Paid (250)
Debt Reduction (400)
Change in Cash 150
Financial Review

49
Balance Sheet (2008E)
($-Millions)Cash 400Working Capital 500PP&E 950Pension Asset 400Intangibles 700WAVE Investment 250Deferred Tax Asset 400Retiree Medical (300)Tax Liabilities (600)Net Assets 2,700Debt 500Equity 2,200Total Capital 2,700
Financial Review

50
Volume/Mix by Segment (2006-2008E)
(45)(55)
(10)(15)
25
40
5
Volume Mix
Resilient Flooring
Wood Flooring
Building Products Cabinets
($-Millions)
Financial Review

51
Productivity by Segment (2006-2008E)
($-Millions)50
3530
(5)
(20)
5
25
Manufacturing SG&A
Resilient Flooring
Wood Flooring
Building Products Cabinets Corporate
Financial Review

52
Mike LockhartChairman & Chief Executive Officer
Conclusion

53
Strengths
Market leadership: #1 in businesses representing 80% of sales
Renowned brands
Diversified end markets, product portfolios and geographies
Low-cost manufacturing and advantageous footprint
Customer service
Product quality and design
Conclusion

54
Opportunities
We are strongly positioned to benefit from opportunities created by weak markets and their eventual recovery
Portfolio Opportunities
Execution Experience
Plant consolidation
Product mix improvement
Price realization
Outperform the market
Strong Balance Sheet
European Resilient
Emerging markets
US Resilient consolidation
Residential market recovery
Tuck-in acquisitions
Low leverage
Strong cash flow
No new capital required+ +
=Increased Shareholder Returns
Conclusion