Northern Gates to Armenia: JAVAKHK, LORI (in Armenian), Part 4

Armenian Banking Sector Overview
2017 1st Quarter Results
May, 2017

2
Contents
Page
Basis of Preparation
3
At a Glance 4
Sector Highlights 5
Bank Profiles 6
Appendix 1: Shareholding Structure & General Information 23
Appendix 2: Sector Insights 25
Appendix 3: Key Financial Indicators 28
Appendix 4: Bank Contact Details 34
KPMG Experience in the Armenian Banking Sector 36
Abbreviations 37
Glossary of Terms 38
© 2017 KPMG Armenia cjsc, a company incorporated under the Laws of the Republic of Armenia, a member firm of the
KPMG network of independent member firms affiliated with KPMG International Cooperative (“KPMG International”), a
Swiss entity. All rights reserved
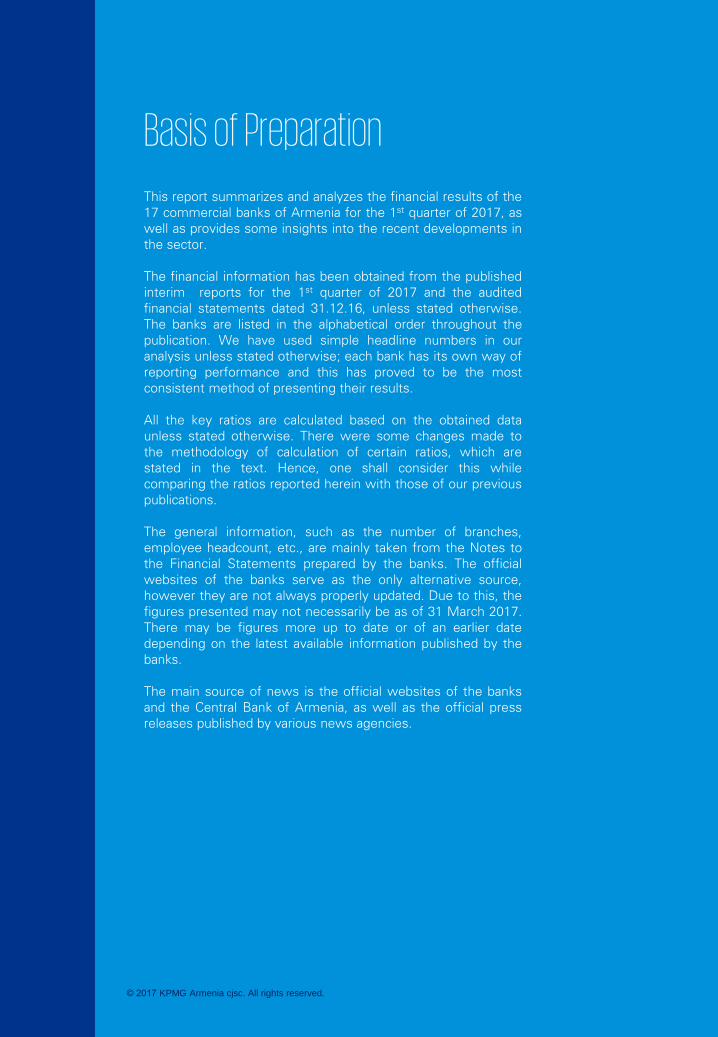
Basis of Preparation
This report summarizes and analyzes the financial results of the
17 commercial banks of Armenia for the 1st
quarter of 2017, as
well as provides some insights into the recent developments in
the sector.
The financial information has been obtained from the published
interim reports for the 1st
quarter of 2017 and the audited
financial statements dated 31.12.16, unless stated otherwise.
The banks are listed in the alphabetical order throughout the
publication. We have used simple headline numbers in our
analysis unless stated otherwise; each bank has its own way of
reporting performance and this has proved to be the most
consistent method of presenting their results.
All the key ratios are calculated based on the obtained data
unless stated otherwise. There were some changes made to
the methodology of calculation of certain ratios, which are
stated in the text. Hence, one shall consider this while
comparing the ratios reported herein with those of our previous
publications.
The general information, such as the number of branches,
employee headcount, etc., are mainly taken from the Notes to
the Financial Statements prepared by the banks. The official
websites of the banks serve as the only alternative source,
however they are not always properly updated. Due to this, the
figures presented may not necessarily be as of 31 March 2017.
There may be figures more up to date or of an earlier date
depending on the latest available information published by the
banks.
The main source of news is the official websites of the banks
and the Central Bank of Armenia, as well as the official press
releases published by various news agencies.
© 2017 KPMG Armenia cjsc. All rights reserved.

4
At a Glance
Key Financial Indicators of the Armenian Banking Sector (in million AMD)
Top Ten Banks of the Armenian Banking Sector as of 31 March 2017 (in million AMD)
* The indicators of the financial position are as of the last day of the corresponding period.
** Loan portfolio includes loans and the receivables from letters of credits, finance lease and factoring.
*** Deposits include current accounts.
**** Net operating income is before provisions and administrative expenses.
The banking system remains the biggest part of the Armenian financial market. As of 31 March 2017, there were 17
commercial banks operating in the Republic of Armenia. They had 524 branches in Armenia and in Nagorno Karabakh,
from which 232 were located in Yerevan. The total number of employees in the Armenian commercial banks was
about 11,033.
© 2017 KPMG Armenia cjsc. All rights reserved.
Key Financial Indicators* 2017 I Q 2016 2016 I Q
Change
31.03.17/31.12.16
Change
31.03.17/31.03.16
Assets 4,093,196 4,019,622 3,507,789 1.8% 16.7%
Interest Earning Assets 3,189,639 3,100,274 2,628,471 2.9% 21.3%
Gross Advances to Customers 2,709,781 2,624,604 2,350,950 3.2% 15.3%
Loan portfolio** 2,558,058 2,528,952 2,171,896 1.2% 17.8%
Liabilities 3,427,662 3,359,197 2,945,205 2.0% 16.4%
Deposits*** 2,354,153 2,267,078 1,930,109 3.8% 22.0%
Equity 665,533 660,425 562,585 0.8% 18.3%
Charter Capital 404,647 370,949 320,173 9.1% 26.4%
Total Income 106,046 405,646 96,157 - 10.3%
Interest Income 88,949 326,519 80,960 - 9.9%
Non-Interest Income 7,749 26,209 7,332 - 5.7%
Net Interest Income 37,248 141,748 32,768 - 13.7%
Net Non-Interest Income 5,746 18,721 5,369 - 7.0%
Net Operating Income**** 52,342 213,386 46,003 - 13.8%
Operating Expenses (27,283) (108,276) (26,552) - 2.8%
Net Provision Expenses (11,698) (67,063) (14,520) - (19.4%)
Net Profit before Taxes 13,362 38,048 4,930 - 171.0%
Net Profit after Taxes 10,871 32,971 3,098 - 250.9%
Other Comprehensive Income 1,853 26,807 8,471 - (78.1%)
Total Comprehensive Income 12,724 59,778 11,569 - 10.0%
-2,000
0
2,000
4,000
6,000
8,000
10,000
12,000
14,000
16,000
0
50,000
100,000
150,000
200,000
250,000
300,000
350,000
400,000
450,000
500,000
550,000
600,000
650,000
700,000
Ameria ASHIB ABB ACBA Anelik Ineco VTB HSBC Converse Ararat
Assets Loans Deposits
Equity Total Income (right axis) Net Profit (right axis)

5
Compared with the same period of 2016, the banking system assets
grew by 16.7% and reached AMD 4,093 billion as of 31 March 2017.
For the period ended 31 March 2017 the return on assets (ROA) for the
Armenian banking system was 1.07%, which increased by 0.7
percentage points compared with the same period of 2016.
During the first quarter of 2017 compared with the previous quarter
there were only a few changes in the list of Top 10 Banks in Armenia by
assets with "AraratBank" OJSC moving down by 1 position and
"Converse Bank" CJSC moving up by 1 position.
As of 31 March 2017 the total amount of outstanding loans grew by
17.8% compared with the same period of 2016 and reached AMD 2,558
billion.
For the period ended 31 March 2017 the ratio of loan portfolio to total
assets for the Armenian banking system was 62.5%. According to the
CBA, as of 31 March 2017 the Armenian banking system liquidity ratio
was 32.03%.
For the reported period the total net provision expenses of the Armenian
banking sector decreased by 19.4% compared with the same period of
2016, and amounted to AMD 11.7 billion.
The outstanding balance of deposits as of 31 March 2017 increased by
22% compared with the same date of 2016, reaching AMD 2,354
billion.
As of 31 March 2017 the loan portfolio/deposit ratio for the Armenian
banking system was 1.09.
As of 31 March 2017 the total equity of banks reached AMD 665.5
billion, which exceeded the same indicator as of 31 March 2016 by
18.3%.
For the period ended 31 March 2017 the return on equity (ROE) for the
Armenian banking system was 6.64%. The ratio of equity to assets as of
the reported date was 16.3%. According to the CBA, the capital
adequacy ratio of Armenian banking system was 20.02%.
During the period ended 31 March 2017, the banking system had total
income of AMD 106 billion, which exceeded the total income for the
same period of 2016 by 10.3%. For the period ended 31 March 2017 the
net interest margin for the Armenian banking system was 5.1%. The
cost to income ratio for the reported period was 52.1%.
The net profit before taxes of the banks for the period ended 31 March
2017 was AMD 13.4 billion.
The net profit after taxes of the banking system for the period ended 31
March 2017 was AMD 10.9 billion, which is 3.5 times higher compared
with the same date of 2016.
For the period ended 31 March 2017 the profit margin for the Armenian
banking system was 10.3%.
Liquidity
32.03%
Loan
portfolio/
deposits
1.09
16.7%
Assets
17.8%
Loans
22%
Deposits
18.3%
Equity
Total
income
10.3%
3.5
times
Profit
ROA
1.07%
ROE
6.64%
Capital
adequacy
20.02%
NIM
5.1%
Cost/
income
52.1%
PM
10.3%
Sector Highlights
© 2017 KPMG Armenia cjsc. All rights reserved.

6
Bank ProfilesACBA – Credit Agricole BankKey Financial Indicators*
Key Indicators of the Financial Position
Key Ratios**
Key Indicators of the Financial Results
Rankings
3rd
rank by the equity
3rd
rank by the total income
3rd
rank by the interest income
3rd
rank by the total comprehensive income
Among the top ten banks by all main financial indicators.
** The capital adequacy and liquidity ratios are taken from the key prudential ratios reported by the bank as of the end of the reporting period.
* The indicators of the financial position are as of the last day of the corresponding period.
January February March
A new branch has been opened in
Armavir region.
© 2017 KPMG Armenia cjsc. All rights reserved.
2017 I Q 2016 2016 I Q
2017 Q I/
2016
Change
31.03.17/31.03.16
Assets 308,250 283,272 279,239 7.5% 4 8.8% 10.4%
Interest Earning Assets 239,963 209,639 209,600 7.5% 5 14.5% 14.5%
Loan Portfolio 177,525 174,983 179,973 6.9% 5 1.5% (1.4%)
Liabilities 249,968 226,677 221,742 7.3% 4 10.3% 12.7%
Deposits 150,835 122,572 125,229 6.4% 8 23.1% 20.4%
Equity 58,282 56,595 57,498 8.8% 3 3.0% 1.4%
Charter Capital 30,000 30,000 30,000 7.4% 7 - -
Total Income 9,957 39,259 9,502 9.4% 3 - 4.8%
Interest Income 8,069 31,618 7,179 9.1% 3 - 12.4%
Net Provision Expenses (873) (7,236) (1,069) 7.5% 8 - (18.4%)
Net Profit after Taxes 1,475 1,823 1,118 13.6% 4 - 32.0%
Total Comprehensive Income 1,687 2,883 1,521 13.3% 3 - 10.9%
ChangeAmount, mln AMD Share
in total,
%
Rank
-
50,000
100,000
150,000
200,000
250,000
300,000
350,000
Assets Loan
Portfolio
Deposits Equity
As of 31.03.17 As of 31.12.16
0.7%
3.8%
8.8%
14.8%
18.9%
57.6%
56.3%
26.1%
18.0%
0% 20% 40% 60% 80%
ROA
ROE
NIM
PM
Equity/Assets
Loan Portfolio/Assets
Cost to Income Ratio
Liquidity
Capital Adequacy
(2,000)
-
2,000
4,000
6,000
8,000
10,000
Total
Income
Interest
Income
NPE NPT OCI
2017 I Q 2016 I Q

7
Bank Profiles (continued) Ameriabank
** The capital adequacy and liquidity ratios are taken from the key prudential ratios reported by the bank as of the end of the reporting period.
* The indicators of the financial position are as of the last day of the corresponding period.
Key Financial Indicators*
Key Indicators of the Financial Position Key Indicators of the Financial Results
Key Ratios**Rankings
1st
rank by the assets
1st
rank by the interest earning assets
1st
rank by the loan portfolio
1st
rank by the liabilities
1st
rank by the deposits
1st
rank by the equity
1st
rank by the interest income
2nd
rank by the total income
2nd
rank by the net profit after tax
Among the top ten banks by all main financial indicators.
A new branch has been opened in
Gyumri, Shirak Region.
© 2017 KPMG Armenia cjsc. All rights reserved.
January February March
2017 I Q 2016 2016 I Q
2017 Q I/
2016
Change
31.03.17/31.03.16
Assets 679,379 719,363 507,724 16.6% 1 (5.6%) 33.8%
Interest Earning Assets 530,873 576,313 372,070 16.6% 1 (7.9%) 42.7%
Loan Portfolio 473,691 513,219 330,459 18.5% 1 (7.7%) 43.3%
Liabilities 613,341 654,966 447,085 17.9% 1 (6.4%) 37.2%
Deposits 360,731 414,609 288,821 15.3% 1 (13.0%) 24.9%
Equity 66,038 64,398 60,639 9.9% 1 2.5% 8.9%
Charter Capital 32,087 32,087 32,087 7.9% 5 - -
Total Income 14,689 52,406 11,446 13.9% 2 - 28.3%
Interest Income 12,780 42,624 10,076 14.4% 1 - 26.8%
Net Provision Expenses (1,021) (5,434) (860) 8.7% 5 - 18.7%
Net Profit after Taxes 1,645 6,207 1,196 15.1% 2 - 37.5%
Total Comprehensive Income 1,640 6,766 1,322 12.9% 4 - 24.1%
Amount, mln AMD Share
in total,
%
Rank
Change
-
100,000
200,000
300,000
400,000
500,000
600,000
700,000
800,000
Assets Loan
Portfolio
Deposits Equity
As of 31.03.17 As of 31.12.16 As of 31.03.16
1.1%
10.5%
3.3%
11.2%
9.7%
69.7%
47.2%
31.5%
15.0%
0% 20% 40% 60% 80%
ROA
ROE
NIM
PM
Equity/Assets
Loan Portfolio/Assets
Cost to Income Ratio
Liquidity
Capital Adequacy
(2,000)
-
2,000
4,000
6,000
8,000
10,000
12,000
14,000
16,000
Total
Income
Interest
Income
NPE NPT OCI
2017 I Q 2016 I Q

8
Bank Profiles (continued) Anelik Bank
** The capital adequacy and liquidity ratios are taken from the key prudential ratios reported by the bank as of the end of the reporting period.
* The indicators of the financial position are as of the last day of the corresponding period.
Key Financial Indicators*
Key Indicators of the Financial Position Key Indicators of the Financial Results
Key Ratios** Rankings
2nd
rank by the comprehensive income
3rd
rank by charter capital
Among the top ten banks by almost all main financial
indicators.
© 2017 KPMG Armenia cjsc. All rights reserved.
January February March
2017 I Q 2016 2016 I Q
2017 Q I/
2016
Change
31.03.17/31.03.16
Assets 283,144 282,453 90,518 6.9% 5 0.2% 212.8%
Interest Earning Assets 254,309 244,052 66,962 8.0% 4 4.2% 279.8%
Loan Portfolio 216,721 217,037 60,208 8.5% 4 (0.1%) 260.0%
Liabilities 239,811 241,331 74,828 7.0% 5 (0.6%) 220.5%
Deposits 164,468 167,523 52,905 7.0% 4 (1.8%) 210.9%
Equity 43,333 41,122 15,690 6.5% 6 5.4% 176.2%
Charter Capital 33,972 33,972 13,696 8.4% 3 - 148.0%
Total Income 6,781 15,439 2,866 6.4% 7 - 136.6%
Interest Income 6,101 13,210 2,363 6.9% 7 - 158.2%
Net Provision Expenses (436) (1,222) (1,721) 3.7% 11 - (74.7%)
Net Profit after Taxes 1,007 1,117 (1,546) 9.3% 7 - 165.1%
Total Comprehensive Income 1,719 2,945 (1,546) 13.5% 2 - 211.2%
Amount, mln AMD Share
in total,
%
Rank
Change
-
50,000
100,000
150,000
200,000
250,000
300,000
Assets Loan
Portfolio
Deposits Equity
As of 31.03.17 As of 31.12.16 As of 31.03.16
2.0%
12.4%
3.7%
14.8%
15.3%
76.5%
39.5%
44.7%
32.1%
0% 20% 40% 60% 80% 100%
ROA
ROE
NIM
PM
Equity/Assets
Loan Portfolio/Assets
Cost to Income Ratio
Liquidity
Capital Adequacy
(2,000)
-
2,000
4,000
6,000
8,000
Total
Income
Interest
Income
NPE NPT OCI
2017 I Q 2016 I Q

9
Bank Profiles (continued) Araratbank
** The capital adequacy and liquidity ratios are taken from the key prudential ratios reported by the bank as of the end of the reporting period.
* The indicators of the financial position are as of the last day of the corresponding period.
Key Financial Indicators*
Key Indicators of the Financial Position Key Indicators of the Financial Results
Key Ratios**
© 2017 KPMG Armenia cjsc. All rights reserved.
January February March
0.7%
3.9%
5.9%
3.7%
16.9%
56.6%
54.5%
38.7%
17.3%
0% 20% 40% 60% 80%
ROA
ROE
NIM
PM
Equity/Assets
Loan Portfolio/Assets
Cost to Income Ratio
Liquidity
Capital Adequacy
-
50,000
100,000
150,000
200,000
Assets Loan
Portfolio
Deposits Equity
As of 31.03.17 As of 31.12.16 As of 31.03.16
2017 I Q 2016 2016 I Q
2017 Q I/
2016
Change
31.03.17/31.03.16
Assets 196,762 149,199 130,674 4.8% 10 31.9% 50.6%
Interest Earning Assets 148,802 106,489 88,185 4.7% 9 39.7% 68.7%
Loan Portfolio 111,379 66,149 66,738 4.4% 11 68.4% 66.9%
Liabilities 163,462 116,068 107,964 4.8% 10 40.8% 51.4%
Deposits 107,638 62,876 53,151 4.6% 10 71.2% 102.5%
Equity 33,299 33,131 22,710 5.0% 11 0.5% 46.6%
Charter Capital 8,804 8,804 6,388 2.2% 15 - 37.8%
Total Income 5,128 13,111 3,095 4.8% 9 - 65.7%
Interest Income 4,157 10,776 2,564 4.7% 9 - 62.1%
Net Provision Expenses (995) (1,265) (283) 8.5% 6 - 251.7%
Net Profit after Taxes 191 1,089 177 1.8% 13 - 8.0%
Total Comprehensive Income 169 2,159 238 1.3% 14 - (29.2%)
Amount, mln AMD Share
in total,
%
Rank
Change
(2,000)
(1,000)
-
1,000
2,000
3,000
4,000
5,000
6,000
Total
Income
Interest
Income
NPE NPT OCI
2017 I Q 2016 I Q

10
Bank Profiles (continued) Ardshinbank
* The indicators of the financial position are as of the last day of the corresponding period.
** The capital adequacy and liquidity ratios are taken from the key prudential ratios reported by the bank as of the end of the reporting period.
Key Financial Indicators*
Key Indicators of the Financial Position Key Indicators of the Financial Results
Key Ratios** Rankings
1st
rank by the charter capital
1st
rank by the total income
2nd
rank by the assets
2nd
rank by the interest earning assets
2nd
rank by the loan portfolio
2nd
rank by the liabilities
2nd
rank by the deposits
2nd
rank by the equity
2nd
rank by the interest income
Among the top ten banks by almost all main financial
indicators.
The Central Bank has approved and
registered the merge agreement
between Ardshinbank and Areximbank.
© 2017 KPMG Armenia cjsc. All rights reserved.
January February March
-
100,000
200,000
300,000
400,000
500,000
600,000
Assets Loan
Portfolio
Deposits Equity
As of 31.03.17 As of 31.12.16 As of 31.03.16
4.5%
40.0%
4.0%
8.3%
11.4%
66.5%
45.3%
25.7%
15.2%
0% 20% 40% 60% 80%100%
ROA
ROE
NIM
PM
Equity/Assets
Loan Portfolio/Assets
Cost to Income Ratio
Liquidity
Capital Adequacy
2017 I Q 2016 2016 I Q
2017 Q I/
2016
Change
31.03.17/31.03.16
Assets 533,074 548,410 461,151 13.0% 2 (2.8%) 15.6%
Interest Earning Assets 409,547 406,562 344,083 12.8% 2 0.7% 19.0%
Loan Portfolio 354,470 358,005 302,355 13.9% 2 (1.0%) 17.2%
Liabilities 472,338 476,942 411,278 13.8% 2 (1.0%) 14.8%
Deposits 313,846 297,676 259,832 13.3% 2 5.4% 20.8%
Equity 60,735 71,468 49,872 9.1% 2 (15.0%) 21.8%
Charter Capital 50,227 17,925 17,925 12.4% 1 180.2% 180.2%
Total Income 15,055 68,616 12,212 14.2% 1 - 23.3%
Interest Income 12,253 44,710 10,876 13.8% 2 - 12.7%
Net Provision Expenses (1,855) (5,697) (855) 15.9% 1 - 117.1%
Net Profit after Taxes 1,242 22,023 1,126 11.4% 5 - 10.3%
Total Comprehensive Income 1,268 23,350 1,363 10.0% 7 - (7.0%)
Amount, mln AMD Share
in total,
%
Rank
Change
(2,000)
3,000
8,000
13,000
18,000
Total
Income
Interest
Income
NPE NPT OCI
2017 I Q 2016 I Q
11
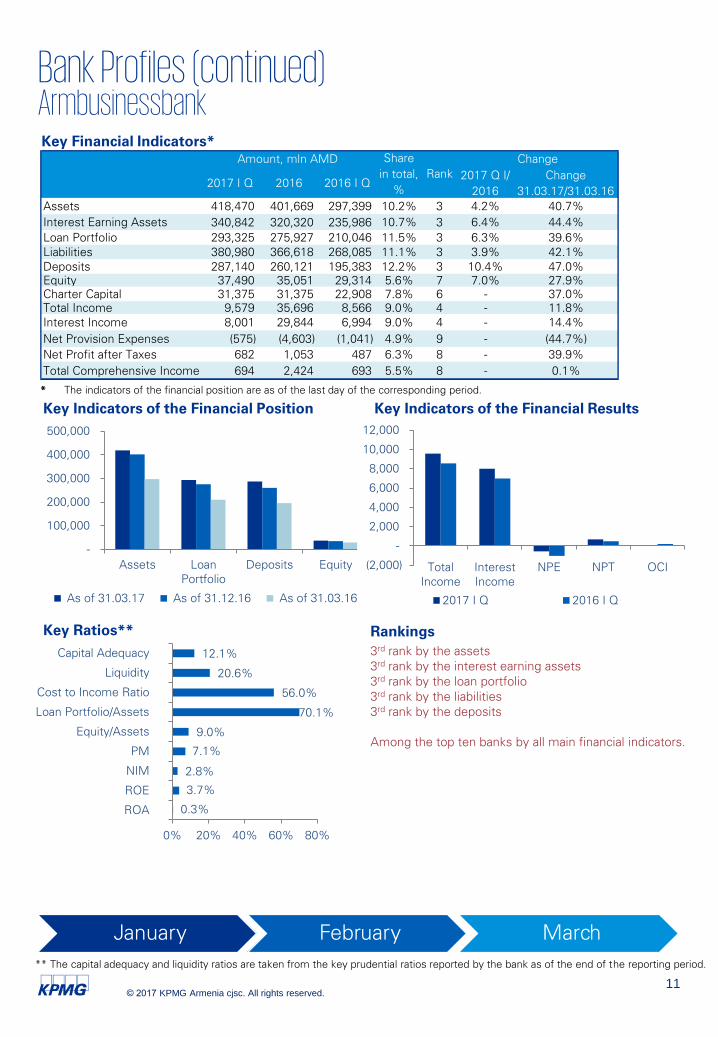
Bank Profiles (continued) Armbusinessbank
** The capital adequacy and liquidity ratios are taken from the key prudential ratios reported by the bank as of the end of the reporting period.
* The indicators of the financial position are as of the last day of the corresponding period.
Key Financial Indicators*
Key Indicators of the Financial Position Key Indicators of the Financial Results
Key Ratios** Rankings
3rd
rank by the assets
3rd
rank by the interest earning assets
3rd
rank by the loan portfolio
3rd
rank by the liabilities
3rd
rank by the deposits
Among the top ten banks by all main financial indicators.
© 2017 KPMG Armenia cjsc. All rights reserved.
January February March
-
100,000
200,000
300,000
400,000
500,000
Assets Loan
Portfolio
Deposits Equity
As of 31.03.17 As of 31.12.16 As of 31.03.16
(2,000)
-
2,000
4,000
6,000
8,000
10,000
12,000
Total
Income
Interest
Income
NPE NPT OCI
2017 I Q 2016 I Q
0.3%
3.7%
2.8%
7.1%
9.0%
70.1%
56.0%
20.6%
12.1%
0% 20% 40% 60% 80%
ROA
ROE
NIM
PM
Equity/Assets
Loan Portfolio/Assets
Cost to Income Ratio
Liquidity
Capital Adequacy
2017 I Q 2016 2016 I Q
2017 Q I/
2016
Change
31.03.17/31.03.16
Assets 418,470 401,669 297,399 10.2% 3 4.2% 40.7%
Interest Earning Assets 340,842 320,320 235,986 10.7% 3 6.4% 44.4%
Loan Portfolio 293,325 275,927 210,046 11.5% 3 6.3% 39.6%
Liabilities 380,980 366,618 268,085 11.1% 3 3.9% 42.1%
Deposits 287,140 260,121 195,383 12.2% 3 10.4% 47.0%
Equity 37,490 35,051 29,314 5.6% 7 7.0% 27.9%
Charter Capital 31,375 31,375 22,908 7.8% 6 - 37.0%
Total Income 9,579 35,696 8,566 9.0% 4 - 11.8%
Interest Income 8,001 29,844 6,994 9.0% 4 - 14.4%
Net Provision Expenses (575) (4,603) (1,041) 4.9% 9 - (44.7%)
Net Profit after Taxes 682 1,053 487 6.3% 8 - 39.9%
Total Comprehensive Income 694 2,424 693 5.5% 8 - 0.1%
Amount, mln AMD Share
in total,
%
Rank
Change

12
Bank Profiles (continued) Armeconombank
* The indicators of the financial position are as of the last day of the corresponding period.
Key Financial Indicators*
Key Indicators of the Financial Position Key Indicators of the Financial Results
Key Ratios**
** The capital adequacy and liquidity ratios are taken from the key prudential ratios reported by the bank as of the end of the reporting period.
© 2017 KPMG Armenia cjsc. All rights reserved.
January February March
2017 I Q 2016 2016 I Q
2017 Q I/
2016
Change
31.03.17/31.03.16
Assets 153,458 146,182 108,180 3.7% 12 5.0% 41.9%
Interest Earning Assets 108,333 103,905 74,897 3.4% 13 4.3% 44.6%
Loan Portfolio 79,013 75,048 57,223 3.1% 12 5.3% 38.1%
Liabilities 125,612 118,613 88,497 3.7% 12 5.9% 41.9%
Deposits 75,369 66,795 55,624 3.2% 12 12.8% 35.5%
Equity 27,845 27,569 19,684 4.2% 15 1.0% 41.5%
Charter Capital 4,631 4,631 3,167 1.1% 17 - 46.2%
Total Income 3,854 14,326 3,095 3.6% 12 - 24.5%
Interest Income 3,209 11,360 2,534 3.6% 12 - 26.6%
Net Provision Expenses (200) (564) (134) 1.7% 12 - 49.5%
Net Profit after Taxes 72 590 104 0.7% 15 - (31.0%)
Total Comprehensive Income 144 5,248 4,649 1.1% 15 - (96.9%)
Amount, mln AMD Share
in total,
%
Rank
Change
-
50,000
100,000
150,000
200,000
Assets Loan
Portfolio
Deposits Equity
As of 31.03.17 As of 31.12.16 As of 31.03.16
(1,000)
-
1,000
2,000
3,000
4,000
5,000
Total
Income
Interest
Income
NPE NPT OCI
2017 I Q 2016 I Q
0.43%
2.3%
6.5%
1.9%
18.1%
51.5%
89.1%
31.4%
22.3%
0% 20% 40% 60% 80%100%
ROA
ROE
NIM
PM
Equity/Assets
Loan Portfolio/Assets
Cost to Income Ratio
Liquidity
Capital Adequacy

13
Bank Profiles (continued) ArmSwissBank
** The capital adequacy and liquidity ratios are taken from the key prudential ratios reported by the bank as of the end of the reporting period.
* The indicators of the financial position are as of the last day of the corresponding period.
Key Financial Indicators*
Key Indicators of the Financial Position Key Indicators of the Financial Results
Key Ratios**
© 2017 KPMG Armenia cjsc. All rights reserved.
January February March
2017 I Q 2016 2016 I Q
2017 Q I/
2016
Change
31.03.17/31.03.16
Assets 140,652 130,253 81,768 3.4% 13 8.0% 72.0%
Interest Earning Assets 121,831 107,555 68,966 3.8% 12 13.3% 76.7%
Loan Portfolio 53,054 46,077 37,116 2.1% 14 15.1% 42.9%
Liabilities 110,533 101,562 60,823 3.2% 13 8.8% 81.7%
Deposits 60,506 50,700 30,568 2.6% 13 19.3% 97.9%
Equity 30,119 28,691 20,945 4.5% 13 5.0% 43.8%
Charter Capital 8,753 8,753 8,753 2.2% 16 - -
Total Income 3,282 10,865 2,436 3.1% 13 - 34.7%
Interest Income 3,077 10,156 2,275 3.5% 13 - 35.3%
Net Provision Expenses (17) (161) (38) 0.1% 16 - (55.7%)
Net Profit after Taxes 1,053 3,284 740 9.7% 6 - 42.3%
Total Comprehensive Income 1,428 10,449 2,703 11.2% 6 - (47.2%)
Amount, mln AMD Share
in total,
%
Rank
Change
-
15,000
30,000
45,000
60,000
75,000
90,000
105,000
120,000
135,000
150,000
Assets Loan
Portfolio
Deposits Equity
As of 31.03.17 As of 31.12.16 As of 31.03.16
(50)
450
950
1,450
1,950
2,450
2,950
3,450
Total
Income
Interest
Income
NPE NPT OCI
2017 I Q 2016 I Q
3.2%
14.1%
6.0%
32.1%
21.4%
37.7%
18.1%
57.6%
21.0%
0% 20% 40% 60% 80%
ROA
ROE
NIM
PM
Equity/Assets
Loan Portfolio/Assets
Cost to Income Ratio
Liquidity
Capital Adequacy

14
Bank Profiles (continued) Artsakh Bank
** The capital adequacy and liquidity ratios are taken from the key prudential ratios reported by the bank as of the end of the reporting period.
* The indicators of the financial position are as of the last day of the corresponding period.
Key Financial Indicators*
Key Indicators of the Financial Position Key Indicators of the Financial Results
Key Ratios**
© 2017 KPMG Armenia cjsc. All rights reserved.
January February March
-
20,000
40,000
60,000
80,000
100,000
120,000
Assets Loan
Portfolio
Deposits Equity
As of 31.03.17 As of 31.12.16 As of 31.03.16
(2,000)
(1,000)
-
1,000
2,000
3,000
4,000
Total
Income
Interest
Income
NPE NPT
2017 I Q 2016 I Q
2017 I Q 2016 2016 I Q
2017 Q I/
2016
Change
31.03.17/31.03.16
Assets 102,648 103,475 96,084 2.5% 14 (0.8%) 6.8%
Interest Earning Assets 84,790 85,221 77,595 2.7% 14 (0.5%) 9.3%
Loan Portfolio 63,184 64,510 63,823 2.5% 13 (2.1%) (1.0%)
Liabilities 76,853 77,379 84,249 2.2% 14 (0.7%) (8.8%)
Deposits 60,417 59,138 53,711 2.6% 14 2.2% 12.5%
Equity 25,795 26,096 11,836 3.9% 16 (1.2%) 117.9%
Charter Capital 23,261 23,261 11,061 5.7% 9 - 110.3%
Total Income 2,988 12,363 3,149 2.8% 14 - (5.1%)
Interest Income 2,722 10,864 2,741 3.1% 14 - (0.7%)
Net Provision Expenses (1,140) 866 (251) 9.7% 3 - 354.6%
Net Profit after Taxes (532) 2,880 286 - 16 - (285.6%)
Total Comprehensive Income (532) 2,880 286 - 17 - (285.6%)
Amount, mln AMD Share
in total,
%
Rank
Change
2.1%
11.0%
5.2%
-17.8%
25.1%
61.6%
56.5%
22.7%
84.8%
-50% 0% 50% 100%
ROA
ROE
NIM
PM
Equity/Assets
Loan Portfolio/Assets
Cost to Income Ratio
Liquidity
Capital Adequacy

15
Bank Profiles (continued) Byblos Bank Armenia
** The capital adequacy and liquidity ratios are taken from the key prudential ratios reported by the bank as of the end of the reporting period.
* The indicators of the financial position are as of the last day of the corresponding period.
Key Financial Indicators*
Key Indicators of the Financial Position Key Indicators of the Financial Results
Key Ratios**
© 2017 KPMG Armenia cjsc. All rights reserved.
January February March
(200)
-
200
400
600
800
1,000
1,200
1,400
Total
Income
Interest
Income
NPE NPT OCI
2017 I Q 2016 I Q
-
10,000
20,000
30,000
40,000
50,000
60,000
70,000
Assets Loan
Portfolio
Deposits Equity
As of 31.03.17 As of 31.12.16 As of 31.03.16
0.6%
2.2%
4.6%
20.6%
32.1%
31.8%
41.1%
56.8%
57.4%
0% 20% 40% 60% 80%
ROA
ROE
NIM
PM
Equity/Assets
Loan Portfolio/Assets
Cost to Income Ratio
Liquidity
Capital Adequacy
2017 I Q 2016 2016 I Q
2017 Q I/
2016
Change
31.03.17/31.03.16
Assets 69,185 64,190 36,256 1.7% 16 7.8% 90.8%
Interest Earning Assets 51,865 47,740 25,831 1.6% 16 8.6% 100.8%
Loan Portfolio 21,998 22,156 17,357 0.9% 16 (0.7%) 26.7%
Liabilities 46,998 42,313 30,983 1.4% 16 11.1% 51.7%
Deposits 31,056 29,341 25,541 1.3% 16 5.8% 21.6%
Equity 22,187 21,878 5,273 3.3% 17 1.4% 320.8%
Charter Capital 23,825 23,825 8,125 5.9% 8 - 193.2%
Total Income 1,330 3,696 709 1.3% 16 - 87.6%
Interest Income 1,197 3,526 675 1.3% 16 - 77.4%
Net Provision Expenses (69) (680) (76) 0.6% 15 - 8.5%
Net Profit after Taxes 275 (156) (178) 2.5% 11 - 254.1%
Total Comprehensive Income 309 769 (136) 2.4% 11 - 328.2%
Amount, mln AMD Share
in total,
%
Rank
Change

16
Bank Profiles (continued) Converse Bank
* The indicators of the financial position are as of the last day of the corresponding period.
Key Financial Indicators*
Key Indicators of the Financial Position Key Indicators of the Financial Results
Key Ratios**
.
** The capital adequacy and liquidity ratios are taken from the key prudential ratios reported by the bank as of the end of the reporting period.
© 2017 KPMG Armenia cjsc. All rights reserved.
January February March
2017 I Q 2016 2016 I Q
2017 Q I/
2016
Change
31.03.17/31.03.16
Assets 203,281 190,993 153,056 5.0% 9 6.4% 32.8%
Interest Earning Assets 147,716 136,460 106,298 4.6% 10 8.2% 39.0%
Loan Portfolio 128,199 119,025 87,987 5.0% 8 7.7% 45.7%
Liabilities 170,224 158,815 130,111 5.0% 8 7.2% 30.8%
Deposits 152,745 139,680 107,958 6.5% 7 9.4% 41.5%
Equity 33,057 32,178 22,945 5.0% 12 2.7% 44.1%
Charter Capital 16,417 16,417 7,002 4.1% 13 - 134.5%
Total Income 4,908 17,523 3,975 4.6% 11 - 23.4%
Interest Income 3,912 13,860 3,434 4.4% 10 - 13.9%
Net Provision Expenses (490) (1,645) (359) 4.2% 10 - 36.4%
Net Profit after Taxes 394 1,565 148 3.6% 9 - 166.6%
Total Comprehensive Income 525 2,764 231 4.1% 9 - 127.2%
Amount, mln AMD Share
in total,
%
Rank
Change
-
50,000
100,000
150,000
200,000
250,000
Assets Loan
Portfolio
Deposits Equity
As of 31.03.17 As of 31.12.16 As of 31.03.16
(1,000)
-
1,000
2,000
3,000
4,000
5,000
6,000
Total
Income
Interest
Income
NPE NPT OCI
2017 I Q 2016 I Q
1.0%
6.5%
6.0%
8.0%
16.3%
63.1%
64.5%
37.4%
20.6%
0% 20% 40% 60% 80% 100%
ROA
ROE
NIM
PM
Equity/Assets
Loan Portfolio/Assets
Cost to Income Ratio
Liquidity
Capital Adequacy

17
Bank Profiles (continued) HSBC Bank Armenia
** The capital adequacy and liquidity ratios are taken from the key prudential ratios reported by the bank as of the end of the reporting period.
* The indicators of the financial position are as of the last day of the corresponding period.
Key Financial Indicators*
Key Indicators of the Financial Position Key Indicators of the Financial Results
Key Ratios** Rankings
3rd
rank by the net profit after taxes
© 2017 KPMG Armenia cjsc. All rights reserved.
January February March
2017 I Q 2016 2016 I Q
2017 Q I/
2016
Change
31.03.17/31.03.16
Assets 217,894 215,161 256,648 5.3% 8 1.3% (15.1%)
Interest Earning Assets 154,533 151,526 207,912 4.8% 8 2.0% (25.7%)
Loan Portfolio 119,737 119,590 165,409 4.7% 9 0.1% (27.6%)
Liabilities 169,328 168,154 202,686 4.9% 9 0.7% (16.5%)
Deposits 152,802 149,833 148,319 6.5% 6 2.0% 3.0%
Equity 48,565 47,007 53,962 7.3% 4 3.3% (10.0%)
Charter Capital 18,434 18,434 18,434 4.6% 11 - -
Total Income 4,933 23,050 5,824 4.7% 10 - (15.3%)
Interest Income 3,596 17,649 4,562 4.0% 11 - (21.2%)
Net Provision Expenses (130) (16,887) (1,436) 1.1% 13 - (90.9%)
Net Profit after Taxes 1,572 (6,667) 750 14.5% 3 - 109.6%
Total Comprehensive Income 1,558 (6,030) 926 12.2% 5 - 68.4%
Amount, mln AMD Share
in total,
%
Rank
Change
-
50,000
100,000
150,000
200,000
250,000
300,000
Assets Loan
Portfolio
Deposits Equity
As of 31.03.17 As of 31.12.16 As of 31.03.16
(2,000)
(1,000)
-
1,000
2,000
3,000
4,000
5,000
6,000
Total
Income
Interest
Income
NPE NPT OCI
2017 I Q 2016 I Q
-2.5%
-11.4%
6.4%
31.9%
22.3%
55.0%
52.9%
41.3%
17.1%
-30% -10% 10% 30% 50% 70%
ROA
ROE
NIM
PM
Equity/Assets
Loan Portfolio/Assets
Cost to Income Ratio
Liquidity
Capital Adequacy

18
Bank Profiles (continued) Inecobank
* The indicators of the financial position are as of the last day of the corresponding period.
Key Financial Indicators*
Key Indicators of the Financial Position Key Indicators of the Financial Results
Key Ratios** Rankings
1st
rank by the net profit after taxes
1st
rank by the total comprehensive income
Among the top ten banks by almost all main financial
indicators.
** The capital adequacy and liquidity ratios are taken from the key prudential ratios reported by the bank as of the end of the reporting period.
© 2017 KPMG Armenia cjsc. All rights reserved.
January February March
2017 I Q 2016 2016 I Q
2017 Q I/
2016
Change
31.03.17/31.03.16
Assets 242,504 236,196 226,843 5.9% 6 2.7% 6.9%
Interest Earning Assets 190,510 186,901 183,518 6.0% 6 1.9% 3.8%
Loan Portfolio 158,886 160,155 153,816 6.2% 6 (0.8%) 3.3%
Liabilities 196,892 192,731 184,741 5.7% 6 2.2% 6.6%
Deposits 105,747 110,360 80,487 4.5% 11 (4.2%) 31.4%
Equity 45,612 43,465 42,102 6.9% 5 4.9% 8.3%
Charter Capital 14,546 14,546 14,546 3.6% 14 - -
Total Income 7,534 30,212 7,372 7.1% 5 - 2.2%
Interest Income 6,510 25,833 6,391 7.3% 5 - 1.9%
Net Provision Expenses (983) (4,586) (933) 8.4% 7 - 5.3%
Net Profit after Taxes 1,705 5,158 1,172 15.7% 1 - 45.5%
Total Comprehensive Income 1,808 6,199 1,336 14.2% 1 - 35.3%
Amount, mln AMD Share
in total,
%
Rank
Change
-
50,000
100,000
150,000
200,000
250,000
300,000
Assets Loan
Portfolio
Deposits Equity
As of 31.03.17 As of 31.12.16 As of 31.03.16
(1,000)
-
1,000
2,000
3,000
4,000
5,000
6,000
7,000
8,000
Total
Income
Interest
Income
NPE NPT OCI
2017 I Q 2016 I Q
2.4%
13.0%
7.6%
22.6%
18.8%
65.5%
32.1%
28.0%
15.6%
0% 20% 40% 60% 80%
ROA
ROE
NIM
PM
Equity/Assets
Loan Portfolio/Assets
Cost to Income Ratio
Liquidity
Capital Adequacy

19
Bank Profiles (continued) Mellat Bank
** The capital adequacy and liquidity ratios are taken from the key prudential ratios reported by the bank as of the end of the reporting period.
* The indicators of the financial position are as of the last day of the corresponding period.
Key Financial Indicators*
Key Indicators of the Financial Position Key Indicators of the Financial Results
Key Ratios**
© 2017 KPMG Armenia cjsc. All rights reserved.
Rankings
4th
rank by the charter capital
January February March
-
10,000
20,000
30,000
40,000
50,000
Assets Loan
Portfolio
Deposits Equity
As of 31.03.17 As of 31.12.16 As of 31.03.16
(200)
-
200
400
600
800
Total
Income
Interest
Income
NPE NPT
2017 I Q 2016 I Q
3.3%
4.5%
10.5%
34.2%
80.0%
14.1%
41.3%
79.3%
221.5%
0% 100% 200% 300%
ROA
ROE
NIM
PM
Equity/Assets
Loan Portfolio/Assets
Cost to Income Ratio
Liquidity
Capital Adequacy
2017 I Q 2016 2016 I Q
2017 Q I/
2016
Change
31.03.17/31.03.16
Assets 42,445 41,242 29,674 1.0% 17 2.9% 43.0%
Interest Earning Assets 27,976 28,605 21,061 0.9% 17 (2.2%) 32.8%
Loan Portfolio 5,965 5,756 5,996 0.2% 17 3.6% (0.5%)
Liabilities 8,506 7,569 10,323 0.2% 17 12.4% (17.6%)
Deposits 3,403 2,475 1,353 0.1% 17 37.5% 151.6%
Equity 33,939 33,673 19,351 5.1% 9 0.8% 75.4%
Charter Capital 32,100 32,100 18,100 7.9% 4 - 77.3%
Total Income 781 2,884 548 0.7% 17 - 42.5%
Interest Income 725 2,589 532 0.8% 17 - 36.3%
Net Provision Expenses (79) (197) (105) 0.7% 14 - (24.3%)
Net Profit after Taxes 267 1,004 84 2.5% 12 - 218.3%
Total Comprehensive Income 267 1,004 84 2.1% 12 - 218.3%
Amount, mln AMD Share
in total,
%
Rank
Change

20
Bank Profiles (continued) Prometey Bank
** The capital adequacy and liquidity ratios are taken from the key prudential ratios reported by the bank as of the end of the reporting period.
* The indicators of the financial position are as of the last day of the corresponding period.
Key Financial Indicators*
Key Indicators of the Financial Position Key Indicators of the Financial Results
Key Ratios**
© 2017 KPMG Armenia cjsc. All rights reserved.
January February March
-
20,000
40,000
60,000
80,000
100,000
Assets Loan
Portfolio
Deposits Equity
As of 31.03.17 As of 31.12.16 As of 31.03.16
(500)
-
500
1,000
1,500
2,000
Total
Income
Interest
Income
NPE NPT OCI
2017 I Q 2016 I Q
1.4%
4.4%
4.8%
18.1%
32.8%
52.6%
52.4%
29.1%
36.4%
0% 10% 20% 30% 40% 50% 60%
ROA
ROE
NIM
PM
Equity/Assets
Loan Portfolio/Assets
Cost to Income Ratio
Liquidity
Capital Adequacy
2017 I Q 2016 2016 I Q
2017 Q I/
2016
Change
31.03.17/31.03.16
Assets 90,705 89,495 83,144 2.2% 15 1.4% 9.1%
Interest Earning Assets 69,271 64,673 64,165 2.2% 15 7.1% 8.0%
Loan Portfolio 47,735 46,537 39,070 1.9% 15 2.6% 22.2%
Liabilities 60,911 60,146 58,947 1.8% 15 1.3% 3.3%
Deposits 41,719 39,776 35,871 1.8% 15 4.9% 16.3%
Equity 29,793 29,350 24,197 4.5% 14 1.5% 23.1%
Charter Capital 17,950 17,950 14,400 4.4% 12 - 24.7%
Total Income 1,865 7,454 1,684 1.8% 15 - 10.8%
Interest Income 1,604 6,147 1,508 1.8% 15 - 6.3%
Net Provision Expenses 9 (546) (267) - 17 - 103%
Net Profit after Taxes 338 958 97 3.1% 10 - 249.5%
Total Comprehensive Income 361 2,003 219 2.8% 10 - 65.3%
Amount, mln AMD Share
in total,
%
Rank
Change

21
Bank Profiles (continued) Unibank
** The capital adequacy and liquidity ratios are taken from the key prudential ratios reported by the bank as of the end of the reporting period.
* The indicators of the financial position are as of the last day of the corresponding period.
Key Financial Indicators*
Key Indicators of the Financial Position Key Indicators of the Financial Results
Key Ratios**
© 2017 KPMG Armenia cjsc. All rights reserved.
January February March
A new branch has been opened
in Shengavit District, Yerevan.
2017 I Q 2016 2016 I Q
2017 Q I/
2016
Change
31.03.17/31.03.16
Assets 187,381 185,396 169,658 4.6% 11 1.1% 10.4%
Interest Earning Assets 142,448 136,395 127,805 4.5% 11 4.4% 11.5%
Loan Portfolio 117,167 118,627 114,601 4.6% 10 (1.2%) 2.2%
Liabilities 151,594 150,553 146,487 4.4% 11 0.7% 3.5%
Deposits 128,599 128,013 124,727 5.5% 9 0.5% 3.1%
Equity 35,787 34,843 23,171 5.4% 8 2.7% 54.4%
Charter Capital 20,490 19,093 14,168 5.1% 10 7.3% 44.6%
Total Income 6,068 24,090 6,007 5.7% 8 - 1.0%
Interest Income 4,570 21,330 4,772 5.1% 8 - (4.2%)
Net Provision Expenses (1,116) (4,437) (834) 9.5% 4 - 33.8%
Net Profit after Taxes 90 (443) 212 0.8% 14 - (57.4%)
Total Comprehensive Income 178 966 326 1.4% 13 - (45.3%)
Amount, mln AMD Share
in total,
%
Rank
Change
-
25,000
50,000
75,000
100,000
125,000
150,000
175,000
200,000
Assets Loan
Portfolio
Deposits Equity
As of 31.03.17 As of 31.12.16 As of 31.03.16
(2,000)
(1,000)
-
1,000
2,000
3,000
4,000
5,000
6,000
7,000
Total
Income
Interest
Income
NPE NPT OCI
2017 I Q 2016 I Q
-0.3%
-1.9%
6.3%
1.5%
19.1%
62.5%
55.7%
29.1%
18.8%
-20% 0% 20% 40% 60% 80%
ROA
ROE
NIM
PM
Equity/Assets
Loan Portfolio/Assets
Cost to Income Ratio
Liquidity
Capital Adequacy

22
Bank Profiles (continued) VTB Bank (Armenia)
** The capital adequacy and liquidity ratios are taken from the key prudential ratios reported by the bank as of the end of the reporting period.
* The indicators of the financial position are as of the last day of the corresponding period.
Key Financial Indicators*
Key Indicators of the Financial Position Key Indicators of the Financial Results
Key Ratios** Rankings
2nd
rank by the charter capital
Among the top ten banks by almost all main financial
indicators.
© 2017 KPMG Armenia cjsc. All rights reserved.
January February March
-
50,000
100,000
150,000
200,000
250,000
300,000
350,000
Assets Loan
Portfolio
Deposits Equity
As of 31.03.17 As of 31.12.16 As of 31.03.16
(4,000)
(2,000)
-
2,000
4,000
6,000
8,000
10,000
Total
Income
Interest
Income
NPE NPT OCI
2017 I Q 2016 I Q
2017 I Q 2016 2016 I Q
2017 Q I/
2016
Change
31.03.17/31.03.16
Assets 223,964 232,672 314,771 5.5% 7 (3.7%) (28.8%)
Interest Earning Assets 166,031 187,921 229,898 5.2% 7 (11.6%) (27.8%)
Loan Portfolio 136,011 146,153 176,915 5.3% 7 (6.9%) (23.1%)
Liabilities 190,309 198,761 272,743 5.6% 7 (4.3%) (30.2%)
Deposits 157,131 165,590 183,332 6.7% 5 (5.1%) (14.3%)
Equity 33,655 33,911 42,027 5.1% 10 (0.8%) (19.9%)
Charter Capital 37,776 37,776 37,776 9.3% 2 - -
Total Income 7,315 34,655 8,927 6.9% 6 - (18.1%)
Interest Income 6,464 30,424 7,814 7.3% 6 - (17.3%)
Net Provision Expenses (1,728) (12,767) (1,439) 14.8% 2 - 20.1%
Net Profit after Taxes (606) (8,513) 1 - 17 - (50,866.7%)
Total Comprehensive Income (500) (7,001) 237 - 16 - (311.4%)
Amount, mln AMD Share
in total,
%
Rank
Change
-3.4%
-24.1%
7.0%
-8.28%
15.0%
60.7%
73.7%
30.3%
14.1%
-100% -50% 0% 50% 100%
ROA
ROE
NIM
PM
Equity/Assets
Loan Portfolio/Assets
Cost to Income Ratio
Liquidity
Capital Adequacy

23
The shareholding structure of the Armenian banks is very different. There are both resident and
non-resident shareholders. Meanwhile, almost in all the Armenian banks non-resident
shareholders are presented. The non-resident participants, both legal entities and individuals, are
mainly from Russia, Switzerland, Iran, Lebanon, Liechtenstein, Cyprus, France, the United
Kingdom and the USA. There are several international organizations that have shares in several
Armenian banks (e.g. IFC, DEG and EBRD).
The shareholding structure and information on branches and the staff for each bank is presented
below*.
Anelik Bank
Shareholders (> 5%):
FISTOCO LTD. (59.68 %)
Credit Bank S.A.L. (40.32 %)
Branches: 13 (7 in Yerevan)
Staff: 358 employees
Ardshinbank
Shareholders (> 5%):
Center for Business
InvestmentsLLC (70.1 %)
"Region" Financial industrial
corporation CJSC (28.1 %)
Branches: 66 (21 in Yerevan)
Staff: 1,080 employees
Ararat Bank
Shareholders (> 5%):
Flash Ltd. (64.2%)
EBRD (25%)
Rural Impulse
Fund II S.A SICAV-SIF (10%)
Branches: 64 (32 in Yerevan)
Staff: 903 employees
Ameriabank
Shareholders (> 5%):
Ameria Group (CY) Limited (65.8%)
EBRD (20.7%)
ESPS Holding Limited (13.5%)
Branches: 13 (8 in Yerevan)
Staff: 637 employees
ACBA-Credit Agricole Bank
Shareholders (> 5%):
Credit Agricole s.A (15.6%)
Sacam International SJSC (12.4%)
Mutual Regional Village
Associations from different
marzes of RA (71%)
Branches: 57 (16 in Yerevan)
Staff: 1,328 employees
Armeconombank
Shareholders (> 5%):
Saribek Sukiasyan (31.32%)
Khachatur Sukiasyan (13.77%)
Robert Sukiasyan (14.16%)
Eduard Sukiasyan (10.64%)
EBRD (5.04%)
Branches: 47 (25 in Yerevan)
Staff: 1024 employees
Armbusinessbank
Shareholders (> 5%):
Vitaliy Sarkis Grigoryants (100%)
Branches: 50 (21 in Yerevan)
Staff: 854 employees
Appendix 1 Shareholding Structure & General Information
• The figures presented in different color, bold and italic form are those changed during the 4th
quarter of 2016.
© 2017 KPMG Armenia cjsc. All rights reserved.
ArmSwissBank
Shareholders (> 5%):
“HVS Holding” LLC (80%)
“Belegingsmachepij
Jongo” LLC (20%)
Branches: -
Staff: 110 employees
Artsakh Bank
Shareholders (> 5%):
Armenian Business Foundation
CJSC (51.72%)
Artsakh Investment Fund
(32.24%)
Hrach Gabrielyan (11.02%)
Branches: 22 (7 in Yerevan)
Staff: 514 employees

24
• The figures presented in different color, bold and italic form are those changed during the 4th
quarter of 2016.
VTB Bank Armenia
Shareholders (> 5%):
VTB OJSC (100%)
Branches: 67 (24 in Yerevan)
Staff: 1,168 employees
Mellat Bank
Shareholders (> 5%):
Bank Mellat of I.R.I (100%)
Branches: -
Staff: 51 employees
Prometey Bank
Shareholders (> 5%):
Prometey City LLC (59.9 %)
ZakNeftegazstroy
Prometey OJSC (37 %)
Branches: 11 (8 in Yerevan)
Staff: 246 employees
Unibank
Shareholders (> 5%):
Ripatonso Holdings Ltd (88.1 %)
Branches: 45 (23 in Yerevan)
Staff: 767 employees
HSBC Bank Armenia
Shareholders (> 5%):
HSBC Europe BV (70%)
Wings Establishment (30%)
Branches: 9 (9 in Yerevan)
Staff: 415 employees
Byblos Bank Armenia
Shareholders (> 5%):
Byblos Bank S.A.L. (100 %)
Branches: 2 (2 in Yerevan)
Staff: 75 employees
Inecobank
Shareholders (> 5%):
Avetis Baloyan (27.4%)
Karen Safaryan (23.7%)
EBRD (22.7%)
DEG (9.6%)
IFC (7.1%)
Branches: 23 (13 in Yerevan)
Staff: 785 employees
Converse Bank
Shareholders (> 5%):
Advanced Global Investments
LLC (80.94%)
HayPost Trust Management (14.06%)
Mother See of Holy Etchmiadzin
Catholicosate (5%)
Branches: 33 (14 in Yerevan)
Staff: 718 employees
Appendix 1 Shareholding Structure & General Information (continued)
© 2017 KPMG Armenia cjsc. All rights reserved.

25
Appendix 2 Sector InsightsAssets
As of 31 March 2017 the assets grew in almost all the banks, and only two banks suffered
decreases as compared with the same period of 2016.
The interest earning assets comprised 77.9% of the total assets of the banks. As of 31 March
2017 the interest earning assets of the banks increased by 21.3% compared with 31 March 2016.
In the meantime, the interest income increased by 9.9% as compared with the same period of the
previous year.
The net interest margin was 5.1% for the reviewed period.
As of 31 March 2017 "AmeriaBank" CJSC had the highest value of assets - about AMD 679.4
billion, which is 16.6% of the total assets of the banking sector. "Mellat Bank" CJSC had the lowest
level – AMD 42.44 billion (1% in total assets). It is worth mentioning that the top five banks (ranked
by assets) totaled 54.3% of the assets of the banking system as of 31 March 2017. Nevertheless,
the banking industry concentration is not high and is defined as unconcentrated according to the
Herfindahl-Hirschman Index, which has the value of 0.086. Compared with the same period of
2016 the HHI has increased by 0.006 points.
Loan portfolio
The top five banks (ranked by loans) recorded 59.3% of the total loan portfolio as of 31 March
2017.
The major part (87.7%) of the total sum of the outstanding loans was provided to the residents of
Armenia, from which 56.3% were companies (only 1.8% of this amount was provided to the state
owned companies), 37.1% - to the households, and only a small part to non for profit organizations
and other financial organizations (OFI). Compared with the same period of the previous year the
share of loans to households in the total amount of outstanding loans decreased by 1.3 percentage
points and the share of companies decreased by 0.3 percentage point.
As for the base currencies of the
loans, it should be noted that
households and other financial
institutions are mainly provided with
loans in AMD (63.6% and 78.9% of
the total loans provided to them
respectively) in contrast to companies
and non for profit organizations, which
prefer loans in foreign currencies (84%
and 72.2% of total loans provided to
them respectively).
Structure of loans by creditors*
© 2017 KPMG Armenia cjsc. All rights reserved.
Private sector55%
Households37%
Private sector
Households
Non for profit
OFI
State ownedcompanies
* The loans structure is presented only based on the loans provided to the residents

26
The consumer loans, loans to the industry and loans to trade sector traditionally comprise the
major part of the total loans of the banks, 21.8%, 20.8% and 16.6% respectively for the reviewed
period. The biggest growth in lending was in the loans to the industry sector (compared to the 31
March 2016, the volume of loans grew by 20.4%).
Net Provision Expenses
As of 31 March 2017 the banking system total net provision expenses decreased by 19.4% and
reached AMD 11.7 billion.
Liabilities
As of 31 March 2017 the banking system total liabilities grew by 16.4%, compared with the same
figure as of 31 March 2016, to reach AMD 3,427.7 billion, of which 68.7% are deposits.
Deposits
As of 31 March 2017 the biggest share for term deposits was held by households and the biggest
share on demand deposits was held by private sector (75% and 44.4%).
The major part of outstanding balance of the deposits was from the residents (74.7%), 72.3% of
which were term deposits. The deposits were held mainly in foreign currencies (63%).
Appendix 2 Sector Insights (continued)
Structure of loans by economy sectors
Structure of deposits
The biggest loan portfolio
belonged to “Ameriabank" CJSC –
AMD 473.7 billion, which
comprised 18.5% of the portfolio
of the banking system for the
reported period.
As of 31 March 2017 the
loans/deposits ratio was 1.09
compared with 1.13 calculated as
of 31 March 2016.
* The indicators of the deposits duration are presented only based on the deposits from the residents
© 2017 KPMG Armenia cjsc. All rights reserved.
Residents75%
Non residents
25%
Term72%
On demand*
28%
Other currency
63%
AMD37%
21%
7%
5%
3%
16%9%
22%
9%
8% Industry
Agriculture
Construction
Transport and
Communication
Trade
Service sector
Consumer loans
Mortgage
Other

27
Equity
As of 31 March 2017 the equity increased by 18.3% compared to the same period of 2016, while
for the same period the charter capital increased by 26.4%.
The total equity to total assets ratio was 16.3%, which is 0.3 percentage points higher compared
to the same ratio of 2016 (16%).
As of 31 March 2017 “Ameriabank" CJSC had the highest level of equity - about AMD 66 billion,
which is 9.9% of the total equity of the banking system. "Byblos Bank Armenia" CJSC had the
lowest level – AMD 22.2 billion (3.3% in total equity). 42% of the total equity of the banking
system belonged to the top five banks (ranked by the equity) as of 31 March 2017.
Income
The income from interest was about AMD 88.9 billion, which is about 83.9% (2016 same period
84.2%) of the total income of the banking system.
The total income of the banking system increased by 10.3% compared with the same period of
the previous year and reached AMD 106 billion in 2017 first quarter. 53.6% of total income of the
banking system belonged to the top 5 banks (ranked by the total income).
In the reporting period fourteen banks increased their income compared with the same period of
2016, while in three banks the income decreased during the same period.
Profit/loss
During the reported period fifteen banks operating in Armenia were profitable (totaled AMD 14.5
billion profit before taxes), while two banks incurred total losses before taxes of AMD 1.16 billion.
The net profit after taxes of the banking system for the period ended 31 March 2017 was AMD
10.9 billion.
As the diagram shows, the households
had the biggest share (65.2%) in the
total amount of deposits from residents
followed by the private companies which
held (20.6%) of the total deposits from
residents.
The highest level of deposits was held
by “AmeriaBank" CJSC - about AMD
360.7 billion, which comprises 15.3% of
the total deposits of the banking system
of Armenia.
As of 31 March 2017 one bank had
decrease in deposits compared to the
same date of 2016.
Appendix 2 Sector Insights (continued)
Structure of deposits*
* The deposits structure is presented only based on the deposits from the residents
© 2017 KPMG Armenia cjsc. All rights reserved.
65.2%
20.6%
5.2%7.0%
2.0% 0.0%
Households Private companies
Non for Profit Organizations OFI
State owned companies Other

28
Appendix 3Key Financial IndicatorsKey Indicators of the Financial Position as of 31.03.2017
© 2017 KPMG Armenia cjsc. All rights reserved.
AMD Million Assets
Interest
Earning
Assets
Gross
Advances to
Customers
Loans Liabilities Deposits Equity
Charter
Capital
1
"ACBA-Credit Agricole
Bank" CJSC 308,250 239,963 217,983 177,525 249,968 150,835 58,282 30,000
2 "AmeriaBank" CJSC 679,379 530,873 474,174 473,691 613,341 360,731 66,038 32,087
3 "Anelik Bank" CJSC 283,144 254,309 220,421 216,721 239,811 164,468 43,333 33,972
4 "AraratBank" OJSC 196,762 148,802 122,607 111,379 163,462 107,638 33,299 8,804
5 "Ardshinbank" CJSC 533,074 409,547 370,780 354,470 472,338 313,846 60,735 50,227
6 "ArmBusinessBank" CJSC 418,470 340,842 307,239 293,325 380,980 287,140 37,490 31,375
7 "ArmEconomBank" OJSC 153,458 108,333 91,175 79,013 125,612 75,369 27,845 4,631
8 "ArmSwissBank" CJSC 140,652 121,831 59,670 53,054 110,533 60,506 30,119 8,753
9 "ArtsakhBank" CJSC 102,648 84,790 67,112 63,184 76,853 60,417 25,795 23,261
10
"Byblos Bank Armenia"
CJSC 69,185 51,865 26,637 21,998 46,998 31,056 22,187 23,825
11 "Converse Bank" CJSC 203,281 147,716 129,107 128,199 170,224 152,745 33,057 16,417
12
"HSBC Bank Armenia"
CJSC 217,894 154,533 131,121 119,737 169,328 152,802 48,565 18,434
13 "InecoBank" CJSC 242,504 190,510 160,611 158,886 196,892 105,747 45,612 14,546
14 "Mellat Bank" CJSC 42,445 27,976 7,506 5,965 8,506 3,403 33,939 32,100
15 "Prometey Bank" LLC 90,705 69,271 58,249 47,735 60,911 41,719 29,793 17,950
16 "UniBank" OJSC 187,381 142,448 122,719 117,167 151,594 128,599 35,787 20,490
17 "VTB Bank Armenia" CJSC 223,964 166,031 142,669 136,011 190,309 157,131 33,655 37,776

29
Appendix 3Key Financial Indicators (continued)Key Indicators of the Financial Results for the period ended 31.03.2017
* Net operating income is before provisions and administrative expenses.
© 2017 KPMG Armenia cjsc. All rights reserved.
AMD Million
Total
Income
Interest
Income
Non-
Interest
Income
Net
Interest
Income
Net
Non-
Interest
Income
Net
Operating
Income*
Operating
Expenses
Net
Provision
Expenses
Net
Profit
before
taxes
Net
Profit
after
taxes
1
"ACBA-Credit
Agricole Bank"
CJSC
9,957 8,069 790 4,552 435 6,084 (3,428) (873) 1,784 1,475
2
"AmeriaBank"
CJSC 14,689 12,780 756 4,230 596 5,979 (2,821) (1,021) 2,137 1,645
3
"Anelik Bank"
CJSC 6,781 6,101 245 2,056 230 2,721 (1,074) (436) 1,211 1,007
4 "AraratBank" OJSC 5,128 4,157 304 1,848 190 2,705 (1,475) (995) 234 191
5
"Ardshinbank"
CJSC 15,055 12,253 958 3,702 693 6,239 (2,827) (1,855) 1,557 1,242
6
"ArmBusinessBank
" CJSC 9,579 8,001 626 1,716 550 3,217 (1,801) (575) 841 682
7
"ArmEconomBank"
OJSC 3,854 3,209 363 1,521 264 2,068 (1,843) (200) 25 72
8
"ArmSwissBank"
CJSC 3,282 3,077 62 1,393 39 1,575 (285) (17) 1,273 1,053
9
"ArtsakhBank"
CJSC 2,988 2,722 99 1,162 69 1,398 (790) (1,140) (532) (532)
10
"Byblos Bank
Armenia" CJSC 1,330 1,197 21 461 11 584 (240) (69) 275 275
11
"Converse Bank"
CJSC 4,908 3,912 461 1,940 324 2,798 (1,806) (490) 502 394
12
"HSBC Bank
Armenia" CJSC 4,933 3,596 940 2,432 838 3,667 (1,940) (130) 1,596 1,572
13 "InecoBank" CJSC 7,534 6,510 367 3,608 254 4,519 (1,450) (983) 2,086 1,705
14
"Mellat Bank"
CJSC 781 725 22 716 20 771 (319) (79) 373 267
15
"Prometey Bank"
LLC 1,865 1,604 104 842 6 1,005 (526) 9 488 338
16 "UniBank" OJSC 6,068 4,570 1,074 1,417 1,006 2,846 (1,587) (1,116) 144 90
17
"VTB Bank
Armenia" CJSC 7,315 6,464 558 3,653 221 4,167 (3,071) (1,728) (632) (606)

30
Appendix 3Key Financial Indicators (continued)Key Indicators of the Financial Position as of 31.12.2016
© 2017 KPMG Armenia cjsc. All rights reserved.
AMD Million Assets
Interest
Earning
Assets
Gross
Advances to
Customers
Loans Liabilities Deposits Equity
Charter
Capital
1
"ACBA-Credit Agricole
Bank" CJSC 283,272 209,639 183,075 174,983 226,677 122,572 56,595 30,000
2 "AmeriaBank" CJSC 719,363 576,313 518,072 513,219 654,966 414,609 64,398 32,087
3 "Anelik Bank" CJSC 282,453 244,052 217,585 217,037 241,331 167,523 41,122 33,972
4 "AraratBank" OJSC 149,199 106,489 79,424 66,149 116,068 62,876 33,131 8,804
5 "Ardshinbank" CJSC 548,410 406,562 363,825 358,005 476,942 297,676 71,468 17,925
6 "ArmBusinessBank" CJSC 401,669 320,320 284,459 275,927 366,618 260,121 35,051 31,375
7 "ArmEconomBank" OJSC 146,182 103,905 83,302 75,048 118,613 66,795 27,569 4,631
8 "ArmSwissBank" CJSC 130,253 107,555 46,757 46,077 101,562 50,700 28,691 8,753
9 "ArtsakhBank" CJSC 103,475 85,221 67,575 64,510 77,379 59,138 26,096 23,261
10
"Byblos Bank Armenia"
CJSC 64,190 47,740 24,308 22,156 42,313 29,341 21,878 23,825
11 "Converse Bank" CJSC 190,993 136,460 121,346 119,025 158,815 139,680 32,178 16,417
12
"HSBC Bank Armenia"
CJSC 215,161 151,526 125,829 119,590 168,154 149,833 47,007 18,434
13 "InecoBank" CJSC 236,196 186,901 162,056 160,155 192,731 110,360 43,465 14,546
14 "Mellat Bank" CJSC 41,242 28,605 7,309 5,756 7,569 2,475 33,673 32,100
15 "Prometey Bank" LLC 89,495 64,673 53,704 46,537 60,146 39,776 29,350 17,950
16 "UniBank" OJSC 185,396 136,395 121,896 118,627 150,553 128,013 34,843 19,093
17 "VTB Bank Armenia" CJSC 232,672 187,921 164,082 146,153 198,761 165,590 33,911 37,776

31
Appendix 3Key Financial Indicators (continued)Key Indicators of the Financial Results for the period ended 31.12.2016
* Net operating income is before provisions and administrative expenses.
© 2017 KPMG Armenia cjsc. All rights reserved.
AMD Million
Total
Income
Interest
Income
Non-
Interest
Income
Net
Interest
Income
Net
Non-
Interest
Income
Net
Operating
Income*
Operating
Expenses
Net
Provision
Expenses
Net
Profit
before
taxes
Net
Profit
after
taxes
1
"ACBA-Credit
Agricole Bank"
CJSC
39,259 31,618 3,248 17,674 1,608 23,674 (13,662) (7,236) 2,777 1,823
2
"AmeriaBank"
CJSC 52,406 42,624 2,866 14,875 2,256 24,047 (10,883) (5,434) 7,729 6,207
3
"Anelik Bank"
CJSC 15,439 13,210 594 4,369 366 6,371 (3,678) (1,222) 1,470 1,117
4 "AraratBank" OJSC 13,111 10,776 1,050 5,051 491 6,827 (4,181) (1,265) 1,381 1,089
5
"Ardshinbank"
CJSC 68,616 44,710 2,847 14,565 2,080 37,704 (8,959) (5,697) 23,049 22,023
6
"ArmBusinessBank
" CJSC 35,696 29,844 2,532 7,975 1,845 13,140 (7,247) (4,603) 1,291 1,053
7
"ArmEconomBank"
OJSC 14,326 11,360 1,480 5,504 1,114 8,104 (6,764) (564) 776 590
8
"ArmSwissBank"
CJSC 10,865 10,156 172 5,001 105 5,643 (1,392) (161) 4,090 3,284
9
"ArtsakhBank"
CJSC 12,363 10,864 360 4,092 268 5,499 (3,911) 866 2,454 2,880
10
"Byblos Bank
Armenia" CJSC 3,696 3,526 94 1,363 54 1,493 (969) (680) (156) (156)
11
"Converse Bank"
CJSC 17,523 13,860 2,004 7,072 1,240 9,972 (6,818) (1,645) 1,509 1,565
12
"HSBC Bank
Armenia" CJSC 23,050 17,649 3,700 12,345 3,182 17,227 (8,386) (16,887) (8,046) (6,667)
13 "InecoBank" CJSC 30,212 25,833 1,598 13,821 1,076 17,679 (6,576) (4,586) 6,517 5,158
14
"Mellat Bank"
CJSC 2,884 2,589 101 2,409 91 2,694 (1,208) (197) 1,288 1,004
15
"Prometey Bank"
LLC 7,454 6,147 334 2,926 6 3,905 (2,100) (546) 1,259 958
16 "UniBank" OJSC 24,090 21,330 1,037 8,361 747 10,832 (6,813) (4,437) (419) (443)
17
"VTB Bank
Armenia" CJSC 34,655 30,424 2,193 14,345 2,193 18,576 (14,729) (12,767) (8,920) (8,513)

32
Appendix 3Key Financial Indicators (continued)Key Indicators of the Financial Position as of 31.03.2016
© 2016 KPMG Armenia cjsc. All rights reserved.
AMD Million Assets
Interest
Earning
Assets
Gross
Advances to
Customers
Loans Liabilities Deposits Equity
Charter
Capital
1
"ACBA-Credit Agricole
Bank" CJSC 279,239 209,600 188,726 179,973 221,742 125,229 57,498 30,000
2 "AmeriaBank" CJSC 507,724 372,070 336,041 330,459 447,085 288,821 60,639 32,087
3 "Anelik Bank" CJSC 90,518 66,962 61,159 60,208 74,828 52,905 15,690 13,696
4 "AraratBank" OJSC 130,674 88,185 73,485 66,738 107,964 53,151 22,710 6,388
5 "Ardshinbank" CJSC 461,151 344,083 327,352 302,355 411,278 259,832 49,872 17,925
6 "ArmBusinessBank" CJSC 297,399 235,986 216,897 210,046 268,085 195,383 29,314 22,908
7 "ArmEconomBank" OJSC 108,180 74,897 66,167 57,223 88,497 55,624 19,684 3,167
8 "ArmSwissBank" CJSC 81,768 68,966 39,181 37,116 60,823 30,568 20,945 8,753
9 "ArtsakhBank" CJSC 96,084 77,595 67,280 63,823 84,249 53,711 11,836 11,061
10
"Byblos Bank Armenia"
CJSC 36,256 25,831 21,629 17,357 30,983 25,541 5,273 8,125
11 "Converse Bank" CJSC 153,056 106,298 95,774 87,987 130,111 107,958 22,945 7,002
12
"HSBC Bank Armenia"
CJSC 256,648 207,912 190,703 165,409 202,686 148,319 53,962 18,434
13 "InecoBank" CJSC 226,843 183,518 166,736 153,816 184,741 80,487 42,102 14,546
14 "Mellat Bank" CJSC 29,674 21,061 12,432 5,996 10,323 1,353 19,351 18,100
15 "Prometey Bank" LLC 83,144 64,165 54,005 39,070 58,947 35,871 24,197 14,400
16 "UniBank" OJSC 169,658 127,805 119,125 114,601 146,487 124,727 23,171 14,168
17 "VTB Bank Armenia" CJSC 314,771 229,898 205,590 176,915 272,743 183,332 42,027 37,776
33
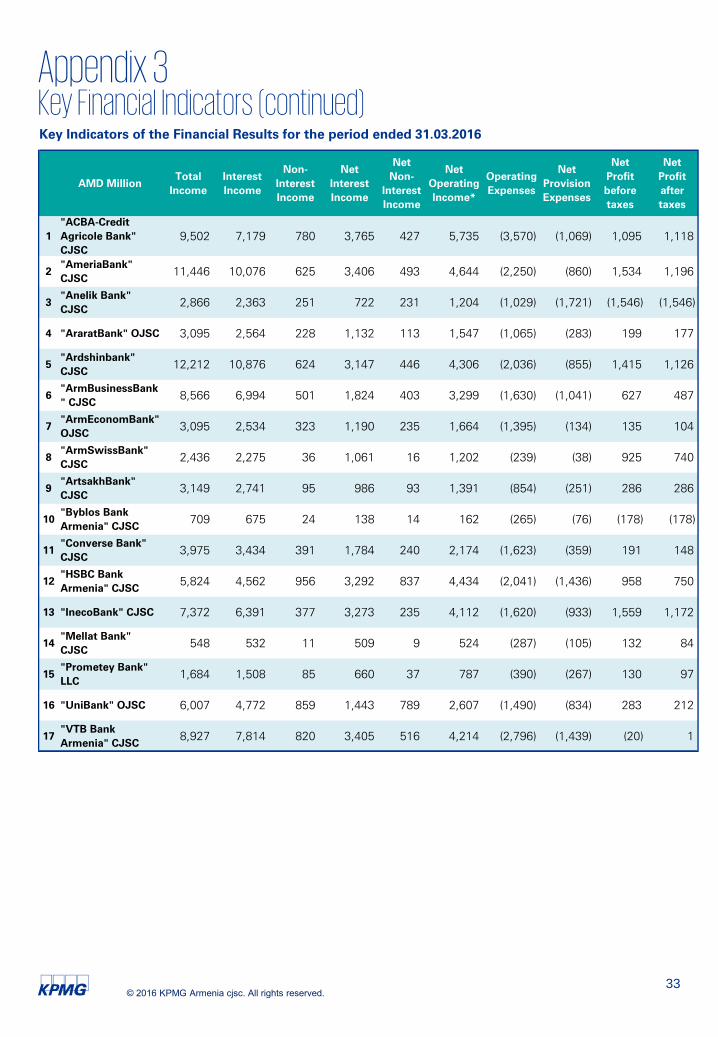
Appendix 3Key Financial Indicators (continued)Key Indicators of the Financial Results for the period ended 31.03.2016
© 2016 KPMG Armenia cjsc. All rights reserved.
AMD Million
Total
Income
Interest
Income
Non-
Interest
Income
Net
Interest
Income
Net
Non-
Interest
Income
Net
Operating
Income*
Operating
Expenses
Net
Provision
Expenses
Net
Profit
before
taxes
Net
Profit
after
taxes
1
"ACBA-Credit
Agricole Bank"
CJSC
9,502 7,179 780 3,765 427 5,735 (3,570) (1,069) 1,095 1,118
2
"AmeriaBank"
CJSC 11,446 10,076 625 3,406 493 4,644 (2,250) (860) 1,534 1,196
3
"Anelik Bank"
CJSC 2,866 2,363 251 722 231 1,204 (1,029) (1,721) (1,546) (1,546)
4 "AraratBank" OJSC 3,095 2,564 228 1,132 113 1,547 (1,065) (283) 199 177
5
"Ardshinbank"
CJSC 12,212 10,876 624 3,147 446 4,306 (2,036) (855) 1,415 1,126
6
"ArmBusinessBank
" CJSC 8,566 6,994 501 1,824 403 3,299 (1,630) (1,041) 627 487
7
"ArmEconomBank"
OJSC 3,095 2,534 323 1,190 235 1,664 (1,395) (134) 135 104
8
"ArmSwissBank"
CJSC 2,436 2,275 36 1,061 16 1,202 (239) (38) 925 740
9
"ArtsakhBank"
CJSC 3,149 2,741 95 986 93 1,391 (854) (251) 286 286
10
"Byblos Bank
Armenia" CJSC 709 675 24 138 14 162 (265) (76) (178) (178)
11
"Converse Bank"
CJSC 3,975 3,434 391 1,784 240 2,174 (1,623) (359) 191 148
12
"HSBC Bank
Armenia" CJSC 5,824 4,562 956 3,292 837 4,434 (2,041) (1,436) 958 750
13 "InecoBank" CJSC 7,372 6,391 377 3,273 235 4,112 (1,620) (933) 1,559 1,172
14
"Mellat Bank"
CJSC 548 532 11 509 9 524 (287) (105) 132 84
15
"Prometey Bank"
LLC 1,684 1,508 85 660 37 787 (390) (267) 130 97
16 "UniBank" OJSC 6,007 4,772 859 1,443 789 2,607 (1,490) (834) 283 212
17
"VTB Bank
Armenia" CJSC 8,927 7,814 820 3,405 516 4,214 (2,796) (1,439) (20) 1

34
Appendix 4Bank Contact Details
ACBA-Credit Agricole Bank
Director: Hakob Andreasyan
Address: 82-84 Arami str.,
Yerevan
Tel./Fax: (+37410) 318888
543485
TELEX: -
E-mail: [email protected]
Website: acba.am
SWIFT: AGCAAM22
Anelik Bank
Director: Nerses Karamanukyan
Address: 13 Vardanants str.,
Yerevan, RA
Tel./Fax: (+37410) 593333,
593310
TELEX: ANELSU
E-mail: [email protected]
Website: anelik.am
SWIFT: ANIKAM22
Ameria bank
Director: Artak Hanesyan
Address: 9 Grigor Lusavorchi str.,
Yerevan, RA
Tel./Fax: (+37410) 561111,
513133
TELEX: -
E-mail: [email protected]
Website: ameriabank.am
SWIFT: ARMIAM22
Ararat Bank
Director: Ashot Osipyan
Address: 19 Pushkin str.,
Yerevan, RA
Tel./Fax: (+37410) 592323,
547894
TELEX: -
E-mail:
Website: araratbank.am
SWIFT: ARMCAM22
Ardshinbank
Director: Mher Grigoryan
Address: 13 G. Lusavorchi str.,
Yerevan, RA
Tel./Fax: (+37412) 222222,
59 05 82
TELEX: 243-286 LALA AM
E-mail: [email protected]
Website: www.ardshinbank.am
SWIFT: ASHBAM22
Armbusinessbank
Director: Arsen Mikaelyan
Address: 48 Nalbandyan str.
Yerevan, RA
Tel./Fax: (+37460) 372500,
(+37410) 592020, 592064
TELEX: 243134
E-mail:
Website: armbusinessbank.am
SWIFT: ARMNAM 22
Armeconombank
Director: Aramayis Galstyan
Address: 23/1 Amiryan str.,
Yerevan, RA
Tel./Fax: (+37410) 510910,
538904
TELEX: 243274 MOZG AM
E-mail: [email protected]
Website: aeb.am
SWIFT: ARECAM22
ArmSwissBank
Director: George Machanyan
Address: 10 Vazgen Sargsyan
str., Yerevan, RA
Tel./Fax: (+37460) 757000,
529591
TELEX: -
E-mail: [email protected]
Website: аrmswissbank.am
SWIFT: ARSGAM22
Artsakh Bank
Director: Artur Mkhitaryan
Address: 1b Charents str.,
Yerevan, RA; 25 Knunyancneri,
Stepanakert, NKR
Tel./Fax: (+37460)747769,
+(37460)747739,
+(37447)943412, +(37447)971542
TELEX: (684) 243 385 BANK AM
E-mail: [email protected]
Website: artsakhbank.com
SWIFT: ARTSAM22
Byblos Bank Armenia
Acting Director : Hayk Stepanyan
Address: 18/3 Amiryan str.,
Yerevan, RA
Tel./Fax: (+37410) 530362,
535296
TELEX: -
E-mail: [email protected]
Website: byblosbankarmenia.am
SWIFT: BYBAAM22
© 2017 KPMG Armenia cjsc. All rights reserved.
Converse Bank
Director: Artur Hakobyan
Address: 26/1V. Sargisyan str.,
Yerevan, RA
Tel./Fax: (+37410) 511200,
511211, 511212
TELEX: 243139 PBCON RU,
111 780 HOR RU
E-mail: [email protected]
Website: conversebank.am
SWIFT: COVBAM22
HSBC Bank Armenia
Director: Paul Edgar
Address: 66 Teryan str.,
Yerevan, RA
Tel./Fax: (+37410) 655000,
655001
TELEX: 515000
E-mail: [email protected]
Website: hsbc.am
SWIFT: MIDLAM22

35
Appendix 4Bank Contact Details (continued)
Inecobank
Director: Garnik Tadevosyan
Address: 17 Tumanyan str.,
Yerevan, RA
Tel./Fax: (+37410) 510510,
510573
TELEX: -
E-mail: [email protected]
Website: inecobank.am
SWIFT: INJSAM22
VTB Bank Armenia
Director: Yuri Gusev
Address: 46 Nalbandyan str.,
Yerevan, RA
Tel./Fax: (+3748000) 8787,
(+37410) 565578
TELEX: -
E-mail: [email protected]
Website: vtb.am
SWIFT: ARMJAM22
Prometey Bank
Director: Emil Soghomonyan
Address: 44/2 Hanrapetutian str.,
Yerevan, RA
Tel./Fax: (+37410) 562036,
521705, 545719
TELEX: -
E-mail: [email protected]
Website: prometeybank.am
SWIFT: PRMLAM22
Unibank
Director: Vardan Atayan
Address: 12/53 Charents str.,
Yerevan, RA
Tel./Fax: (+37410) 592259,
555140
TELEX: 243313 UNI AM
E-mail: [email protected]
Website: unibank.am
SWIFT: UNIJAM22
Mellat Bank
Acting Director: Seied
Gholamreza Mousavi
Address: 5a Tumanyan str.,
Yerevan, RA
Tel./Fax: (+37460) 388888
(+37410) 540885
TELEX: 581523
E-mail: [email protected]
Website: mellatbank.am
SWIFT: BKMTAM22
© 2017 KPMG Armenia cjsc. All rights reserved.

36
KPMG Experience in the Armenian Banking SectorAudit Tax
Advisory
Client name Service description
HSBC Bank Armenia Staff landing
Anelik Bank CJSC KPMG in Armenia provided IT Advisory services to the bank.
Inecobank CJSC KPMG in Armenia assisted the Bank in HR Advisory Services.
Undisclosed Bank
KPMG in Armenia performed Bank’s Top management
remuneration and bonus competitiveness survey
Undisclosed Bank
KPMG in Armenia performed Bank’s all staff remuneration and
bonus competitiveness survey
Converse Bank CJSC
KPMG in Armenia assisted Converse Bank cjsc in developing a
marketing plan for attracting corporate customers.
Armimpexbank CJSC
KPMG in Armenia assisted the Bank in the development and
implementation of “a one window” system.
Byblos Bank Armenia CJSC
KPMG in Armenia assisted the Bank in obtaining necessary
information about the commercial and retail lending market of
Armenia.
Ardshinbank CJSC
KPMG in Armenia assisted the Bank in the development and
implementation of “a one window” system.
International Undisclosed Bank
KPMG in Armenia assisted in the pre-investment due-diligence
to International Bank in its acquisition of an Armenian bank.
Current clients
Anelik Bank CJSC
Ardshinbank CJSC
Byblos Bank Armenia CJSC
InecoBank CJSC
PanArmenian Bank OJSC
Current clients
VTB - Armenia Bank CJSC
HSBC Bank Armenia
© 2017 KPMG Armenia cjsc. All rights reserved.

37
Abbreviations
AMD Armenian Dram
BSTDB Black Sea Trade and Development Bank
CBA Central Bank of Armenia
CJSC Closed Joint Stock Company
DEG Deutsche Investitions und Entwicklungsgesellschaft
EBRD European Bank for Reconstruction and Development
GDP Gross Domestic Product
HHI Herfindahl-Hirschman Index
IFC International Finance Corporation
LLC Limited Liability Company
NfPO Non for Profit Organizations
NIM Net Interest Margin
NPE Net Provision Expenses
NPT Net Profit after Taxes
OCI Other Comprehensive Income
OeEB Development Bank of Austria
OFI Other Financial Institutions
OJSC Open Joint Stock Company
OPEC Organization of the Petroleum Exporting Countries
PM Profit Margin
RA Republic of Armenia
ROA Return on Assets
ROE Return on Equity
SME Small and Medium Entrepreneurship
© 2017 KPMG Armenia cjsc. All rights reserved.

38
Herfindahl-Hirschman Index
Calculated by squaring the market share of each firm
competing in the market and then summing the
resulting numbers. Index below 0.1 indicates an
unconcentrated index; index between 0.1 and 0.18
indicates moderate concentration; index above 0.18
indicates high concentration.
Equity to assets
Calculated as the total equity divided by the total
assets.
Liquidity
Prudential ratio N12 (High liquid assets/Total assets)
calculated and reported by each bank as of the
reporting date according to the corresponding
regulation of the CBA.
Capital adequacy
Prudential ratio N1 (Total capital/ risk weighted
assets) calculated and reported by each bank as of
the reporting date according to the corresponding
regulation of the CBA.
Net interest margin
Calculated as the net interest income generated
during the last 12 months ended by the reporting
date divided by the average interest earning assets
for the mentioned 12 months.
Profit margin
Calculated as the net profit generated during the
reported period divided by the total income for the
same period.
Return on Assets
Calculated as the net profit generated during the last
12 months ended by the reporting date divided by the
total average assets for the mentioned 12 months.
Return on Equity
Calculated as the net profit generated during the last
12 months ended by the reporting date divided by the
average total equity for the mentioned 12 months.
Glossary
© 2017 KPMG Armenia cjsc. All rights reserved.
Tigran Gasparyan
Managing Partner
KPMG in Armenia
Tel: +374 56 67 62
Zaruhi Furunjyan
Head of Advisory, Senior Manager
KPMG in Armenia
Tel: +374 56 67 62
Contacts
The contacts at KPMG in connection
with this report are:
The information contained herein is of a general nature and is not intended to
address the circumstances of any particular individual or entity. Although we
endeavor to provide accurate and timely information, there can be no guarantee
that such information is accurate as of the date it is received or that it will
continue to be accurate in the future. No one should act on such information
without appropriate professional advice after a thorough examination of the
particular situation
© 2017 KPMG Armenia cjsc, a company incorporated under the Laws of the
Republic of Armenia, a member firm of the KPMG network of independent
member firms affiliated with KPMG International Cooperative (“KPMG
International”), a Swiss entity. All rights reserved.
The KPMG name and logo are registered trademarks or trademarks of KPMG
International.