
Arkansas State Police Retirement System · The Arkansas State Police Retirement System (ASPRS or...
102
Arkansas State Police Retirement System Annual Financial Report For June 30, 2019
Transcript of Arkansas State Police Retirement System · The Arkansas State Police Retirement System (ASPRS or...

Arkansas State Police Retirement System
Annual Financial ReportFor June 30, 2019

A Pension Trust Fund of the State of Arkansas
Prepared byArkansas Public Employees Retirement System
124 West Capitol Avenue, Suite 400Little Rock, AR 72201
Duncan Baird, Executive SecretaryColonel Bill Bryant, Director of State Police
Annual Financial ReportFor the fiscal year ended June 30, 2019
Arkansas State Police Retirement System

Table of Contents
INTRODUCTIONA Brief History of ASPRS 7System Highlights 8Troop Headquarters 9Letter of Transmittal 10Board of Trustees 13ASPRS Senior Staff 14Professional Service Providers 15
FINANCIAL SECTIONManagement’s Discussion and Analysis 19Statement of Fiduciary Net Position 25Statement of Changes in Fiduciary Net Position 26Notes to the Financial Statements 27
Note 1: Plan Description 27Note 2: Summary of Significant Accounting Policies 30Note 3: Deposits and Investments 31Note 4: Legally Required Reserves 52Note 5: Net Pension Liability 53Note 6: Deferred Retirement Option Plan 56
Required Supplementary Information 56Schedule of Funding Progress 56Schedule of Employer Contributions 57Schedule of Changes in Net Pension Liability and Related Ratios 58Schedule of Net Pension Liability 60Schedule of Investment Returns 60
Notes to Required Supplementary Information 61Schedule of Administrative Expenses 61Schedule of Investment Expenses 61Payments for Professional Consultants 61
INVESTMENTS SECTIONChief Investment Officer’s Report 65Investment Policy Summary 72Asset Allocation 73Schedule of Manager Distribution 76Portfolio Characteristics 77Schedule of Comparative Investment Results by Year 78Schedule of Comparative Annualized Investment Results 79Ten Largest Holdings 80Schedule of Brokerage Commissions 81Schedule of Investment Fees 82

Table of Contents
ACTUARIAL SECTIONActuary’s Certificate Letter 85Summary of Actuarial Assumptions 87Supplementary Information 89Single Life Retirement Values 90Separations from Active Employment Before Age and Service Retirement 91Probabilities of Retirement for Members Eligible to Retire 92Active Members in Actuarial Valuation 93Tier One and Tier Two Participants 94Short Condition Test 95Derivation of Experience Gain/(Loss) 97Analysis of Experience - Gains/(Losses) by Risk Area 98
STATISTICAL SECTIONSchedule of Revenues By Source 101Schedule of Expenses by Type 102Schedule of Benefit Expenses by Type 103Schedule of Retired Members by Type of Benefit 104Statistical Graphs 105

A Brief History of ASPRS
System Highlights
Troop Headquarters
Letter of Transmittal
Board of Trustees
ASPRS Senior Staff
Professional Service Providers
INTRODUCTION

This page intentionally left blank

Introduction
7
Arkansas State Police Retirement System Annual Financial Report 2019
With the passage of Act 311 on March 19, 1951, the Arkansas General Assembly created the State Police Retirement System (ASPRS or the System). This System provides for the retirement of police officer employees of the Department of Arkansas State Police.
In the beginning, all ASPRS members participated in a contributory plan whereby employers and employees made contributions to the System. However, in 1977, Act 793 was signed by then Governor David Pryor. This legislation offered a choice to employees who were currently under the contributory plan. They could remain under the contributory plan or change over to the new non-contributory plan in which only employers make contributions to the System. This choice was offered to employees who were ASPRS members at some previous time and returned to work for the System on or after January 1, 1978; however, anyone joining the System on or after, January 1, 1978 who was not previously an ASPRS member is automatically covered under the new non-contributory plan.
Act 1071 of 1997 created the Tier Two Benefit Plan for the State Police Retirement System (Tier II) for all officers hired on or after April 3, 1997. Members of the plan in effect before April 3, 1997 (Tier I) had one year from April 3, 1997 to elect participation in Tier II.
Act 1242 of 2009 merged the investable assets of ASPRS with those of the Arkansas Public Employees Retirement System (APERS). All authority over investment of the merged assets was granted to the Board of Trustees of the Arkansas Public Employees Retirement System (APERS Board). Investment schedules contained herein reflect the market values accruing to each system.
This annual financial report, which covers the period from July 1, 2018 through June 30, 2019, provides comprehensive information about the System including a description of the retirement plan; investment policies and objectives; financial statements; an actuarial report; and historical and statistical information on active members, annuitants, and benefit payments.
A BRIEF HISTORY OF ASPRS

Introduction Arkansas State Police Retirement System Annual Financial Report 2019
8
SYSTEM HIGHLIGHTS(as of June 30, 2019)
Tier I Tier II
Number 31 Number 442
Average Age (yrs.) 50.2 Average Age (yrs.) 38.5
Average Service (yrs.) 22.8 Average Service (yrs.) 9.8
Average Annual Salary $73,823 Average Annual Salary $53,612
Active Members (Excludes DROP participants)
Inactive Vested Members
Number 102
Age and Service Disability
Retired Members 34 1
Average Age (yrs.) 54.56 48
Average Credited Service (yrs.) 23 14
Average Monthly Benefit $4,291 $ 1,963
2019 Retirees (Includes DROP participants)
Total Retirees(Including DROP Participants, Disability
Recipients, & Death-In-Service Beneficiaries)
Retired Members 735
Average Monthly Benefit $3,260

Introduction
9
Arkansas State Police Retirement System Annual Financial Report 2019
Troop “A” 501-618-82821 State Police Plaza Drive - Little Rock, AR 72209Captain Mike Hagar - Commander
Troop “B” 870-523-27012000 Fairgrounds Rd - Newport, AR 72112Captain Todd Shaw - Commander
Troop “C” 870-935-73022216 Browns Lane Access Rd - Jonesboro, AR 72403Captain John Carter - Commander
Troop “D” 870-633-14543205 North Washington - Forrest City, AR 72335Captain David Moore - Commander
Troop “E” 870-247-14836816 Princeton Pike - Pine Bluff, AR 71602Captain Randall Dias - Commander
Troop “F” 870-226-37131237 North Myrtle - Warren, AR 71671Captain Scott Woodward - Commander
Troop “G” 870-777-46412501 North Hazel - Hope, AR 71801Captain Brady Gore - Commander
Troop “H” 479-783-51955728 Kelly Highway - Fort Smith, AR 72914(vacant) - Commander
Troop “I” 870-741-34555196 US 65 South - Harrison, AR 72601Captain Wesley Smithee - Commander
Troop “J” 479-754-30962700 West Main - Clarksville, AR 72830Captain Kyle Drown - Commander
Troop “K” 501-767-8550200 Karen Street - Hot Springs, AR 71901Captain Ron Casey - Commander
Troop “L” 479-751-66631120 W Monroe Ave - Lowell, AR 72745Captain David Cooper - Commander
TROOP HEADQUARTERS

Introduction Arkansas State Police Retirement System Annual Financial Report 2019
10
LETTER OF TRANSMITTAL
Dear ASPRS Members:
The Arkansas State Police Retirement System (ASPRS or the System) is pleased to present the Annual Financial Report for the period ending June 30, 2019. The report is designed to provide a clear and concise picture of the financial conditions of the System. The report includes the following six sections:
• The Introduction contains the administrative organization, a letter of transmittal, and the chairman’s report;
• The Financial Section contains the financial statements and required supplementary information;
• The Investments Section contains a report on investment activity, investment policies, investment results, and various investment schedules;
• The Actuarial Section contains the actuary’s certification letter and the results of the annual actuarial valuation;
• The Statistical Section includes significant trend data pertaining to the System;
• The Appendix contains combined ASPRS and APERS financial statements.
Accounting SystemThe accrual basis of accounting is used to record the assets, liabilities, revenues, and expenses of the ASPRS trust fund. Revenues are recognized in the accounting period in which they are earned, without regard to date of collection, and expenses are recorded when incurred, regardless of when payment is made. Investments are reported at market values determined by the custodial agent. The agent’s determination of market value includes, among other things, using pricing services or prices quoted by independent brokers at current exchange rates.
RevenuesThe fiscal year 2019 revenue from employer contributions totaled $6.7 million. This amount is $212,346 more than the amount received in fiscal year 2018. Court fees and driver’s license reinstatement fees for the fiscal year were $1.86 million, a decrease of $716,565 from fiscal year 2018. In 2019, motor vehicle title fees totaling $4.6 million were collected in accordance with Act 718 of 2011.
In addition to the funding provided in previous years, Act 1071 of 1997 provided for a transfer from insurance premium taxes to the State Police Retirement Fund. This transfer is equal to the difference between the actuarially computed contribution rate minus other funding sources

Introduction
11
Arkansas State Police Retirement System Annual Financial Report 2019
(employer contributions and driver’s license reinstatement fees). The fund received $8.04 million from the insurance premium tax transfer during fiscal year 2019 and $7.11 million in fiscal year 2018.
The System earned net investment income of $17.03 million in fiscal year 2019 after expenses of just over $2.1 million, a decrease of $11.8 million from fiscal year 2018. Overall, the System’s revenues decreased $11.54 million over fiscal year 2018 due primarily to slightly lower investment returns.
ExpensesBenefit payments for fiscal year 2019 were $24.93 million, which is $744,855 more than fiscal year 2018. Administrative expenses were $554,441, of which $65,500 was for professional fees, $320,497 for bad debt expenses, and $160,687 was transferred to APERS for indirect administrative costs.
FundingThe System is funded through contributions from the state and from investment income. The general financial objective of the System is to establish and receive contributions which, expressed as a percent of active member payroll, will remain approximately level from generation to generation.
InvestmentsAct 1242 of 2009 effectively merged the ASPRS investment program with that of APERS and granted the APERS Board all investment authority. In accordance with the Investment Code contained in the Arkansas Code Annotated, the APERS Board has established a policy which requires that the funds be invested in conformity with the “prudent investor rule.” The Investment Code permits the fund to establish an investment policy based upon certain investment criteria and allows for delegation of investment authority to professional investment managers. The statement of investment policy outlines the responsibility for the investment of the fund and reflects the degree of risk that is deemed appropriate for the fund. Investment managers are to execute the investment policy in accordance with statutory authority and the policies and respective guidelines of the APERS Board, but they are free to use full discretion within those policies and guidelines. Compliance by the current investment managers is monitored on a continuing basis by the investment consulting firm Callan Associates Inc. and APERS staff. The investment managers retained by the APERS Board are listed on page 15 of this report.
Professional ServicesProfessional services are provided to ASPRS by firms selected by the APERS Board to aid in the efficient and effective management of the System. A list of firms retained during the year can be found on page 15 of this report.

Introduction Arkansas State Police Retirement System Annual Financial Report 2019
12
Lt. Brant Tosh Duncan Baird
AcknowledgmentsThis report is the result of the combined efforts of the APERS staff under the direction of the Board of Trustees of the State Police Retirement System. Its purpose is to provide complete and reliable information as a basis for making management decisions, as a means for determining compliance with legal provisions, and as a means for determining responsible stewardship over the assets contributed by the members and employers.
Respectfully,

Introduction
13
Arkansas State Police Retirement System Annual Financial Report 2019
Lt. Brant Tosh, Chair - Jonesboro, AR, Active Tier II memberExpiration of Term: July 1, 2020
Mr. Carl “Ned” Hendrix, Vice-Chair - Winthrop, AR, Citizen-At-LargeExpiration of Term: July 1, 2019
Capt. William “Randall” Dias - Pine Bluff, AR, Active Tier I memberExpiration of Term: July 1, 2020
Mr. Donnie Underwood - Marion, AR, Citizen-At-LargeExpiration of Term: July 1, 2021
Commissioner Bob Burns - Little Rock, AR, Arkansas State Police Commissioner Expiration of Term: July 1, 2024
Mr. Phillip Milligan. Ft. Smith, AR, Citizen-At-LargeExpiration of Term: July 1, 2025
Dr. John Shelnutt - Little Rock, AR - Chief Fiscal Officer of St ate or De signee Expiration of Term: Ex-Officio Member
BOARD OF TRUSTEES

Introduction Arkansas State Police Retirement System Annual Financial Report 2019
14
ASPRS SENIOR STAFF
Duncan BairdExecutive Director
Jason WillettChief Financial Officer
Carlos BorromeoChief Investment Officer
Laura GilsonChief Legal Counsel
Allison WoodsDirector of Benefits Administration
Phillip NortonDirector of Information Technology
Abbi BrunoDirector of Operations
Jacobia TwiggsManager, Educational Outreach
Jennifer TaylorManager, Member and Retiree Services Section
Jon AucoinManager, Communications Section
John OwensInternal Auditor
Usha DoolabhAccounting Operations Manager, Investments

Management’s Discussion and Analysis
Statement of Fiduciary Net Position
Statement of Changes in Fiduciary Net Position
Notes to the Financial Statements Note 1: Plan Description Note 2: Significant Accounting Policies Note 3: Deposits and Investments Note 4: Legally Required Reserves Note 5: Net Pension Liability Note 6: Deferred Retirement Option Plan
Required Supplementary Information Schedule of Funding Progress Schedule of Employer Contributions Schedule of Changes in Net Pension Liability Schedule of Net Pension Liability Schedule of Investment Returns
Notes to Required Supplementary Information Schedule of Administrative Expenses Schedule of Investment Expenses Payments for Professional Consultants
FINANCIAL

This page intentionally left blank

Financial
19
Arkansas State Police Retirement System Annual Financial Report 2019
MANAGEMENT’S DISCUSSION AND ANALYSIS
To help facilitate a better understanding of the financial condition of the Arkansas State Police Retirement System (ASPRS or the System) as of June 30, 2019, the results of its operation for the fiscal year ended, and the fiscal policies that govern its significant business operations, management has prepared this narrative analysis. The narrative is intended to supplement the System’s financial statements and, as such, should be read in conjunction with these statements, which are presented beginning on page 25 and page 26.
Act 1242 of 2009 effectively merged the ASPRS investment program with that of the Arkansas Public Employees Retirement System (APERS) and granted the Board of Trustees of the Arkansas Public Employees Retirement System (APERS Board) all investment authority. The figures referred to in this section are ASPRS figures unless specifically stated otherwise.
Overview of the Financial StatementsThis overview is intended to serve as an introduction to the System’s financial reporting. Collectively, all the information contained in the Financial Section of this annual report presents the net assets held in trust for pension benefits as of June 30, 2019.
The basic financial statements contained in the Financial Section of the annual report consist of the following:
The Statement of Fiduciary Net Position (page 25) reports the pension trust fund’s assets, liabilities, and resulting net position such that assets – liabilities = net position at the end of the fiscal year. It is a snapshot of the financial position of the pension trust fund at that specific time. Below is a summary of the statement that includes total assets, total liabilities, and resulting net position for fiscal years 2018 and 2019:
Summary of Fiduciary Net Position
2019 2018
Assets
Cash and Cash Equivalents $ 16,179,690 $ $15,537,298
Receivables 3,195,988 3,336,641
Investments 321,588,439 309,912,126
Securities Lending Collateral 37,425,857 35,616,267
Total Assets $ 378,389,973 $ 364,402,333
Liabilities
Other Liabilities $ 542,498 $ 532,415
Investment Principal Payable 2,638,268 3,263,410
Securities Lending Collateral 37,470,194 35,668,257
Total Liabilities 40,650,961 39,464,082
Net Position Restricted For Pension Benefits $ 337,739,012 $ 324,938,251
Totals may not add due to rounding.

Financial Arkansas State Police Retirement System Annual Financial Report 2019
20
The Statement of Changes in Fiduciary Net PositionThe Statement of Changes in Fiduciary Net Position (see page 26) reports the pension trust fund’s financial transactions that have occurred during the fiscal year such that additions – deductions = net change in net position. It supports the change that has occurred to the prior year’s net position value on the Statement of Fiduciary Net Position. Below is a summary of the statement that indicates the financial transactions of the trust fund for fiscal years 2018 and 2019:
Summary of Changes in Fiduciary Net Position
2019 2018
Additions
Employer Contributions $ 6,727,409 $ 6,515,063
Member Contributions 27,515 133,860
Supplemental 8,035,962 7,109,703
Court 849,578 974,516
Driver's License Reinstatement Fees 1,014,554 1,606,181
Motor Vehicle Title Fees 4,598,976 4,664,316
Net Investment Income 17,031,466 28,823,333
Other Additions 17 11
Total Additions 38,285,476 49,826,983
Deductions
Benefits 24,930,274 24,185,419
Administrative Expenses 554,441 228,430
Total Deductions 25,484,715 24,413,849
Net Increase / (Decrease) 12,800,761 25,413,134
Net Position
Beginning of Year 324,938,251 299,525,117
End of Year $ 337,739,012 $ 324,938,251
Totals may not add due to rounding.

Financial
21
Arkansas State Police Retirement System Annual Financial Report 2019
Additions to Fiduciary Net PositionThe reserves needed to finance retirement benefits are accumulated through the collection of employer and employee contributions and through earnings on investments. Accumulations for fiscal year 2019 totaled approximately $38.3 million (see the following table):
Operating Additions 2019 2018
Employer Contributions $ 6,727,409 $ 6,515,063
Member Contributions 27,515 133,860
Supplemental Contributions 8,035,962 7,109,703
Court Fees 849,578 974,516
Driver's License Reinstatement Fees 1,014,554 1,606,181
Motor Vehicle Title Fees 4,598,976 4,664,316
Net Investment Income 17,031,466 28,823,333
Miscellaneous Additions 17 11
Total $ 38,285,476 $ 49,826,983
The overall decrease in additions was approximately $11.5 million when compared to fiscal year 2018 and was due to lower investment returns. The Investments Section of this report reviews investment activity and the results of the investment portfolio for fiscal year 2019.
Deductions to Fiduciary Net PositionThe primary deductions from the System include the payment of benefits to members and beneficiaries, the refund of contributions to former members, and the cost of administering the System. Deductions for fiscal year 2019 totaled approximately $25.5 million (see the following table):
Operating Deductions 2019 2018
Benefit Payments $ 24,930,274 $ 24,185,419
Administrative Expenses 554,441 228,430
Total $ 25,484,715 $ 24,413,849
Totals may not add due to rounding.

Financial Arkansas State Police Retirement System Annual Financial Report 2019
22
The Notes to the Financial StatementsThe Notes to the Financial Statements are provided to help explain in narrative form some of the more complex or less obvious elements of the statements. Further, the Notes to the Financial Statements provide additional information that is essential for a comprehensive understanding of the System’s financial condition and the results of its operations.
• Note 1 provides a general description of the System, including information regarding membership and employers.
• Note 2 summarizes significant accounting policies, including the basis of accounting, management’s use of estimates, and other accounting policies.
• Note 3 describes deposits, discloses investment risks, and addresses securities lending as well as derivative instruments.
• Note 4 provides information regarding legally required reserves.
• Note 5 provides information regarding the System’s net pension liability.
• Note 6 describes the System’s Deferred Retirement Option Plan.
The required supplementary information provides additional detail and historical information considered to be useful in evaluating the condition of the plan administered by APERS. The System provides certain required schedules and related note disclosures that collectively demonstrate the System’s annual progress toward funding its actuarial accrued liability and disclose the annual employer contributions required and the percentage contributed.
The other supplementary schedules summarize the major categories of administrative and investment expenses and detail the amounts paid to professional consultants.
FundingThe System’s overall funding objective is to accumulate sufficient assets over time to meet its long term benefit obligations as they become due. Accordingly, collecting employer and member contributions and earning an adequate long term rate of return on its investments are essential components of the System’s plan for accumulating the funds needed to finance future retirement benefits.
ASPRS overall pension fund net position increased during the fiscal year ended June 30, 2019 by $12.8 million. This increase can be attributed to an increase in the value of investments and their associated income.

Financial
23
Arkansas State Police Retirement System Annual Financial Report 2019
System Investments as of June 30, 2019*The investments of the pension trust fund generated a 5.78% return for the fiscal year, which is lower than the prior year’s return of 10.25%. The 5.78% return placed APERS/ASPRS in the 64th percentile when compared with a median return of 6.19% for large public plans. Investment results over time are compared with the System’s benchmarks in the schedule of comparative investment results located in the Investments Section of this annual report. Below is a summary of the performance of the System’s assets by class:
• Domestic Equity - The System had $3.617 billion in U.S. domestic equity securities, which is approximately a 1.37% increase from fiscal year 2018. Domestic equity posted a return of 8.12% for the fiscal year. The Russell 3000 Index posted a return of 8.98%.
• International Equity - The System had $2.204 billion in international equity securities which is approximately a 0.97% increase from fiscal year 2018. International equity posted a return of 1.98% for the fiscal year. The MSCI EAFE Index posted a return of positive 1.08%.
• Fixed Income - The System had $1.454 billion in fixed income securities, which is approximately an 8.37% increase from fiscal year 2018. Fixed income posted a return of 8.57% for the fiscal year. The Barclays Aggregate Index posted a return of 7.87%.
• Diversified Strategies - The System had $453 million in diversified strategies, which is approximately a 9.54% increase from fiscal year 2018. Diversified strategies posted a return of 10.2% for the fiscal year.
• Real Assets - The System had $1.335 billion in real assets, which is approximately a 2.28% decrease from fiscal year 2018. Real assets posted a return of 1.72% for the fiscal year. CPIU+4% posted a return of 5.65%.
*Figures are APERS and ASPRS combined.

Financial Arkansas State Police Retirement System Annual Financial Report 2019
24
Securities LendingThe System earns additional investment income by lending investment securities to broker-dealers. This is done by the custodian bank, Bank of New York Mellon (BNYM). The broker-dealers provide collateral to BNYM and generally use the borrowed securities to cover short sales and failed trades for their clients. BNYM invests cash collateral to earn interest. For the fiscal year 2019, securities lending income to the System amounted to $3.863 million.
Actuarial Valuations and Funding ProgressThe actuarial accrued liability and actuarial value of assets of the System as of June 30, 2019, amounted to $454.62 million and $335.97 million respectively.
As of June 30, 2019, the System experienced an increase in its funded status from 73% to 74% on a market value basis. On a funding basis, the System experienced an increase in its funded status from 72% to 74%.
Requests for InformationThis annual report is designed to provide a general overview of the finances of the System. Questions concerning any of the information provided in this report or requests for additional information should be addressed to the Arkansas Public Employees Retirement System, 124 W. Capitol, Suite 400, Little Rock, AR 72201.

25
(as of June 30, 2019)
Totals may not add due to rounding. The schedule of funding progress is on page 56.
2019 2018ASSETS
Cash and Cash Equivalents $ 16,179,690 $ 15,537,298
ReceivablesContributions 0 0 Investment Principal Receivable 2,332,340 2,616,960 Accrued Investment Income Receivable 851,255 586,141 Other Receivables 12,392 133,540
Total Receivables 3,195,987 3,336,641
Investments, At Fair ValueGovernment Securities
U.S. Government Securities 5,245,190 6,122,256 Futures 10,062 (9,567)Government Agency Securities 5,547,214 3,461,237 Municipal Bonds 16,074 14,979 Agency CMO 1,738,880 0
Corporate SecuritiesCollateralized Obligations 4,235,197 4,207,668 Corporate Bonds 7,900,372 8,983,087 Convertible Bonds 8,144,802 8,437,513 Convertible Preferred Stock 2,081,446 1,419,825 Common Stock 98,032,699 100,882,069 Equity Index Funds 16,204,447 21,619,815 Domestic Equity Co-Mingled 1,849,133 0 High Yield Income Fund 1,895,664 2,284,451 Preferred Stock 109,190 0
International SecuritiesGlobal Fixed Income Fund 36,783 42,152 Corporate Fixed Income 3,040,613 1,733,053 Equity Securities 48,433,937 36,331,839 Global Preferred Stock 740,981 360,135 Global Co-Mingled Funds 3,747,183 0 International Equity Index Funds 28,726,964 0 Equity Pooled Fund Units 0 20,284,600 Global Equity Index Funds 0 13,627,073 Global Collateralized Obligations 690,669 76,193 Emerging Markets 950,801 975,050 Global Convertible Bonds 673,361 0 Emerging Markets Collateralized Obligations 0 0 Forward Contracts 0 0
Core Plus Bond Fund 18,293,869 16,499,363 Interest Rate Swaps 0 Real Estate 38,450,938 37,192,107 Diversified Strategies 16,385,332 14,766,420 Timberland 3,284,500 3,585,552 Global Energy Fund 4,662,835 6,067,456 Commercial Loans 459,304 947,800
Total Investments 321,588,439 309,912,127
Securities Lending Collateral Investments, At Fair ValueAgencies 91,553 0 Receivables/Payables (515) (371,278)Repurchase Agreements 9,724,634 11,305,050 Asset Backed Floating Rate Notes 0 16,506,966 Corporate Floating Rate Notes 18,184,503 8,175,530 Time Deposits 0 0 Asset Backed Securities 9,425,681
Total Securities Lending Collateral Investments 37,425,857 35,616,267
TOTAL ASSETS 378,389,972 364,402,333
LIABILITIESAccrued Expenses and Other Liabilities 542,498 532,415 Investment Principal Payable 2,638,268 3,263,410 Securities Lending Liability 37,470,194 35,668,257
TOTAL LIABILITIES 40,650,961 39,464,082 NET POSITION RESTRICTED FOR PENSION BENEFITS $ 337,739,012 $ 324,938,251
STATEMENT OF FIDUCIARY NET POSITION

Financial Arkansas State Police Retirement System Annual Financial Report 2019
26
2019 2018Additions
ContributionsEmployer $ 6,727,409 $ 6,515,063 Member 27,515 133,860 Supplemental 8,035,962 7,109,703 Court 849,578 974,515 Drivers' License Reinstatement Fees 1,014,554 1,606,180 Motor Vehicle Title Fees 4,598,976 4,664,316
Total Contributions 21,253,993 21,003,638
Investment IncomeInterest 1,236,192 1,447,107 Dividends 3,359,522 2,940,294 Investment Gain/(Loss) 11,941,718 24,248,256 Security Lending Income 1,021,984 516,672 Real Estate 1,592,711 1,238,832 Other 0 11,785
Total Investment Income 19,152,127 30,402,945 Less: Investment Expense 2,120,661 1,579,612 Net Investment Income 17,031,466 28,823,333
Other Additions 17 11
Total Additions 38,285,476 49,826,982
DeductionsBenefits 24,930,274 24,185,419 Administrative Expenses 554,441 228,430
Total Deductions 25,484,715 24,413,849
Net Increase / (Decrease) 12,800,761 25,413,134
Net Position Restricted for Pension BenefitsBeginning of Year 324,938,251 299,525,117 End of Year $ 337,739,012 $ 324,938,251
STATEMENT OF CHANGES IN FIDUCIARY NET POSITION(for the year ended June 30, 2019)
Totals may not add due to rounding. See Notes to the Financial Statements beginning on page 27.

Financial
27
Arkansas State Police Retirement System Annual Financial Report 2019
NOTES TO THE FINANCIAL STATEMENTS
Note 1: Plan Description
General InformationThe Arkansas State Police Retirement System (ASPRS or the System) is a single-employer, defined benefit pension plan that was established on March 19, 1951 with the passage of Act 311 of 1951. The System provides for the retirement of police officers employed by the Department of Arkansas State Police. The laws governing the operations of ASPRS are set forth in Arkansas Code Annotated (A.C.A.), Title 24, Chapters 2 and 6. Act 1071 of 1997 created a Tier II benefit plan for all police officers hired on or after April 3, 1997.
Effective July 1, 2009, Act 1242 of 2009 transferred the assets of ASPRS to the Arkansas Public Employees Retirement System (APERS) to hold in trust for ASPRS. Act 1242 of 2009 also states that the State Police Trust Fund shall not be treated as segregated funds but shall be commingled with the assets of APERS strictly for investment purposes and that the assets of ASPRS and APERS shall be invested as determined by the Board of Trustees of the Arkansas Public Employees Retirement System (APERS Board).
Act 1242 of 2009 also created the Arkansas State Police Officers’ Tier II Deferred Retirement Option Plan (DROP), and it changed the composition of the Board of Trustees of the State Police Retirement System (ASPRS Board).
Arkansas Code Annotated § 24-6-204 states that the membership of the ASPRS Board shall be composed of seven members as follows:
• One active member enrolled in the Tier I benefits program,
• One active, vested member enrolled in the Tier II benefits program,
• The State Police Commissioner who shall be appointed by the Governor,
• The Chief Fiscal Officer of State or his or her designee, and
• Three citizens at large who shall be appointed by the Governor.
The members of the ASPRS Board are listed on page 13 of this report.

Financial Arkansas State Police Retirement System Annual Financial Report 2019
28
MembershipThe membership as of the June 30 end of fiscal years 2018 and 2019 was as follows:
2019 2018
Retirees and Beneficiaries Receiving Benefits 679 668
Terminated plan members entitled to but not yet receiving benefits 102 84
DROP Participants 56 61
Active Plan Members (Excludes DROP Participants) 473 467
1,310 1,280
Totals may not add due to rounding.
36.1%
51.8%
4.2%7.7%
Re�rees and Beneficiaries receiving benefits
Terminated plan members en�tled to but not yet receiving benefits
DROP Par�cipants
Ac�ve Plan Members (excluding DROP Par�cipants)
Membership 2019 Membership 2018
35.3%
53.6%
3.9%7.0%
Re�rees and Beneficiaries receiving benefits
Terminated plan members en�tled to but not yet receiving benefits
DROP Par�cipants
Ac�ve Plan Members (excluding DROP Par�cipants)

Financial
29
Arkansas State Police Retirement System Annual Financial Report 2019
ContributionsAs of June 30, 2018 and 2019, there were no contributory members of ASPRS. Plan member contributions presented in the financial statements are related to service purchase payments. For fiscal year 2019, the employer contribution rate was 22% of salaries paid (A.C.A. § 24-6-209). Contribution provisions are established by state law and may be amended only by the Arkansas General Assembly.
Act 1071 of 1997 provides for a transfer from insurance premium taxes to the State Police Retirement Fund (the ASPRS fund). The ASPRS fund received $8.036 million of Act 1071 funds in fiscal year 2019 and $7.110 million in fiscal year 2018. Additional funds are collected from motor vehicle title fees in accordance with Act 718 of 2011. The ASPRS fund received $4.6 million of Act 718 funds in fiscal year 2019 and $4.66 million in fiscal year 2018.
Plan AdministrationCosts of administering the plan are paid out of investment earnings.
BenefitsBenefit provisions are established by state law and found at Arkansas Code Annotated Title 24, Subchapter 6. They may be amended only by the Arkansas General Assembly. Members are eligible for full retirement benefits after meeting minimum age and service requirements. The normal retirement benefit, paid on a monthly basis, is determined based on a formula that uses (a) the member’s final average salary and (b) the number of years of credited service.
Increases After RetirementRetirees will receive a 3% cost of living adjustment (COLA) increase in their benefit each July 1. Eligibility for the COLA requires being retired from July 1 for a full 12 months.

Financial Arkansas State Police Retirement System Annual Financial Report 2019
30
Basis of AccountingThe System’s accounts and records are maintained using fund accounting principles, and its financial statements are prepared using the accrual basis of accounting. Expenses are recorded when the liability is incurred, revenues are recorded in the accounting period in which they are earned and become measurable, and investment purchases and sales are recorded as of their trade dates. Member and employer contributions are established by statute as a percentage of salaries and are recognized when due, pursuant to legal requirements. Benefits and refunds are recognized when due and payable in accordance with the terms of the plan.
Use of EstimatesThe preparation of the System’s financial statements in conformity with accounting principles generally accepted in the U.S. requires the System administrator to make significant estimates and assumptions that affect various data in the report, including the following:
• The net position restricted for pensions at the date of the financial statements
• The net pension liability and other actuarial information presented in Note 5
• The required supplementary information as of the benefit information date
• The changes in fiduciary net position during the reporting period
Estimates may also be involved in formulating disclosures of contingent assets and liabilities at the date of the financial statements. Actual results could differ from these estimates.
Cash and Cash EquivalentsCash and cash equivalents include demand accounts, imprest accounts, cash in the state treasury, and short-term investment funds (STIF). The STIF accounts are created through daily sweeps of excess cash by the System’s custodian bank into bank-sponsored commingled funds that are invested in U.S. Government and agency securities and other short-term investments. The STIF accounts had an average weighted maturity of 90 days or less and are stated at fair value.
Note 2: Summary of Significant Accounting Policies

Financial
31
Arkansas State Police Retirement System Annual Financial Report 2019
Note 3: Deposits and Investments
DepositsDeposits are carried at cost and are included in “cash and cash equivalents.” Cash and cash equivalents include demand accounts, cash in state treasury, and short-term investment funds (STIF). As of June 30, 2019, these totals were $33,894, $764,429, and $15,381,367 respectively. State Treasury Management Law governs the management of funds held in the State Treasury (cash in state treasury) and it is the responsibility of the Treasurer of State to ensure the funds are adequately insured and collateralized.
Custodial Credit Risk for DepositsCustodial credit risk for deposits is the risk that, in the event of the failure of a depository financial institution, the System will not be able to recover deposits or collateral securities. The System’s policy is to place deposits only in collateralized or insured accounts. As of June 30, 2019, the System’s only deposits exposed to potential custodial credit risk were those holding its foreign currency balance of $78,057. The System holds foreign currency in banks outside the United States as a result of transactions by international investment managers.
Act 1242 of 2009 merged the investable assets of ASPRS with those of APERS. All authority over investment of the merged assets was granted to the APERS Board. Investment schedules reflect the market values accrued to each system.
InvestmentsArkansas Code Annotated §§ 24-2-601 – 24-2-619 authorize the APERS Board to have full power to invest and reinvest monies of the System and to hold, purchase, sell, assign, transfer, or dispose of any of the investments or proceeds of the investments in accordance with the prudent investor rule. Security transactions and any resulting gains or losses are accounted for on a trade basis. Net investment income includes net appreciation in the fair value of investments, interest income, dividend income, and total investment expense, which includes investment management, custodial fees, and all other significant investment related costs.
Arkansas Code Annotated § 24-2-608 also states the System shall seek to invest not less than 5% nor more than 10% of the System’s portfolio in Arkansas-related investments. The APERS Board recognizes a legal responsibility to seek to invest in the Arkansas economy, while realizing its primary, legal, and fiduciary commitment is to beneficiaries of the retirement system. As stated in A.C.A. § 24-2-608 (d), “nothing in this section shall in any way limit or impair the responsibility of a fiduciary to invest in accordance with the prudent investor rule set forth in §§ 24-2-610 – 24-2-619.”

Financial Arkansas State Police Retirement System Annual Financial Report 2019
32
* Principal only. Totals may not add due to rounding.
Statement of Invested Assets by Type (fair value* as of June 30, 2019)
Investment Type Combined ASPRS APERSInvestments at Fair Value
Government SecuritiesU.S. Government Securities $ 145,061,055 $ 5,245,190 $ 139,815,865 U.S. Fixed Futures 278,264 10,062 268,203 Agency Pooled 153,413,831 5,547,214 147,866,617 Municipal Bonds 444,536 16,074 428,462 Agency CMO 48,090,483 1,738,880 46,351,603
Corporate SecuritiesCollateralized Obligations 117,128,663 4,235,197 112,893,466 U.S. Corporate Bonds 218,492,789 7,900,372 210,592,418 Convertible Bonds 225,252,749 8,144,802 217,107,947 Convertible Preferred Stock 57,564,490 2,081,446 55,483,044 Common Stock 2,711,193,719 98,032,699 2,613,161,020 U.S. Equity Index Fund 448,150,428 16,204,447 431,945,980 Co-Mingled Funds 51,139,648 1,849,133 49,290,515 High Yield Income Bond Fund 52,426,507 1,895,664 50,530,843 Preferred Stock 3,019,751 109,190 2,910,561
International SecuritiesGlobal Government Fixed 1,017,270 36,783 980,487 Global Corporate Bonds 84,091,245 3,040,613 81,050,632 Equity Securities 1,339,489,641 48,433,937 1,291,055,705 Global Preferred Stock 20,492,589 740,981 19,751,608 Global Co-Mingled Funds 103,632,140 3,747,183 99,884,957 International Equity Index Fund 794,473,317 28,726,964 765,746,353 Global Collateralized Obligations 19,101,147 690,669 18,410,478 Global Convertible Bonds 18,622,477 673,361 17,949,117 Emerging Market 26,295,361 950,801 25,344,560
Core Plus Bond Fund 505,935,511 18,293,869 487,641,642 Real Estate 1,063,399,691 38,450,938 1,024,948,753 Diversified Strategies 453,152,984 16,385,332 436,767,652 Timberland 90,836,191 3,284,500 87,551,690 Global Energy Fund 128,955,419 4,662,835 124,292,584 Commercial Loans 12,702,515 459,304 12,243,211
Total Investments 8,893,854,413 321,588,439 8,572,265,974
Securities Lending Collateral Investments at Fair ValueAgencies 2,532,000 91,553 2,440,447 Receivables/Payables (14,233) (515) (13,719)Repurchase Agreements 268,944,621 9,724,634 259,219,987 Floating Rate Notes 502,910,874 18,184,503 484,726,371 Asset Backed Securities 260,676,776 9,425,681 251,251,095
Total Securities Lending Collateral Investments 1,035,050,038 37,425,857 997,624,181 Total Invested Assets $ 9,928,904,450 $ 359,014,295 $ 9,569,890,155

Financial
33
Arkansas State Police Retirement System Annual Financial Report 2019
Asset AllocationAsset allocation guidelines have been established as follows:
Investments are reported at fair value as determined by the custodian bank. The custodian bank’s determination of fair values includes, among other things, using pricing services or quotes by major independent brokers at current exchange rates, as available. The schedule on page 37 reflects the fair value of investments.
Custodial Credit Risk for InvestmentsCustodial credit risk for investments is the risk that, in the event of failure of the counterparty to a transaction, the System will not be able to recover the value of its investments or collateral securities that are in the possession of an outside party. Investment securities are exposed to custodial credit risk if the securities are (a) uninsured, (b) not registered in the name of the government, and (c) held by either the counterparty or the counterparty’s trust department or agent but not in the System’s name. Arkansas Code Annotated §24-2-606 addresses the custodianship of assets, and the investment policy states that “the custodian bank shall, by nominee agreement, hold any and all securities for the beneficial interest of the APERS fund.” As of June 30, 2019, there were no investments exposed to custodial credit risk.
Credit Risk for InvestmentsCredit risk of investments is the risk that the issuer or other counterparty will not fulfill its obligation to the holder of the investment. Credit risk exposure is dictated by each investment manager’s agreement. This credit risk is measured by the credit quality of investment in debt securities as described by nationally recognized statistical rating organizations. Each portfolio is managed in accordance with investment guidelines that are specific as to permissible credit quality ranges, exposure levels within individual security quality rating tiers, and the average credit quality of the overall portfolio.
Asset Type AllocationTarget
Lower and UpperLimits
Equities 37% 32% - 42%
International Equities 24% 19% - 29%
Fixed Income 18% 13% - 23%
Diversified Strategies 5% 0% - 10%
Real Assets 16% 11% - 21%
100%

Financial Arkansas State Police Retirement System Annual Financial Report 2019
34
The System’s exposure to credit risk as of June 30, 2019, was as follows:
*Principal only. Figures are APERS and ASPRS combined. Totals may not add due to rounding.
Floating Rate Fund 0 0 0 0 0 0 0 18,241,063 18,241,063 Core Plus Bond Fund 0 0 0 0 0 0 0 505,935,511 505,935,511 Commercial Loans 0 0 0 0 2,321,586 4,269,724 0 6,111,205 12,702,515 Municipal Bonds 0 444,536 0 0 0 0 0 0 444,536 Co-Mingled Funds 0 0 0 0 0 0 0 32,898,585 32,898,585 High Yield Income Fund 0 0 0 0 0 0 0 52,426,507 52,426,507
$ 371,858,293 22,674,681 63,502,365 195,969,129 57,887,280 35,270,251 17,641,337 972,255,206 $ 1,737,058,542
Moody’s Credit Rating Dispersion Detail by Credit Rating Investment Type and Fair Value Aaa Aa A Baa Ba B Caa or below NR Fair Value*
Government SecuritiesU.S. Government Securities $ 145,061,055 0 0 0 0 0 0 0 $ 145,061,055
Agency CMO 48,090,483 0 0 0 0 0 0 0 48,090,483 Agency Pooled 153,413,831 0 0 0 0 0 0 0 153,413,831
U.S. Fixed Futures 0 0 0 0 0 0 0 278,264 278,264 Corporate Securities
Collateralized Obligations 18,699,002 9,475,558 2,222,692 255,514 631,832 6,894,138 15,043,043 63,906,885 117,128,663 Convertible Bonds 0 0 2,023,030 6,409,334 9,508,114 4,954,513 0 202,357,759 225,252,749
Convertible Preferred Stock 0 0 0 20,177,430 1,270,890 0 0 36,116,170 57,564,490 U.S. Corporate Bonds 4,724,186 8,350,290 45,162,839 109,912,859 27,349,867 8,579,949 2,094,122 12,318,677 218,492,789
International SecuritiesEmerging Market 385,875 0 1,672,386 12,914,724 2,456,290 3,891,331 0 4,974,755 26,295,361
Global Collateralized Obligations 1,483,861 0 0 7,921,591 986,888 0 0 8,708,808 19,101,147 Global Government Fixed 0 601,560 206,458 0 209,252 0 0 0 1,017,270 Global Convertible Bonds 0 2,362,140 0 0 0 0 0 16,260,337 18,622,477
Global Corporate Bonds 0 1,440,598 12,214,960 38,377,678 13,152,561 6,680,596 504,172 11,720,680 84,091,245
Floating Rate Fund 0 0 0 0 0 0 0 18,241,063 18,241,063 Core Plus Bond Fund 0 0 0 0 0 0 0 505,935,511 505,935,511 Commercial Loans 0 0 0 3,664,475 3,426,048 5,611,992 0 0 12,702,515 Municipal Bonds 0 444,536 0 0 0 0 0 0 444,536 Co-Mingled Funds 0 0 0 0 0 0 0 32,898,585 32,898,585 High Yield Income Fund 0 0 0 0 0 0 0 52,426,507 52,426,507
15,303,944 350,790,422 79,451,169 216,438,012 69,927,371 32,118,423 25,292,102 947,737,099 1,737,058,542
Securities Lending Collateral $ 181,158,166 331,341,432 95,564,866 0 0 0 3,191,332 386,508,307 $ 997,764,103
S&P’s Credit Rating Dispersion Detail by Credit Rating Investment Type and Fair Value AAA AA A BBB BB B CCC or below NR Fair Value*
Government SecuritiesU.S. Government Securities $ 0 135,720,010 0 0 0 0 0 9,341,045 $ 145,061,055
Agency CMO 0 48,090,483 0 0 0 0 0 0 48,090,483 Agency Pooled 0 153,413,831 0 0 0 0 0 0 153,413,831
U.S. Fixed Futures 0 0 0 0 0 0 0 278,264 278,264 Corporate Securities
Collateralized Obligations 10,500,205 1,952,571 5,728,106 1,107,139 1,015,259 788,762 17,191,021 78,845,600 117,128,663 Convertible Bonds 0 0 7,910,388 8,095,235 19,851,061 7,453,965 4,647,020 177,295,079 225,252,749
Convertible Preferred Stock 0 0 0 24,910,682 6,291,791 0 0 26,362,017 57,564,490 U.S. Corporate Bonds 4,803,739 7,359,145 48,052,904 120,806,019 20,888,764 5,383,607 2,267,199 8,931,413 218,492,789
International SecuritiesEmerging Market 0 0 806,635 11,536,644 3,883,059 2,653,150 951,750 6,464,124 26,295,361
Global Collateralized Obligations 0 996,780 4,160,558 2,583,227 460,339 0 0 10,900,244 19,101,147 Global Government Fixed 0 808,018 0 0 209,252 0 0 0 1,017,270 Global Convertible Bonds 0 0 2,362,140 1,905,271 0 4,763,912 0 9,591,155 18,622,477
Global Corporate Bonds 0 2,005,049 10,430,438 41,829,322 13,901,799 5,463,034 235,113 10,226,491 84,091,245

Financial
35
Arkansas State Police Retirement System Annual Financial Report 2019
Floating Rate Fund 0 0 0 0 0 0 0 18,241,063 18,241,063 Core Plus Bond Fund 0 0 0 0 0 0 0 505,935,511 505,935,511 Commercial Loans 0 0 0 0 2,321,586 4,269,724 0 6,111,205 12,702,515 Municipal Bonds 0 444,536 0 0 0 0 0 0 444,536 Co-Mingled Funds 0 0 0 0 0 0 0 32,898,585 32,898,585 High Yield Income Fund 0 0 0 0 0 0 0 52,426,507 52,426,507
$ 371,858,293 22,674,681 63,502,365 195,969,129 57,887,280 35,270,251 17,641,337 972,255,206 $ 1,737,058,542
Moody’s Credit Rating Dispersion Detail by Credit Rating Investment Type and Fair Value Aaa Aa A Baa Ba B Caa or below NR Fair Value*
Government SecuritiesU.S. Government Securities $ 145,061,055 0 0 0 0 0 0 0 $ 145,061,055
Agency CMO 48,090,483 0 0 0 0 0 0 0 48,090,483 Agency Pooled 153,413,831 0 0 0 0 0 0 0 153,413,831
U.S. Fixed Futures 0 0 0 0 0 0 0 278,264 278,264 Corporate Securities
Collateralized Obligations 18,699,002 9,475,558 2,222,692 255,514 631,832 6,894,138 15,043,043 63,906,885 117,128,663 Convertible Bonds 0 0 2,023,030 6,409,334 9,508,114 4,954,513 0 202,357,759 225,252,749
Convertible Preferred Stock 0 0 0 20,177,430 1,270,890 0 0 36,116,170 57,564,490 U.S. Corporate Bonds 4,724,186 8,350,290 45,162,839 109,912,859 27,349,867 8,579,949 2,094,122 12,318,677 218,492,789
International SecuritiesEmerging Market 385,875 0 1,672,386 12,914,724 2,456,290 3,891,331 0 4,974,755 26,295,361
Global Collateralized Obligations 1,483,861 0 0 7,921,591 986,888 0 0 8,708,808 19,101,147 Global Government Fixed 0 601,560 206,458 0 209,252 0 0 0 1,017,270 Global Convertible Bonds 0 2,362,140 0 0 0 0 0 16,260,337 18,622,477
Global Corporate Bonds 0 1,440,598 12,214,960 38,377,678 13,152,561 6,680,596 504,172 11,720,680 84,091,245
Floating Rate Fund 0 0 0 0 0 0 0 18,241,063 18,241,063 Core Plus Bond Fund 0 0 0 0 0 0 0 505,935,511 505,935,511 Commercial Loans 0 0 0 3,664,475 3,426,048 5,611,992 0 0 12,702,515 Municipal Bonds 0 444,536 0 0 0 0 0 0 444,536 Co-Mingled Funds 0 0 0 0 0 0 0 32,898,585 32,898,585 High Yield Income Fund 0 0 0 0 0 0 0 52,426,507 52,426,507
15,303,944 350,790,422 79,451,169 216,438,012 69,927,371 32,118,423 25,292,102 947,737,099 1,737,058,542
Securities Lending Collateral $ 181,158,166 331,341,432 95,564,866 0 0 0 3,191,332 386,508,307 $ 997,764,103
S&P’s Credit Rating Dispersion Detail by Credit Rating Investment Type and Fair Value AAA AA A BBB BB B CCC or below NR Fair Value*
Government SecuritiesU.S. Government Securities $ 0 135,720,010 0 0 0 0 0 9,341,045 $ 145,061,055
Agency CMO 0 48,090,483 0 0 0 0 0 0 48,090,483 Agency Pooled 0 153,413,831 0 0 0 0 0 0 153,413,831
U.S. Fixed Futures 0 0 0 0 0 0 0 278,264 278,264 Corporate Securities
Collateralized Obligations 10,500,205 1,952,571 5,728,106 1,107,139 1,015,259 788,762 17,191,021 78,845,600 117,128,663 Convertible Bonds 0 0 7,910,388 8,095,235 19,851,061 7,453,965 4,647,020 177,295,079 225,252,749
Convertible Preferred Stock 0 0 0 24,910,682 6,291,791 0 0 26,362,017 57,564,490 U.S. Corporate Bonds 4,803,739 7,359,145 48,052,904 120,806,019 20,888,764 5,383,607 2,267,199 8,931,413 218,492,789
International SecuritiesEmerging Market 0 0 806,635 11,536,644 3,883,059 2,653,150 951,750 6,464,124 26,295,361
Global Collateralized Obligations 0 996,780 4,160,558 2,583,227 460,339 0 0 10,900,244 19,101,147 Global Government Fixed 0 808,018 0 0 209,252 0 0 0 1,017,270 Global Convertible Bonds 0 0 2,362,140 1,905,271 0 4,763,912 0 9,591,155 18,622,477
Global Corporate Bonds 0 2,005,049 10,430,438 41,829,322 13,901,799 5,463,034 235,113 10,226,491 84,091,245

Financial Arkansas State Police Retirement System Annual Financial Report 2019
36
Concentration of Credit Risk for InvestmentsThe concentration of credit risk is the risk of loss attributed to the magnitude of the System’s investment in a single issuer (not including investments issued or guaranteed by the U.S. government or investments in mutual funds or external investment pools). The APERS Board has a formal investment policy for concentration of credit risk. None of the investments in any one issuer (other than those issued or guaranteed by the U.S. government) represented more than 5% of total investments.
Interest Rate Risk for InvestmentsInterest rate risk is the risk that changes in interest rates will adversely affect the fair value of investments. Investments can be highly sensitive to changes in interest rates due to their terms or characteristics. Interest rate risk is the greatest risk faced by an investor in the debt securities market since the price of a debt security will often move in the opposite direction of the change in interest rates.
The System’s external fixed income investment managers use the measurement of effective duration to mitigate the interest rate risk of the fixed income investments. Each fixed income investment manager monitors and reports the effective duration on a monthly basis. The effective duration of the investment portfolio is required to be +/- 10% of the benchmark’s duration. The benchmark for the U.S. fixed income markets is the Barclays Capital U.S. Aggregate Bond Index.

Financial
37
Arkansas State Police Retirement System Annual Financial Report 2019
*Principal only.Figures are APERS and ASPRS combined. Totals may not add due to rounding.
Investment Type Investment Maturity (In Years)Fair Value* Less than 1 1 - 5 6 - 10 More than 10 Fund - No
Maturities
Government Securities
U.S. Government Securities $ 145,061,055 $ 19,028,006 $ 15,117,931 $ 50,189,164 $ 60,725,955 $ 0
Agency CMO 48,090,483 0 0 0 48,090,483 0
Agency Pooled 153,413,831 0 10,980 0 153,402,851 0
U.S. Fixed Futures 278,264 278,264 0 0 0 0
Corporate Securities
Collateralized Obligations 117,128,663 0 6,513,754 2,131,792 108,483,117 0
Convertible Bonds 225,252,749 5,499,399 127,111,523 69,145,323 23,496,504 0
Convertible Preferred Stock 57,564,490 57,564,490 0 0 0 0
U.S. Corporate Bonds 218,492,789 7,834,826 47,815,343 105,500,636 57,341,984 0
International Securities
Emerging Market 26,295,361 0 2,617,137 12,362,821 11,315,403 0
Global Collateralized Obligations 19,101,147 0 0 2,981,104 16,120,043 0
Global Government Fixed 1,017,270 601,560 0 206,458 209,252 0
Global Convertible Bonds 18,622,477 0 17,237,119 0 1,385,358 0
Global Corporate Bonds 84,091,245 0 29,755,444 43,972,763 10,363,037 0
Floating Rate Fund 18,241,063 0 0 0 0 18,241,063
Core Plus Bond Fund 505,935,511 0 0 0 0 505,935,511
Commercial Loans 12,702,515 0 9,421,409 3,281,106 0 0
Municipal Bonds 444,536 0 151,659 0 292,877 0
Co-Mingled Funds 32,898,585 0 0 0 0 32,898,585
High Yield Income Fund 52,426,507 52,426,507 0 0 0 0 $ 1,737,058,542 $ 143,233,053 $ 255,752,300 $ 289,771,166 $ 491,226,863 $557,075,159
Securities Lending Collateral
Agencies $ 2,532,000 $ 2,532,000 $ 0 $ 0 $ 0
Asset-backed Securities 260,676,776 81,142,343 177,104,809 0 2,429,623
Floating Rate Notes 502,910,874 236,524,027 266,386,847 0 0
Repo 268,944,621 268,944,621 0 0 0
$ 1,035,064,271 $ 589,142,991 $ 443,491,656 $ 0 $ 2,429,623
As of June 30, 2019, the System had the following debt security investments and maturities:

Financial Arkansas State Police Retirement System Annual Financial Report 2019
38
Foreign Currency Risk Foreign currency risk is the risk that changes in exchange rates will adversely affect the fair value of an investment. The System’s currency risk resides within the international equity investments as well as within the fixed income investments and the fixed income managers. The System’s policy is to allow the external investment managers to decide what action to take regarding their respective portfolio’s foreign currency exposure using currency forward contracts. The System has a formal investment policy for foreign currency risk which limits foreign currency exposure to 10% of the investment manager’s respective portfolio.
The System’s exposure to foreign currency risk on June 30, 2019, was as follows:
*Principal only.Figures are APERS and ASPRS combined. Totals may not add due to rounding.
Currency % Fair Value Equities CashForward
Contracts
Australian Dollar 1.58 $ 21,736,120 $ 21,736,120 $ 0 $ 0
Brazilian Real 1.67 22,864,277 22,864,277 0 0
British Pound Sterling 18.19 249,682,691 249,688,396 11 (5,716)
Canadian Dollar 5.35 73,469,932 73,469,636 10 287
Chinese Yuan Renminbi 4.55 62,494,701 62,320,322 0 174,379
Danish Krone 1.49 20,402,356 20,401,954 3 399
Euro Currency 30.01 411,985,199 411,905,546 78,016 1,636
Hong Kong Dollar 2.66 36,528,272 36,528,272 0 0
Indian Ruphia 0.37 5,063,552 5,063,552 0 0
Israeli Shekel 1.27 17,425,101 17,425,101 0 0
Japanese Yen 10.28 141,155,469 141,293,833 0 (138,364)
Malaysian Ringgit 0.34 4,680,145 4,680,145 0 0
Mauritian Rupee 0.15 1,991,738 1,991,738 0 0
Mexican New Peso 0.21 2,849,431 2,849,431 0 0
Norwegian Krone 0.41 5,596,822 5,596,731 4 86
New Zealand Dollar 0.00 0 0 0 0
Papua New Guinea Kina 0.04 583,259 583,259 0 0
Philippines Peso 0.00 0 0 0 0
Russian Ruble 0.00 0 0 0 0
Singapore Dollar 1.20 16,456,960 16,456,960 0 0
South African Rand 0.97 13,249,829 13,249,829 0 0
South Korean Won 3.45 47,356,709 47,356,979 0 (270)
Swedish Krone 3.01 41,369,546 41,369,556 0 (10)
Swiss Franc 11.41 156,689,525 156,691,258 13 (1,746)
Taiwan Dollar 1.07 14,701,567 14,701,567 0 0
Thailand Baht 0.33 4,584,631 4,584,631 0 0
100.00% $ 1,372,917,832 $ 1,372,809,092 $ 78,057 $ 30,683

Financial
39
Arkansas State Police Retirement System Annual Financial Report 2019
Asset-Backed Securities Asset-backed securities (ABSs) are bonds or notes backed by loan paper or accounts receivable originated by banks, credit card companies, or other credit providers. The originator of the loan or accounts receivable paper sells it to a specially created trust, which repackages it as securities. ABSs have been structured as pass-through securities and as structures with multiple bond classes. The System’s ability to recover the amount of principal invested in these securities depends on the performance and quality of the trust assets.
Mortgage-Backed SecuritiesA mortgage-backed security (MBS) is a type of asset-backed security that is secured by a mortgage or collection of mortgages. MBSs depend on the underlying pool of mortgage loans to provide cash flow to make principal and interest payments on the security to its holders. The payments are usually periodic, similar to coupon payments.
MBSs are subject to credit risk, the risk that the borrower will be unable to meet its obligations. They are also subject to risks created by significant changes in interest rates. Prepayment risk refers to the possibility that interest rates may decline and remain low, encouraging borrowers to refinance their existing loans and thereby cause MBS holders to be repaid more quickly than originally anticipated. Prepayments reduce the weighted average life of the security. Alternatively, extension risk acknowledges the possibility that interest rates could rise and remain high for long periods of time, reducing the number of borrowers seeking to refinance their mortgages. As a result, MBS holders are repaid over longer periods of time. This extension of the mortgage increases the weighted average life of the security.
A collateralized mortgage obligation (CMO) is an MBS that comprises classes of bonds created by prioritizing the cash flows of the underlying mortgage pool. This approach redistributes prepayment risk and credit risk among the various bond classes in the CMO structure. Income is derived from payments and prepayments of principal and interest generated from collateral mortgages. CMOs may be collateralized by whole-loan mortgages, mortgage pass-through securities, or stripped mortgage-backed securities.
The System invests in MBSs and CMOs for diversification and to enhance fixed income returns. These instruments are reported at fair value in the Statement of Fiduciary Net Position

Financial Arkansas State Police Retirement System Annual Financial Report 2019
40
Corporate BondsCorporate bonds are a debt security issued by a corporation. The backing for the bond is usually the payment ability of the company, which is typically money to be earned from future operations. In some cases, the company’s physical assets may be used as collateral for bonds. They usually have a fixed term maturity and can have either a fixed or variable interest rate. Variable interest rate bonds have adjustments that are made periodically and vary directly with movements in interest rates.
Convertible Corporate BondsConvertible bonds convey an option to the bondholders to be exchanged for another asset, generally a fixed number of shares of common stock at a pre-stated price.
Pooled FundsPooled funds are funds from many individual investors that are aggregated for the purposes of investment and benefit from economies of scale. The System could be indirectly exposed to credit and market risks associated with forward currency contracts to the extent that these pooled funds hold forward currency contracts for purposes of managing exposure to fluctuations in foreign exchange rates. APERS and ASPRS have approximately $103 million invested in international pooled funds.
Securities LendingArkansas Code Annotated § 24-2-602 and the APERS Board’s investment policy permit the System to participate in a securities lending program to augment investment income. The System lends its securities to brokers-dealers and other entities with a simultaneous agreement to return the collateral for the same securities in the future. The System has entered into an agreement with BNY Mellon to act as agent in securities lending transactions. BNY Mellon serves as the custodian and is therefore the counterparty to securities lending transactions. The legal and contractual authorization for the securities lending program is contained in the Securities Lending Discretionary Agency Agreement executed between APERS and the custodian.
Whoever borrows the securities provides collateral in the form of cash and cash equivalents, U.S. Treasury or government agency securities, or letters of credit (for the marginal percentage collateralization only). U.S. securities are loaned versus collateral valued at 102.25% of the market value of the securities plus any accrued interest for domestic loans. Non-U.S. securities are loaned versus collateral valued at 104.997% of the market value of the securities plus any accrued interest. Collateral is marked-to-market daily if price movements exceed certain minimal thresholds.
The custodian provides for full indemnification to the System funds for any losses that might occur in the program due to the failure of a broker to return a security that was borrowed (and if the collateral is inadequate to replace the securities lent) or failure to pay the trust funds for income of the securities

Financial
41
Arkansas State Police Retirement System Annual Financial Report 2019
while on loan. The collateral securities received cannot be pledged or sold unless the borrower defaults. Cash collateral received is invested in APERS’ name; accordingly, investments made with cash collateral appear as an asset on the Statement of Fiduciary Net Position. A corresponding liability is recorded because APERS must return the cash collateral to the borrower upon expiration of the loan. The loan maturity dates generally do not match the maturity dates of the investments made with cash collateral received.
As of June 30, 2019, the cash collateral investments had an average weighted maturity of 26 days, whereas the weighted average loan maturity was 1 day. Investments with cash collateral were approximately $1,036.3 million (market value, APERS and ASPRS combined).
Derivative Instruments The System adheres to GASB Statement No. 53, Accounting and Financial Reporting for Derivative Instruments, which addresses the recognition, measurement, and disclosure of information regarding derivative instruments entered into by state and local governments.
Derivative instruments are financial contracts or agreements whose values depend on the values of one or more underlying assets, reference rates, or financial indexes. Derivative instruments include futures contracts, forward contracts, swap contracts, options contracts, and forward foreign currency exchange. APERS, through its external investment managers, could hold such instruments. The external investment managers may enter these certain investments on behalf of APERS primarily to enhance the performance and reduce the volatility of its portfolio. The external investment managers could enter into swaps and futures contracts to gain or hedge exposure to certain markets and to manage interest rate risk. They primarily use forward foreign exchange contracts to hedge foreign currency exposure. APERS could be exposed to risk if the counterparties to the contracts are unable to meet the terms of the contracts. APERS’ external investment managers seek to control this risk through counterparty credit evaluations and approvals, counterparty credit limits, and procedures for monitoring exposure. APERS’ external investment managers anticipate that the counterparties will be able to satisfy their obligations under the contracts. Investments in limited partnerships and commingled funds may include derivatives that are not shown in any derivative totals.
SwapsAPERS’ investment managers have entered into various swaps, including interest rate swaps, credit default swaps, and foreign currency swaps.
Interest Rate SwapsAn interest rate swap is the exchange of one set of cash flows based on interest rate specifications for another based on a specified principal amount over a period in the future. Interest rate swaps typically exchange a fixed payment for a floating payment. The floating payment is usually the London Interbank Offering Rate

Financial Arkansas State Police Retirement System Annual Financial Report 2019
42
(LIBOR). In the most common interest rate swap arrangement, one party agrees to pay fixed interest rate payments on designated dates to a counterparty who, in turn, agrees to make return interest rate payments that float with a specified reference rate. Long swap positions (receive fixed) increase exposure to long-term interest rates, and short positions (pay fixed) decrease exposure to interest rate risk. The System had no interest rate swaps at June 30, 2019.
Credit Default SwapA credit default swap is a contract whereby the credit risk associated with an investment is transferred by entering into an agreement with another party, who in exchange for periodic fees, agrees to make payments in the event of a default or predetermined credit event. The System had no credit default swaps at June 30, 2019.
Foreign Currency SwapA foreign currency swap is an agreement to swap principal and interest payments on a loan made in one currency for principal and interest payments of a loan of equal value in another currency. The System had no foreign currency swaps at June 30, 2019.
Foreign Currency Forward ContractsA foreign currency forward is a contractual agreement between two parties to pay or receive specific amounts of foreign currency at a future date in exchange for another currency at an agreed upon exchange rate. Forward commitments are not standardized and carry credit risk due to the possible nonperformance by one of the counterparties. The maximum potential loss is the aggregate face value in U.S. dollars at the time the contract was opened. These transactions are entered in order to hedge risks from foreign currency rate fluctuation and to facilitate trade settlement of foreign security transactions. Forwards carry foreign currency risk resulting from adverse fluctuations in foreign exchange rates.
The System had the following foreign currency forwards at June 30, 2019:
Figures are APERS and ASPRS combined. Totals may not add due to rounding.
Pay Receive Notional Value Market Value UnrealizedGain/Loss
Japanese Yen JPY USD $ 4,259,684 $ (4,398,048) $ (138,364)
Chinese Yuan Renminbi CNY USD 13,006,392 (12,857,668) 148,725
Chinese Yuan Renminbi USD CNY 2,397,107 (2,397,107) 0
$ 10,361

Financial
43
Arkansas State Police Retirement System Annual Financial Report 2019
Financial FuturesA financial future is an agreement to purchase or sell a specific amount of an asset at a specified delivery or maturity date for an agreed upon price. These derivative securities are used to improve yield, adjust duration of the portfolio, circumvent changes in interest rates, or to replicate an index. Futures contracts are standardized and traded on organized exchanges, thereby reducing credit risk.
The System had the following financial futures at June 30, 2019:
Mortgage-Backed To Be Announced (TBA)The phrase “to be announced” (TBA) is used to describe forward MBS trades. The term is derived from the fact that the actual mortgage-backed security that will be delivered to fulfill a TBA trade is not designated at the time the trade is made. The securities are announced 48 hours prior to the established trade settlement date.
The System had no mortgage-backed TBA at June 30, 2019.
Figures are APERS and ASPRS combined. Totals may not add due to rounding.
UnrealizedFutures Contracts Expiration Notional Value Fair Value Gain/(Loss)
U.S. 2-year Treasury Note Sept 2019 $ 26,688,477 $ 26,897,461 $ 208,985
U.S. 5-year Treasury Note Sept 2019 (20,427,187) (20,795,500) (368,313)
U.S. 10-year Treasury Note Sept 2019 13,829,906 14,204,531 374,625
U.S. 10-year Ultra Treasury Note Sept 2019 2,743,078 2,762,500 19,422
U.S. Long Bond Treasury Sept 2019 (5,495,452) (5,756,969) (261,517)
U.S. Ultra Long Bond Treasury Sept 2019 6,442,312 6,747,375 305,063$ 23,781,134 $ 24,059,399 $ 278,264

Financial Arkansas State Police Retirement System Annual Financial Report 2019
44
Fair Value MeasurementsThe Arkansas Public Employees Retirement System categorizes its fair value measurements within the fair value hierarchy by generally accepted accounting principles. The hierarchy is based on the valuation inputs used to measure the fair value of the asset and give the highest priority to unadjusted quoted prices in active markets for identical assets of liabilities (Level 1 measurements) and the lower priority to unobservable inputs (Level 3 measurements).
• Level 1 – Unadjusted quoted prices for identical instruments in active markets.
• Level 2 – Quoted prices for similar instruments in active markets; quoted prices for identical or similar instruments in markets that are not active; and model-derived valuations in which all significant inputs are observable.
• Level 3 – Valuations derived from valuation techniques in which significant inputs are unobservable.
Investments that are measured at fair value using the net asset value per share (or its equivalent) as a practical expedient are not classified in the fair value hierarchy.
In instances where inputs used to measure fair value fall into different levels in the fair value hierarchy, fair value measurements in their entirety are categorized based on the lowest level input that is significant to the valuation. The The Arkansas Public Employees Retirement System’s assessment of the significance of particular inputs to these fair value measurements requires judgment and considers factors specific to each asset or liability. The table(s) on the following pages shows the fair value levelling of the investments for the System.
Assets classified in Level 1 of the fair value hierarchy are valued directly from a predetermined primary external pricing vendor. Assets classified in Level 2 are subject to pricing by an alternative pricing source due to lack of information available by the primary vendor. Real estate, timberland, and partnership assets classified in Level 3, due to lack of an independent pricing source, are valued using an internal fair value as provided by the investment manager.
The categorization of investments within the hierarchy is based upon the pricing transparency of the instrument(s) and should not be perceived as the particular investment’s risk.

Financial
45
Arkansas State Police Retirement System Annual Financial Report 2019
Investments and Derivative Instruments Measured at Fair Value (as of June 30, 2019)
Fair Value Level 1 Level 2 Level 3Investments at Fair Value
U.S. Domestic Equities $ 96,166,113 $ 96,166,113 $ 0 $ 0 Convertible Securities 10,180,294 1,310,322 8,869,971 0 Preferred Securities 86,041 0 86,041 0
International Equities 54,047,704 54,047,704 0 0 Lazard 0 0 0 0 Convertible Securities 719,314 0 719,314 0 Preferred Securities 764,130 740,981 23,149 0 Fixed Income 4,718,866 0 4,718,866 0 Loans/JV interest 18,901 0 0 18,901
Domestic Fixed Income 0 0 0 0 Global Bond Fund 1,189,563 1,189,563 0 0 Infrastructure Fund 0 0 0 0 U.S. Government Securities 5,245,190 5,245,190 0 0 Futures 10,062 10,062 0 0 Fixed Income Fund 659,569 659,569 0 0 Corporate Bonds 19,437,736 0 19,437,736 0 Loans/JV interest 440,403 0 0 440,403
Total Investments 193,683,886 159,369,506 33,855,077 459,304
Securities Lending Collateral Investments at Fair ValueRepo 9,600,269 0 9,600,269 0 Agencies 90,382 0 90,382 0 Floating Rate Notes 17,951,947 0 17,951,947 0 Asset Backed Floating Securities 9,305,139 0 9,305,139 0 Total Securities Lending Collateral 36,947,737 0 36,947,737 0
Total Investments at Fair Value $ 230,631,623 $ 159,369,506 $ 70,802,814 $ 459,304
Investments at the Net Asset Value (NAV)High Yield Core Fund 355,169 Defensive Bond Fund 1,540,495 Domestic Equity Index Funds 16,204,447 Core Plus Bond Fund 18,293,869 Timberland 3,284,500 Global Energy Plus Fund 4,662,835 Global Equity Pooled Funds
MCM REIT Index 5,669,012 MCM ACWI ex-US Index 28,726,963
Real EstateInvesco Core 16,780,839 Heitman Core 11,482,458 Heitman Value Add 525,362 TA Fund X 507,302 TA Fund XI 1,882,344 LaSalle Fund Fund VI 413,290 LaSalle Fund Fund VII 1,190,331
Diversified StrategiesAQR Global Risk Premium 5,210,680 Newton Global Real Return 4,421,266 Blackstone 6,753,386
Total Investments at the NAV $ 127,904,549

Financial Arkansas State Police Retirement System Annual Financial Report 2019
46
Investments Classified as Level 1 in the preceding table are exchange-traded securities whose values are based on published market prices and quotations from either national security exchanges or active markets for those securities.
Investments Classified as Level 2 in the preceding table include publicly traded debt securities and exchange traded stocks in inactive markets. Investments in this category are sourced from reputable pricing vendors using pricing matrix models and techniques. Matrix pricing is used to value securities based on the securities’ relationship to benchmark quoted prices. Fair value is defined as the quoted market value on the last trading day of the period. These prices are obtained from various pricing sources by the APERS’ custodian bank which maintains the book of record for all investments.
Investments Classified as Level 3 in the preceding table are unobservable, meaning that the assets lack an independent pricing source. Values are provided by the investment manager or an external pricing source such as an independent appraiser.
Investments Measured at the Net Asset Value (NAV)The fair value of investments that are organized as commingled funds or limited partnerships have no readily ascertainable fair value. The value is determined by using the net asset value per share or its equivalent. Commingled fund values are based on each investor’s proportionate share of the total underlying assets in the fund less any liabilities for client withdrawals, investment purchases or other accrued expenses. Limited partnership values are based on the capital account balance the general partner reports at the end of each reporting period, adjusted by subsequent contributions, distributions, management fees, and changes in values of foreign currency and published market prices for certain securities. Even though the limited partnerships and commingled funds issue annual financial statements audited by independent auditors, the year-end for the State and these entities do not always agree. There are inherent uncertainties in estimating fair values for these types of investments, and it is possible that the estimates will change in the near-term or that the subsequent sale of assets will be different from the reported net asset value. With certain exceptions, mainly the equity and the fixed income funds, these investments cannot be redeemed, or, have certain restrictions regarding redemption. The real estate investments distributions are through the liquidation of the underlying assets or net operating cash flows. Each investment has a different redemption frequency and notice period as noted in the following table:

Financial
47
Arkansas State Police Retirement System Annual Financial Report 2019
Investments Measured at the Net Asset Value (NAV)
Fair Value Strategy Type
Fund Life of Non-
redeemable Mandates
Unfunded Commitments
Redemption Frequency (if currently
eligible)Redemption
Notice Period
Other Redemption Restrictions
Restriction Time Remaining
High Yield Core Fund
$ 355,169 Active High Yield Fixed Income
N/A none monthly T + 3 N/A N/A
Defensive Bond Fund
1,540,495 Income Oriented
N/A none daily T + 1 N/A N/A
Domestic Equity Index Funds
16,204,447 S & P 500 Index
N/A none daily T + 3 N/A N/A
Core Plus Bond Fund
18,293,869 Active Global Fixed Income
N/A none daily T + 3 N/A N/A
Timberland 3,284,500 Timber N/A none none N/A N/A partnership terminates in
December 2027
Global Energy Fund 4,662,835 Global Energy stocks
N/A none daily T + 3 N/A N/A
International Equity Pooled Funds
MCM REIT Index 5,669,012 Global Real Estate securities
N/A none daily T + 1 N/A N/A
MCM ACWI ex-US Index
28,726,963 International Equities
N/A none daily T + 1 N/A N/A
Real Estate
Invesco 16,780,839 Core Real Esate
N/A none quarterly T + 45 N/A N/A
Heitman 11,482,458 Core Real Esate
N/A none quarterly T + 90 N/A N/A
TA Fund X 507,302 Value Add Real Estate
N/A none 7-year lock up N/A N/A currently in capital redistribution phase
TA Fund XI 1,882,344 Value Add Real Estate
N/A none 7-year lock up N/A N/A the lock up period starts on the day of the last capital call
LaSalle Fund Fund VI
413,290 Value Add Real Estate
N/A none 7-year lock up N/A N/A currently in capital redistribution phase
LaSalle Fund Fund VII
1,190,331 Value Add Real Estate
N/A 243,611 7-year lock up N/A N/A the lock up period starts on the day of the last capital call
Heitman Value Partners IV
525,362 Value Add Real Estate
N/A 2,204,612 7-year lock up N/A N/A the lock up period starts on the day of the last capital call
TA Fund XII 0 Value Add Real Estate
N/A 2,711,888 7-year lock up N/A N/A the lock up period starts on the day of the last capital call
Diversified Strategies
AQR Global Risk Premium
5,210,680 Risk Premia N/A none weekly and monthly
T + 2 N/A N/A
Newton Global Real Return
4,421,266 Global Real Return
N/A none daily T + 3 N/A N/A
Blackstone 6,753,386 Fund of Funds
N/A none last day of each quarter
1yr; 2yrs; 3yrs; >3yrs
55% liquidity; then 20%; then 15%; then 10%
N/A
Total $ 127,904,549 $ 5,160,111

Financial Arkansas State Police Retirement System Annual Financial Report 2019
48
High Yield Core FundThe High Yield Active Core philosophy is centered on the belief that the best risk-adjusted returns and, ultimately, the best absolute returns are generated by a strategy of yield capture and error avoidance.
Defensive Bond FundThe investment objective is to exploit different sources of return available in high yield corporate securities in a way that generates risk-adjusted returns superior to those available from conventional high yield securities. The investment strategy is based on the assumption and observation that numerous market inefficiencies exist throughout the capital markets (particularly in the high yield bond markets) and that the prudent, active and systematic exploitation of these inefficiencies can generate returns consistent with these objectives.
Domestic Equity Index FundsThis is an S&P 500 Index fund.
Core Plus Bond FundThe Core Plus Fixed Income Strategy seeks excess return from multiple sources, including sector allocation and subsector and security selection. Duration, yield curve, and currency positioning is moderate. The largest component of the Core Plus Fixed Income risk budget is allocated to portfolio strategies that have consistently generated the highest return for the lowest unit of risk over time, such as sector allocation and subsector/security selection. The Core Plus Fixed Income portfolios may emphasize spread product in the sector allocation process and therefore may hold larger-than-benchmark allocations to corporate bonds, structured product, high yield bonds, and emerging markets debt. As a result, the strategy would likely outperform in a ‘risk on’ environment where corporate bonds, for example, are outperforming. The reverse would also likely be true. The Core Plus Fixed Income portfolios take an actively-managed, relative-value driven approach. The Strategy is expected to perform best in markets with excess spread dislocations that it can capitalize on through relative value trading.
TimberlandAn objective of a timber investment is to provide the fund with diversification from traditional asset classes. The goal of the timber investment is to get a stable core-type return with very low or little volatility.
Global Energy FundThe fund seeks to invest globally in opportunities found in the energy industry. The fund invests, both long and short, in the equity securities, and related instruments, of energy and energy related businesses, including companies that are not in the Benchmark, which are expected to outperform the energy sector as a whole.

Financial
49
Arkansas State Police Retirement System Annual Financial Report 2019
International Equity Pooled Funds• The MCM EB DV Non-SL REIT Index Fund— This REIT Index Fund seeks to match the performance
and the characteristics of the Dow Jones U.S. Select REIT Index which tracks the performance of publicly traded REITs and REIT-like securities and designed to serve as a proxy for direct real estate investments.
• MCM ACWI ex-US Index -— The MSCI ACWI ex USA Index captures large and mid-cap representation across 22 of 23 Developed Markets (DM) countries (excluding the US) and 24 Emerging Markets (EM) countries*. With 2,166 constituents, the index covers approximately 85% of the global equity opportunity set outside the US.
• Fidelity Select International Strategy — The Select International strategy utilizes a disciplined investment approach that capitalizes on fundamental research by combining qualitative stock selection with quantitative risk control. The available investment universe is comprised of stocks in Japan, the United Kingdom, Europe ex UK, and Asia Pacific ex Japan rated attractive by Fidelity’s analysts. The strategy uses a quantitative model to match the regional weights of the portfolio to the index. This approach is designed to diversify specific risk, reduces tracking error and factor risk, and controls transaction costs.
Real EstateThis asset class provides diversification to the total portfolio and strives to reduce total fund volatility while also enhancing the total return of the portfolio. Real estate has a low, and in some cases, negative, correlation with other major investment asset classes. The following are the strategies that comprise the Real Estate asset class and are explained in greater detail:
• Invesco Core Real Estate (ICRE) — The ICRE strategy is a portfolio of U.S. properties diversified by property type and geographic location, with an emphasis on attractive current income returns and the opportunity for both income and capital growth. It is based on top-down economic fundamentals combined with bottom-up local market intelligence.
• Heitman America Real Estate Trust (HART) — The HART strategy creates a high-quality, low-risk portfolio of stabilized, income-producing assets diversified by property type and economic exposure through acquiring assets in infill locations within major metropolitan areas, focusing on strong site attributes such as proximity to amenities and transportation networks, and ensuring that assets are well constructed with features that will appeal to tenants over long periods of time.
• TA Realty Funds X, XI, and XII — TA Realty has managed value-add, commingled real estate funds for approximately 30 years. They have investments in 35 markets, and 4 property types (office, industrial, multifamily, and retail). The firm has developed and refined a consistent approach focused on creating diversified real estate portfolios that can generate strong cash flow, benefit from an intensive asset management approach and result in the long-term creating of value of the life of the fund(s).

Financial Arkansas State Police Retirement System Annual Financial Report 2019
50
• LaSalle Funds VI and VII — The Funds pursue non-core properties that exhibit strong fundamentals and are expected to generate both income and appreciation. The sectors that are focused on are office, multifamily, retail, industrial, and specialty.
• Heitman Value Partners IV (“HPV IV”) is the fourth offering in Heitman’s North American value-add series. It is a closed-end, commingled fund that will pursue a diverse set of real estate opportunities with value-added business plans. The objective is to provide investors with attractive risk-adjusted returns. The strategy seeks to benefit from Heitman’s extensive research, real estate, and capital markets expertise to identify emerging investment opportunities and trends before they are fully appreciated by the broader market. The Fund will execute investment strategies that capitalize on those opportunities.
Diversified StrategiesThis asset class provides diversification to the total portfolio and strives to reduce total fund volatility while also enhancing the total return of the portfolio. The following are the strategies that comprise the Diversified Strategies asset class and are explained in greater detail:
• Global Risk Premium Tactical Fund (GRPT) — The AQR Global Risk Premium Tactical Fund seeks to efficiently deliver exposure to a broadly diversified set of global risk premia. In many institutional portfolios, equity risk is the predominant risk, a concentration driven by the need for high expected return that cannot be satisfied in a traditionally constrained, well-diversified portfolio. Rather than diversifying by capital, this strategy seeks to diversify based on risk across global equities, global nominal bonds, inflation sensitive assets, and credit/default related assets. Starting from this strategic risk-parity base, GRPT then employs modest tactical tilts across sub-sectors and across individual exposures, attempting to exploit temporary opportunities which may arise within markets. Following basic financial theory, AQR designed its Risk Parity strategies based on what they believe to be the most optimal liquid portfolio of global market betas, and AQR offers that same portfolio at various levels of leverage to target a desired amount of risk as approximated by ex-ante volatility. AQR’s approach employs modest leverage to scale up a lower-risk, broadly-diversified portfolio.
• Newton Global Real Return (US$) — Newton’s global real return US$ strategy is an actively managed, unconstrained, multi-asset strategy, which aims to achieve a return of one-month USD LIBOR +4 % p.a. over rolling five-year periods. The strategy seeks to add value through security selection and asset type flexibility and it also has an emphasis on capital preservation. The strategy is long only, does not use leverage or short securities and is daily valued.
• Blackstone (Fund of Funds) — The System hired Blackstone to manage a fund-of-funds strategy. As the name suggests Blackstone invests APERS funds in other hedge funds. The number of funds that APERS invests in varies on market conditions. The types of strategies that are contained within the APERS portfolio also vary. For full disclosure purposes on June 30 there were fundamental

Financial
51
Arkansas State Police Retirement System Annual Financial Report 2019
equity strategies, event driven strategies, fundamental credit strategies, credit trading strategies, distressed credit strategies, RMBS strategies, structured ABS strategies, multi-strat strategies, commodity strategies, macro rates strategies, thematic macro strategies, quantitative strategies, CTA strategies, and special situation strategies in the portfolio.

Financial Arkansas State Police Retirement System Annual Financial Report 2019
52
Note 4: Legally Required Reserves
A description of reserve accounts and their balances for the year ended June 30, 2019, are as follows:
The Member Deposit Account (MDA) represents members’ contributions held in trust until their retirement, at which time contributions are transferred to the Retirement Reserve Account.
The MDA Interest Reserve represents the accumulated interest paid on the MDAs held in trust. As members retire, the interest on their contributions is transferred to the Retirement Reserve Account.
The Employers’ Accumulation Account accumulates employers’ contributions to be used in providing the reserves required for transfer to the Retirement Reserve Account as members retire or become eligible for disability benefits.
The Retirement Reserve Account is the account to which member contributions, interest on those contributions, and employer contributions are transferred upon member retirement.
The DROP Reserve Account is the account established for the accumulation of balances paid to members who have been approved by the ASPRS Board to participate in the DROP. When a member retires, these amounts can be paid to the member as a lump sum, transferred to an authorized account, or be received as an annuity.
The Deferred Annuity Account is the account established to cover estimated retirement benefits to inactive vested members who are not currently receiving benefit payments.
The Outlawed Warrants Reserve is a cumulative total of warrants not cashed in prior years that have been outlawed. These amounts will be paid if members request payment from the Arkansas State Claims Commission and the commission approves payment.
As of June 30, 2019* TotalsMember Deposit Account Reserve $ 574,799 MDA Interest Reserve (19,210)Employer Accumulation Account 42,852,052 Retirement Reserve Account 279,483,488 DROP Reserve Account 11,598,498 Deferred Annuity Reserve 3,248,289 Outlawed Warrants Reserve 1,095 Total $ 337,739,012
*Before recommended actuarial transfers. Totals may not add due to rounding.

Financial
53
Arkansas State Police Retirement System Annual Financial Report 2019
Note 5: Net Pension Liability
The components of the net pension liability of the System as of the June 30 end of fiscal years 2018 and 2019 were as follows:
FY 2019 FY 2018
Total Pension Liability $ 458,133,785 $ 446,878,220
Fiduciary Net Position $ 337,739,012 $ 324,938,251
Net Pension Liability $ 120,394,773 $ 121,939,969
Fiduciary Net Position as a Percentage of Total Pension Liability 73.72% 72.71%
Actuarial AssumptionsThe total pension liability was determined by an actuarial valuation as of June 30, 2019, using the following actuarial assumptions, applied to all periods included in the measurement:
Valuation Date June 30, 2019
Actuarial Cost Method Entry Age Normal Cost
Amortization Method Level Percent-of-Payroll
Remaining Amortization Period 20-Year Closed
Asset Valuation Method 4-Year Smoothed Market
Actuarial Assumptions:
Investment Rate of Return 7.15% Projected Salary Increases 3.55% - 7.75% Including Price Inflation at 3.25%
Cost-of-Living Increases 3.0% Annual Compound Increases
Retirees and Beneficiaries Receiving Benefits 679
Terminated Plan Members Entitled to But Not Yet Receiving Benefits
102
DROP Members 56
Active Plan Members 473
Total 1,310

Financial Arkansas State Police Retirement System Annual Financial Report 2019
54
Long-Term Expected Return on Plan AssetsThe System’s policy in regard to the allocation of invested assets was established by the APERS Board and is reviewed at least annually to determine if the asset allocation is consistent with an acceptable level of risk and volatility.
The long-term expected rate of return on pension plan investments was determined using a building-block method in which best-estimate ranges of expected future real rates of return are developed for each major asset class. These ranges are combined to produce the long-term expected rate of return by weighting the expected future real rates of return by the current asset allocation percentage and by adding expected inflation. Best estimates of arithmetic real rates of return for the 10-year period from 2019 to 2029 were based upon capital market assumptions provided by the investment consultants. For each major asset class that is included in the Systems’ current asset allocation as of June 30, 2019, these best estimates are summarized in the following table:
For the year ended June 30, 2019, the annual money-weighted rate of return on pension plan investments, net of pension plan investment expense, was 5.36%. The money-weighted rate of return expresses investment performance, net of investment expense, adjusted for the changing amounts actually invested.
Asset ClassCurrentAllocation
Long-Term Expected Real Rate of Return
Broad Domestic Equity 37% 6.20%
International Equity 24 6.33
Real Assets 16 3.32
Absolute Return 5 3.56
Domestic Fixed 18 1.54
Total 100%
Total Real Rate of Return 4.80%
Plus: Price Inflation - Actuary’s Assumption 2.50
Less: Investment Expenses (Passive) 0.00
Net Expected Return 7.30%

Financial
55
Arkansas State Police Retirement System Annual Financial Report 2019
Discount RateA single discount rate of 7.15% was used to measure the total pension liability. This single discount rate was based on the expected rate of return on pension plan investments of 7.15%. The projection of cash flows used to determine this single discount rate assumed that plan member contributions will be made at the current contribution rate and that employer contributions will be made at rates equal to the difference between actuarially determined contribution rates and the member rate. Based on these assumptions, the pension plan’s fiduciary net position was projected to be available to make all projected future benefit payments of current plan members. Therefore, the long-term expected rate of return on pension plan investments was applied to all periods of projected benefit payments to determine the total pension liability.
Sensitivity of the Net Pension Liability The following presents the net pension liability of the System, calculated using the discount rate of 7.15%, as well as what the System’s net pension liability would be if it were calculated using a discount rate that is one percentage point lower (6.15%) or one percentage point higher (8.15%) than the current rate:
1% Decrease Current Discount Rate 1% Increase
6.15% 7.15% 8.15%
ASPRS $ 175,526,247 $ 120,394,773 $ 74,571,635

Financial Arkansas State Police Retirement System Annual Financial Report 2019
56
Note 6: Deferred Retirement Option Plan
A Deferred Retirement Option Plan (DROP) is available to Tier Two members of the System as authorized by Ark. Code Ann. § 24-6-501 et seq. In lieu of terminating employment and accepting a retirement benefit, any member who has at least 30 years of credited service, which includes reciprocal from another system, can elect to participate in the DROP. The DROP allows a member to defer the receipt of retirement benefits for a maximum of seven years. During that time, a percentage of a member’s benefit is deposited into an account that accrues interest. The System had a balance of $11,598,498 in the DROP reserve as of June 30, 2019.
REQUIRED SUPPLEMENTARY INFORMATION
The following data on historical trends indicate the System’s progress in accumulating sufficient assets to pay benefits when due. It is required supplemental information.
Actuarial Valuation
Date
Actuarial Valuation of
Assets(a)
Entry Age AAL (b)
UAAL(b)-(a)
Funded Ratio(a)/(b)
Annual Covered Payroll
(c)
UAAL as a Percentage
of Covered Payroll[(b-a)/(c)]
6/30/2010 $ 211.07 $ 333.60 $ 122.53 63.3% $ 28.51 429.7%
6/30/2011 208.05 343.21 135.16 60.6 28.06 481.6
6/30/2012 215.01 355.30 140.29 60.5 28.43 493.5
6/30/2013@ 233.15 361.46 128.31 64.5 28.01 458.1
6/30/2014@ 259.46 381.86 122.40 67.9 28.55 428.7
6/30/2015@ 274.83 398.96 124.14 68.9 29.93 414.8
6/30/2016 289.24 408.74 119.50 70.8 29.45 405.8
6/30/2017@ 305.85 429.05 123.21 71.3 29.08 423.7
6/30/2018 319.79 442.93 123.14 72.2 29.59 416.1
6/30/2019 $ 335.97 $ 454.62 $ 118.65 73.9% $ 30.29 391.7%
(dollars in millions)
@ After changes in actuarial assumptions or methods.Please note that differences between columns designated (a) and (b) may not add to UAAL due to rounding.
Schedule of Funding Progress

Financial
57
Arkansas State Police Retirement System Annual Financial Report 2019
Year Ended June 30
Actuarially Determined Contribution
Actual Contribution*
Contribution Deficiency
(Excess)Covered Payroll
Actual Contribution as % of Covered Payroll
2010 $ 12.7 $ 20.5 $ (7.8) $ 28.5 71.93%
2011 12.6 14.1 (1.5) 28.2 50.00
2012 14.1 19.7 (5.6) 29.5 66.78
2013 13.6 19.5 (5.9) 28.1 69.40
2014 14.0 19.5 (5.5) 29.1 67.01
2015 14.2 19.8 (5.6) 29.9 66.22
2016 14.3 19.7 (5.4) 29.4 67.01
2017 14.1 20.0 (5.9) 29.1 68.73
2018 15.2 21.0 (5.8) 30.0 70.00
2019 $ 15.6 $ 21.3 $ (5.7) $ 30.3 70.30%
Schedule of Employer Contributions(dollars in millions)
*Actual contributions are based on covered payroll at the time of the contribution. This payroll is not reported to the actuary. The covered payroll shown in the schedule above is the valuation payroll. Based on the limitations of this schedule, the final column cannot be compared to the contribution rates actually charged to the employer.

Financial Arkansas State Police Retirement System Annual Financial Report 2019
58
Totals may not add due to rounding.
Year Ended June 30 2019 2018 2017 2016 2015 2014
Total Pension Liability
Service Cost $ 6,691,528 $ 6,577,148 $ 5,473,626 $ 5,488,445 $ 6,101,608 $ 4,866,199
Interest 31,299,758 30,678,211 30,322,786 29,469,678 29,218,802 28,558,511
Benefit Changes 0 0 0 0 0 0
Differences Between Expected And Actual Experience (1,805,446) 467,389 (3,052,763) 1,757,687 (3,107,531) (454,349)
Assumption Changes 0 (4,529,133) 15,875,267 0 8,703,080 8,970,858
Benefit Payments (24,930,275) (24,185,418) (24,631,787) (26,035,466) (23,358,801) (21,688,239)
Refunds 0 0 0 0 0 0
Net Change In Total Pension Liability $ 11,255,565 $ 9,008,197 $ 23,987,129 $ 10,680,344 $ 17,557,158 $ 20,252,980
Total Pension Liability, Beginning of Year 446,878,220 437,870,023 413,882,894 403,202,550 385,645,392 365,392,412
Total Pension Liability, End of Year (A) $ 458,133,785 $ 446,878,220 $ 437,870,023 $ 413,882,894 $ 403,202,550 $ 385,645,392
Fiduciary Net Position
Contributions - Employer $ 21,254,010 $ 21,003,650 $ 19,961,066 $ 19,713,295 $ 19,784,130 $ 19,501,684
Contributions - Member 0 0 0 0 94,814 0
Net Investment Income 17,031,467 28,823,333 31,484,250 (210,045) 6,131,684 43,307,746
Benefit Payments (24,930,275) (24,185,419) (24,631,787) (26,035,466) (23,358,801) (21,688,239)
Refunds 0 0 0 0 0 0
Administrative Expense (554,441) (228,430) (208,424) (205,342) (196,231) (189,658)
Other Additions 0 0 0 0 6 0
Net Change In Fiduciary Net Position 12,800,761 25,413,134 26,605,105 (6,737,558) 2,455,602 40,931,533
Fiduciary Net Position, Beginning of Year $ 324,938,251 $ 299,525,117 $ 272,920,012 $ 279,657,570 $ 277,201,968 $ 236,270,435
Fiduciary Net Position, End of Year (B) $ 337,739,012 $ 324,938,251 $ 299,525,117 $ 272,920,012 $ 279,657,570 $ 277,201,968
Net Pension Liability, End of Year (A) - (B) $ 120,394,773 $ 121,939,969 $ 138,344,906 $ 140,962,882 $ 123,544,980 $ 108,443,424
Fiduciary Net Position as a Percentage of the Total Pension Liability 73.72% 72.71% 68.41% 65.94% 69.36% 71.88%
Covered-Employee Payroll $ 30,287,691 $ 29,593,145 $ 29,076,764 $ 29,448,593 $ 29,929,358 $ 28,548,873
Net Pension Liability as a Percentage of Covered-Employee Payroll 397.50% 412.05% 475.79% 478.67% 412.79% 379.85%
Schedule of Changes in Net Pension Liability and Related Ratios

Financial
59
Arkansas State Police Retirement System Annual Financial Report 2019
Year Ended June 30 2019 2018 2017 2016 2015 2014
Total Pension Liability
Service Cost $ 6,691,528 $ 6,577,148 $ 5,473,626 $ 5,488,445 $ 6,101,608 $ 4,866,199
Interest 31,299,758 30,678,211 30,322,786 29,469,678 29,218,802 28,558,511
Benefit Changes 0 0 0 0 0 0
Differences Between Expected And Actual Experience (1,805,446) 467,389 (3,052,763) 1,757,687 (3,107,531) (454,349)
Assumption Changes 0 (4,529,133) 15,875,267 0 8,703,080 8,970,858
Benefit Payments (24,930,275) (24,185,418) (24,631,787) (26,035,466) (23,358,801) (21,688,239)
Refunds 0 0 0 0 0 0
Net Change In Total Pension Liability $ 11,255,565 $ 9,008,197 $ 23,987,129 $ 10,680,344 $ 17,557,158 $ 20,252,980
Total Pension Liability, Beginning of Year 446,878,220 437,870,023 413,882,894 403,202,550 385,645,392 365,392,412
Total Pension Liability, End of Year (A) $ 458,133,785 $ 446,878,220 $ 437,870,023 $ 413,882,894 $ 403,202,550 $ 385,645,392
Fiduciary Net Position
Contributions - Employer $ 21,254,010 $ 21,003,650 $ 19,961,066 $ 19,713,295 $ 19,784,130 $ 19,501,684
Contributions - Member 0 0 0 0 94,814 0
Net Investment Income 17,031,467 28,823,333 31,484,250 (210,045) 6,131,684 43,307,746
Benefit Payments (24,930,275) (24,185,419) (24,631,787) (26,035,466) (23,358,801) (21,688,239)
Refunds 0 0 0 0 0 0
Administrative Expense (554,441) (228,430) (208,424) (205,342) (196,231) (189,658)
Other Additions 0 0 0 0 6 0
Net Change In Fiduciary Net Position 12,800,761 25,413,134 26,605,105 (6,737,558) 2,455,602 40,931,533
Fiduciary Net Position, Beginning of Year $ 324,938,251 $ 299,525,117 $ 272,920,012 $ 279,657,570 $ 277,201,968 $ 236,270,435
Fiduciary Net Position, End of Year (B) $ 337,739,012 $ 324,938,251 $ 299,525,117 $ 272,920,012 $ 279,657,570 $ 277,201,968
Net Pension Liability, End of Year (A) - (B) $ 120,394,773 $ 121,939,969 $ 138,344,906 $ 140,962,882 $ 123,544,980 $ 108,443,424
Fiduciary Net Position as a Percentage of the Total Pension Liability 73.72% 72.71% 68.41% 65.94% 69.36% 71.88%
Covered-Employee Payroll $ 30,287,691 $ 29,593,145 $ 29,076,764 $ 29,448,593 $ 29,929,358 $ 28,548,873
Net Pension Liability as a Percentage of Covered-Employee Payroll 397.50% 412.05% 475.79% 478.67% 412.79% 379.85%
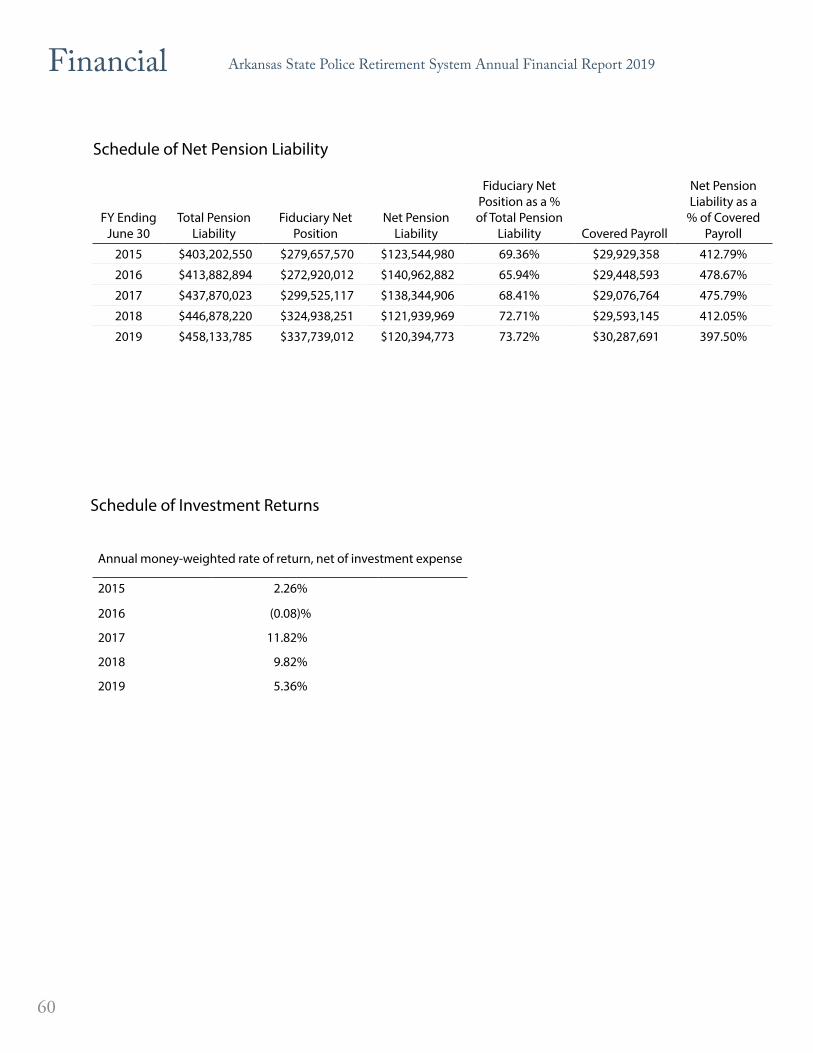
Financial Arkansas State Police Retirement System Annual Financial Report 2019
60
Schedule of Net Pension Liability
FY Ending June 30
Total Pension Liability
Fiduciary Net Position
Net Pension Liability
Fiduciary Net Position as a % of Total Pension
Liability Covered Payroll
Net Pension Liability as a
% of Covered Payroll
2015 $403,202,550 $279,657,570 $123,544,980 69.36% $29,929,358 412.79%
2016 $413,882,894 $272,920,012 $140,962,882 65.94% $29,448,593 478.67%
2017 $437,870,023 $299,525,117 $138,344,906 68.41% $29,076,764 475.79%
2018 $446,878,220 $324,938,251 $121,939,969 72.71% $29,593,145 412.05%
2019 $458,133,785 $337,739,012 $120,394,773 73.72% $30,287,691 397.50%
Schedule of Investment Returns
Annual money-weighted rate of return, net of investment expense
2015 2.26%
2016 (0.08)%
2017 11.82%
2018 9.82%
2019 5.36%

Financial
61
Arkansas State Police Retirement System Annual Financial Report 2019
NOTES TO REQUIRED SUPPLEMENTARY INFORMATION
Schedule of Administrative Expenses(for the fiscal year ended June 30, 2019)
2019 2018Communications
Printing and Advertising $ 3,073 $ 2,061
Services and ChargesProfessional Fees and Services 65,500 62,700Conference Fees and Travel 677 817Bank and Federal Service Charges 4,007 5,389IRS Penalties 0 0
Total Services and Charges 70,184 68,906
Bad Debt Expense 320,497 0
Transfer to APERS for Administrative Expenses 160,687 157,463
Total Administrative Expenses $ 554,441 $ 228,430
Schedule of Investment Expenses(for the fiscal year ended June 30, 2019)
2019 2018
Investment Consultant Fee $ 10,715 $ 2,584
Money Manager Fees* 1,222,599 1,182,956
Custodian Bank Fees 18,147 13,540
Other Investment Expenses 869,199 380,532
Total Investment Expenses# $ 2,120,661 $ 1,579,612
*See the schedule of investment fees shown on page 82 in the Investments Section of this report.#Total investment expenses include international withholding taxes, which are not included in the schedule of investment fees referenced above.
Payments for Professional Consultants(for the fiscal year ended June 30, 2019)
2019 2018
Gabriel, Roeder, Smith & Company $ 65,500 $ 62,700
Totals may not add due to rounding.

Chief Investment Officer’s Report
Investment Policy Summary
Asset Allocation
Schedule of Manager Distribution
Portfolio Characteristics
Schedule of Comparative Investment Results by Year
Schedule of Comparative Annualized Investment Results
Ten Largest Holdings
Schedule of Brokerage Commissions
Schedule of Investment Fees
INVESTMENTS

This page intentionally left blank

Investments
65
Arkansas State Police Retirement System Annual Financial Report 2019
CHIEF INVESTMENT OFFICER’S REPORT
Dear Members,
On behalf of the APERS Investment Department, it is my pleasure to present the Investment Section of the APERS’ Annual Financial Report for the fiscal year ended June 30, 2019.
Performance and StabilityFor fiscal year 2019, the APERS investment portfolio closed with total investments and cash of $9,153,121,783. The investment return for the fiscal year was 5.78%.
The strength of the return was largely driven by the exposure to domestic equities, diversified strategies, and domestic fixed income, as you will read in my Financial Market Recap which follows. Domestic Equities as an Asset Class contributed 8.12% to the total performance of the investment fund as the Dow Jones set a new record high in January 2019 of 26,616.
Diversified Strategies as an asset class contributed 10.20% to the total performance of the investment fund. Domestic Fixed Income as an asset class contributed 8.57% to the total performance of the investment fund. Interest rates tried to grind higher but the Federal Reserve changed its tune from hawkish to dovish going into the end of the second quarter of 2019.
20000
25000
30000
6/29/18 6/28/19Dow Jones Industrial Average (DJIA)
1.5
2
2.5
3
3.5
6/29/18 6/28/19U.S. 10-year Constant Maturity Treasury (CMT)
Dow Jones
U.S. 10-year Constant Maturity Treasury (CMT)

Investments Arkansas State Police Retirement System Annual Financial Report 2019
66
Fiscal Year 2018-2019 Global Financial Market RecapLast year I wrote that the final quarter of fiscal year 2018 (2Q of 2018) could have been called a lot of things, but, boring was not one of them. If you recall, the potential for a trade war between China and the United States heated up as President Trump continued to threaten tariffs on a range of imports from China, Mexico, Canada, and Europe. China then responded by issuing the same magnitude of tariffs on American exports. There were political elections in Italy along with divisions within Germany’s ruling coalition government that further rattled market sentiment as populist anti-establishment, anti-immigrations movements threatened the stability of the Euro. Mexico elected Lopez Obrador in a landslide vote. Turkey saw President Erdogan consolidate power and the markets braced for authoritarian rule. Domestically, the Federal Reserve raised rates by 25bps again, to 2.00% and maintained a hawkish stance.
I also wrote that the first quarter of fiscal year 2019 (3Q of 2018) was a strong quarter for domestic equities. The markets continued to receive favorable economic indicators and encouraging corporate earnings reports. However, towards the end of September there was a new round of reciprocal tariffs. Neither the U.S. or China was ready to flinch, so there’s an economic stand-off between the two largest economies in the world. The U.S. imposed an additional $200 billion in tariffs on Chinese goods and in return, China imposed $60 billion in tariffs on U.S. products. The stock market reacted in kind.
Interest rates continue to move higher as the debt load adds pressure, as well as views on inflation, and the economy. The 2-year Treasury rose 29bps to 2.82% and the benchmark 10-year note rose 21bps to 3.06%.
2400
2500
2600
2700
2800
2900
12/31/18 3/29/19????????? Graph 3S&P Index

Investments
67
Arkansas State Police Retirement System Annual Financial Report 2019
Commodity prices pushed higher led by strength in crude oil. The European Central Bank (ECB) announced that it would remain committed to ending its bond purchases by the end of 2018 although it was more reticent towards raising the target interest rate. The Bank of Japan (BOJ) signaled that is ultra-accommodative monetary policy would remain intact but it will allow flexibility around it’s 0% target on the 10-year JGB. Italian elections added to global market volatility as Italy announced an aggressive budget deficit target which lead to a sharp sell-off in the Italian government bond market. Italy’s debt level of over 130% of GDP is currently the second highest in the European Union, behind Greece at 180% of GDP. As the quarter closed, the upcoming November mid-term elections in the U.S. were the focus. Significant policy measures such as fiscal reform, trade, regulation, and policy measures were all hanging in balance.
The second quarter of the fiscal year (4Q of 2018) was a bit calmer. Fed Chairman Powell made comments that suggested that interest rates were “just below” the range for the neutral rate, where as only a month earlier he had communicated that interest rates were “a long way” from neutral. The markets interpreted his statement as a signal for a potential “pause” on interest rate hikes in 2019. However, the Federal Reserve did hike rates 25bps, from 2.25% to 2.50%. This was the ninth rate hike dating back to December 2015. US Treasuries rallied significantly in the fourth quarter while credit and equities sold off on fears of weaker global growth and restrictive US Fed policy. Specifically, slower growth in China, Japan, and the European Union. Also helping treasuries rally were public criticism of the Federal Reserve and Fed Chairman Powell from the US Administration, concerns about a trade war with China, Brexit negotiation uncertainty, mid-term elections, and the potential for a US government shutdown. US 10-year treasury fell almost 60bps from its mid-November high to close the year at 2.65%.
2.75
2.8
2.85
2.9
2.95
3
3.05
3.1
3.15
6/29/18 9/28/18??????????? Graph 4U.S. 10 Year Note

Investments Arkansas State Police Retirement System Annual Financial Report 2019
68
More disconcerting was the inversion of the front-end of the yield curve. Granted the inversion seemed to be driven by strong technicals which are associated with flight-to-quality, but it is worth mentioning that an inverted yield curve has historically been a strong indicator of an economic slowdown. Crude oil prices fell roughly $40 to close the year at $45.41.
The third quarter of the fiscal year (1Q 2019) saw US treasuries continuing to rally, along with the credit markets. The S&P 500 had one of its strongest starts to the year with a 13.1% return. The US 10-year treasury fell 28bps to 2.41%.
2.5
3
3.5
9/28/18 12/29/18???????? Graph 5
9/28/18 12/29/18????????? Graph 6
40
50
60
70
80
12/31/18 3/29/19????????? Graph 7
2.3
2.4
2.5
2.6
2.7
2.8
U.S. 10 Year Note
West Texas Intermediate Crude Oil
U.S. 10 Year Note

Investments
69
Arkansas State Police Retirement System Annual Financial Report 2019
During the quarter the yield curve inverted between the 3-month treasure bill out to the 10-eyar note, the first time since 2007. The Federal Reserve adopted a dovish stance in March. Chairman Powell cited the risks of a slowing economy over the next few years and waning fiscal stimulus from tax cuts. First quarter GDP was revised lower to 2.1% from the initial estimates of 2.6%, while inflation fell from 2.0% to 1.8%. Weak manufacturing Purchasing Managers’ Index (PMI) in Europe fueled growth concerns and propelled sovereign bond yields into negative territory.
By the end of the quarter, approximately $9.7 trillion in global debt was yielding negative interest rates. The European Central Bank (ECB) lowered its growth forecast in March and provided dovish forward guidance. The ECB also announced the launch of a new quarterly TLTRO (targeted longer-term refinancing operations) to provide liquidity to the markets. The term of the financing will be 2 years at a rate indexed to the refinancing rate, and it will commence in September 2019 through March 2021. The original Brexit date was extended to April 12th by the European Union to allow the UK Parliament to either approve Prime Minister Theresa May’s withdrawal agreement or “indicate a way forward.” If a deal was accepted the new Brexit date would have been May 22.
The fourth quarter of the fiscal year (2Q 2019) saw the US economic expansion break the previous streak of 120 consecutive months of economic growth from March 1991 to March 2001. US Treasures rallied during the second quarter of the year and the yield curve inverted. The 3-month rate fell 29bps to 2.10%. The 2-year, 5-year, and 10-year rates all fell between 41 and 43bps. The 10-year closed the quarter at 2.01%.
1.5
2
2.5
3
3/29/19 6/28/19????????? Graph 8
US equity markets gained 4.3% during the quarter, bringing the year-to-date return up to 18.5%, helped by accommodative monetary policy and positive sentiment regarding the US-China trade talks. Crude oil prices rose amid the extension of production cuts between Russia and Saudi Arabia. Crude rose to $65.06. In Europe, U.K. and Italian 10-year yields fell while German yields remained negative. Theresa May resigned, and Britain’s Conservative Party Leader Boris Johnson was positioned to become the next U.K. Prime Minister. Mr. Johnson was supportive of a “no-deal” Brexit, which left uncertainty for preparations to leave the European Union. Meanwhile, the Bank of Japan (BoJ), Bank of Canada (BoC), Reserve Bank of Australia (RBA), and the
U.S. 10 Year Note

Investments Arkansas State Police Retirement System Annual Financial Report 2019
70
Reserve Bank of New Zealand (RBZ) all turned to more accommodative policy, which further corroborated the global central banks’ shift towards easy monetary policies, setting up a potential coordinated global rate cut campaign during the second half of 2019.
As I write my CIO letter, the third quarter of 2019 has closed. The Federal Reserve lowered the Fed funds rate target to the 1.75 – 2.00% range. U.S. Treasury rates fell across all maturities. Just in the third quarter, the 10-year yield fell 33bps and the 30-year yield dropped 41bps.
6/28/19 9/28/19????????? Graph 9
1
1.5
2
2.5
2000
2500
3000
3500
12/31/18 9/28/19????????? Graph 10
Despite the Fed funds rate cuts, the yield curve remained inverted during the quarter. The S&P 500 Index returned 1.70% for the quarter, which brings the year-to-date return to an impressive 20.55% despite volatility.
U.S. crude oil and global Brent crude oil prices fell. Gold broke $1,500 during the quarter as investors sought traditional safe-haven assets amid the global economic uncertainty.
U.S. 10 Year Note
S&P Index

Investments
71
Arkansas State Police Retirement System Annual Financial Report 2019
1200
1400
1600
12/31/18 9/28/19????????? Graph 11
The U.S. labor markets added 430,000 nonfarm payroll jobs to the economy in the third quarter which showed job growth but at a continuingly slow rate. Outside of the U.S., signals of a global growth slowdown continued through the quarter. Manufacturing in Europe continued to contract and ended the quarter at nearly a seven-year low. Uncertainty ahead of a “no deal Brexit” weighed on the global markets as did the frenzied tariff war between the U.S. and China. Negotiations that began in the quarter were unproductive. Both sides increased tariffs in August, and in September there were reports that the U.S. would target Chinese companies on the U.S. exchanges. Negotiations were expected to continue into the last quarter of the year. With no deal in sight, and increased tariffs still in place, the prolonged trade tensions will continue to be a major factor.
I would like to thank each of the Trustees, the ultimate fiduciaries of APERS, for embracing the current investment structure that allowed APERS to achieve strong results for our members and the Arkansas taxpayers. APERS’ staff is committed to placing the system in the best position to continue to face the challenges of the global financial markets and to ensure that the APERS assets are positioned to provide long-term financial stability for you, the members.
Respectfully yours,
Carlos BorromeoChief Investment Officer
Gold

Investments Arkansas State Police Retirement System Annual Financial Report 2019
72
INVESTMENT POLICY SUMMARY
The investment objective of the Arkansas Public Employees Retirement System (APERS) shall be to
1. to protect the the fund so that its assets are preserved for providing benefits to participants and their beneficiaries, and
2. to maximize total return - either in the form of income or capital appreciation or both - in a manner that is consistent with prudent risk taking on the amounts available to provide such benefits.
For this purpose, short-term fluctuations in value shall be considered secondary to long-term investment results. The long-term return objective for the fund shall be to achieve a real rate of return of 4.5%. This is the return over the rate of inflation (as measured by the Consumer Price Index). This objective is not to be a goal from year to year but is intended as a long-term guideline to those involved in investing the fund’s assets.
An additional overall investment objective will be to achieve a total fund return of at least the actuarial rate of 7.15%. The investments of the fund shall be so diversified as to minimize the risk of large losses, unless under particular circumstances it is clearly prudent not to do so. Investments will be further diversified by hiring an appropriate number of managers whose investment styles are varied enough to provide a balance to the overall risk of the fund.

Investments
73
Arkansas State Police Retirement System Annual Financial Report 2019
To avoid extreme exposure to investment risk, the following percentages represent the minimum and maximum portion at market of the portfolio that may be invested by types:
The Board of Trustees of the Arkansas Public Employees Retirement System (the APERS Board) shall review its asset allocation at least annually to determine if the asset allocation is consistent with an acceptable level of risk and volatility.
Review of Investment Process
1. On a timely basis, at least twice a year, the APERS Board will review actual results achieved by the investment managers (with a perspective toward a three to five-year period or a peak-to-peak or trough-to-trough market cycle) to determine whether their performance
a. followed the APERS’ investment philosophy and policy guidelines,
b. achieved the investment objectives, and
c. compared satisfactorily with the performance of other similarly managed funds.
2. In addition to reviewing each investment manager’s results, the APERS Board will periodically re-evaluate its progress in achieving its objectives for the total fund and its equity, fixed-income, and international equity segments.
3. The periodic re-evaluation will also consider the continuing appropriateness of
a. the manager structure,
b. the allocation of assets among the managers, and
c. the investment objectives for the fund’s assets.
4. The APERS Board may appoint investment consultants to assist in the ongoing evaluation process. These consultants are expected to be familiar with the investment practices of other similar retirement plans and will be responsible for suggesting appropriate changes in the fund’s investment program over time.
ASSET ALLOCATION
Market Value Exposure
Asset Allocation Target Lower and Upper Limits
Equities 37% 32% - 42%International Equities 24% 19% - 29%Fixed Income 18% 13% - 23%Diversified Strategies 5% 0% - 10%Real Assets 16% 11% - 21%
100%

Investments Arkansas State Police Retirement System Annual Financial Report 2019
74
Actual vs. Target Allocation (as of June 30, 2019)
The current target and new target are as follows:
Totals may not add due to rounding.
ASSET ALLOCATION
Actual %Target %
Domes�cEquity
Interna�onalEquity
Domes�c FixedIncome
Other DiversifiedStrategies
RealAssets
0
5
10
15
20
25
30
35
40
45
+2.5
+0.1
-2.1
+0
-1.4
+1
$000s $000s ASPRS
Asset Class Actual ASPRS Actual Target Difference Difference Difference
Domestic Equity $ 3,617,493 $ 130,803 39.5% 37.0% 2.5% $ 230,838 $ 8,347
Int'l Equity 2,204,717 79,719 24.1 24.0 0.1 7,968 288
Domestic Fixed Income 1,454,998 52,611 15.9 18.0 (2.1) (192,564) (6,963)
Other 87,103 3,150 1.0 0.0 1.0 87,103 3,150
Diversified Strategies 453,153 16,385 5.0 5.0 0.0 (4,503) (163)
Real Assets 1,335,658 48,295 14.6 16.0 (1.4) (128,841) (4,659)
Total $ 9,153,122 $ 330,963 100% 100%
$000s $000s APERS
Asset Class Actual APERS Actual Target Difference Difference Difference
Domestic Equity $ 3,617,493 $ 3,486,690 39.5% 37.0% 2.5% $ 230,838 $ 222,491
Int'l Equity 2,204,717 2,124,998 24.1 24.0 0.1 7,968 7,680
Domestic Fixed Income 1,454,998 1,402,387 15.9 18.0 (2.1) (192,564) (185,601)
Other 87,103 83,953 1.0 0.0 1.0 87,103 83,953
Diversified Strategies 453,153 436,768 5.0 5.0 0.0 (4,503) (4,340)
Real Assets 1,335,658 1,287,363 14.6 16.0 (1.4) (128,841) (124,182)
Total $ 9,153,122 $ 8,822,159 100% 100%

Investments
75
Arkansas State Police Retirement System Annual Financial Report 2019
The illustration below shows the average percentage of asset allocations by asset type for the Public Plan Sponsor Database. Due to different asset allocations of public plans, percentages will not equal 100%.
Domestic Equity
Domestic Fixed-Income Other Intl Equity
Other Alternatives Real Assets
10th Percentile 50.92 37.99 4.68 26.17 31.67 10.81
25th Percentile 40.68 33.23 2.11 23.40 17.58 8.48
Median 34.23 26.55 0.91 19.71 10.07 5.10
75th Percentile 26.52 19.85 0.37 16.02 5.13 3.17
90th Percentile 21.12 14.70 0.05 12.73 2.06 1.93
Fund l 39.52 15.90 0.95 24.09 4.95 14.59
Target 5 37.00 18.00 0.00 24.00 5.00 16.00
% Group Invested 98.56% 97.12% 78.42% 96.40% 40.56% 24.46%
0%
10%
20%
30%
40%
50%
60%
(10%)
Wei
ghts
(39)
(5)
(77)
(19)
(100)
(83)
(30)
(5)
(78)
(19)
(46)
(87)

Investments Arkansas State Police Retirement System Annual Financial Report 2019
76
SCHEDULE OF MANAGER DISTRIBUTIONAs of June 30, 2019
Totals may not add due to rounding.
PercentAsset Allocation Market Value of Total ASPRS APERS
Domestic EquityMCM S&P 500 Index Fund $ 448,167,755 4.90% $ 16,205,074 $ 431,962,681 LSV Asset Management 251,494,446 2.75 9,093,662 242,400,784 CastleArk Management 570,170,692 6.23 20,616,517 549,554,175 Golden Capital Management 205,269,013 2.24 7,422,220 197,846,793 INTECH 517,124,040 5.65 18,698,430 498,425,610 Wellington Management Co. 437,884,023 4.78 15,833,229 422,050,794 Westwood Management 0 0.00 0 0 Lazard Asset Management 382,427,748 4.18 13,828,014 368,599,734 SSI Investment Management 306,415,010 3.35 11,079,507 295,335,503 Horrell Capital Management 130,106,814 1.42 4,704,467 125,402,347 Stephens Investment Management Group 368,433,388 4.03 13,321,999 355,111,389
$ 3,617,492,929 39.52% $ 130,803,118 $ 3,486,689,811 International Equity
Mellon ACWI ex-US Fund $ 794,473,323 8.68% $ 28,726,964 $ 765,746,359 Lazard Asset Management 483,986,185 5.29 17,500,214 466,485,971 Artisan Partners 459,294,397 5.02 16,607,396 442,687,001 Baillie Gifford 465,890,062 5.09 16,845,886 449,044,176 Manning & Napier 1,072,794 0.01 38,791 1,034,003 Fidelity 0 0.00 0 0
$ 2,204,716,761 24.09% $ 79,719,251 $ 2,124,997,510 Fixed Income
Doubleline Capital $ 461,936,239 5.05% $ 16,702,921 $ 445,233,318 MacKay Shields 487,126,183 5.32 17,613,752 469,512,431 Prudential Investments 505,935,513 5.53 18,293,869 487,641,644
$ 1,454,997,935 15.90% $ 52,610,543 $ 1,402,387,392 Real Assets
INVESCO Real Estate $ 468,192,067 5.12% $ 16,929,123 $ 451,262,944 MCM REIT Index Fund 156,782,271 1.71 5,669,012 151,113,259 TA Associates Realty Fund X 14,029,938 0.15 507,302 13,522,636 TA Associates Realty Fund XI 52,058,140 0.57 1,882,344 50,175,796 CastleArk Management 44,939,735 0.49 1,624,953 43,314,782 CastleArk Management Global Energy Fund 128,955,419 1.41 4,662,835 124,292,584 Pinnacle Forest Investments 90,836,191 0.99 3,284,500 87,551,691 Heitman Real Estate Trust LP 320,985,082 3.51 11,606,339 309,378,743 Heitman Value Partners 14,529,422 0.16 525,362 14,004,060 LaSalle Inc. & Growth VI LP 11,429,954 0.12 413,290 11,016,664 LaSalle Inc. & Growth VII LP 32,919,815 0.36 1,190,331 31,729,484
$ 1,335,658,034 14.59% $ 48,295,391 $ 1,287,362,643 Diversified Strategies
AQR Capital $ 144,106,639 1.57% $ 5,210,680 $ 138,895,959 Blackstone Hedge 186,771,753 2.04 6,753,386 180,018,367 Newton Capital 122,274,593 1.34 4,421,266 117,853,327
$ 453,152,985 4.95% $ 16,385,332 $ 436,767,653
Short-term Investment Fund $ 87,103,142 0.95% $ 9,703,721 $ 77,399,421 Composite Fund $ 9,153,121,786 100% $ 337,517,356 $ 8,815,604,430
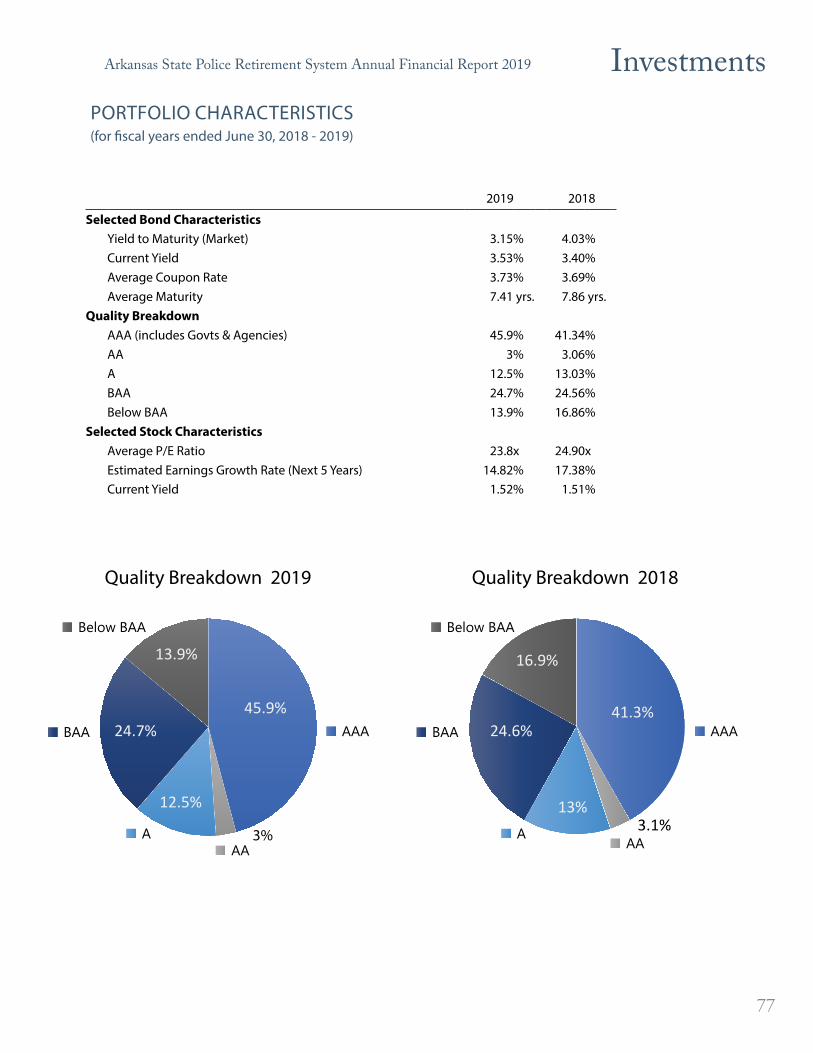
Investments
77
Arkansas State Police Retirement System Annual Financial Report 2019
PORTFOLIO CHARACTERISTICS(for fiscal years ended June 30, 2018 - 2019)
AAA
45.9%
3%
12.5%
24.7%
13.9%
41.3%
3.1%13%
24.6%
16.9%
AAA
AAA
Below BAA
BAAAAA
Below BAA
BAA
Quality Breakdown 2018Quality Breakdown 2019
2019 2018
Selected Bond CharacteristicsYield to Maturity (Market) 3.15% 4.03%Current Yield 3.53% 3.40%Average Coupon Rate 3.73% 3.69%Average Maturity 7.41 yrs. 7.86 yrs.
Quality BreakdownAAA (includes Govts & Agencies) 45.9% 41.34%AA 3% 3.06%A 12.5% 13.03%BAA 24.7% 24.56%Below BAA 13.9% 16.86%
Selected Stock CharacteristicsAverage P/E Ratio 23.8x 24.90xEstimated Earnings Growth Rate (Next 5 Years) 14.82% 17.38%Current Yield 1.52% 1.51%

Investments Arkansas State Police Retirement System Annual Financial Report 2019
78
(for fiscal years ended on June 30, 2014 - 2019)SCHEDULE OF COMPARATIVE INVESTMENT RESULTS BY YEAR
2019 2018 2017 2016 2015 2014
Total Fund
Arkansas Public Employees Retirement System 5.78% 10.25% 12.30% 0.30 % 2.67% 19.68%
Callan Total Public Fund Median 6.19 8.23 12.42 0.54 3.24 16.30
Inflation (Consumer Price Index) 1.65 2.87 1.50 0.64 (0.38) 2.04
Equities
Arkansas Public Employees Retirement System 8.12% 16.27% 17.52% (0.38)% 7.25% 24.48%
Callan Total Equity Database Median 7.73 15.02 19.48 (1.58) 7.17 25.26
Russell 3000 Index 8.98 14.78 18.51 2.14 7.29 25.22
International Equities
Arkansas Public Employees Retirement System 1.98% 7.22% 18.39% (6.88)% (2.38)% 24.43%
Callan Total Non-U.S. Equities Database Median 0.57 8.05 20.86 (8.20) (1.80) 23.34
MSCI-EAFE Index 1.08 6.84 20.27 (10.16) (4.22) 23.57
Fixed Income
Arkansas Public Employees Retirement System 8.57% 0.79% 3.04% 5.06 % 1.32% 7.03%
Callan Total Fixed Income Database Median 7.34 0.26 1.16 4.48 1.59 5.54
Bloomberg Aggregate Index 7.87 (0.40) (0.31) 6.00 1.86 4.37
Diversified Strategies
Arkansas Public Employees Retirement System 10.20% 6.43% 5.51% 2.86% 1.97% 13.91%
Callan Int'l/Global Balanced Database Median 2.31 6.53 7.54 (1.73) 0.59 13.59
Real Assets
Arkansas Public Employees Retirement System 1.72% 11.34% 3.27% 8.29% 0.19% 14.51%
Consumer Price Index - U + 4% 5.65 6.87 5.63 5.01 4.13 6.07

Investments
79
Arkansas State Police Retirement System Annual Financial Report 2019
Source: Callan Associates Inc. (CAI database contains returns of over 115 Public retirement funds.)Returns are reported gross of fees.
SCHEDULE OF COMPARATIVE ANNUALIZED INVESTMENT RESULTS(for the fiscal year ended June 30, 2019 and the preceding 3-year and 5-year rates of return)
2019 3-YearAnnualized
5-YearAnnualized
Total Fund
Arkansas Public Employees Retirement System 5.78% 9.41% 6.16%
Callan Total Public Fund Median 6.19 8.91 5.96
Inflation (Consumer Price Index) 1.65 2.05 1.45
Equities
Arkansas Public Employees Retirement System 8.12% 13.89% 9.56%
Callan Total Equity Database Median 7.73 13.81 9.73
Russell 3000 Index 8.98 14.02 10.19
International Equities
Arkansas Public Employees Retirement System 1.98% 8.98% 3.31%
Callan Total Non-U.S. Equities Database Median 0.57 9.74 3.03
MSCI-EAFE Index 1.08 9.11 2.25
Fixed Income
Arkansas Public Employees Retirement System 8.57% 4.08% 3.72%
Callan Total Fixed Income Database Median 7.34 3.07 3.20
Bloomberg Aggregate Index 7.87 2.31 2.95
Diversified Strategies
Arkansas Public Employees Retirement System 10.20% 7.36% 5.35%
Callan International/Global Balanced Database Median 7.41 8.09 5.29
Real Assets
Arkansas Public Employees Retirement System 1.72% 5.36% 4.88%
Consumer Price Index - U + 4% 5.65 6.05 5.45

Investments Arkansas State Police Retirement System Annual Financial Report 2019
80
TEN LARGEST HOLDINGS(as of June 30, 2019)
*
*By market value. Totals may not add due to rounding.
Domestic Fixed Income Holdings Par Value Market Value ASPRS APERSU.S. Treasury 3.000% 02/15/2049 $ 26,892,483 $ 29,087,946 $ 1,051,776 $ 28,036,169 U.S. Treasury 4.375% 11/15/2039 9,866,268 11,441,294 413,700 11,027,594 FNMA 2.500% 07/01/2046 9,679,281 10,100,253 365,210 9,735,043 U.S. Treasury TIP 0.875% 01/15/2029 9,314,819 9,638,833 348,526 9,290,307 FHLMC 3.000% 03/01/2042 8,307,022 8,481,725 306,686 8,175,038 FNMA 3.000% 05/01/2043 6,933,770 7,075,972 255,857 6,820,115 FHLMC 3.500% 11/01/2046 6,784,318 6,799,276 245,852 6,553,424 Washington Mutual Var Rate 08/25/2036 6,526,495 6,757,236 244,332 6,512,904 Shellpoint Var Rate 04/25/2047 6,089,846 6,044,132 218,547 5,825,585 Soundview Home Var Rate 08/25/2037 5,703,696 6,030,789 218,064 5,812,725 Total $ 101,457,455 $ 3,668,549 $ 97,788,906
Domestic Equity Holdings Shares Market Value ASPRS APERSMicrosoft Corp. 488,514 $ 65,441,335 $ 2,366,261 $ 63,075,075 Amazon.Com Inc. 25,463 48,217,501 1,743,472 46,474,028 Cisco Systems Inc. 729,039 39,900,304 1,442,735 38,457,569 The Coca-Cola Co. 754,409 38,414,506 1,389,011 37,025,495 Baxter International Inc. 423,783 34,707,828 1,254,983 33,452,845 The Boeing Corp. 95,153 34,636,644 1,252,409 33,384,234 Adobe Inc. 97,245 28,653,239 1,036,058 27,617,181 Alphabet Inc. Class A Shares 24,901 26,962,803 974,935 25,987,868 Analog Devices Inc. 228,019 25,736,505 930,593 24,805,911 Intuit Inc. 96,083 25,109,370 907,917 24,201,453 Total $ 367,780,035 $ 13,298,374 $ 354,481,661
International Equity Holdings Shares Market Value ASPRS APERSMedtronic PLC 680,570 $ 66,280,712 $ 2,396,611 $ 63,884,101 Samsung Electronics Co. Ltd. 684,712 27,871,175 1,007,780 26,863,395 Compass Group PLC 1,118,562 26,863,216 971,334 25,891,882 Cie Financiere Richemont SA 278,009 23,620,785 854,092 22,766,693 Arch Capital Group Ltd. 632,476 23,452,210 847,997 22,604,213 Relx PLC 937,722 22,788,714 824,006 21,964,708 Novartis AG 237,820 21,757,481 786,718 20,970,763 ABB Ltd. 1,079,936 21,698,406 784,582 20,913,825 Vivendi SA 713,746 19,678,226 711,535 18,966,690 Allergan PLC 116,985 19,586,799 708,229 18,878,569 Total $ 273,597,724 $ 9,892,883 $ 263,704,841

Investments
81
Arkansas State Police Retirement System Annual Financial Report 2019
SCHEDULE OF BROKERAGE COMMISSIONSfor the fiscal year ended of June 30, 2019)
Totals may not add due to rounding.
Number of Total CommissionBrokerage Firm Shares Traded Commission Per Share ASPRS APERS
Goldman Sachs & Co., NY 5,584,223 $ 140,140 $ 0.03 $ 5,067 $ 135,072 Credit Suisse, New York 4,572,360 96,734 0.02 3,498 93,236 Deutsche Bank Securities, NY 3,231,281 92,195 0.03 3,334 88,861 BMO Capital Markets, NY 2,853,374 82,538 0.03 2,984 79,554 J.P. Morgan Securities, NY 2,878,556 76,028 0.03 2,749 73,279 Jefferies & Co. Inc., NY 3,175,568 72,550 0.02 2,623 69,926 Morgan Stanley & Co. Inc., NY 5,478,107 63,688 0.01 2,303 61,385 Merrill Lynch Pierce Fenner Smith Inc., NY 4,856,401 59,413 0.01 2,148 57,265 Investment Tech Group Inc., NY 2,363,916 56,380 0.02 2,039 54,341 Weeden & Co. Inc., NY 3,713,418 50,967 0.01 1,843 49,124 Citigroup Global Markets Inc., NY 1,851,474 49,822 0.03 1,801 48,021 ITG Inc., NY 1,290,450 46,339 0.04 1,676 44,663 ISI Group Inc., NY 1,460,279 42,989 0.03 1,554 41,435 Instinet Corporation, NY 1,149,111 42,329 0.04 1,531 40,799 Credit Suisse (Europe), London 2,670,431 40,634 0.02 1,469 39,164 Merrill Lynch International, London 2,886,844 40,598 0.01 1,468 39,130 UBS Securities LLC, Stamford 2,349,379 38,456 0.02 1,390 37,065 Instinet Clearing Services Inc., NY 1,976,900 38,410 0.02 1,389 37,021 Sanford Bernstein & Company, NY 2,612,322 35,122 0.01 1,270 33,852 J.P. Morgan Securities Ltd., London 3,698,782 29,008 0.01 1,049 27,959 Robert W Baird & Co. Inc., Milwaukee 879,338 28,683 0.03 1,037 27,646 Barclays Capital Inc., New Jersey 2,088,143 26,954 0.01 975 25,980 Liquidnet Inc., NY 1,332,309 25,942 0.02 938 25,004 Guzman and Company, NY 1,269,813 25,396 0.02 918 24,478 Cowen and Company, Jersey City 1,080,085 25,382 0.02 918 24,464 Others (including 154 brokerage firms) 34,504,411 670,046 0.02 24,228 645,818
101,807,275 $ 1,996,740 $ 72,199 $ 1,924,541

Investments Arkansas State Police Retirement System Annual Financial Report 2019
82
SCHEDULE OF INVESTMENT FEES(as of June 30, 2019)
* Terminated manager / # terminated strategy / + management fee is base fee plus performance fee. / ++ management fee accrued- new account to be funded
Basis Points
ASPRS APERS
Market Value Fee Market Value Fee Market Value Fee
Domestic EquityMCM S&P 500 Index Fund $ 448,167,755 $ 73,884 0.02 $ 16,205,074 $ 2,672 $ 431,962,681 $ 71,212 MCM RU2000 Value Fund 0 0 0 0 0 0 LSV Asset Mgmt. 251,494,446 1,383,254 0.55 9,093,662 50,016 242,400,784 1,333,238 CastleArk Mgmt. 570,170,692 1,736,096 0.30 20,616,517 62,775 549,554,175 1,673,322 Golden Capital Mgmt. 205,269,013 441,192 0.21 7,422,220 15,953 197,846,793 425,239 INTECH 517,124,040 1,828,203 0.35 18,698,430 66,105 498,425,610 1,762,097 Wellington Mgmt. Co. 437,884,023 1,193,861 0.27 15,833,229 43,168 422,050,794 1,150,693 * Westwood Mgmt. 0 146,345 0 5,292 0 141,053 Lazard Asset Mgmt. 382,427,748 1,061,900 0.28 13,828,014 38,397 368,599,734 1,023,503 SSI Investment Mgmt. 306,415,010 1,161,454 0.38 11,079,507 41,996 295,335,503 1,119,458 Horrell Capital Mgmt. 130,106,814 212,634 0.16 4,704,467 7,689 125,402,347 204,946 Stephens Inv. Mgmt. Group 368,433,388 2,275,950 0.62 13,321,999 82,295 355,111,389 2,193,655
$ 3,617,492,929 $ 11,514,773 $ 130,803,118 $ 416,357 $ 3,486,689,811 $ 11,098,416 International EquityMellon ACWI ex-US Fund $ 794,473,323 $ 310,884 0.04 $ 28,726,964 $ 11,241 $ 765,746,359 $ 299,643 Lazard Asset Mgmt. 483,986,185 1,457,557 0.30 17,500,214 52,703 466,485,971 1,404,854 Artisan Partners 459,294,397 2,387,819 0.52 16,607,396 86,340 442,687,001 2,301,479 Baillie Gifford 465,890,062 1,789,027 0.38 16,845,886 64,689 449,044,176 1,724,339 *# Manning & Napier 1,072,794 0 0.00 38,791 0 1,034,003 0 *# Fidelity 0 532,444 0 19,252 0 513,192
$ 2,204,716,761 $ 6,477,731 $ 79,719,251 $ 234,225 $ 2,124,997,510 $ 6,243,506 Fixed IncomeDoubleline Capital $ 461,936,239 $ 785,452 0.17 $ 16,702,921 $ 28,401 $ 445,233,318 $ 757,052 MacKay Shields CP II 487,126,183 927,390 0.19 17,613,752 33,533 469,512,431 893,857 Prudential Investments 505,935,513 947,950 0.19 18,293,869 34,276 487,641,644 913,673
$ 1,454,997,935 $ 2,660,792 $ 52,610,543 $ 96,210 $ 1,402,387,392 $ 2,564,582 Real AssetsINVESCO Real Estate $ 468,192,067 $ 1,564,049 0.33 $ 16,929,123 $ 56,554 $ 451,262,944 $ 1,507,496 *# INVESCO Global REITs 0 0 0 0 0 0 MCM REIT Index Fund 156,782,271 79,847 0.05 5,669,012 2,887 151,113,259 76,960 + TA Associates Realty Fund X 14,029,938 801,851 5.72 507,302 28,994 13,522,636 772,857 + TA Associates Realty Fund XI 52,058,140 1,396,286 2.68 1,882,344 50,488 50,175,796 1,345,798 ++ TA Associates Realty Fund XII 0 283,334 n/a 0 10,245 0 273,089 CastleArk Mgmt. Global Energy Fund 44,939,735 468,913 1.04 1,624,953 16,955 43,314,782 451,958 CastleArk Mgmt. Global Energy Plus 128,955,419 1,506,824 1.17 4,662,835 54,485 124,292,584 1,452,340 Pinnacle Forest Investments 90,836,191 836,652 0.92 3,284,500 30,252 87,551,691 806,400 Heitman Real Estate Trust LP 320,985,082 2,245,677 0.70 11,606,339 81,200 309,378,743 2,164,477 + Heitman Value Partners 14,529,422 132,642 0.91 525,362 4,796 14,004,060 127,846 + LaSalle Inc & Growth VI LP 11,429,954 125,694 1.10 413,290 4,545 11,016,664 121,149 + LaSalle Inc & Growth VII LP 32,919,815 443,837 1.35 1,190,331 16,048 31,729,484 427,788
$ 1,335,658,034 $ 9,885,606 $ 48,295,391 $ 357,449 $ 1,287,362,643 $ 9,528,157 Diversified StrategiesAQR Capital $ 144,106,639 $ 861,408 0.60 $ 5,210,680 $ 31,147 $ 138,895,959 $ 830,261 Blackstone Hedge 186,771,753 1,811,441 0.97 6,753,386 65,499 180,018,367 1,745,942 Newton Capital 122,274,593 718,893 0.59 4,421,266 25,994 117,853,327 692,899
$ 453,152,985 $ 3,391,742 $ 16,385,332 $ 122,640 $ 436,767,653 $ 3,269,102 Other Investment Service FeesBank of New York Mellon (Custodian) $ 504,279 $ 18,234 $ 486,045 Callan Associates (Consultant) 301,085 10,887 290,198
Total Investment Service Fees $ 34,736,009 $1,256,002 $ 33,480,007

Actuary’s Certification Letter
Summary of Actuarial Assumptions
Supplementary Information
Single Life Retirement Values
Separations from Active Employment Before Age and Service Retirement
Probabilities of Retirement for Members Eligible to Retire
Active Members in Actuarial Valuation
Tier One and Tier Two Participants
Short Condition Test
Derivation of Experience Gain/(Loss)
Gains and Losses by Risk Area
ACTUARIAL

This page intentionally left blank

Actuarial
85
Arkansas State Police Retirement System Annual Financial Report 2019
ACTUARY’S CERTIFICATE LETTER

Actuarial Arkansas State Police Retirement System Annual Financial Report 2019
86

Actuarial
87
Arkansas State Police Retirement System Annual Financial Report 2019
SUMMARY OF ACTUARIAL ASSUMPTIONS
Economic AssumptionsThe investment return assumption used in making the valuation was 7.15% per year, compoundedannually (net after investment expenses). The assumed real rate of return is the portion of investmentreturn which is more than the wage inflation rate. Considering assumed wage inflation of 3.25%, the7.15% investment return rate translates to an effective assumed real rate of return of 3.90%. The wageinflation assumption was revised for the June 30, 2015 valuation and the investment return assumptionwas revised for the June 30, 2017 valuation.
Pay increase assumptions for individual active members are shown on page D-5. Part of the assumptionfor each age is for a merit and/or seniority increase, and the other 3.25% recognizes wage inflation. Thewage inflation assumption consists of 2.5% for price inflation and 0.75% for real wage growth. The payincrease assumption for individual active members was revised for the June 30, 2018 valuation.
Total active member payroll is assumed to increase 3.25% a year, which is the portion of the individualpay increase assumptions recognizing wage inflation.
The number of active members is assumed to continue at the present number.
Non-Economic AssumptionsThe mortality tables used to measure retired life mortality were the RP-2006 Healthy Annuitant benefitweighted generational mortality tables for males and females. The disability post-retirement mortalitytables used were the RP-2006 Disabled Retiree benefit weighted generational mortality tables for malesand females. The death-in-service mortality tables used were the RP-2006 Employee benefit weightedgenerational mortality tables for males and females. Mortality rates are multiplied by 135% for males and125% for females and are adjusted for fully generational mortality improvements using Scale MP-2017.This assumption was first used for the June 30, 2018 valuation.
The probabilities of retirement for members eligible to retire are shown on page D-4. The assumptionwas revised for the June 30, 2018 valuation.
The probabilities of death-in-service, disability and withdrawal from service are shown for sample ageson page D-5. The assumption for death-in-service was revised for the June 30, 2018 valuation.
The individual entry-age normal actuarial cost method of the valuation was used in determiningliabilities and normal cost.
*
*The data referenced in this section is taken from the actuary’s report, Arkansas State Police Retirement System Actuarial Valuation and the Gain/(Loss) Analysis of Experience, June 30, 2019, prepared by Gabriel Roeder Smith & Co. A PDF copy of the report is available for download at www.apers.org.

Actuarial Arkansas State Police Retirement System Annual Financial Report 2019
88
Differences in the past between assumed experience and actual experience (“actuarial gains and losses”)become part of actuarial accrued liabilities.
Unfunded actuarial accrued liabilities are amortized to produce contribution amounts (principal &interest) which are level percent-of-payroll contributions.
Present assets (cash & investments) were valued on a market related basis in which differencesbetween actual and assumed returns are phased-in over a four-year period.
The data about persons now covered and about present assets was furnished by the System’sadministrative staff. Although examined for general reasonableness, the data was not audited by theActuary.
The actuarial valuation computations were made by or under the supervision of a Member of theAmerican Academy of Actuaries (MAAA).

Actuarial
89
Arkansas State Police Retirement System Annual Financial Report 2019
The information presented in the required supplementary schedules was determined as part of the actuarial valuations at the dates indicated. Additional information as of the latest valuation date follows:
Valuation Date June 30, 2019
Actuarial Cost Method Entry Age Normal Cost
Amortization Method Level Percent-of-Payroll
Remaining Amortization Period 20-Year Closed
Asset Valuation Method 4-Year Smoothed Market
Actuarial Assumptions:
Investment Rate of Return 7.15% Projected Salary Increases 3.55% - 7.75% Including Wage Inflation at 3.25%
Cost-of-Living Adjustments 3.0% Annual Compound Increases
Retirees and Beneficiaries Receiving Benefits 679
Terminated Plan Members Entitled to But Not Yet Receiving Benefits
102
DROP Members 56
Active Plan Members 473
Total 1,310
SUPPLEMENTARY INFORMATION

Actuarial Arkansas State Police Retirement System Annual Financial Report 2019
90
SINGLE LIFE RETIREMENT VALUES
Sample Attained AgesPresent Value of $1.00
Monthly for Life
Present Value of$1.00 Monthly for Life
Increasing 3% AnnuallyFuture Life
Expectancy (Years)
Men Women Men Women Men Women
40 $ 155.95 $ 159.83 $ 229.08 $ 238.82 40.95 44.65
45 150.79 155.81 216.05 227.39 36.05 39.68
50 144.25 150.39 201.04 213.71 31.29 34.76
55 136.19 143.20 184.15 197.58 26.72 29.92
60 126.37 134.24 165.39 179.36 22.37 25.28
65 114.67 123.34 144.96 159.19 18.29 20.89
70 100.85 110.01 122.95 136.86 14.49 16.73
75 84.87 94.21 99.71 112.84 11.01 12.88
80 67.56 76.68 76.54 88.45 7.95 9.47
85 50.51 58.87 55.34 65.57 5.44 6.62
Sample Attained Ages$100 Benefit
Increasing 3% Yearly
55 $ 100.00
60 115.93
65 134.39
70 155.79
75 180.60
80 209.36

Actuarial
91
Arkansas State Police Retirement System Annual Financial Report 2019
Sample Ages
Percentage of Active MembersSeparating Within the Next Year
Pay Increase Assumptionsfor Active Members
Death Merit & Seniority
Base (Economic)
Increase Next YearMen Women Disability Other
20 0.05% 0.02% 0.06% 5.50 % 4.50% 3.25 % 7.75%
25 0.07 0.02 0.09 5.50 3.90 3.25 7.15
30 0.07 0.03 0.19 5.50 2.90 3.25 6.15
35 0.08 0.04 0.31 4.18 1.90 3.25 5.15
40 0.09 0.06 0.43 2.64 1.38 3.25 4.63
45 0.13 0.08 0.55 1.43 1.10 3.25 4.35
50 0.23 0.14 0.67 0.55 0.80 3.25 4.05
55 0.38% 0.22% 0.79% 0.00 % 0.60% 3.25 % 3.85%
(as of June 30, 2019)
SEPARATIONS FROM ACTIVE EMPLOYMENT BEFORE AGE AND SERVICE RETIREMENTAND INDIVIDUAL PAY INCREASES

Actuarial Arkansas State Police Retirement System Annual Financial Report 2019
92
(as of June 30, 2019)PROBABILITIES OF RETIREMENT FOR MEMBERS ELIGIBLE TO RETIRE
Retirement Ages
Percent of Eligible Active Members
Retiring Within Next Year
Percent of Eligible Active Members Retiring
Within Next Year
Tier One Tier TwoYears of Service Tier Two
47 1%
48 1
49 1
50 6 1% 30 25%
51 6 1 31 15
52 8 1 32 15
53 8 6 33 20
54 8 6 34 35
55 10 25 35 40
56 10 20 36 & Over 100%
57 10 18
58 25 18
59 40 20
60 50 25
61 60 30
62 80 100
63 80 100
64 100 100
65 100% 100%
A member is assumed to be eligible to retire at age 52 (55 for Tier Two) with 17 years of service, or at anyage with 30 years of service (Tier Two). A member is assumed to be eligible to retire early at age 47 (50for Tier 2) with 17 years of service. For a Tier 2 member with 30 or more years of service at the beginningof a year, the percentages shown for service based retirement (30 or more years) take precedence overthe percentages associated with age based retirement.
It was assumed that members eligible to enter the DROP will do so to maximize the value of theirbenefits.

Actuarial
93
Arkansas State Police Retirement System Annual Financial Report 2019
ACTIVE MEMBERS IN ACTUARIAL VALUATION(as of June 30, 2019)
Group Averages
June 30 Number* Age Service Pay
2010 545 42.0 14.3 $ 52,318
2011 530 42.0 14.4 52,950
2012 534 41.6 13.9 53,236
2013 525 41.6 13.9 53,344
2014 530 41.6 13.9 53,866
2015 558 41.0 13.0 53,637
2016 554 40.9 13.1 53,156
2017 528 41.7 13.8 55,070
2018 528 41.4 12.7 56,048
2019 529 41.0 12.5 $ 57,255
* Includes DROP participants.

Actuarial Arkansas State Police Retirement System Annual Financial Report 2019
94
Group Averages
Number Age Service Pay
Tier One 31 50.2 22.8 $ 73,823
Tier One - DROP 56 56.3 28.3 76,832
Tier Two 442 38.5 9.8 53,612Total 529 41.0 12.5 $ 57,255
TIER ONE AND TIER TWO PARTICIPANTS(as of June 30, 2019)

Actuarial
95
Arkansas State Police Retirement System Annual Financial Report 2019
The Arkansas SPRS funding objective is to meet long-term benefit promises through contributions that remain approximately level from year-to-year as a percent of member payroll. If the contributions to the System are level in concept and soundly executed, the System will pay all promised benefits when due -- the ultimate test of financial soundness. Testing for level contribution rates is the long-term test.
A short condition test is one means of checking a system’s progress under its funding program. In a short condition test, the system’s present assets (cash and investments) are compared with
• Member accumulated contributions;
• The liabilities for future benefits to present retired lives; and
• The employer financed portion of liabilities for service already rendered by nonretired members.
In a system that has been following the discipline of level percent-of-payroll financing, active member contributions (liability 1) and the liabilities for future benefits to present retired lives (liability 2) will be fully covered by valuation assets (except in rare circumstances). In addition, the liabilities for service already rendered by active members (liability 3) will be partially covered by the remainder of valuation assets. The larger the funded portion of liability 3, the stronger the condition of the system.
SHORT CONDITION TEST

Actuarial Arkansas State Police Retirement System Annual Financial Report 2019
96
Ten-Year Comparative Statement(dollars in millions)
Entry Age Accrued Liability
ValuationDate:
June 30
(1)Active
MemberContributions
(2)Retirees
andBeneficiaries
(3)Active
Members(Employer FinancedPortion)
Portion of PresentValues Covered ByValuation Assets
Valuation Assets
(1) (2) (3) Total
($ in Millions)
2010 $ 0.35 $ 179.38 $ 153.87 $ 211.07 100% 100% 20% 63%
2011 0.28 205.40 137.53 208.05 100 100 2 61
2012 0.31 217.64 137.35 215.01 100 99 0 61
2013@ 0.53 227.80 133.13 233.15 100 100 4 65
2014@ 0.50 237.17 144.19 259.46 100 100 15 68
2015* 0.37 252.79 145.80 274.83 100 100 15 69
2016 0.57 260.49 147.68 297.91 100 100 19 71
2017@ 0.57 273.86 154.62 305.85 100 100 20 71
2018 0.62 284.61 157.70 319.79 100 100 22 72
2019 $ 0.57 $ 296.12 $ 157.93 $ 335.97 100% 100% 25% 74%
@ After changes in actuarial assumptions and/or methods* (1) was estimated based on reported member contribution balances received by the actuary from ASPRS.

Actuarial
97
Arkansas State Police Retirement System Annual Financial Report 2019
DERIVATION OF EXPERIENCE GAIN/(LOSS)
Actual experience will not (except by coincidence) match assumed experience. Gains and losses often cancel each other over a period of years, but sizable year-to-year fluctuations are common. Detail on the derivation of the experience gain/loss is shown below.
(dollar figures in 1000’s)
1. UAAL* at Start of Year (after adoption of new assumptions) $ 123,1402. Normal Cost from Last Valuation 6,6443. Employer Contributions 21,2544. Interest accrual: (1) x 0.0715 + ((2) - (3)) x 0.03575 8,2825. Expected UAAL Before Changes: (1) + (2) - (3) + (4) 116,8126. Change for Revised Actuarial Assumptions and/or Valuation Methods 07. Change from Benefit Changes 08. Expected UAAL After Changes: (5) + (6) + (7) 116,8129. Actual UAAL at End of Year 118,64610. Gain/loss: (8) - (9) $ (1,834)11. Gain/Loss as Percentage of Actuarial Accrued Liabilities at Start of Year (0.4)%
* Unfunded Actuarial Accrued Liability
(as of June 30, 2019)

Actuarial Arkansas State Police Retirement System Annual Financial Report 2019
98
Gain/Loss in Period
Type of Risk AreaTotal
($ in millions)
% ofAccrued
Liabilities
Economic Risk Areas
Pay Increases: If there are smaller pay increases than assumed, there is a gain. If greater increases, a loss.
$ (0.4) (0.1)%
Investment Return: If there is greater recognized investment return than assumed, there is a gain. If less return, a loss.
(2.3) (0.5)
Non-Economic Risk Areas
Age & Service Retirements: If members retire at older ages or with lower final average pays than assumed, there is a gain. If they retire at younger ages or higher average pays, a loss.
(0.1) (0.0)
Disability Retirements: If there are fewer disabilities than assumed, there is a gain. If more, a loss.
0.1 0.0
Death-in-Service Benefits: If there are fewer claims than assumed, there is a gain. If more, a loss.
(0.3) 0.1
Withdrawal: If more liabilities are released by other separations than assumed, there is a gain. If smaller releases, a loss.
0.1 0.0
Actuarial Gains/(Losses) $ (2.9) (0.7)
Other (gains and losses resulting from group size change, data adjustments, timing of financial transactions, and retiree mortality) 1.1 0.3
Total Actuarial Gains/Losses $ (1.8) (0.4)%
ANALYSIS OF EXPERIENCE - GAINS/(LOSSES) BY RISK AREA (during the period July 1, 2018 to June 30, 2019)

STATISTICAL
Schedule of Revenues by Source
Schedule of Expenses by Type
Schedule of Benefit Expenses by Type
Schedule of Retired Members by Type of Benefit
Statistical Graphs

This page intentionally left blank

Statistical
101
Arkansas State Police Retirement System Annual Financial Report 2019
SCHEDULE OF REVENUES BY SOURCE(for the fiscal year ended June 30, 2019)
Schedule of Revenue by Source(Millions)
EmployerContributions
Court & Driver's License Reinst.
FeesInsurance
Premium Tax
Motor Vehicle Title
Fees Investment
IncomeOther
Income Total
2010 $ 20,547,457 $ 2,682,529 $ 5,285,153 $ 0 $ 15,965,604 $ 63,621 $ 39,259,211
2011 11,434,257 2,675,335 5,232,634 0 43,395,542 18,470 57,523,604
2012 6,525,196 2,525,594 6,250,117 4,246,637 (1,302,063) 118,334 18,363,815
2013 6,183,721 2,111,570 6,697,200 4,356,659 30,531,555 124,067 50,004,772
2014 6,405,887 2,657,952 5,957,541 4,442,806 43,307,745 37,499 62,809,430
2015 6,409,752 2,234,350 6,574,376 4,565,652 6,131,684 94,820 26,010,634
2016 6,581,580 2,206,082 6,233,769 4,661,683 (210,045) 30,181 19,503,250
2017 6,416,736 2,139,475 6,693,915 4,667,895 31,484,250 43,045 51,445,316
2018 6,515,063 2,580,695 7,109,703 4,664,315 28,823,333 133,871 49,826,982
2019 $ 6,727,409 $ 1,864,132 $ 8,035,962 $ 4,598,976 $ 17,031,466 $ 27,532 $ 38,285,476
$60
$70
$50
$40
$30
$20
$10
($10)
$0
Insurance Premium TaxCourt & Drivers License Reinst. Fees Employer Contribu�ons
Other IncomeInvestment IncomeMotor Vehicle Title Fees
$60
$70
$50
$40
$30
$20
$10
($10)
$0
2011 2012 2013 2014 2015 2016 2017 2018 20192010

Statistical Arkansas State Police Retirement System Annual Financial Report 2019
102
SCHEDULE OF EXPENSES BY TYPE(for the fiscal year ended June 30, 2019)
Schedule of Expenses by Type (Millions)
*Includes DROP and PAW distributions.
Year EndedJune 30
Benefit Payments*
Administrative Expenses Total
2010 $ 20,319,683 $ 79,878 $ 20,399,561
2011 21,560,127 83,234 21,643,361
2012 21,649,158 80,842 21,730,000
2013 23,717,503 97,181 23,814,684
2014 21,688,239 189,658 21,877,896
2015 23,358,801 196,231 23,555,032
2016 26,035,466 205,342 26,240,808
2017 24,631,787 208,424 24,840,211
2018 24,185,419 228,430 24,413,849
2019 $ 24,930,274 $ 554,441 $ 25,484,715
Benefit PaymentsAdministra�ve Expenses
$ 30
25
20
15
10
5
2010 2011 2012 2013 2014 2015 2016 2017 2018 2019
$ 30
25
20
15
10
5

Statistical
103
Arkansas State Police Retirement System Annual Financial Report 2019
SCHEDULE OF BENEFIT EXPENSES BY TYPE(for the fiscal year ended June 30, 2019)
*
*Expenses are based on annualized June 30 benefits amounts.**Prior to 2015, disability beneficiaries were reported in the same category as death-in-service beneficiaries.
Year EndedJune 30
Age and Service Disability
Death in Service**
QDRO Alternative
PayeesDROP
ParticipantsRetirees Beneficiaries Retirees Beneficiaries**
2010 $ 13,646,899 $ 1,113,108 $ 18,793,560 $ $ 90,312 $
2011 14,905,638 1,708,748 20,302,152 93,024
2012 16,106,010 1,803,169 21,950,568 91,092
2013 16,901,590 1,950,945 26,158,872 93,828
2014 17,368,858 2,034,215 27,648,624 74,640
2015 17,963,207 2,325,900 1,016,556 13,944 76,872 471,880 3,126,156
2016 18,805,319 2,355,686 1,064,772 14,364 79,188 532,792 3,434,940
2017 18,769,461 2,320,702 1,350,504 7,140 491,004 607,318 3,281,616
2018 19,037,338 2,702,300 1,400,784 7,368 508,092 634,167 3,630,132
2019 $ 19,922,625 $ 2,942,626 $ 1,413,720 $ 0 $ 510,120 $ 637,202 $ 3,334,908
DROP Par�cipants
Re�reesSurvivors/BeneficiariesDisability Re�rees Disability Beneficiaries
QDRO Alt. Payee
69.27%10.23%
4.91%1.77%
11.59%
Death in Service
2.22%

Statistical Arkansas State Police Retirement System Annual Financial Report 2019
104
SCHEDULE OF RETIRED MEMBERS BY TYPE OF BENEFIT(as of June 30, 2019)
Type of Benefit Being Paid Number Annual PensionsActuarial
Accrued LiabilityAge & Service RetireesLife 20 $ 423,960 $ 5,893,638B-50 414 19,485,729 233,110,612B-75 2 12,936 193,857Totals 436 19,922,625 239,198,107
Beneficiaries of Age & Service RetireesB-50 122 2,942,626 26,505,948
Total Age & Service Retirees 558 22,865,251 265,704,055
Disability RetireesLife 18 292,056 3,684,877B-50 37 1,121,664 13,207,335Totals 55 1,413,720 16,892,212
Beneficiaries of Disability Retirees 0 0 0
Total Disability Retirees & Beneficiaries 55 1,413,720 16,892,212
Death-in-Service Beneficiaries 27 510,120 5,374,399
QDRO Alternate Payees 39 637,202 8,145,914
Total Retirees & Beneficiaries 679 25,426,293 296,116,580
DROP Participants (excluding DROP reserve) 56 3,334,908 53,479,946
Total Retirees, Beneficiaries and DROP Participants 735 $ 28,761,201 $ 349,596,526
Disability Ret-Beneficiaries (0)
Age & Service Re�rees: STRAIGHT LIFEAge & Service Re�rees: B-50 OPTIONAge & Service Re�rees: B-75 OPTIONAge & Service Ret-Beneficiaries: B-50
Disability Re�rees: B-50
20
122
56
18414
37
Disability Re�rees: STRAIGHT LIFE
27
DROP Par�cipants*QDRO Alternate PayeesDeath-in-Service Beneficiaries
2
390
*Not including DROP reserves

Statistical
105
Arkansas State Police Retirement System Annual Financial Report 2019
STATISTICAL GRAPHSComparison of Membership by Type
0
100
200
300
400
500
600
700
Tier 1 Tier 2 Inac�ve Vested DROP Re�rees*
31
442
10256
679
*Including Disability Recipients and Death-in-Service Beneficiaries


![Arkansas State Police - The Girards Law Firm€¦ · Arkansas State Police 6:05:40 PM] Arkansas State Police Preliminary Fatal ...](https://static.fdocuments.in/doc/165x107/5b14e6067f8b9a8f548c9f67/arkansas-state-police-the-girards-law-arkansas-state-police-60540-pm-arkansas.jpg)


