Arizona I-10 EB NGCS and CDG Test Section Draft...
15
Arizona I-10 EB NGCS and CDG Test Section Draft Construction Report NGCS and CDG test sections were constructed on I-10 EB in the vicinity of Estrella Parkway interchange in Avondale, Arizona. Both the NGCS and CDG test sections were two lanes wide and 1250 ft in length. The work occurred between April 30 and May 3 rd , 2010. Construction occurred during night shifts due to traffic levels. The NGCS and CDG sections had OBSI levels of 99.2 dBA and 102.1 dBA, respectively. The NGCS section had an IRI of 24 inches per mile. The NGCS surface was 4.3 dBA quieter than the project longitudinal tined texture and was 3.6 dBA quieter than the SR 101 ARFC test section placed for Scottsdale in 2002. Photo of Arizona I-10 NGCS Test Section Texture 2010 ACPA Larry Scofield 6/12/2010
-
Upload
nguyenxuyen -
Category
Documents
-
view
219 -
download
0
Transcript of Arizona I-10 EB NGCS and CDG Test Section Draft...

1
Arizona I-10 EB NGCS and CDG Test Section Draft Construction Report NGCS and CDG test sections were constructed on I-10 EB in the vicinity of Estrella Parkway interchange in Avondale, Arizona. Both the NGCS and CDG test sections were two lanes wide and 1250 ft in length. The work occurred between April 30 and May 3rd, 2010. Construction occurred during night shifts due to traffic levels. The NGCS and CDG sections had OBSI levels of 99.2 dBA and 102.1 dBA, respectively. The NGCS section had an IRI of 24 inches per mile. The NGCS surface was 4.3 dBA quieter than the project longitudinal tined texture and was 3.6 dBA quieter than the SR 101 ARFC test section placed for Scottsdale in 2002.
Photo of Arizona I-10 NGCS Test Section Texture
2010
ACPA Larry Scofield
6/12/2010

2
Introduction Two test sections, a Next Generation Concrete Surface (NGCS) and a Conventional Diamond
Grinding (CDG), were constructed between Friday, April 30 and Tuesday May 4. All construction occurred at night due to the I-10 traffic volumes. Both test sections were two lanes wide by 1250 ft in length as indicated in Figure 1.
This section of highway was an ongoing construction project that had constructed the existing 12 ft wide lanes approximately one year earlier but these lanes were not currently open to traffic. Additional lanes were to be constructed to the outside of the current construction in the near future.
Figure 1 Test Section Construction Layout
Test Section Construction NGCS:
The NGCS test section consisted of grinding the entire test area first with a CDG grinding process to remove the existing longitudinal texture. This was accomplished by grinding with two PC 6000 grinding units. The first PC6000 operated as a conventional CDG grinder using 105 spacers. This unit operated several hundred feet in advance of the second PC6000 which constructed the NGCS texture with a single pass head; which both grooved and ground the pavement creating the NGCS texture. The PC6000 used a 4 ft wide head and 14” in diameter blades.
The NGCS test section construction began Friday night and was completed Saturday night (e.g. Sunday morning). The NGCS construction began in lane 2 of Figure 1 so construction could occur before the allowable traffic control shift.
When the NGCS construction first started it was evident that small aggregate were being plucked out of the concrete by the NGCS grinding process as indicated in Figures 2 & 3. It was also noted that the groove depth was 7/32” which is in excess of the 1/8” to 3/16” specified. At the time it was indicated that the head had been set up for a ¼” groove depth. The first pass of the CDG grinding was the right-most pass of lane 2 (see Figure 1). To remove all the existing longitudinal tining it was necessary for this pass to be approximately 3/8 inch deep on the outside edge. It was also observed that the existing concrete contained a high percentage of smaller aggregate sizes.
Three possible reasons that could be causing the aggregate pop outs are: First, there was significant surface removal prior to the NGCS grind so often times this resulted in ½ or more of the aggregate being removed since the concrete mix had a significant amount of smaller aggregate. Second,
Existing Lane No Traffic
Test Section Lane 2
Test Section Lane 1E.B. Traffic
Existing Traffic Lane
Existing Traffic Lane
1250 ft NGCS Test Section
1250 ft CDG Test Section

3
the aggregate bond is questionable since sufficient surface area still existed on many aggregates to allow adequate bonding, and third, the groove depth was too deep. It was common for the aggregate to breakout from the bottom of the groove suggesting a possible initiation mechanism.
Figure 2 Night Time Photo of Aggregate Being Plucked from Pavement by NGCS Grinding
Figure 3 Daytime Photo of Land Breakage on NGCS Section
4
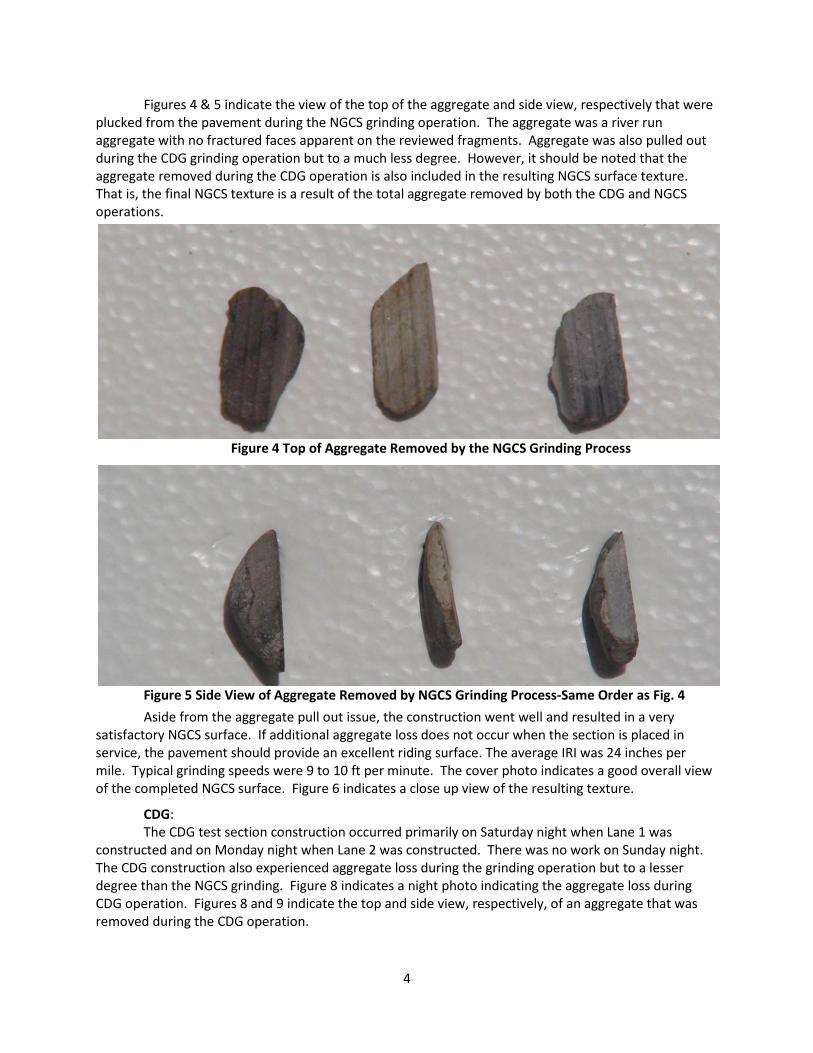
Figures 4 & 5 indicate the view of the top of the aggregate and side view, respectively that were plucked from the pavement during the NGCS grinding operation. The aggregate was a river run aggregate with no fractured faces apparent on the reviewed fragments. Aggregate was also pulled out during the CDG grinding operation but to a much less degree. However, it should be noted that the aggregate removed during the CDG operation is also included in the resulting NGCS surface texture. That is, the final NGCS texture is a result of the total aggregate removed by both the CDG and NGCS operations.
Figure 4 Top of Aggregate Removed by the NGCS Grinding Process
Figure 5 Side View of Aggregate Removed by NGCS Grinding Process-Same Order as Fig. 4
Aside from the aggregate pull out issue, the construction went well and resulted in a very satisfactory NGCS surface. If additional aggregate loss does not occur when the section is placed in service, the pavement should provide an excellent riding surface. The average IRI was 24 inches per mile. Typical grinding speeds were 9 to 10 ft per minute. The cover photo indicates a good overall view of the completed NGCS surface. Figure 6 indicates a close up view of the resulting texture.
CDG: The CDG test section construction occurred primarily on Saturday night when Lane 1 was
constructed and on Monday night when Lane 2 was constructed. There was no work on Sunday night. The CDG construction also experienced aggregate loss during the grinding operation but to a lesser degree than the NGCS grinding. Figure 8 indicates a night photo indicating the aggregate loss during CDG operation. Figures 8 and 9 indicate the top and side view, respectively, of an aggregate that was removed during the CDG operation.

5
Figure 6 Close-Up View of Completed NGCS Texture
Figure 7 Night Photo of Aggregate Removed During CDG Operation

6
Figure 8 Top View of Aggregate Plucked from the Pavement Surface During CDG Operation
Figure 9 Side View of Aggregate Plucked from the Pavement Surface During CDG Operation

7
Aside from the aggregate loss during CDG operation, the grinding went well and the resulting texture is evident in Figure 10. Even though the 105 spacers were used significant fin size resulted as indicated in Figure 11.
Figure 10 Close-Up View of CDG Texture
Figure 11 Night Photo of Large Fins Remaining in the CDG Texture Even with the 105 Spacers

8
Field Testing OBSI Testing
OBSI testing was conducted on Lane 2 on May 5th and on Lane 1 on May 7th. The May 5th testing was conducted within the existing traffic control set up which presented a driving challenge to accomplish. The results of the OBSI testing for both dates are indicated in Figures 12 and 13. The May 7th testing was conducted after the traffic control had been relocated during the night of May 6th when the lane stripe was re-installed. During the May 7th testing only the NGCS section, Lane 1, was tested. The traffic control necessary for the ramp prevented driving in Lane 1 on the CDG section. In addition, debris covered much of the CDG Lane 1 section as indicated in Figure 14.
Figure 12 OBSI Level for Test Sections and Other Arizona Surfaces
Figure 13 1/3 Octave OBSI Spectra for Selected Arizona Surfaces
99.099.4
100.2
102.1102.8
103.2103.9
94
96
98
100
102
104
106
Soun
d In
tens
ity L
evel
, dB
A
Pavement Section
NGCSLane 1
CDG
Typical 4 -5 Yr Old
ARFC
2002 ARFC Test
Section
Longitudinal Tining
NGCS Lane 2
65
70
75
80
85
90
95
100
105
500 630 800 1000 1250 1600 2000 2500 3150 4000 5000
Soun
d In
tens
ity L
evel
, dB
A
1/3 Octave Band Center Frequency, Hz
NGCS Lane 2
CDG
Longitudinal Tined
2002 ARFC
Typical ARFC
NGCS Lane 1
9
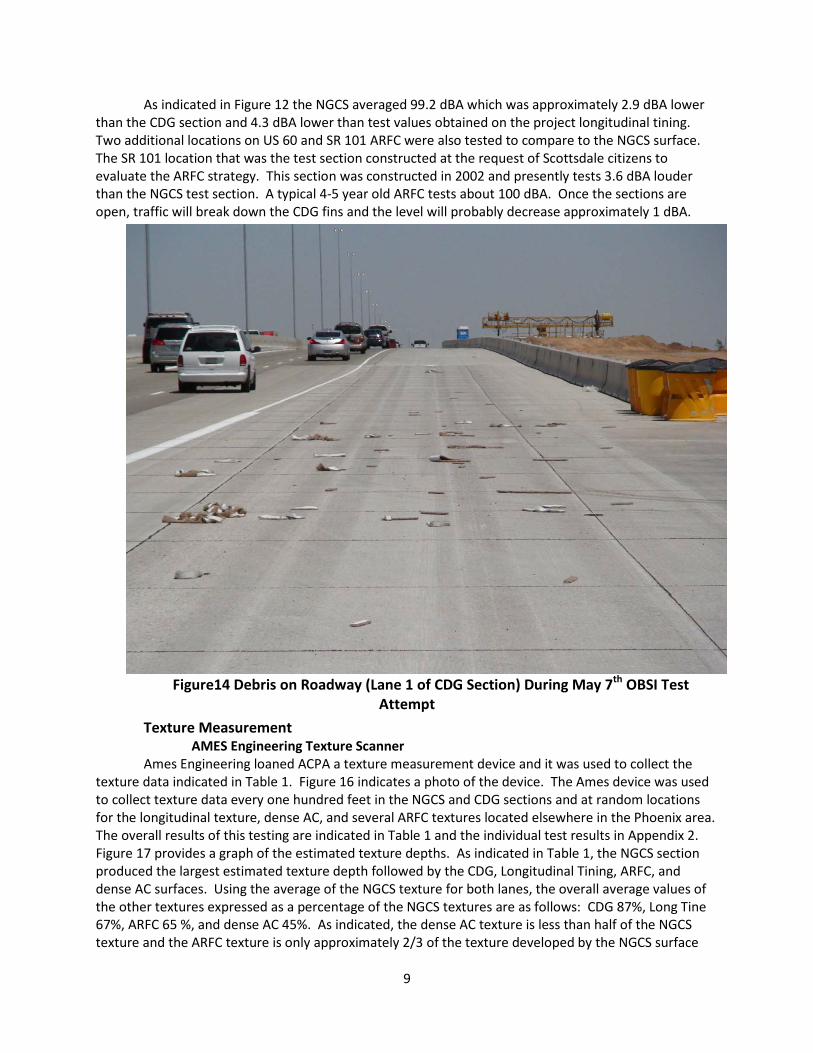
As indicated in Figure 12 the NGCS averaged 99.2 dBA which was approximately 2.9 dBA lower than the CDG section and 4.3 dBA lower than test values obtained on the project longitudinal tining. Two additional locations on US 60 and SR 101 ARFC were also tested to compare to the NGCS surface. The SR 101 location that was the test section constructed at the request of Scottsdale citizens to evaluate the ARFC strategy. This section was constructed in 2002 and presently tests 3.6 dBA louder than the NGCS test section. A typical 4-5 year old ARFC tests about 100 dBA. Once the sections are open, traffic will break down the CDG fins and the level will probably decrease approximately 1 dBA.
Figure14 Debris on Roadway (Lane 1 of CDG Section) During May 7th OBSI Test
Attempt
Texture Measurement AMES Engineering Texture Scanner
Ames Engineering loaned ACPA a texture measurement device and it was used to collect the texture data indicated in Table 1. Figure 16 indicates a photo of the device. The Ames device was used to collect texture data every one hundred feet in the NGCS and CDG sections and at random locations for the longitudinal texture, dense AC, and several ARFC textures located elsewhere in the Phoenix area. The overall results of this testing are indicated in Table 1 and the individual test results in Appendix 2. Figure 17 provides a graph of the estimated texture depths. As indicated in Table 1, the NGCS section produced the largest estimated texture depth followed by the CDG, Longitudinal Tining, ARFC, and dense AC surfaces. Using the average of the NGCS texture for both lanes, the overall average values of the other textures expressed as a percentage of the NGCS textures are as follows: CDG 87%, Long Tine 67%, ARFC 65 %, and dense AC 45%. As indicated, the dense AC texture is less than half of the NGCS texture and the ARFC texture is only approximately 2/3 of the texture developed by the NGCS surface

10
Outflow Meter Results Outflow meter testing was conducted on the three concrete textures. A photo of the Outflow
meter is shown in Figure 19. The time to remove the specified amount of water from the outflow meter is an indication of the texture depth in the surface. The time for the NGCS surface was 2.6 seconds, the CDG surface 3.0 seconds, and the longitudinal tined surface 6.7 seconds. The less time required, the greater the mean texture depth.
TABLE 1 Ames Texture Meter Results (mm)
Figure 15 Ames Engineering Texture Meter
Surface Type Long Tined Dense AC ARFCLN 1 LN 2 LN 1 LN 2
MPD (mm) 1.64 1.58 1.37 1.57 1.17 0.59 0.93
ETD (mm) 1.51 1.47 1.30 1.46 1.13 0.67 0.97
RMS 0.06 0.06 0.02 0.02 0.05 0.01 0.02
Outflow Time (sec) 2.60 3.00 6.67
NGCS CDG

11
Figure 16 Estimated Texture Depth From Ames Texture Scanner (mm)
Figure 17 Photo of Outflow Meter Testing
1.511.47
1.30
1.46
1.13
0.97
0.67
0.00
0.20
0.40
0.60
0.80
1.00
1.20
1.40
1.60
Estim
ated
Tex
ture
Dep
th (
mm
)
NGCSCDG
LongTined ARFC
ACDense
LN 1LN 1 LN 2 LN 2

12
Circular Track Texture Meter (CT Meter) CT Meter testing was conducted on the NGCS section at 100 ft intervals at the same locations as
the Ames Texture Meter readings. The results of this testing are indicated in Table 2 and a photo of the C.T. Meter in Figure 18.
Table 2 CT Meter Texture Results
Station 1+00 2+00 3+00 4+00 5+00 6+00 7+00 8+00 9+00 10+00
ETD
Figure 18 Photo of C.T. Meter in Test Position
Profile Measurement
An Ames Lightweight Profiler was used to measure the surface profile of the NGCS test sections. The RoLineTM sensor was used to ensure that-aliasing in the signal processing would not occur as a result of the longitudinal grooves. The results of this testing are indicated in Table 3. The average of the NGCS section was an IRI of 24 inches per mile.
TABLE 3 IRI PROFILE RESULTS (inches per mile) Segment Length
(ft)
Lane 1 Lane 2
LWP RWP LWP RWP
528 32.2 19.04 33.15 28.70
528 20.45 17.13 15.99 22.71
194 16.53 18.16 16.19 28.41

Appendix 1 Construction Photos
13
Penhall Equipment
Figure 1 Night Photo of PC6000 Grinding Equipment
CDG Grinding Head
Figure 2 Photo of CDG Grinding Head with 105 Spacers
14
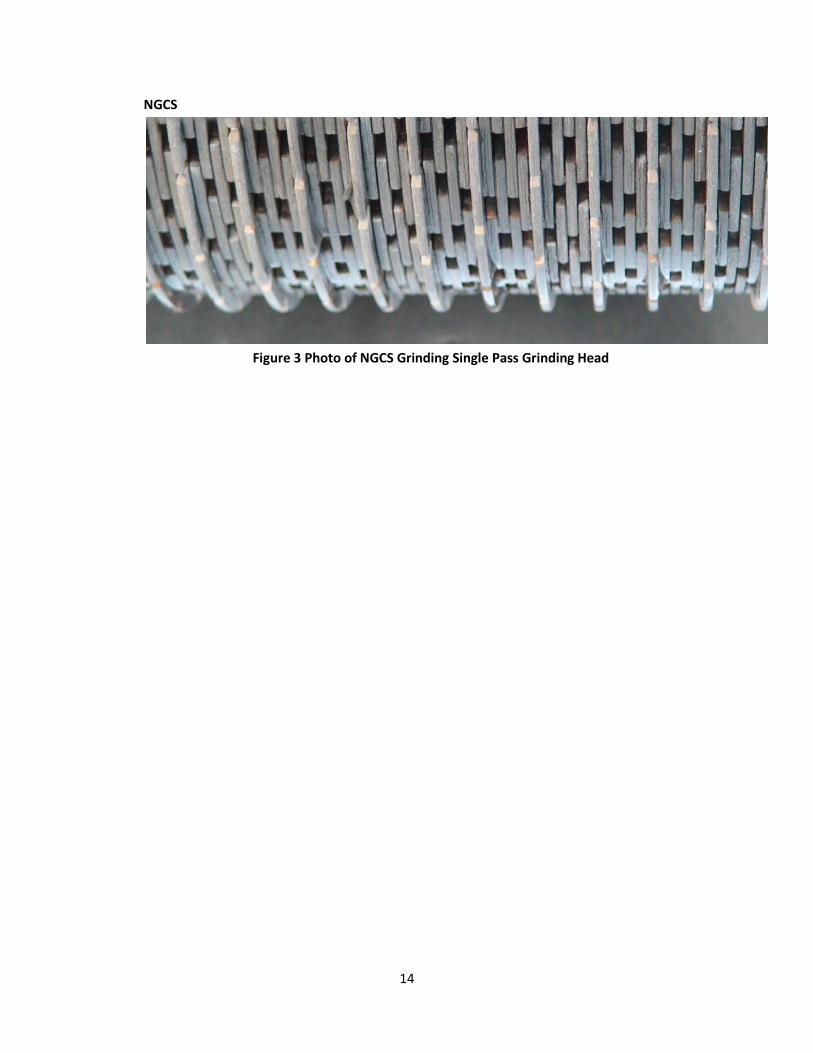
NGCS
Figure 3 Photo of NGCS Grinding Single Pass Grinding Head

Appendix 2 Ames Texture Data
15