Argentina’s Agricultural Policies, Trade, and Sustainable ... · l Agriculture By Marcelo...
90
By Marcelo Regúnaga and Agustín Tejeda Rodriguez Issue Paper No. 55 Agriculture March 2015 Argentina’s Agricultural Policies, Trade, and Sustainable Development Objectives
Transcript of Argentina’s Agricultural Policies, Trade, and Sustainable ... · l Agriculture By Marcelo...

By Marcelo Regúnaga and Agustín Tejeda Rodriguez
Issue Paper No. 55
AgricultureMarch 2015
Argentina’s Agricultural Policies, Trade, and Sustainable Development Objectives


l Agriculture
By Marcelo Regúnaga and Agustín Tejeda Rodriguez
Argentina’s Agricultural Policies, Trade, and Sustainable Development Objectives
Issue Paper 55
March 2015

ii M. Regúnaga and A. Tejeda Rodriguez - Argentina’s Agricultural Policies, Trade, and Sus-tainable Development Objectives
Published by
International Centre for Trade and Sustainable Development (ICTSD)International Environment House 27 Chemin de Balexert, 1219 Geneva, Switzerland
Tel: +41 22 917 8492 Fax: +41 22 917 8093E-mail: [email protected] Internet: www.ictsd.org
Publisher and Director: Ricardo Meléndez-OrtizProgramme Team: Jonathan Hepburn and Paolo Ghisu
AcknowledgmentsICTSD wishes to gratefully acknowledge the support of its core and thematic donors, including the UK Department for International Development (DFID); the Swedish International Development Cooperation Agency (SIDA); the Netherlands Directorate General of International Cooperation (DGIS); the Ministry of Foreign Affairs of Denmark, Danida; the Ministry for Foreign Affairs of Finland; and, the Ministry of Foreign Affairs of Norway.
ICTSD and the authors are grateful to all those who commented on, or otherwise contributed to, earlier drafts of the paper, including Ramiro Costa (Bolsa de Cereales), Eugenio Diaz-Bonilla (International Food Policy Research Institute), Nelson Illescas (Fundación Instituto para las Negociaciones Agrícolas Internacionales), Ariel Nicolás Jorge (Fundación Instituto para las Negociaciones Agrícolas Internacionales), Ekaterina Krivonos (Food and Agriculture Organization) and Martin Piñeiro (Consejo Argentino para las Relaciones Internacionales).
For further information on ICTSD and other work in this theme see www.ictsd.org
Comments and feedback on this publication can be sent to Paolo Ghisu ([email protected]) or to ICTSD’s Managing Director for Communications and Strategy at [email protected]
Citation: Regúnaga, Marcelo; Tejeda Rodriguez, Agustín (2015); Argentina’s Agricultural Trade Policy and Sustainable Development; Issue Paper No. 55; International Centre for Trade and Sustainable Development, Geneva, Switzerland, www.ictsd.org.
Copyright ICTSD, 2014. Readers are encouraged to quote and reproduce this material for educational, non-profit purposes, provided the source is acknowledged. This work is licensed under the Creative Commons Attribution-Non-commercial-No-Derivative Works 3.0 License. To view a copy of this license, visit http://creativecommons.org/licenses/byncRnd/3.0/ or send a letter to Creative Commons, 171 Second Street, Suite 300, and San Francisco, California, 94105, USA. ISSN 1817.

iiiAgricultural Trade and Sustainable Development
CONTENTS
LIST OF ACRONYMS vFOREWORD viiEXECUTIVE SUMMARY viii1. INTRODUCTION 1 1.1. The economic, social and environmental importance of the agri-food sector 1
1.2. Main characteristics of Argentina’s production systems 4
2. MAIN OBJECTIVES OF THE AGRICULTURAL POLICIES OF THE LAST DECADE 6 2.1. Maintaining domestic food prices at relatively low levels 7
2.2. Controlling inflation by decoupling the evolution of domestic prices for agricultural products from those corresponding to the international markets 7
2.3. Generating tax revenues to finance increases in public spending and achieve fiscal surpluses 8
2.4. Focusing tax collection on resources administered by the National Executive Branch (NEB) 8
2.5. Supporting family agriculture and small farmers 8
2.6. Conserving natural resources and the environment 8
2.7. Supporting innovation, health and food quality 9
2.8. Other specific policies to support agricultural production 9
3. DESCRIPTION OF THE MAIN POLICY TOOLS USED 10 3.1. Export taxes and export tax differentials 10
3.2. Quantitative restrictions and other nontariff barriers on export (Export NTBs) 11
3.3. Tariff and non-tariff barriers on import 12
3.4. Fixation of maximum prices and other price controls in the domestic market 13
3.5. Other taxes on domestic commerce 13
3.6. Compensations 14
3.7. Monetary policies and differential exchange rates. Limitations on the foreign exchange market 14
3.8. Limitations on transactions in the grain futures markets 15
3.9. Biofuel policies 15
3.10. Legislation on forests and land 16
3.11. General services for agriculture (infrastructure, agricultural research and development, sanitation and others) 16
4. EFFECTS OF THE POLICIES ON THE MAIN VARIABLES AND OBJECTIVES OF SUSTAINABLE DEVELOPMENT 18
4.1. Evolution of the main indicators of a general nature 18
4.2. Impact of the agricultural policies on the main variables of the agricultural sector 27

iv M. Regúnaga and A. Tejeda Rodriguez - Argentina’s Agricultural Policies, Trade, and Sus-tainable Development Objectives
5. RECOMMENDATIONS FOR ARGENTINA’S AGRO-INDUSTRIAL POLICIES 46 5.1. Context of policies to promote growth in agriculture, aimed at eliminating
the current deprotection 47
5.2. Argentina must integrate itself into the world 49
5.3. Increasing productivity and efficiency in the use of natural resources 49
5.4. Improving sanitation and quality standards 50
5.5. Promoting the conservation of natural resources and good agricultural and livestock farming practices 50
5.6. Increasing investments in logistics and transport infrastructure 51
5.7. Strengthening social and support programmes for rural communities and agro-industrial SMBs 51
BIBLIOGRAPHY 52ENDNOTES 55APPENDIX 61

vAgricultural Trade and Sustainable Development
LIST OF ACRONYMS
AFIP Administración Federal de Ingresos Públicos (The Argentine Federal Tax Authority)
AGN Auditoría General de la Nación (Federal Comptroller’s Office)
AL Automatic licences for import
ANAV Academia Nacional de Agronomía y Veterinaria (National Academy of Agricultural and Veterinary Sciences)
CARBIO Cámara Argentina de Biocombustibles (Argentine Chamber of Biofuels)
CET Common External Tariff employed by MERCOSUR
CRA Confederaciones Rurales Argentinas (Argentine Rural Confederations)
DJAI Declaraciones juradas anticipadas de importación (Sworn statements prior to import)
DSB The Dispute Settlement Body of the WTO
ERAMA Escenario de Referencia Agroindustrial Mundial y Argentino (Agricultural Reference Scenario for the World and Argentina) prepared by the INAI
EU European Union
Export NTB Non-tariff barrier on exports
Extended This is the market value of the final goods and services produced by theAgricultural GDP primary sector, plus those corresponding to processed food and agro-
industry.
FADA Fundación Agropecuaria para el Desarrollo de Argentina (Agricultural Foundation for the Development of Argentina)
FAO Food and Agriculture Organization of the United Nations
FAS Price “Free along side”: the price of grain delivered to the ports (the domestic reference markets at the ports)
FOB Price “Free on board”: the export price, delivered to the steamship
FTA Free Trade Agreement
FTAA Free Trade Area of the Americas
GAP Good Agricultural Practices
GDP Gross Domestic Product
GHG Greenhouse gas
HDI Human Development Index calculated by the UNDP
IADB Inter-American Development Bank

vi M. Regúnaga and A. Tejeda Rodriguez - Argentina’s Agricultural Policies, Trade, and Sus-tainable Development Objectives
INAI Instituto de Negociaciones Agrícolas Internacionales (Institute of International Agricultural Negotiations)
INDEC Instituto Nacional de Estadística y Censos (National Institute of Statistics and Censuses)
INTA Instituto Nacional de Tecnología Agropecuaria (National Institute of Agricultural Technology)
MATba Mercado a Término de Buenos Aires (Buenos Aires Futures Market)
MERCOSUR Mercado Común del Sur (Common Southern Market), which includes Argentina, Brazil, Paraguay, Uruguay and Venezuela
MEYP Ministerio de Economía y Producción (Ministry of Economy and Production)
MINAGRI Ministerio de Agricultura, Ganadería y Pesca de Argentina (Argentine Ministry of Agriculture, Livestock and Fishing)
MIO Manufactures of industrial origin
NAL Non-automatic licences for import
NEB National Executive Branch
NTB Non-tariff barrier on imports
OECD Organisation for Economic Co-operation and Development
ONCCA Oficina Nacional de Control Comercial Agropecuario (National Office of Agricultural Trade Control) of MINAGRI
PEA Plan Estratégico Agroalimentario y Agro-industrial Participativo y Federal (Cooperative Federal Agri-Food and Agro-Industrial Strategic Plan)
PROSAP Programa de Servicios Agrícolas Provinciales (Provincial Agricultural Services Programme)
REO Registry of Export Operations
SENASA Servicio Nacional de Sanidad y Calidad Agroalimentaria (National Agri-Food and Sanitary Quality Service)
UCESCI Unidad de Coordinación y Evaluación de Subsidios al Consumo Interno (Domestic Consumption Subsidy Coordination and Evaluation Unit)
UNDP United Nations Development Programme
USA The United States of America
USDA US Department of Agriculture
VAT Value Added Tax
WTO World Trade Organization

viiAgricultural Trade and Sustainable Development
FOREWORD
Trade policy, and agricultural trade policy in particular, has an important contribution to make in addressing sustainable development challenges – as has been acknowledged repeatedly in the statements and proposals made by governments at the World Trade Organization (WTO). In particular, carefully designed agricultural trade policies can contribute towards ensuring that economic growth occurs in a sustainable and equitable manner, and can help overcome food insecurity and poverty, especially in rural areas. While reforms under the ongoing Doha Round of trade talks have widely been seen as a significant step toward achieving these objectives, governments and other stakeholders increasingly recognize that there is a need to ensure compatibility between domestic agricultural trade policies and broader public policy goals.
Over the last few years, ICTSD has undertaken a series of studies in major agricultural trading powers with the aim of examining how domestic agricultural policies relate to sustainable development objectives that have been agreed at the international level, as well as to global governance frameworks such as the rules on trade at the WTO.
Furthermore, the Centre has sought to facilitate policy dialogues on how policy trajectories in Brazil, China, the European Union, India, and the United States relate to sustainable development objectives both at the national level and, through their impact on trade, in other countries. In addition to reviewing how current policies may affect internationally agreed goals in areas such as food security, these discussions have sought to provide an opportunity for policy-makers and experts to share analysis on the implications of new aspects of the policy environment – such as the challenges posed by high and volatile food prices.
Argentina’s policies on agricultural trade generate particular interest among policy-makers and analysts around the world, given their implications for food security and agriculture markets. The country is one of the largest net exporters of agricultural goods, particularly cereals, oilseeds and biofuels. Furthermore, Argentina’s participation in a number of regional trade agreements such as MERCOSUR raise additional issues about the implications of these preferential agreements for the future of the country’s agricultural sector and for the global agricultural trading system as a whole.
The study that follows seeks to provide policy-makers, negotiators, and other stakeholders with an impartial, evidence-based assessment of the extent to which Argentina’s current farm trade policies are successful in achieving economic, social and environmental objectives, including those relating to areas such as food security, poverty reduction, environmental sustainability and climate change. The paper places this analysis in the context of current multilateral rules and on-going negotiations on farm trade at the WTO, as well as regional and bilateral agreements and negotiations to which Argentina is party.
I am convinced that, as such, this study represents a significant contribution to the evolving discussion in this area.
Ricardo Meléndez-Ortiz Chief Executive, ICTSD

viii M. Regúnaga and A. Tejeda Rodriguez - Argentina’s Agricultural Policies, Trade, and Sus-tainable Development Objectives
EXECUTIVE SUMMARY
Introduction and scope of the study
The agro-industrial sector is of strategic importance to Argentina, due to its significant impact on Gross Domestic Product, employment and territorial development, and also because it constitutes a key element in the country’s international positioning as a relevant and reliable provider of food.
Considering this importance, the main impacts of the agricultural policies implemented in Argentina during the last decade are analysed in relation to both aspects. The first part of the study describes the objectives of the policies and the instruments used, followed by an analysis of their main impacts. Lastly, recommendations are made in order to better contribute to Argentina’s sustainable development and world food security, given that the two objectives can be complementary and compatible.
Main objectives and instruments of the agricultural policies of the last decade
Agricultural policies were a significant part of the import substitution strategy prioritized by the government. This strategy assumes that domestic demand, supplied by local production, should be the main source of the country’s social and economic growth, and dismisses the importance of exports and trade-opening for improving the competitiveness and performance of the economy over the medium and long terms.
On the basis of this strategy, the vision for the agricultural sector prioritized its roles as: i) a provider of low-priced food; ii) an instrument for limiting inflation in food prices; and iii) a significant source of tax revenues. It did not prioritize its importance in national economic growth, increased exports, job creation or the social and economic development of the poorest regions of the country based on genuine production activities.
The main objectives and the instruments used to achieve them were as follows:
a) Maintaining the domestic prices of agricultural products at lower levels than export prices in order to provide low-cost food and control inflation of the food basket, decoupling the evolution of domestic prices from prices in the international markets. The main measures were: high export taxes, quantitative export restrictions, maximum prices and other domestic market controls, partial compensation for producers and manufacturers’ income affected by the price controls, and devaluation of the export exchange rate at a slower pace than the increase in domestic consumer prices.
b) Protecting the local production of industrial manufacturing through: different net exchange rates (35% import tariff for the most-protected industrial sectors, 20–35% export taxes for the main grains), non-tariff barriers to the export of food and the import of industrial goods, and restrictions to currency access in order to limit imports.
c) Increasing fiscal revenues through high rates taxes imposed on agricultural products’ exports: soy 35%, sunflower seed 32%, wheat 23%, corn and sorghum 20%, and beef 15%. Regional products and industrial manufactures were taxed at 5%. In each chain, the export of primary products was taxed at a higher rate than processed products in order to promote local value added.
d) Supporting small farmers through programmes aimed at facilitating their access to technology, markets and credit. However, trade policies did not differentiate according to size.

ixAgricultural Trade and Sustainable Development
e) Public resources destined for agricultural research and expansion were increased. The transfer of technology was prioritized. Research in public assets, such as knowledge of the capacity for use and management of natural resources and post-harvest losses, was not prioritized. A proposed Seed Law that would provide better protection for intellectual property was not approved, nor was the enforcement of current legislation improved, in order to promote increased private investment in this strategic sector.
f) Conserving natural and environmental resources. Legislation was approved to protect native forests in order to limit uncontrolled deforestation and to provide incentives for reforestation. The provinces were required to establish land use regulations for native forests for the rational use of natural resources.
g) Policies were implemented to promote substitution of the domestic consumption of fossil fuels with biofuels, which improve carbon balance (mandatory blends of biodiesel and bioethanol), and to promote the export of biodiesel, diversifying the energy, productive and trade matrices.
Main impacts of the agricultural policies implemented
General
Annual inflation rates were very high during almost the entire period analysed, substantially higher than those of the rest of the developed and developing world, in spite of the policies aimed at limiting increases in food prices. The primary factor that accounts for the high inflation rates during recent years, which has been dismissed by the authorities, is the increase in public spending at a pace much higher than the growth in tax revenues, without the ability to rely on other adequate sources of financing. Furthermore, empirical evidence has shown that price controls on primary products do not guarantee the stability of food prices, given that in many of them (e.g. wheat), the share of the primary product in the total cost of the food item (bread, cookies) is less than 10%; that is, of little significance if the other costs increase (salaries, energy, other supplies, transport, and distribution margins). In other cases (e.g. beef), the medium-term disincentives to production resulted in notable drops in supply, which created substantial increases in domestic prices.
In the last three years, inflation rates were extremely high and growing, with negative impacts on poverty and other social indicators. The initial strong economic growth improved the poverty situation estimated on the basis of income, but was only partially reflected in the HDI and the worldwide ranking calculated by the UNDP. The HDI improved throughout the period, but in other countries it improved to a greater extent. This is why Argentina placed lower in the worldwide ranking for 2010–2013 than it did at the end of the nineties.
In spite of the import substitution strategy, the negative trade balance in the manufacturing industry grew significantly during 2000–2013 (from 11 to 30 thousand million dollars). Agro-industrial exports continue to be of strategic importance in making global growth viable, but they were disincentivized and limited, which resulted in a crisis in the external sector.
Argentine trade policy has garnered severe criticism from its main trading partners; in MERCOSUR, due to the obstacles to intra-zone trade and the country’s reluctance to negotiate agreements with the principal participants in international trade. Other countries affected by the non-tariff barriers have resorted to retaliatory measures (USA, China) or to the international courts (DSU) to challenge the import limitations. These filings resulted in a WTO ruling against Argentina.
The implemented policies reduced the domestic prices paid to producers in relation to export prices. The primary factors were export taxes and restrictions, as well as the gradual appreciation

x M. Regúnaga and A. Tejeda Rodriguez - Argentina’s Agricultural Policies, Trade, and Sus-tainable Development Objectives
of the exchange rate, especially during the last five years. Furthermore, the lack of transparency and predictability in the application of these restrictions, the frequent changes in the regulations, and the delays in tax refunds increased the hidden costs and transaction costs in the chains, creating highly unstable prices, extraordinary margins and transfers of income in the detriment of producers. In other words, they resulted in poor performance of the agricultural markets.
An estimated overall measurement of the support received by producers calculated by the OECD (PSE) shows that Argentina’s PSEs are notably negative: for 2011, the PSE was estimated at an average of -43% for the principal products, in comparison with positive PSEs for Latin American and industrialized countries. Trade deprotection of Argentine agriculture is very high and unsustainable.
The domestic price structure in effect during the past five years discouraged production growth, especially in those products with export restrictions (wheat, beef and milk). The current policies’ context limits the possibilities for growth in agriculture and livestock farming. Projections simulating the continuation of current policies show that grain production would increase by only 2.7% per year, reaching 125 million tonnes by 2020 (only half of the goal established by the Government in the strategic agricultural plan PEA2). Similar comments apply to beef and dairy production.
In recent years, surveys show a drop in the use of improved technologies and those aimed at conserving resources, such as crop rotation, replacement of the nutrients extracted from the soil, the use of selected seeds and other technological supplies, and the use of other good agricultural practises.
The trade deprotection policies make no allowance for differentiation by size. This has resulted in the concentration of the production structure: an increase in the size of the units and a decrease in the number of producers. Policies to support small producers were insufficient to limit this process.
Recommendations
The lessons learned make it possible to affirm that Argentina’s sustainable development and its contribution to global food security could improve through changes in the vision and objectives for the agro-industrial sector, which must be agreed upon by all of the involved social and economic sectors as State Policies.
The new proposed vision is as follows: the agro-industrial sector is one of the strategic components of a programme for sustainable social and economic growth in Argentina, genuine job creation and harmonious development throughout the national territory.
The false dichotomy between exporting and supplying the domestic market must be discarded. The national provisions of food will be ensured, with prices lower than their international equivalents, if there are incentives to increase production and export significant volumes of all the products in the sector.
Furthermore, the competitiveness of the manufacturing sectors must be based on innovation and on their efficient integration into global value chains, and not on low salaries, which require domestic food prices lower than those in effect in other countries that do not protect agriculture. Agricultural policies must not be the basis of inflation control, nor should they be designed to create a source of fiscal revenues with tax rates substantially higher than those applied to other economic sectors, because this has an extremely negative impact on the regional distribution of income and on regional employment.

xiAgricultural Trade and Sustainable Development
The general framework of the proposals is a development strategy that considers the three dimensions of sustainability: economic, social and environmental. They are as follows:
1. Context of policies to promote growth in agro-industry: Considers:
i) Eliminating trade deprotection on agricultural activities. This involves: eliminating export tariffs and other government interference in domestic and foreign trade; substituting the taxes levied on foreign and domestic trade and financial transactions with co-partnered taxes imposed on profit, assets and VAT; reducing taxes on the import of certain capital goods and strategic supplies.
ii) Promoting good performance of the agricultural markets. This involves: adopting clear, predictable and stable regulations in place of the arbitrary exercise of administrative authority; and strengthening the public agricultural sector in the areas of information and trade control.
iii) Creating a macroeconomic environment aimed at promoting investment and growth. This involves: macroeconomic stability; prudent, sustainable and countercyclical fiscal behaviour; and preventing a repeat of the cyclical episodes of exchange rate lag and excessive foreign indebtedness.
2. Argentina must integrate itself into the world. This involves:
i) Normalizing financial relations with the rest of the world.
ii) Inserting itself dynamically in the international markets by actively participating in international FTA negotiations with the relevant markets and by strengthening MERCOSUR.
iii) Increasing trade promotion with a relevant foreign trade promotion agency.
3. Increasing productivity and efficiency in the use of natural resources. This involves:
i) Substantially increasing the intensity of public investment in R&D, giving high priority to biotechnology, nanotechnology, ICT, natural resources and aspects related to efficiency in every link of the value chains.
ii) Promoting a significant increase in private investment through an improved legislative context regarding intellectual property rights and legal security.
iii) Achieving efficient coordination of both types of investments through a strategic plan for a joint public-private system, which involves new management models in the public sector.
4. Improving health and quality standards through the institutional redesign and professionalization of SENASA and INAL in order to gain worldwide recognition and trust; achieving better coordination between the activities of the public and private sectors.
5. Promoting the conservation of natural resources and good agricultural and livestock farming practices. This involves: significantly increasing the public resources aimed at generating greater knowledge of the capacity and sustainable use of natural resources; establishing a Federal Land and Water Conservation Policy for all agricultural production; granting economic incentives and promoting the use of good agricultural practises and forestation in fragile environments.

xii M. Regúnaga and A. Tejeda Rodriguez - Argentina’s Agricultural Policies, Trade, and Sus-tainable Development Objectives
6. Increasing investment in logistics and transport infrastructure to implement an overall long-term strategy mutually agreed upon between the various jurisdictions and participants. This involves: rail transport of cargo; the national highway network; rural roads; transport by water; and investments in the use of water for crop irrigation and drinking water for livestock.
7. Strengthening social and support programmes for rural communities and agro-industrial small and medium sized enterprises. This involves strengthening and professionalizing diverse programs that have demonstrated success in times past, such as the Social Agricultural Programme, Rural Change, Pro-Orchard and various technical and financial assistance programmes for small farmers co-financed with funds from IFAD, IADB and other development institutions and agencies. It is additionally proposed to arrange a transparent food aid policy (food card) targeted at populations below the poverty line; and to redress the priorities of public social investment, bearing in mind the needs of rural communities in the investment decisions with regard to rural road infrastructure, education, health, communications and electric power, given that these areas exhibit the most significant problems of poverty and human development.
1Agricultural Trade and Sustainable Development
1. INTRODUCTION
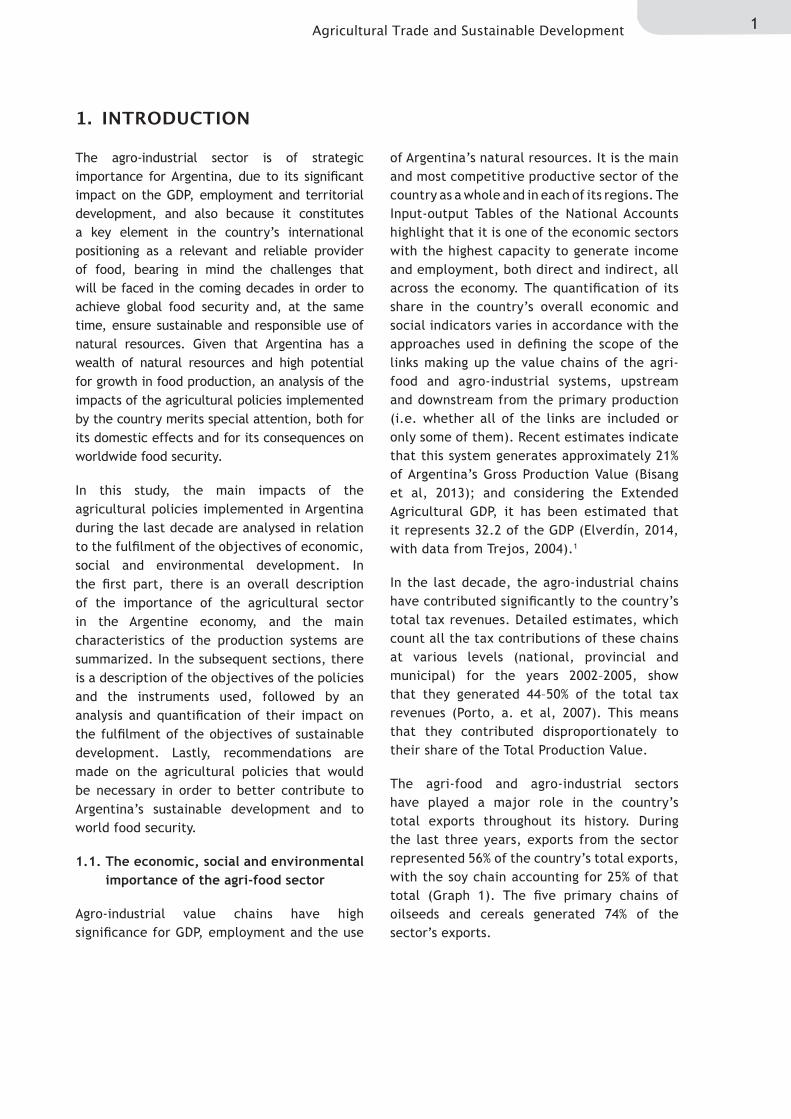
The agro-industrial sector is of strategic importance for Argentina, due to its significant impact on the GDP, employment and territorial development, and also because it constitutes a key element in the country’s international positioning as a relevant and reliable provider of food, bearing in mind the challenges that will be faced in the coming decades in order to achieve global food security and, at the same time, ensure sustainable and responsible use of natural resources. Given that Argentina has a wealth of natural resources and high potential for growth in food production, an analysis of the impacts of the agricultural policies implemented by the country merits special attention, both for its domestic effects and for its consequences on worldwide food security.
In this study, the main impacts of the agricultural policies implemented in Argentina during the last decade are analysed in relation to the fulfilment of the objectives of economic, social and environmental development. In the first part, there is an overall description of the importance of the agricultural sector in the Argentine economy, and the main characteristics of the production systems are summarized. In the subsequent sections, there is a description of the objectives of the policies and the instruments used, followed by an analysis and quantification of their impact on the fulfilment of the objectives of sustainable development. Lastly, recommendations are made on the agricultural policies that would be necessary in order to better contribute to Argentina’s sustainable development and to world food security.
1.1. The economic, social and environmental importance of the agri-food sector
Agro-industrial value chains have high significance for GDP, employment and the use
of Argentina’s natural resources. It is the main and most competitive productive sector of the country as a whole and in each of its regions. The Input-output Tables of the National Accounts highlight that it is one of the economic sectors with the highest capacity to generate income and employment, both direct and indirect, all across the economy. The quantification of its share in the country’s overall economic and social indicators varies in accordance with the approaches used in defining the scope of the links making up the value chains of the agri-food and agro-industrial systems, upstream and downstream from the primary production (i.e. whether all of the links are included or only some of them). Recent estimates indicate that this system generates approximately 21% of Argentina’s Gross Production Value (Bisang et al, 2013); and considering the Extended Agricultural GDP, it has been estimated that it represents 32.2 of the GDP (Elverdín, 2014, with data from Trejos, 2004).1
In the last decade, the agro-industrial chains have contributed significantly to the country’s total tax revenues. Detailed estimates, which count all the tax contributions of these chains at various levels (national, provincial and municipal) for the years 2002–2005, show that they generated 44–50% of the total tax revenues (Porto, a. et al, 2007). This means that they contributed disproportionately to their share of the Total Production Value.
The agri-food and agro-industrial sectors have played a major role in the country’s total exports throughout its history. During the last three years, exports from the sector represented 56% of the country’s total exports, with the soy chain accounting for 25% of that total (Graph 1). The five primary chains of oilseeds and cereals generated 74% of the sector’s exports.

2 M. Regúnaga and A. Tejeda Rodriguez - Argentina’s Agricultural Policies, Trade, and Sus-tainable Development Objectives
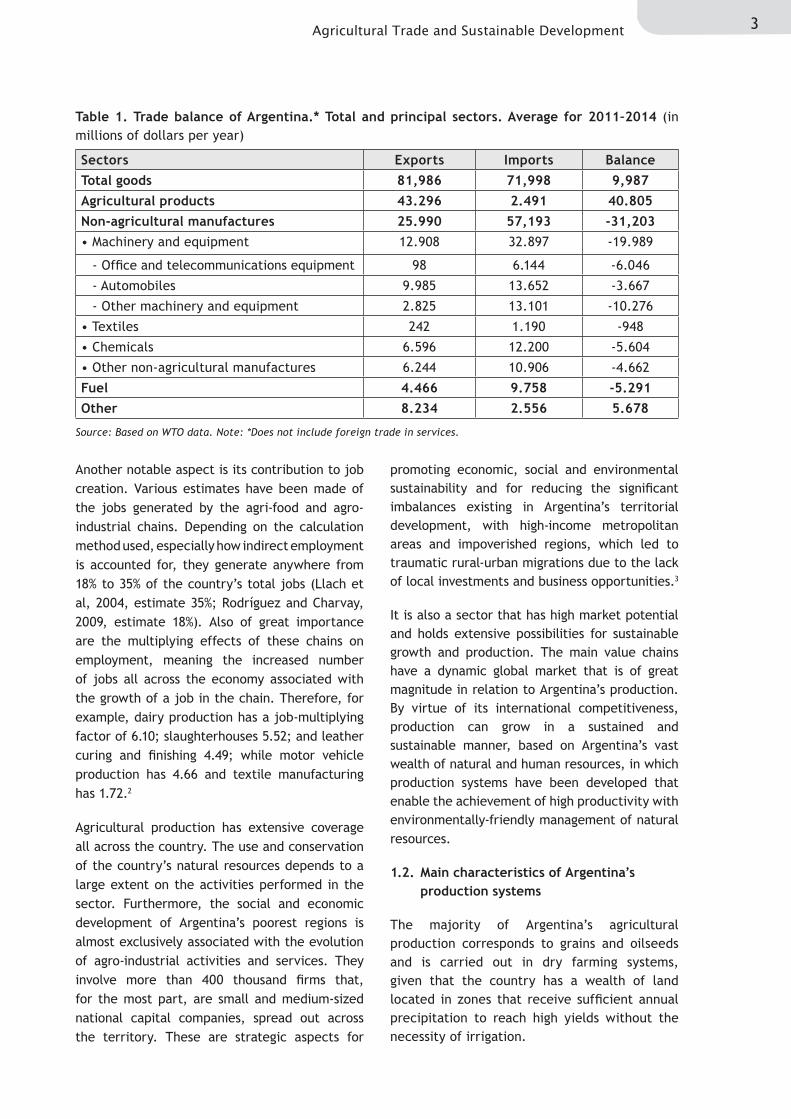
Its strategic importance in the foreign trade of goods is even greater if one considers that it is the main and almost exclusive sector that is a net generator of foreign exchange, resources that condition the possibilities of the country’s overall growth: the relationship between export and import of goods from the sector is more than 10:1, in contrast to what is happening in the manufacturing and energy
industries, sectors in which the net balance of foreign exchange is negative (Table 1). To make Argentina’s overall growth viable, the agri-food sector contributes toward offsetting the negative trade balance associated with the growth of the other sectors, as well as helping offset possible negative balances in the capital account (for example, for the payment of debt services).
Graph 1. Value structure of the goods exported from Argentina.* Average for 2011–2013 (in percentages of value)
Share of the agro-industrial sector in the total value of exported goods
Share of the main chains in the total value of exported goods from the agro-industrial sector
Source: Created on the basis of WTO and Trademap data.
Note: *Does not include service exports
Agricultural
products
Minerals and
combustibles
Manufactured
goods
34%
10%
56%
Soy
Corn
Wheat
Beef
Milk
Grapes
Sunflower
Barley
Other
49%
13%
6%5%
4%
14%3%
3%
3%
3Agricultural Trade and Sustainable Development
Another notable aspect is its contribution to job creation. Various estimates have been made of the jobs generated by the agri-food and agro-industrial chains. Depending on the calculation method used, especially how indirect employment is accounted for, they generate anywhere from 18% to 35% of the country’s total jobs (Llach et al, 2004, estimate 35%; Rodríguez and Charvay, 2009, estimate 18%). Also of great importance are the multiplying effects of these chains on employment, meaning the increased number of jobs all across the economy associated with the growth of a job in the chain. Therefore, for example, dairy production has a job-multiplying factor of 6.10; slaughterhouses 5.52; and leather curing and finishing 4.49; while motor vehicle production has 4.66 and textile manufacturing has 1.72.2
Agricultural production has extensive coverage all across the country. The use and conservation of the country’s natural resources depends to a large extent on the activities performed in the sector. Furthermore, the social and economic development of Argentina’s poorest regions is almost exclusively associated with the evolution of agro-industrial activities and services. They involve more than 400 thousand firms that, for the most part, are small and medium-sized national capital companies, spread out across the territory. These are strategic aspects for
promoting economic, social and environmental sustainability and for reducing the significant imbalances existing in Argentina’s territorial development, with high-income metropolitan areas and impoverished regions, which led to traumatic rural-urban migrations due to the lack of local investments and business opportunities.3
It is also a sector that has high market potential and holds extensive possibilities for sustainable growth and production. The main value chains have a dynamic global market that is of great magnitude in relation to Argentina’s production. By virtue of its international competitiveness, production can grow in a sustained and sustainable manner, based on Argentina’s vast wealth of natural and human resources, in which production systems have been developed that enable the achievement of high productivity with environmentally-friendly management of natural resources.
1.2. Main characteristics of Argentina’s production systems
The majority of Argentina’s agricultural production corresponds to grains and oilseeds and is carried out in dry farming systems, given that the country has a wealth of land located in zones that receive sufficient annual precipitation to reach high yields without the necessity of irrigation.
Sectors Exports Imports BalanceTotal goods 81,986 71,998 9,987Agricultural products 43.296 2.491 40.805Non-agricultural manufactures 25.990 57,193 -31,203• Machinery and equipment 12.908 32.897 -19.989
- Office and telecommunications equipment 98 6.144 -6.046
- Automobiles 9.985 13.652 -3.667
- Other machinery and equipment 2.825 13.101 -10.276
• Textiles 242 1.190 -948
• Chemicals 6.596 12.200 -5.604
• Other non-agricultural manufactures 6.244 10.906 -4.662
Fuel 4.466 9.758 -5.291Other 8.234 2.556 5.678
Table 1. Trade balance of Argentina.* Total and principal sectors. Average for 2011–2014 (in millions of dollars per year)
Source: Based on WTO data. Note: *Does not include foreign trade in services.

4 M. Regúnaga and A. Tejeda Rodriguez - Argentina’s Agricultural Policies, Trade, and Sus-tainable Development Objectives
Eight agricultural chains make up the majority of primary production (75% of the total). The main crops are soy, corn, wheat and sunflower; and the main livestock productions are beef, dairy, poultry and pork (Graph 2).
No irrigation is used in 95% of the total area planted with annual and perennial crops (about 40 million hectares, including crops for forage), and almost all of the area with natural grassland for livestock also uses dry farming methods. The irrigated surface area
is approximately 2 million hectares, which corresponds primarily to the production of fruit (apples, pears, citrus and grapes are the most important ones), vegetables, sugarcane, tobacco and other industrial crops (including part of the rice and cotton crops).4 The irrigation of extensive crops (grains) and grass is very limited, in spite of the fact that there is great potential in the surface and subterranean water systems. Argentina has a high proportion of renewable water per capita, which is currently not being used.
Starting in the nineties, agricultural production, especially that of cereals and oilseeds, improved in productivity and competitiveness in the various links of the value chains and grew notably, based on technological and organizational innovations. Production incorporated genetic innovations and soil and crop management practices that enabled the development of high-productivity systems that use a low intensity of energy in cultivation work and in agrochemicals, while contributing to soil conservation and efficient use of the available rainwater in the soil. These systems include direct sowing, called also “no till” (more than 90% of the area cultivated with cereals and oilseeds), crop rotation, soil nutrition (a different concept from mass fertilization),
biological pest and brush control, and other good agricultural practices (GAPs) and manufacturing practices. They are environmentally-friendly production systems with very low greenhouse gas emissions when compared to the systems that are prevalent in Europe and other regions of the world (Regúnaga, 2013; Viglizzo, 2014; see also Graphs A-4, A-6, A-7, A-8 and A-9 and Table A-12 in the Appendix).
Organizational innovations (networks of companies that coordinate or integrate production, processing and marketing, both horizontally and vertically, enabled increasing the scale, structuring the value chains, reducing the transaction costs and developing competitive
Graph 2. Value structure of Argentina’s agricultural production. Principal chains (average percentages for the period 2007–2011)
Source: Data from Agrimonitor – Inter-American Development Bank (IADB).
Soy29%
Corn6%
Wheat
Sunflower
Pork
Other
Poultry
Beef
Dairy

5Agricultural Trade and Sustainable Development
and sustainable production systems and business models, adapted to the unfavourable relative prices in effect in Argentina when compared with those of other countries that support agriculture (Anllo, G., Bisang, R. et al. 2013). Currently, two-thirds of the production of cereals and oilseeds is carried out in networks that integrate landowners with firms specialized in crop management, capital investors and specialized service providers (sowing, harvesting, transport, conditioning, storage), which enable reaching competitive scales, high efficiency in the various links of the chains and low transaction costs.
These technological and organizational deve-lopments were initiated in the nineties in the context of macroeconomics and agricultural and trade policies that favoured investment,
innovation, production and agricultural export, in spite of the fact that, during those years, international grain prices were very low (Regúnaga, 2011). The currency devaluation in 2002 and the international price increases registered since 2003 improved the scenario during the first years of the 21st century for local agriculture, which had achieved high competitiveness in the previous decade. However, the new Administration’s changes in the priorities and strategies for growth involved modifications to Argentina’s agricultural and trade policies, which gradually created disincentives for the sector and limited the potential increases in agricultural production and export that could have been achieved by virtue of the favourable international scenario for food trade during the 2003–2013 period.

6 M. Regúnaga and A. Tejeda Rodriguez - Argentina’s Agricultural Policies, Trade, and Sus-tainable Development Objectives
2. MAIN OBJECTIVES OF THE AGRICULTURAL POLICIES OF THE LAST DECADE
General framework
The agricultural policies applied in Argentina during the past decade are part of the general objective of the economic-trade policy prioritized by the national government: the import substitution strategy to promote the growth of the economy and employment. This strategy is an essential component of an economic philosophy based on the assumption that domestic demand supplied by local production is the main source of the country’s growth. It also assumes that the signals given by the market lead to errors in the allocation of resources and that governments have the ability to correct such errors through direct actions (taxes on trade, quantitative trade barriers, price controls, subsidies, etc.) or through the market participation of State-controlled companies. Furthermore, this philosophy dismisses the importance of opening the economy to international competition in order to improve the competitiveness and performance of the country’s economy.5
On the basis of this general objective, the vision for the agricultural sector prioritized its roles as: i) a provider of low-priced food in order to validate low salaries (and therefore lower labour costs) and to give other less-competitive protected sectors a competitive edge; ii) an instrument for limiting inflation in food prices; and iii) a significant source of tax revenues in order to finance public investment policies and support State-run production and service activities, as well as supporting other social and economic sectors, through subsidies and other mechanisms. On the other hand, it did not prioritize the sector’s importance in: overall economic growth; increased exports; job creation; the social and economic development of the poorest regions of the country (those located far from urban centres and export ports), whose growth depends primarily on agro-industrial activities; and the achievement of other sustainable development objectives, bearing in mind its importance in
the use of natural resources and its impact on climate change.
This strategy also conditioned the country’s general trade, currency and fiscal policies. During the last decade, export taxes and non-tariff export barriers, import barriers, subsidies and other means of direct intervention in the market have been used to limit inflation, protect the manufacturing industry from international competition and address the problems of the growing scarcity of foreign exchange arising from the current account deficit and the net loss of reserves recorded particularly during the past four years, aggravated by the lack of foreign investment and limited access to international financing. These circumstances led Argentina to implement additional limitations on the import of goods and to establish other restrictions and controls on foreign currency access and use.
Within the framework of this vision, the changes registered in the international market during the last decade, which resulted in substantial increases in the prices of food and oil, rather than being considered as opportunities for growth in production and export in these sectors and the economy as a whole, were interpreted as threats to the evolution of domestic prices. For this reason, policies were orchestrated with the goal of limiting the export of food and energy (gas and oil) and decoupling the evolution of the local market from the international context, discouraging growth in the production and export of these goods.
Furthermore, this strategy did not prioritize the agenda of Argentina’s trade integration with other relevant countries and markets, based on international trade negotiations, especially in the case of the initiatives that involved free trade agreements (FTAs) with developed countries. In the first decade of the century, Argentina, as a member of MERCOSUR, found itself in the process of ambitious trade negotiations initiated during the mid-nineties

7Agricultural Trade and Sustainable Development
with the countries of the Americas (the FTAA initiative launched in 1995) and with the EU (launched in 1996), in addition to occasional treaties with Latin American countries and other developing countries. In the case of the FTAA, as well as MERCOSUR-EU, it was anticipated that negotiations would conclude in 2005. However, in both cases, such an objective was not reached: the FTAA was completely abandoned, and the negotiations with the EU were postponed and then resumed during the past three years, but at present have yet to be concluded. Trade policy also failed to prioritize improvements in MERCOSUR, which over a decade ago recorded trade conflicts between its members, due to violations of the Treaty of Asunción based on a lack of coordination and harmonization in macroeconomic and sectoral policies and the failure to fulfil the agenda of increased integration proposed in 2001.
Specific objectives of the agricultural policies
Below, the main specific objectives of the agricultural policies implemented during the 2003–2014 period are described.
2.1. Maintaining domestic food prices at relatively low levels
The growth strategy based on import substitution and the prioritization of domestic consumption supplied by local production of industrial goods gave way to agricultural policies aimed at reducing domestic food prices in relation to the prices in effect in the international market, in order to diminish the labour component of industrial costs in relation to the costs that were in effect in other competing countries. The applied measures reduced the relative domestic prices of primary agricultural products in comparison with the domestic prices of all other goods and services. This diminished the profitability of the agricultural sector because, additionally, the domestic prices of certain agricultural inputs and capital goods (agrochemicals, vehicles and machinery) were higher than the corresponding
international prices, due to trade protection on the local production of those goods.6
Both purposes (inexpensive food and expensive industrial goods in the local market) prioritized domestic consumption as the driving factor of the country’s social and economic growth, given that the high protection of the manufacturing sector through import tariffs led to a reduction in its international competitiveness and limited its possibilities of exporting to the countries in which Argentina has no tariff preferences.7 This strategy involved abandoning the economic and trade reforms implemented in the beginning of the nineties, which were aimed at promoting the Argentina’s long-term growth through the country’s competitive integration into the world economy, for which agricultural export taxes and barriers were removed, import barriers were reduced and the relative input-output prices were improved in the agricultural sector.
2.2. Controlling inflation by decoupling the evolution of domestic prices for agricultural products from those corresponding to the international markets
In the short term, the trade policy also had the objective of controlling the inflation of food prices. The significant devaluation of the currency in 2002 and the increase in international agricultural prices registered as of 2003 posed challenges for the government’s chosen strategy to limit inflation by preventing an increase in domestic food prices. With this goal, during the past decade, trade policies (tariff and non-tariff barriers), as well as policies on differentiated exchange rates, were orchestrated with the intention of decoupling the evolution of domestic prices from international prices. The implemented policies were based on the objective of preventing an increase in the prices of basic food items in order to “take care of the table of the Argentine people”. The applied measures limited increases in the prices of primary products, under the assumption that controlling price increases at the producer level would be reflected in consumer food prices.

8 M. Regúnaga and A. Tejeda Rodriguez - Argentina’s Agricultural Policies, Trade, and Sus-tainable Development Objectives
2.3. Generating tax revenues to finance increases in public spending and achieve fiscal surpluses
The fiscal policies of the past decade were aimed at significantly increasing tax revenues through increased tax pressure. An important part of the increase in tax collection in the first years of the decade was generated through taxes on exports, which were imposed at very high rates on the agro-industrial sector and at reduced rates (5%) on industrial manufactures. Thus the relative taxation of the agro-industrial chains was increased. These taxes made no distinction between large and small contributors, but rather between products, assessing the same tax rate on all exports of each respective good.
The increased tax rates on exports from the agro-industrial sector was an essential component of the initial government strategy aimed at quickly achieving greater tax revenues to finance the increase in public spending and to generate fiscal surpluses. Subsequently, economic growth and general price increases also permitted increasing collections of the most important national taxes in Argentina (VAT and Income Tax).
2.4. Focusing tax collection on resources administered by the National Executive Branch (NEB)
The Argentine Constitution establishes that the collection of taxes on foreign trade is the responsibility of the National State, while the rest of the principal national taxes (VAT and Income Tax) are co-partnered between the Nation and the Provinces. The increase in taxes on foreign trade (currently, those of greatest significance are those levied on exports) tends to focus tax collection on resources directly administered by the national government and to reduce the share of collections of the remaining co-partnered national taxes and those charged by the provinces on domestic sales (Gross Income). This is due to the fact that taxes on exports reduce the domestic prices of products and, with them, gross and net income, decreasing the base for the collection of the other national, provincial and local taxes.
With this strategy, tax revenues and the political power for making decisions with regard to public investments and the transfer of fiscal resources to the provinces have been concentrated by the national government. The provinces and local governments thus lost some of their autonomy and increased their dependence on the allocations made by the national government in accordance with its political priorities. Increasing collections by taxing foreign trade implies working in detriment to political and economic federalism.
2.5. Supporting family agriculture and small farmers
The Argentine Ministry of Agriculture (MINAGRI) increased the priority assigned to supporting small farmers. For this, MINAGRI relied on resources intended to support small farmers through various instruments, which were approved by the National Congress in the National Budget Laws of the respective years.
The purpose of these was to take care of smaller producers in a differentiated manner, in order to mitigate their lesser competitiveness in comparison with commercial producers. For this, programmes were implemented to facilitate their access to: i) technology, with technical assistance programmes; ii) the product markets, by promoting associativity; and iii) credit, with interest rates lower than those charged by the institutional financial system, which are generally very high in relation to those of other countries. MINAGRI has granted subsidies to the banks for the reduction of interest rates for the “equalization of rates”.8 On the other hand, no support was arranged to reduce the cost of agricultural insurance, which is very high in Argentina.
2.6. Conserving natural resources and the environment
In the area of natural resources, the government promoted the approval of legislation regarding the native forests, which envisages various objectives: i) to prevent irresponsible deforestation; and ii) to provide incentives for supporting reforestation with native species.

9Agricultural Trade and Sustainable Development
Policies were also devised with the intention of promoting the substitution of fossil fuels with biofuels which, in the case of Argentina, enable improving the carbon balance; they also contributed to other objectives of regional development, trade diversification and a reduction in fuel imports, considering that Argentina is a net importer of gas and oil.
2.7. Supporting innovation, health and food quality
Argentina’s agricultural policy has traditionally contemplated support for public research, including extension programmes (or technology transfer). The main programmes are run by the National Institute of Agricultural Technology (INTA) of and other research centres and universities. In the past decade, the government increased the budget assignments targeted at agricultural research and development, principally prioritizing extension activities / technology transfer to small and medium-sized farmers.
On the other hand, the initiatives aimed at incentivizing private research, by providing adequate protection for intellectual property through a new Seed Law and improved enforcement of the applicable legislation, did not progress.
There was also an increase in the budgets targeted at health policies, in order to improve sanitation and guarantee food quality and safety. These were primarily the responsibility of the National Agri-Food and Sanitary Quality Service (SENASA) and the National Food Institute (INAL) for safety issues. Furthermore, in the past decade, the institutional strenghtening of SENASA was financed with additional resources from international sources (IADB, World Bank and the EU).
2.8. Other specific policies to support agricultural production
Argentina has traditionally had very limited policies on direct support of agricultural production prices (framed within the “amber box” in the WTO Agricultural Agreement). The analysed period was no exception, and the primary support policies were those corresponding to the “green box”. These included: aid for small farmers (mentioned in Section 2.5); aid for some regional production in relatively less-developed areas (for example, goat and sheep production); tax exemptions and aid in situations of agricultural emergency; and certain programmes for investment in rural infrastructure. “Compensations” were also implemented for some of the sectors imposed with export taxes, trade barriers and maximum sales prices to the domestic market.9
The only sector that has received direct subsidies of any significance is tobacco production. Argentina targets the full level it committed to before the WTO for the “amber box” assistance for this particular product. Almost all of the tobacco producers are small farmers, located in areas of very poor relative development, for which they have also received other indirect support (“green box”) for regional development and production diversification with the aim of complementing their tobacco income with that generated by other production activities. In this sector, the implemented policies continued the programmes designed in previous decades.
In Table A-1 of the Appendix, the evolution of the amounts of various types of support to producers is included, as reported to the WTO Agricultural Committee.

10 M. Regúnaga and A. Tejeda Rodriguez - Argentina’s Agricultural Policies, Trade, and Sus-tainable Development Objectives
3. DESCRIPTION OF THE MAIN POLICY TOOLS USED
3.1. Export taxes and export tax differentials
Starting in 2002, Argentina imposed export taxes on all products (Resolution ME 11/2002) with the goal of increasing fiscal revenues and limiting the impact of the currency devaluation on the increase in domestic prices. The original rates were subsequently increased by a substantial amount for agro-industrial products (Table 2). Currently, soy exports have the highest rate: 35% of the FOB price. The other grains have lower rates: sunflowers 32%; wheat 23%; corn and sorghum 20%. Beef has a 15% rate, while
certain regional products are taxed at only 5% (the same as industrial manufactures). The taxes on dairy were eliminated and replaced with other export restrictions.
In almost all of the chains in the agro-industrial sector, there is tariff escalation on exports (Graph 3). Exports of primary products are taxed at higher rates than processed products in order to promote the export of products with local value added and to offset the tariff escalation on imports applied in the destination markets.
Products
Dates on which the rates were modified02/03 02/04 02/07–
0805/11 07/01 07/11 08/03* 08/07 08/12
and current
Corn 10 20 20 20 20 25 27 25 20
Sorghum 10 20 20 20 20 20 20 20 20
Wheat 10 20 20 20 20 28 28 28 23
Barley 10 20 20 20 20 20 20 20 20
Rice (shelled) 10 10 0 5 5 5 10 5 5
Sunflowers 13.5 23.5 23.5 23.5 23.5 32 41 32 32
Sunflower flour 5 20 20 20 20 30 37 30 30
Sunflower meal 5 20 20 20 20 30 37 30 30
Soy 13.5 23.5 23.5 23.5 27.5 35 44 35 35
Soy flour 5 20 20 20 24 32 40 32 32
Soybean meal 5 20 20 20 24 32 40 32 32
Peanuts 10 20 10 10 10 10 23.5 10 23.5
Peanut oil 5 20 20/0 5 5 5 5 5 5
Cotton seeds 13.5 23.5 23.5 13.5 13.5 13.5 13.5 13.5 13.5
Cotton fibre 10 10 10/10 5 5 5 5 5 5
Other agricultural manufactures**
5 5 5 5 5 5 5 5 5***
Table 2. Evolution of export taxes on agricultural products. 2002–2014 period (ad valorem percentages)
Source: Secretary of Finance and Argentine Federal Tax Authority
Notes: *Rolling averages from March 11 to July 22, 2008; in the case of soy and sunflower by-products, the rate was 4 percentage points lower than that of the grains; in the case of wheat flour, the rate was 10 percentage points lower than that of the grain. **Other MAOs refers to “other manufactures of agricultural origin”. ***Beef is presently taxed at 15% and dairy products are not currently taxed.

11Agricultural Trade and Sustainable Development
Export taxes are not regulated by the WTO Agreement on Agriculture and are therefore allowed. However, in recent years, various countries have begun questioning the use of these and other export restrictions because it is considered that they discourage the increase in supply, limiting the achievement of global food security, and fuel international price volatility in the periods in which imbalances are recorded between world supply and demand, as happened during the food crises of 2008 and 2011.
Within MERCOSUR, although they are prohibited by Article 1 of the Treaty of Asunción, the Customs Code of the bloc left the imposition of
these types of measures to the decision of each Member State.
3.2. Quantitative restrictions and other non-tariff barriers on export (Export NTBs)
For more than three decades, the export of cereals, oilseeds and their by-products in Argentina was regulated by Law 21,453, under which exporters freely recorded sales at the moment they were arranged, that is, before shipping.10 The trade and tariff conditions of the sale were set at the time the sale was declared (the price and export taxes on that date). Since 2008, this regulatory framework has undergone
Graph 3. Tariff escalation in selected agro-industrial chains (ad valorem percentages)
Source: Argentine Federal Tax Authority data.
Soy chain
35%32% 32%
14,3%
Beans Oil Flour Biodiesel
Corn
Flo
ur
Oil
Food
pre
para
tions
Anim
al
feed
Eth
anol
Beef
Pork
Poult
ry
Dair
y
Corn chain, including livestock feed
Wheat chain
Wheat Pastas andbaked products
Flour andpremixtures
Bran andresidues

12 M. Regúnaga and A. Tejeda Rodriguez - Argentina’s Agricultural Policies, Trade, and Sus-tainable Development Objectives
modifications through Law 26,351, limiting the possibility of setting trade and tariff conditions at the time the sale is arranged, in order to define them, instead, at the time of shipping. This has implied the risk of changes in trade and tariff conditions between the time foreign sales are arranged (they are generally made in advance) and the conditions in effect at the time of shipping.
Furthermore, the rules of the game changed substantially as of the 2006/07 season, in which quantitative limits began to be established for the export of certain agricultural products. Since the year 2008, the Argentine government has applied quantitative restrictions (quotas) on the export of various products, including wheat, corn, beef and dairy, through Resolutions of the Ministry of the Economy and the National Office of Agricultural Trade Control (ONCCA), which was an agency within MINAGRI. Execution of the quotas was carried out through Export Operations Registries (ROEs) on the part of the exporters, initially established within the framework of ONCCA Resolution 543/08.11 In the year 2011, the government disbanded the ONCCA and its powers were transferred to a unit of the Secretary of Commerce of the Ministry of the Economy, called the Internal Consumption Subsidy Coordination and Evaluation Unit (UCESCI).
The Export NTBs employed by Argentina have included closures of the registry of sales declarations, the imposition of quotas and export bans. The volume of the export quotas are currently decided by the UCESCI on an ad-hoc basis. This office has not formalized any criteria or transparent procedures for determining the level of the export quotas authorized at various times during the crop year or their distribution among exporters.
The Export NTBs have been applied in order to guarantee the local market supply and limit the transfer of the inflationary pressures of international prices to domestic prices. Other arguments used in Argentina to limit exports have included: reducing the volatility of domestic prices; promoting agricultural value added by guaranteeing the local supply of raw materials; counterbalancing the tariff escalation
policies in import countries. In Argentina, the export restrictions have not been a matter of emergency measures for a certain product under exceptional circumstances, like those that have been applied in other countries.12
From a global perspective, these measures fuel the short-term volatility of international prices in the periods in which there is an insufficient supply, and in the long run, discourage the increase in supply from the countries that apply them and, as a consequence, the achievement of food security. For this reason, they have garnered criticism in various forums and academic environments. As a general rule, quantitative restrictions and export bans are prohibited by the WTO, except when they are applied temporarily in order to prevent or remedy an acute scarcity of food products. These must duly consider the effects of the restriction on the food security of the import countries and must be notified in writing to the WTO Agriculture Committee, which must inform the other Members of their nature and open a question and answer phase. These obligations do not impose many restrictions on a country that wants to limit its exports: the WTO text is so ambiguous that its application is complex and the obligations only refer to Q&A and notification. There is clear asymmetry in how export and import restrictions are treated in the WTO (Anania, 2013).
3.3. Tariff and non-tariff barriers on import
Argentina’s tariff barriers are essentially those corresponding to the Common External Tariff (CET) of MERCOSUR, which, for most goods, is lower than the maximums established by the WTO. In some cases, exceptions to the CET have been established, increasing tariffs to the maximum levels consolidated at the WTO. The MERCOSUR CET charges reduced tariffs on minerals, fuels and other primary products and higher tariffs on manufactured products, with a general scale that varies from 0% to 20%, with exceptions of up to 35% (Tables A-2 and A-3 of the Appendix).
Furthermore, during the last decade, the Secretary of Trade and the Argentine Federal Tax Authority have implemented a wide range

13Agricultural Trade and Sustainable Development
of restrictive measures for the import of goods (non-tariff barriers or NTBs). Some of these, including the corresponding procedures, are not established in official published regulations, leaving the authorization of foreign purchases to the discretion of certain government offices, which has added uncertainty and increased the cost of imported goods.
The NTBs have limited purchases of the majority of goods, whether produced in the country or not. These measures were significantly augmented after the international financial crisis of 2008 and especially after 2011. The list of NTBs includes automatic and non-automatic import licenses;13 sworn statements prior to import (DJAIs); antidumping measures; and controls and restrictions on access to foreign currency.
The Argentine government has used non-automatic licences as a key instrument of its import substitution and local production protection policies. In recent years, non-automatic licences have also been employed to limit the use of foreign currency with the goal of guaranteeing a minimum trade balance, in order to ensure the imports of energy and to attend to international financial commitments.
Various official declarations pointed out that non-automatic licenses were an instrument in the strategy to protect local industry14 and employment.15 These statements confirmed that Argentina has used non-automatic licenses as a mechanism to protect certain productive sectors, primarily manufactures of industrial origin, in spite of the stipulations of the WTO regulations (INAI, 2011). The coverage of these licences significantly increased as of 2009: they grew to cover 20% of all Argentine imports, extending to a large number of products, including auto parts and automobiles, electronic products, capital goods, agricultural machinery, footwear, textiles, tires, home appliances, toys, motorcycles and bicycles, among others (INAI, 2011).
As a consequence of international criticism, at the beginning of 2013, the processing of import licenses for the majority of the products was
repealed.16 This does not mean that imports were facilitated, given that they continued to be controlled by the requirements of the sworn statements prior to import (DJAIs) established in January of 2012 through General Resolution 3252 of the Argentine Federal Tax Authority. In practice, the DJAIs functioned as non-automatic licenses, but all across the tariff lines.
An additional limitation orchestrated in 2014 came in the form of restrictions on access to foreign currency for the payment of imports. These included limitations on access to the foreign currencies provided by the Central Bank at the official exchange rate, which implied their acquisition in secondary markets through securities or shares at a much higher price, or the use of international financing.
3.4. Fixation of maximum prices and other price controls in the domestic market
During the last decade, various types of controls have been applied on the sale prices of agricultural products in the domestic market. These include maximum prices for live cattle in certain periods and maximum prices for retail sales (of cuts of beef, chicken, flour, bread, liquid milk and other dairy products, edible oils, sugar, etc.).
In 2014, the domestic price control strategy was modified and the “Protected Price” programme was established for a limited list of products, based on a commitment assumed by the National Government, commercial companies, distributors and their primary providers, in order to establish flexible price management throughout 2014. The program aims to provide stability and transparency in the process of establishing prices, which are determined on the basis of an analysis of costs in the value chains. These are baseline prices, which permit consumers to make comparisons with the other prices in the gondola, evaluate the difference and choose.
3.5. Other taxes on domestic commerce
Argentine fiscal policy taxes domestic commerce with other types of taxes, which are cascading

14 M. Regúnaga and A. Tejeda Rodriguez - Argentina’s Agricultural Policies, Trade, and Sus-tainable Development Objectives
(in each commercial transaction performed in the chain) and cumulatively reduce the domestic prices received by the producers, diminishing the international competitiveness of local production. They are:
a) Provincial taxes on Gross Income and Stamps. In the past decade, the gross income tax and stamp rates were significantly increased by the governments of the various provinces as a means of increasing provincial public spending and offsetting the decreased income from co-partnered national taxes (due to the effects of export taxes). Provincial taxes rose more than VAT, representing 41.6% of the co-partnered VAT in 2001 and 58.9% in 2013 (Butler, 2014).
b) The tax on domestic transactions (known as the “check tax” because it is charged in bank notes payments). Every transaction is taxed at 1.2% of the transaction value (0.6% on the debit and 0.6% on the credit). This tax had been suspended in the late nineties, but began to be applied again in 2001 and still remains in effect.
Both taxes increased tax pressure between 2001 and 2013 (Table A-4 of the Appendix).
3.6. Compensations
Starting in the year 2007, new powers were attributed to the ONCCA, for purposes other than the original duties focused on creating transparency and controlling competition in the agricultural markets. They were aimed at: i) preserving the population’s purchasing power capacity; ii) contributing to macroeconomic stability; and iii) reducing the influence of foreign price fluctuations on the domestic prices of the agricultural products that were exported. Furthermore, compensations were granted to producers and manufacturers to partially reduce the impacts of maximum prices and other trade policies imposed on their income.
The mechanism for compensating the various involved parties was put into effect through Resolution 9/2007 of the Ministry of Economy and
Public Finance. At the same time, export taxes on soy were increased by 4 percentage points to generate financing for these compensations, as detailed in Table 2 (Resolution 10/2007 of the Ministry of Economy and Public Finance). Therefore, it was not a matter of net transfers to the sector, but rather of offsetting prices or income, paid through a small portion of the export taxes levied on the sector. In the period 2007–2009, compensations were granted in a total amount of $6.45 million to the following participants in the agri-food chains: producers or packagers of edible oils; poultry processing plants; the dairy industry; wheat flour mills; corn flour mills; pork producers and farmers; cattle feedlots; milk producers; wheat producers; and small soy producers. That amount represented approximately 11% of the total export taxes charged on the agricultural sector during that three-year period. In 2008, a private “oil trust” was established to substitute the public compensations on sales at the official supply price to the domestic market in the oil sector.17
In the following years, other compensation programmes were announced aimed at preventing the reduction of the cultivated area of certain crops, such as “Wheat Plus” and “Corn Plus”. However, in the end, these compensations were not paid to the producers. In May of 2013, in light of the drop in production and the low intention to cultivate wheat, instead of eliminating the export barriers, a “wheat trust” fund was created to return an amount to the producers, equivalent to the value obtained from export taxes on wheat. However, the low level of faith in government announcements meant scant compliance on the part of producers.
3.7. Monetary policies and differential exchange rates. Limitations on the foreign exchange market
During the last decade, multiple net exchange rates have been applied to the various sectors, utilizing different levels of import and export taxes, as well as other limitations on access to the official foreign exchange market. There are currently various exchange rates, which

15Agricultural Trade and Sustainable Development
are applied in relation to the commercial or financial transaction that is performed: i) the official exchange rate, fixed daily by the Central Bank as the basis of foreign trade transactions; ii) the exchange rate corresponding to each product, which is the result of applying the taxes on foreign trade to the official exchange rate (which varies from +35% for the imports of vehicles, textiles and other protected goods, to -35% for exports of soy); iii) the exchange rate utilized for foreign currency transfers through the acquisition of securities or shares in the Stock Exchange (with a gap in the order of +50–60% over the official price), which was required in October of 2014 for imports of certain goods; iv) the exchange rate applied on foreign purchases with credit cards, which involves increasing the official exchange rate by 35%; v) the parallel or informal exchange rate (with a gap between it and the official rate in the order of 60–70% in the month of October, 2014).18
3.8. Limitations on transactions in the grain futures markets
The grain futures markets are a very important instrument for managing the risk of price fluctuations to which agricultural activities are subject. When international prices are high, the final stocks are relatively low and the markets have higher volatility. This is why it is important to have mechanisms in place to mitigate the risks.
At the beginning of the nineties, transactions in dollars were authorized, which helped producers and other trade operators substantially increase their operations in these markets, given that these transactions eliminated the additional risk of evolution in the exchange rate. In 2002, transactions in dollars were prohibited. This had a significant impact on the volume traded in these markets in the immediately following years, until alternatives were found to partially mitigate the impact of this restriction.
Another aspect that has had a sensitive impact on transactions in these markets is the new Capital Markets Law (Law 26,831 of December of 2012). Its recent regulations propose a substantial increase in the capital requirements for market
traders, as well as other requirements that have limited the volume traded in the futures and options markets.
3.9. Biofuel policies
Argentina promoted the production of biofuels with three objectives in mind: i) economic and social objectives; ii) diversification of the energy matrix; and iii) environmental concerns.
The economic and social factors are the principal driving forces of the promotion of biofuel production, given that Argentina has a great wealth of natural resources to add to current food production. Biofuel production contributes to the growth of agricultural production and employment in regions that are far away from ports and urban centres, where grain production for export is not profitable due to the high costs of transport, leading to integrated production systems to supply the local markets (fuel, livestock production and CO2 energy). These systems generate energy and opportunities for industrial development in areas in the interior of the country that do not have a sufficient supply of that resource. They also enable adding local value with the development of biorefineries.
Biofuel production also helps diversify Argentina’s export basket (which is extremely concentrated on the “commodities” of the soy complex), reducing the foreign market risks of these foods. It also contributes toward improving Argentina’s trade balance, reducing the necessities of importing gas and oil, whose value has grown notably during the last five years (one of the main sources of the trade deficit).
Another objective has been the diversification of Argentina’s energy matrix, which is highly reliant on fossil fuels. In 2010, the structure was: natural gas 48%, oil 39%, hydraulic power 5%, nuclear power 3% and other sources 5% (wood, coal, sugarcane and other raw materials).
Environmental concerns have also been a driving factor, due to the fact that the country’s energy matrix is highly dependent on fossil fuels,
16 M. Regúnaga and A. Tejeda Rodriguez - Argentina’s Agricultural Policies, Trade, and Sus-tainable Development Objectives
which have more negative effects on climate change. Given that Argentina’s agricultural production systems use very little energy and agrochemicals, the carbon balance is better than that of fossil fuels, especially in the cases of soy biodiesel and bioethanol made from sugarcane and corn.
The main components of the biofuel production and trade support policies are: i) Law 26,093/2006 on Biofuels and the corresponding regulations; ii) Law 26,334/2007 and the corresponding regulations, which incorporated sugarcane ethanol; and iii) the Resolutions of the Ministry of the Economy on the export tax differentials indicated in Graph 3 and other export controls.
Law 26,093 provided a general framework for promoting biofuel production in small and medium-size companies, establishing a mechanism for fixing sales prices in the domestic market (based on production costs) and the quotas for those sales, and exempted them from the general tax charged in Argentina on the sale of fossil fuels. Furthermore, mandatory blends have been established for the use of fuel and gasoline in the domestic market.
The main mechanism for promoting local production has been the tariff differentials on biofuel exports established through Resolutions of the Ministry of Economy: the tax on biofuel exports was 14.3% in September/October of 2014, while soybean oil was taxed at 32%.
3.10. Legislation on forests and land
In November of 2007, the National Congress approved Law 26,331 on Minimum Standards for Environmental Protection of the Native Forests, denominated the “Forest Law”. Its purpose is to regulate and limit the deforestation process registered during the last few decades. The law established a moratorium on the authorization of new deforestations, until each Province drafts Land Use Regulations for their Native Forests under 10 environmental, economic and social criteria. It also established: a) the obligation of performing an Environmental Impact Study and holding a public hearing before the appropriate
authorities (the Provinces) can authorize a deforestation operation; and b) the mandate to respect the rights of the indigenous and rural communities. It also banned land clearing burns.
The law contemplates support for the reforestation of native forests: the National Fund for Enrichment and Conservation of the Native Forests, which would subsidize landholders who conserve and manage the native forests in a sustainable manner. Article 31 established that the fund could not be less than 0.3% of the National Budget, to which 2% of the total agricultural, livestock and forestry export tax revenues must be added.
On the other hand, Argentina still does not have national legislation on land use. The responsibility in this regard is in the hands of the provincial governments, in many cases with the existence of differing criteria. Various projects have been proposed, but have not been consolidated into Law.
3.11. General services for agriculture (infrastructure, agricultural research and development, sanitation and others)
One of the principal weaknesses exhibited in agricultural production is the lack of adequate transport and logistics infrastructure. The lack of government approval for updating toll-road prices, which helped improve the backbone of the roadway infrastructure during the nineties, as well as the limited public investment in roadway, railway and waterway infrastructure for transporting cargo during the last decade, has had significant repercussions on the quality and increased costs of transport and logistics services in general. Argentine fiscal policy imposes national taxes on fuel consumption for the maintenance and development of the roadway network, and provincial and municipal taxes for the maintenance of the rural roads in those jurisdictions. However, a substantial part of those resources has not been utilized for such purposes. In the case of highways and their links to the rest of the transport network, an important and ambitious bill has

17Agricultural Trade and Sustainable Development
been drafted, which is under study in the National Congress, but which has not received sufficient support from the National Executive Branch for its approval.
On the other hand, for many decades Argentina has had a well-developed institutional structure for public support of agricultural research and development, as well as for prevention and control in the area of sanitation and safety of food and primary agricultural production.19 These institutions have been financed primarily through public funds, approved annually by the National Congress. They are part of the general services support included in the “green box”, in accordance with the methodology agreed upon in the WTO (Table A-1 of the Appendix). Additionally, these institutions receive contributions from the private sector. Furthermore, the government has allocated additional funds
through the Provincial Agricultural Service Program (PROSAP), with resources co-financed by the State and international organizations (IADB, World Bank, EU cooperation) for public investment projects, with the objective of increasing the coverage and quality of agri-food services.
According to the estimates of a study conducted by the Inter-American Development Bank, following OECD methodology for calculating the support that countries provide to producers (IADB, 2014), Argentina allocated an average of 373.4 million dollars per year to general services related to agriculture from 2010 to 2012.20 Of those funds, 89% was used to finance three components: The National Institute of Agricultural Technology (40%), SENASA (39%) and PROSAP (10%); the rest went to the other programmes mentioned, principally for family agriculture and regional development.

18 M. Regúnaga and A. Tejeda Rodriguez - Argentina’s Agricultural Policies, Trade, and Sus-tainable Development Objectives
4. EFFECTS OF THE POLICIES ON THE MAIN VARIABLES AND OBJECTIVES OF SUSTAINABLE DEVELOPMENT
Below is a description of the evolution of the main indicators that enable analysing the impacts of agricultural policies in relation to the general and specific objectives detailed in Chapter 2. In Section 4.1, a brief analysis is made on the level of evolution of the main economic and social indicators that were influenced by agricultural policies, but whose performance depended largely on other aspects of public policy. The details of such assessments are beyond the scope of this study. In Section 4.2, the specific impacts on the agro-industrial sector are addressed.
4.1. Evolution of the main indicators of a general nature21
Evolution of the product, income and consumption
After the crisis of 2001–2002, public policies were implemented (devaluation of the exchange rate;22 tax and trade reforms; and social programmes for unemployment and the most poor) that contributed to the recovery of growth and employment, as well as poverty reduction. The initial growth in agricultural production and exports, as well as its significant contributions to tax revenues through export taxes, helped Argentina achieve a positive trade balance and a fiscal surplus in 2003, in spite of the fact that, during that year, there was also an increase in public spending aimed at relieving poverty and unemployment.
Also favoured by an international scenario that was very propitious in terms of the financial context and the prices of the main commodities exported by Argentina, during the five-year period from 2003 through the end of 2007, the GDP grew at an average rate of 8.8% per
year (Table A-5 in the Appendix) and “double surpluses” (trade and fiscal) were achieved. Per capita income grew by high rates, increasing the population’s purchasing power and consumption.
On the other hand, the performance of the economy was less dynamic during the 2008–2014 period, particularly in the three-year period from 2012 to 2014, in which GDP growth rates declined substantially. The stagnation of the economy was aggravated in the year 2014, including a significant decrease in industrial activity (up to December of 2014, it exhibited 18 consecutive months of decline). Other sectors also declined, leading private sources to estimate a 1–2% decrease in the GDP for 2014. The high inflation rates exhibited in the last four years, the appreciation of the currency and loss of international competitiveness in exports, the import restrictions and the decreases in private investment and domestic consumption largely account for the stagnation of the economy (the “stagflation”), which has had a severe impact on employment and poverty).
Public policy prioritized growth in domestic consumption as the main driving force of economic growth. This was a relevant contributing factor to the increased investments and good performance during the first five years (from 2003 through the end of 2007). However, consumption lost dynamism during the last four years as a consequence of the other cited factors: sales of the basic market basket in homes have exhibited a notable deceleration during the 2009–2013 period (Graph 4). This indicator was negative in 2014 for the first time since 2002, when the country’s economic and social crisis also resulted in a significant drop in consumption.

19Agricultural Trade and Sustainable Development
Evolution of inflation
During the entire period analysed (2003–2014), consumer prices exhibited very high annual increases (Table A-6 of the Appendix) when compared with those of the rest of the world, both in developed countries, and in Latin America and other developing countries. In spite of the agricultural policies aimed at controlling inflation in food prices, consumer prices of all goods and services increased at an average annual rate of 9.2% for the five-year period from 2003 through the end of 2007, which exhibited good performance in the other indicators of
economic evolution (GDP, consumption, trade and fiscal surpluses, and exports).
The annual average during the period 2008–2013 grew 9.7% according to the figures provided by INDEC, which have garnered severe objections in the local media and various international organizations, due to Government interference in the institute since 2007. According to information from other public and private sources (some of which are included in Table A-6), the annual average during this period was 24.2%. The inflation reported by the National Congress using data from private sources for
Graph 4. Growth rates of the basic market basket unit sales in the domestic market* (annual and monthly percentages)
Source: Data from the consulting firm CCR published by La Nación.
Note: *Corresponds to unit sales of food, beverages, toiletries and cleaning supplies.
Annual growth rates 13 (%)2006-20
10
9
8
7
6
5
4
3
2
1
0
2006 2007 2008 2009 2010 2011 2012 2013
Monthly growth rates in 2014 (%)
0
-0,5
-1
-1,5
-2
-2,5
-3
-3,5
J F M A M J J A S

20 M. Regúnaga and A. Tejeda Rodriguez - Argentina’s Agricultural Policies, Trade, and Sus-tainable Development Objectives
the year 2014 reached 38.5%, which is growing at a extremely high level that has negative repercussions in the low-income social strata, increasing the indicators of poverty and indigence.
The price controls on agricultural and other goods, and the taxes and restrictions on exports, as well as the restrictions on imports and access
to foreign currency, were not sufficient to limit the increase in domestic consumer prices (both in the general index and in the food prices index). According to INDEC data, the general level of the consumer price index increased by 2.51 times between January of 2003 and December of 2013, and the food CPI increased by 2.52 times during the same period (see Table 4 and Figure A-1 in the Appendix).
Various studies show that the export taxes and restrictions have reduced the prices of primary products with the consequent negative impact on incentives for production, but the same did not happen with consumer food prices. This is due to the fact that these policies have not taken into account that, in some products, the participation of the prices of the primary products in the formation of the final prices of food is of little significance, as they incorporate other processing and distribution costs that have a higher influence on the consumer prices. One example is the case of wheat and the consumer prices of the products made from it (flour, bread, cookies, pastries, pasta, etc.). Although the policy was effective in decoupling domestic wheat prices from international prices and maintaining
them at relatively low levels, it did not have the same influence on the other costs, which account for 90% of the price of bread. These other cost components, such as salaries, energy costs, leasing, utilities, taxes, freight and other distribution costs, which are not correlated to the wheat prices paid to the producer, grew at a higher rate, in association with the evolution of the general prices index of the economy.23 In Graph 5, it can be seen that the price control policies and other barriers limited increases in wheat prices paid to the producer and, to a certain extent, consumer flour prices, but the same thing did not happen with the products produced from wheat (bread, cookies, pastries, noodles, ravioli, pizza crust); their prices exhibited a substantially higher increase.
CP Jan. ’03
Jan. ’04
Jan. ’05
Jan. ’06
Jan. ’07
Jan. ’08
Jan. ’09
Jan. ’10
Jan. ’11
Jan. ’12
Jan. ’13
Dec. ’13
General 100 102,7 110,2 123,5 135,5 146,6 156,6 169,5 187,5 205,7 228,5 250,6
Food 100 103,5 110,1 127,6 142,4 152,8 159,2 172,4 195,0 209,9 230,7 251,9
Table 3. Evolution of the general CPI and the food CPI during the period January 2003 to December 2013 (indexes that use January 2003=100 as a baseline)
Source: INDEC data. Note: in Table 3, the INDEC series has been used for both indicators during the entire period, but it should be noted that, as of 2007, the INDEC data underestimates the price increases in all indicators.

21Agricultural Trade and Sustainable Development
Graph 5. Evolution of producer prices of wheat and consumer prices of flour and of other products made from wheat. Period 2005–2013 (monthly price indexes with a baseline of October 2005=100)
Source: Based on MATba data on producer wheat prices and Provincial Institute of Statistics and Census of the Government of Santa Fe data on consumer prices in the Rosario Aggregate for flour and other products made from wheat. INDEC data on consumer prices was not used due to a lack of reliability.
Notes: *Consumer prices for flour and the averages for products made from flour include: French baguettes, pastries, cookies, crackers, dry pasta shells, dry noodles, fresh ravioli and pizza crust. **Wheat prices increased exceptionally in 2013 due to the uncertainty of domestic supplies (as detailed in Section 4.2 and Graph 8), for which reason this period from the year 2013 should not be taken into consideration for purposes of this analysis.
In relation to this subject, Calvo (2014) calculated that, if there had not been restrictions on wheat exports, the producer prices in 2011 would have been 12% higher. Given that only 8% of this increase is passed on to the price of the products made from wheat, they would have been only 1% higher than in the “real-life case”, which would not have had significant effects on the wellbeing of consumers. Only the poorest deciles would have suffered a loss in wellbeing of 0.1–0.2%.24
In the case of other products that have a higher correlation between the producer and consumer prices, in which the domestic market absorbs a significant part of the total supply (as is the case of beef), the foreign trade restrictions and producer price controls resulted in a significant reduction in the incentives to produce and resulted in increased short-term supply in the domestic market (by liquidating the breeding stock). However, in the medium-term livestock and meat production dropped. As a consequence of this subsequent drop in supply, the domestic prices of livestock and beef increased substantially until reaching levels higher than those prior to the public intervention in the market, with
the normal production lag associated with the livestock cycle. Nogués (2011) estimated that the weighted consumer prices of the main cuts of beef increased by 2.5 times between January and October of 2010 (Figure A-2 of the Appendix), with the consequent impact on the cost of the basic market basket. These prices in dollars and in constant currency ended up being substantially higher than the maximum historic prices of the two previous decades.
In both products (wheat and beef), the price controls and other export barriers did not end up being efficient medium-term mechanisms for limiting inflation of food prices or addressing food security in the low-income population. On the contrary, increases in the supply and export share of these goods could contribute to a greater extent toward the achievement of domestic prices that are lower than export prices (through the normal discounts that correspond to domestic prices—freight and other export costs—and because, in the case of multiproduct goods, such as meats, the exports of expensive cuts enable selling the most popular cuts for local population at lower prices in the domestic
600
500
400
300
200
100
0
Common wheat flour Wheat (MATBA) Wheat derived products
Oct
-05
Feb
-06
Jun
-06
Oct
-07
Feb
-07
Jun
-07
Oct
-07
Feb
-08
Jun
-08
Oct
-08
Feb
-09
Jun
-09
Oct
-09
Feb
-10
Jun
-10
Oct
-10
Feb
-11
Jun
-11
Oct
-11
Feb
-121
Jun
-121
Oct
-121
Feb
-13
Jun
-13
Oct
-13
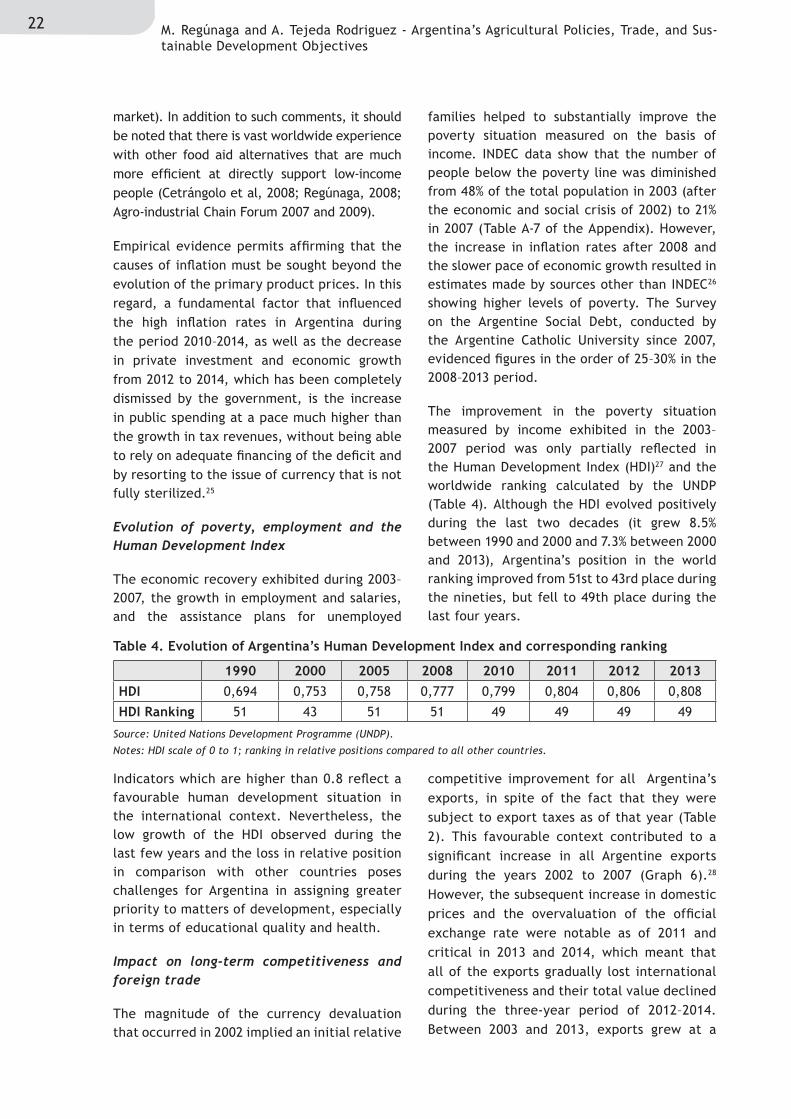
22 M. Regúnaga and A. Tejeda Rodriguez - Argentina’s Agricultural Policies, Trade, and Sus-tainable Development Objectives
market). In addition to such comments, it should be noted that there is vast worldwide experience with other food aid alternatives that are much more efficient at directly support low-income people (Cetrángolo et al, 2008; Regúnaga, 2008; Agro-industrial Chain Forum 2007 and 2009).
Empirical evidence permits affirming that the causes of inflation must be sought beyond the evolution of the primary product prices. In this regard, a fundamental factor that influenced the high inflation rates in Argentina during the period 2010–2014, as well as the decrease in private investment and economic growth from 2012 to 2014, which has been completely dismissed by the government, is the increase in public spending at a pace much higher than the growth in tax revenues, without being able to rely on adequate financing of the deficit and by resorting to the issue of currency that is not fully sterilized.25
Evolution of poverty, employment and the Human Development Index
The economic recovery exhibited during 2003–2007, the growth in employment and salaries, and the assistance plans for unemployed
families helped to substantially improve the poverty situation measured on the basis of income. INDEC data show that the number of people below the poverty line was diminished from 48% of the total population in 2003 (after the economic and social crisis of 2002) to 21% in 2007 (Table A-7 of the Appendix). However, the increase in inflation rates after 2008 and the slower pace of economic growth resulted in estimates made by sources other than INDEC26 showing higher levels of poverty. The Survey on the Argentine Social Debt, conducted by the Argentine Catholic University since 2007, evidenced figures in the order of 25–30% in the 2008–2013 period.
The improvement in the poverty situation measured by income exhibited in the 2003–2007 period was only partially reflected in the Human Development Index (HDI)27 and the worldwide ranking calculated by the UNDP (Table 4). Although the HDI evolved positively during the last two decades (it grew 8.5% between 1990 and 2000 and 7.3% between 2000 and 2013), Argentina’s position in the world ranking improved from 51st to 43rd place during the nineties, but fell to 49th place during the last four years.
1990 2000 2005 2008 2010 2011 2012 2013HDI 0,694 0,753 0,758 0,777 0,799 0,804 0,806 0,808
HDI Ranking 51 43 51 51 49 49 49 49
Table 4. Evolution of Argentina’s Human Development Index and corresponding ranking
Source: United Nations Development Programme (UNDP).
Notes: HDI scale of 0 to 1; ranking in relative positions compared to all other countries.
Indicators which are higher than 0.8 reflect a favourable human development situation in the international context. Nevertheless, the low growth of the HDI observed during the last few years and the loss in relative position in comparison with other countries poses challenges for Argentina in assigning greater priority to matters of development, especially in terms of educational quality and health.
Impact on long-term competitiveness and foreign trade
The magnitude of the currency devaluation that occurred in 2002 implied an initial relative
competitive improvement for all Argentina’s exports, in spite of the fact that they were subject to export taxes as of that year (Table 2). This favourable context contributed to a significant increase in all Argentine exports during the years 2002 to 2007 (Graph 6).28 However, the subsequent increase in domestic prices and the overvaluation of the official exchange rate were notable as of 2011 and critical in 2013 and 2014, which meant that all of the exports gradually lost international competitiveness and their total value declined during the three-year period of 2012–2014. Between 2003 and 2013, exports grew at a

23Agricultural Trade and Sustainable Development
rate of 10.6% per year, while imports grew at an average of 16.2%, which led to a gradual decrease in the trade surplus in the order of
7% per year. This tendency increased in 2013 and the trade balance fell to its lowest level since the devaluation of 2002.
According to INDEC data, the growth indicator of the value of the total exports of goods, with the baseline 2004=100, reached 240.1 in 2013. The principal source of growth was the prices, which reached an index of 189.9 in 2013, while the quantity index reached 126.5 in the same year. In the case of imports, the value index reached 329.7 (i.e. it grew at a higher rate
than that of exports) and the principal source of growth was the quantity (237.5 in 2013), while the price index grew only to 138.8 (given that the majority of the imports were non-agricultural manufactures). The terms of trade improved by 36.8% during this decade (2004–2013), influenced principally by the increases in prices of agricultural products.
Graph 6. Argentine export and import values and trade balance. 2001–2013 (in millions of dollars)
Source: Created on the basis of COMTRADE Trademap data.
90 000
80 000
70 000
60 000
50 000
40 000
30 000
20 000
10 000
0
2001 2002 2003 2004 2005 2006 2007 2008 2009 2010 2011 2012 2013
Trade balance Imports Exports

24 M. Regúnaga and A. Tejeda Rodriguez - Argentina’s Agricultural Policies, Trade, and Sus-tainable Development Objectives
The growing import restrictions implemented in the last few years limited the growth of all sectors, especially those whose production depends on imported supplies and intermediate goods, as is the case of MIOs. These measures negatively impacted the level of activity in the manufacturing industry. Supply shortages, leading to drops in production and employment, were reported in many productive sectors. Investment was also affected by the restrictions implemented on the access to authorizations to purchase machinery and other imported equipment.
In the medium and long terms, these policies will limit the country’s competitiveness. The new forms of production organization in global value chains entail specialization and segmentation processes, stimulating the trade of intermediate goods and intra-industrial trade. Therefore, it is understood that the net long-term effects of the
measures restricting imports, by increasing the cost of, or limiting timely access to imported capital goods, inputs, services or technologies, have an adverse effect on the competitiveness of the manufacturing sector (CEPAL, 2014).29
Additionally, the trade deprotection of the agricultural sector and the appreciation of the exchange rate created disincentives for increased growth in exports, as detailed in Section 4.2. These measures also account for the decline in the pace of Argentina’s total export growth exhibited during the past three years and, with it, the growing problems associated with the deficit in the current account, which gave way to additional restrictions on the imports of general goods and restrictions on the access and use of foreign currency, denominated the “exchange lockdown”, which were initiated in October of 2011 and were amplified through the end of 2014.
Graph 7. Manufactures of industrial origin. Evolution of Argentine exports, imports and trade balance. 2003–2013 (in millions of dollars)
Source: WTO data
Graph 7 and Table A-8 of the Appendix show that, in spite of the import substitution strategy implemented in Argentina, the negative trade balance in the manufacturing industry as a whole, as well as the negative balances in Argentina’s most protected sectors (the total for machinery and equipment, motor vehicles, textiles and clothing) grew notably during the 2000–2013 period. The total trade deficit for
manufactures of industrial origin (MIOs) evolved from an annual average of 11.1 thousand million dollars in the two-year period of 2000-2001, to an annual average of 30.5 thousand million dollars in the two-year period of 2012–2013. The percentage of the trade deficit in relation to the imports of all MIOs was maintained at very similar levels: it was 56% in the two-year period of 2000–2001 and 54% for 2012–2013.
Exports ImportsTrade balance

25Agricultural Trade and Sustainable Development
The limited growth in the exports of the manufacturing sector associated with the chosen import substitution strategy and the disincentives for growth in agricultural exports, due to trade and exchange deprotection, are not new phenomena in Argentina. Thus a new economic cycle is repeated,30 culminating in a bottleneck in the external sector, which limits private investment, growth and employment.
In short, during its first years, the import substitution strategy, based on trade deprotection of the agricultural sector and high long-term trade protection of the manufacturing sector, helped promote economic growth by dynamizing domestic production and consumption, but failed to promote the sustained growth of agricultural exports or the international competitiveness of the MIOs, with the result that the possibilities for growth by exporting these industrial products were basically limited to the countries with which Argentina has preferential tariffs and MERCOSUR CET protection, creating a very high dependence on Brazilian import demand. This was also aggravated by the gradual appreciation of the exchange rate, which reduced the competitiveness of the exports from all sectors. Argentina’s long-term productive potential is very high, and the domestic market is relatively small. Therefore, if there is any hope for a high rate of sustained long-term economic growth, it will be necessary to orchestrate an alternative strategy that promotes the international competitiveness of both MIOs and agro-industrial products.31
Impact on Argentina’s international relations
The excessive delays in granting import licences, the lack of transparency and the arbitrary procedures gave rise to conflicts with Argentina’s principal trade partners. These conflicts ended up affecting the country’s exports, primarily the agricultural ones, through trade retaliation. The most notable cases have been the USA’s withdrawal of the concessions granted to Argentina under the Generalized System of Preferences,32 Brazil’s denial of entry to trucks loaded with perishable food items and
China’s ban on Argentine soybean oil imports.33 These measures have led to decreases in the value of exports, especially in the average sales prices of agro-industrial products.
Some of the affected countries turned to the international courts to challenge the Argentine regulations and practices obstructing imports. Since 2011, presentations have been made before the WTO Import Licensing Committee and Council for Trade in Goods, culminating in the request for a hearing before the Dispute Settlement Body (DSB) on the part of the European Union, the United States and Japan. There, it was reported that, since 2008, Argentina had significantly expanded the list of products subject to non-automatic licences (NALs) and that, since 2012, it had been applying new regulations for the approval of imports, indicating that both measures were in violation of WTO agreements, as they created long delays and increased trading costs (Illescas, 2014). The so-called “restrictive prescriptions related to trade” were questioned, along with the “sworn statement prior to import” (DJAI) system.34 They indicated that the latitude with which the DJAIs were processed made it nearly impossible to grant them in a timely fashion, thus limiting imports.
As could be expected, the WTO ruled against Argentina. In the Report published in August of 2014,35 the Task Force (TF) assigned to the matter ruled that the measures applied by Argentina had limiting effects on the import of merchandise. Besides the direct limiting effects, it indicated that the application of such measures had been characterized by a lack of transparency and predictability, which further discouraged imports. The TF recommended that Argentina rescind the measures that were incompatible with the obligations it assumed in the 1994 Agreement. The WTO ratified the TF recommendations, denying Argentina’s right to appeal, which means that the country must rectify the contested measures or undertake negotiations to establish mutually acceptable compensations. Otherwise, the claimants may request DSB authorization to adopt retaliatory measures.

26 M. Regúnaga and A. Tejeda Rodriguez - Argentina’s Agricultural Policies, Trade, and Sus-tainable Development Objectives
It would be very difficult for Argentina to maintain its import restriction policy and emerge unscathed. It faces the dilemma of either modifying the policy or being submitted to trade sanctions on the part of the EU, USA and Japan. Given that the principal export products to these markets are of agricultural origin, it is expected that any possible sanctions would apply to the agro-industrial sector. This could affect the country’s total exports, further reducing the trade balance and aggravating the current scarcity of foreign exchange (Illescas, 2014).
In addition to the above circumstances, in the past few years, Argentine trade policy has been the object of criticism within MERCOSUR, due to the intrazone obstacles to trade implemented and the refusal to negotiate trade agreements with third countries. Since the formation of MERCOSUR as a Customs Union, Argentina has negotiated free trade agreements (FTAs) as a member of the regional bloc. The FTAs that have been made, most of them before 2004, are not very significant in terms of the trade flows they entail. Within the region, MERCOSUR has reached Economic Complementation Agreements (ECAs) with a large number of South American countries.36 Outside of the region, MERCOSUR has negotiated FTAs with Israel, Egypt and Palestine, as well as Fixed Preference Agreements with India and the South African Customs Union, which only reach 450 and 950 tariff positions, respectively.37 Institutional deficiencies and disagreements on international insertion strategies among the MERCOSUR Member States have resulted in an international trade relations agenda of very little substance.
Currently, the only negotiations of importance that MERCOSUR is moving forward are those aimed at an association with the European Union. Although 18 years have passed since these negotiations began, it has still not been possible to conclude them in spite of the fact that both parties continue declaring their will to arrive at an agreement. After relaunching negotiations in May of 2010, no progress has
been made toward entering into the final stages.38 Even though Brazil, Paraguay and Uruguay have recently shown interest in concluding them, the Argentine Government perceives this type of negotiations more as a threat than an opportunity, showing reluctance to offer concessions in industrial goods that would signify a reversal of its import substitution model (INAI, 2014). These differences make it difficult for MERCOSUR to advance a more aggressive agenda of foreign relations that would involve it in negotiations with the principal markets of the world. Due to the fact that it does not participate in any of the new mega-regional initiatives, such as the Transatlantic Trade and Investment Partnership (TTIP), the Trans-Pacific Partnership (TPP) and the Regional Comprehensive Economic Partnership (RCEP), MERCOSUR could be left out of the new map of global trade integration.
Evolution of tax revenues and tax burdens
The incorporation of export taxes, the growth in economic activity and the increases in nominal prices not incorporated in the updates of some bases for calculating tax deductions contributed to significant growth in tax revenues during the entire analysed period, in nominal terms and in relation to the GDP (tax pressure). Argentina’s total net tax pressure estimated by the Secretary of Taxation evolved from 20.9% of the GDP in 2001 to 37.5% in 2012 (Table A-3 of the Appendix).39 In 2012, Argentina was the country with the highest tax pressure in Latin America, where the average was 20.7% (CEPAL, 2013).40
Export taxes were one of the principal sources of the increase in tax revenues during the first decade of the century, given that they had been eliminated during the nineties. In the period 2003–2013, the collection of taxes on exports was the fourth most important fiscal source, after VAT, Income Tax and Social Security Contributions (Table A-4 of the Appendix). Export taxes permitted increasing the total tax pressure by 2.45% of the GDP in 2003. Subsequent increases in the rates and in the value of exports permitted increasing

27Agricultural Trade and Sustainable Development
its share to 4.39% of the GDP in 2008. Its percentage share then declined to 2.83% of the GDP in 2012. Taxes on profit (including the Income Tax and others of lesser significance) increased gradually: they evolved from 4% of the GDP in 2001 to 4.97% in 2009 and to 6.47% in 2012. VAT increased from 5.7% of the GDP in 2001 to 8.8% in 2012, influenced by the growth in production and prices.
It seems that it would be difficult for Argentina to continue increasing tax pressure without seriously affecting its economic growth. On the contrary, for many sectors, agriculture among them, the current tax pressure is very high and incompatible with production growth, especially in the regional economies. From March of 2007 to the present, the Agricultural Foundation for the Development of Argentina (FADA) has estimated the State share in total agricultural income, based on the evolution of various components: national and provincial taxes, land leases, operation costs and profits (see the reports at www.fundacionfada.org).41 The drop in international prices and the increases in national and provincial taxes recorded during the past few years exhibit a notable increase in the indicator of the State share in agricultural income: in September of 2013, it was 75.4%, growing to 81.7% in September of 2014 (the highest value of the past four years). The distribution estimated by FADA for September of 2014 was: National taxes 75%; Provincial taxes 2.6%; Land leases 18%; Operation costs 4%; and profits 0.3%. This means an extremely low bottom line and savings capacity for producers who do not own their land (in Argentina, close to 70% of grain production is carried out by producers who lease their land).
4.2. Impact of the agricultural policies on the main variables of the agricultural sector
Effects on the domestic prices received by the producer and on market performance
The agricultural policies implemented in the past decade have had the effect of reducing the domestic prices received by the producer when compared with the corresponding export prices. They were reduced through the effects of the export taxes and restrictions (Export NTBs) and other trade controls. The constant changes in the rules of the game (for example the valid period of the Registries of Export Operations) generated high uncertainty, which gave way to hidden costs and, therefore, higher transaction costs (deductions) in the value chain.
In Graphs 8 & 9, one can observe the evolution of the differences between the prices received by the producer and the FOB export prices in Argentina in effect for wheat and corn, respectively, during the period 2007–2014. A first difference corresponds to the impact of the export taxes and shipping costs, i.e. the difference between the FOB price and the theoretical FAS price. The FAS price is calculated on a daily basis by MINAGRI and other sources:42 it is the price that should be received by the producer in the domestic market (at the port) in the event that there are no Export NTBs. On the other hand, the price received by the producer at the port upon completion of the sale was calculated, using the first position of the Buenos Aires Futures Market (MATba) as a reference. It should be noted that the prices received by the producers in their farms also involve discounting transport and other costs incurred from the point of origin to the port.

28 M. Regúnaga and A. Tejeda Rodriguez - Argentina’s Agricultural Policies, Trade, and Sus-tainable Development Objectives
Graph 9. Corn. Evolution of export and domestic prices in Argentina Period 2007–2014 (in dollars per ton)
Source: Based on MINAGRI and Buenos Aires Grain Exchange data. See footnote #42 for 2008.
The difference between the theoretical FAS price and the price received by the producer at the port is the result of the impact of the Export NTBs (represented in purple). This lower price received by the producer gave way to an extraordinary margin for the exporter (or the miller), on top of the
normal costs and margins (which are included in the shipping costs for calculation of the theoretical FAS). It is due to the imbalance between the market power of the producer and the buyer, as a result of the effects of the Export NTBs (demand limited by the quota facing a substantially higher supply).
Source: Based on MINAGRI and Buenos Aires Grain Exchange data See footnote #42 for 2008.
600
500
400
300
200
100
0
-100
-200
-300
-400
Record margin FOB Theoretical FAS Price to the producer
01.
20
07
05
.20
07
09
.20
07
01.
20
08
05
.20
08
09
.20
08
01.
20
09
05
.20
09
09
.20
09
01.
20
10
05
.20
10
09
.20
10
01.
20
11
05
.20
11
09
.20
11
01.
20
12
05
.20
12
09
.20
12
01.
20
13
05
.20
13
09
.20
13
01.
20
14
05
.20
14
01.
20
07
05
.20
07
09
.20
07
01.
20
08
05
.20
08
09
.20
08
01.
20
09
05
.20
09
09
.20
09
01.
20
10
05
.20
10
09
.20
10
01.
20
11
05
.20
11
09
.20
11
01.
20
12
05
.20
12
09
.20
12
01.
20
13
05
.20
13
09
.20
13
01.
20
14
05
.20
14400
350
300
250
200
150
100
50
0
-50
Record margin FOB Theoretical FAS Price to the producer
Graph 8. Wheat. Evolution of export and domestic prices in Argentina. Period 2007–2014 (in dollars per tonne)

29Agricultural Trade and Sustainable Development
With increased government intervention in the markets, arising from the introduction of export restrictions in 2007, wheat and corn producers were subject to significant discounts in the sale prices of their products, which were far below the respective international prices. During the final months of 2010 and the initial months of 2011, the difference between the theoretical FAS price and the price received by the producer who sold during those months increased significantly, surpassing 70 dollars per tonne in certain months of 2011 and 2012, for both wheat and corn.43
In the case of wheat, an exceptional situation was recorded during certain months of 2013 (which is observed in the negative values of the extraordinary margin in that year in Graph 8). The unexpected, circumstantial scarcity in supplies, due to the lack of transparency (reliable information on the principal market indicators), a poor harvest arising from the decrease in the cultivated area and serious quality problems that did not permit using all of the production for human consumption, gave rise to a short-term shortage of wheat suitable for bread production in the domestic market,
for which reason the prices paid to producers of good-quality wheat rose significantly, and it was sold above the international reference price, meaning that negative margins were generated by the exporters and millers, who were supposed to pay exceptional prices in order to acquire grain to fulfil their export commitments or to supply the domestic market.
Graph 10 depicts the percentage of the export price received by the producers in the domestic market at the shipping port for wheat, corn and soy. It reflects the combined impact of the export taxes, Export NTBs and shipping costs. In the case of soy, the producer received between 60% and 68% of the FOB price (the deductions correspond for the most part to export taxes of 35%). In the case of wheat and corn, the percentages of the FOB price received by the producer varied seasonally each year, but in many months they had deductions higher than those applied to soy, in spite of the fact that the export taxes on cereals were substantially lower (they were due to the additional effects of the Export NTBs). In Table 5, the impact of taxes is indicated in relation to the total deductions.
Graph 10. Percentage of export price received by wheat, corn and soy producers
Source: Created on the basis of MINAGRI and Buenos Aires Grain Exchange data
Note: The extraordinary increase in the price of wheat in 2013 was previously mentioned: it was attributable to problems associated with the lack of transparency and poor market performance, as a result of systematic interventions.
200%
180%
160%
140%
120%
100%
80%
60%
40%
01.
20
07
05
.20
07
09
.20
07
01.
20
08
05
.20
08
09
.20
08
01.
20
09
05
.20
09
09
.20
09
01.
20
10
05
.20
10
09
.20
10
01.
20
11
05
.20
11
09
.20
11
01.
20
12
05
.20
12
09
.20
12
01.
20
13
05
.20
13
09
.20
13
01.
20
14
05
.20
14
Wheat Corn Soy

30 M. Regúnaga and A. Tejeda Rodriguez - Argentina’s Agricultural Policies, Trade, and Sus-tainable Development Objectives
Source: Created on the basis of MINAGRI and Buenos Aires Grain Exchange data
Notes: *During various months in the years 2007 and 2008, there were modifications in the rates. **The total deductions include the effects of taxes, Export NTBs and shipping costs.
YearExport taxes (%)
Total export deductions (%)**
Share of Taxes in total deductions (%)
Wheat Corn Soy Wheat Corn Soy Wheat Corn Soy
2007* 21% 21% 28% 44% 25% 30% 48% 84% 94%
2008* 30% 26% 38% 45% 31% 38% 65% 83% 100%
2009 23% 20% 35% 35% 31% 37% 65% 65% 94%
2010 23% 20% 35% 37% 31% 36% 62% 64% 97%
2011 23% 20% 35% 47% 42% 37% 49% 48% 95%
2012 23% 20% 35% 39% 37% 34% 58% 54% 100%
Table 5. Impact of taxes and Export NTBs on wheat, corn and soy in ad valorem equivalents of the FOB price in the Argentine ports. 2007–2012 period (percentages)
Many variables enter into the impact of Export NTBs, corresponding to hidden costs associated with: a) frequently changing market interventions, quota definitions and Registry of Export Operations authorizations; b) growing administrative charges resulting from the regulations; c) risks of ex post sanctions for supposed non-compliance with certain bureaucratic requirements; d) risks brought about through the application of Law 26,351 on export operation registries; e) costs associated with excessive delays in tax refunds (VAT and other export refunds).
Hidden costs were also generated due to the lack of reliable information on the supply and demand for grain and grain by-products. The closure of the ONCCA, which was in charge of market information and transparency, the changes in authorities responsible for the regulations and the lack of continuity in the publication of key information on stocks, industrialization, sales and purchase statements from the various operators, etc. are creating uncertainty, inefficiency and high transaction costs in the chains and conflicts between the various links.
Besides the impact on the reduction in the prices received by the producers, the Export NTBs generated high uncertainty. Graphs 8 & 9 permit us to observe that the Export NTBs gave rise to high seasonal and interannual variability in the extraordinary margins and domestic prices, associated with company decisions not controlled by the government, leading to poor
market performance. The absence of legislation regarding the application of export restrictions creates a lack of transparency and predictability in the markets.
Uncertainty with regard to when and in what volume exports will be restricted in each agricultural season has not only resulted in very high deductions in the prices paid to producers, but also, in certain periods, in the inability of producers to find buyers for their grain, which created an additional financial burden that is difficult to quantify. Unable to sell their products, many producers were unable to finance their operations costs through their production and were forced to go into debt.
Export NTBs have not only generated extraordinary profits of great magnitude for those exporters that obtained REOs to export within the established quotas, but have also given rise to the quest for those profits by promoting the diversion of resources to influence the authorities in order to gain access to REOs. Domestic processors also benefitted because they were able to purchase their principal input (grain and by-products) at lower prices (Nogués, 2014).
Impact on the evolution of the cultivated area, yield and total production of cereals and oilseeds
The production of total grains (cereals and oilseeds) constitutes the principal component of production and export in the Argentine

31Agricultural Trade and Sustainable Development
The increase in production was more vigorous during the first six seasons of the analysed period (4.8% per year). Starting in the year 2007, total growth in grain production slowed, diminishing to 2.7% per year (Graph 12). This decline was influenced by the export restrictions and the appreciation of the
exchange rate (devaluation of the currency at a lower rate than the evolution of inflation). Both of these limited the potential effects that could have been exerted by the high international grain prices observed during this second period.
Figure 11: Evolution of the cultivated area and total production of grains in Argentina. Period 2000/01-2013/14 (millions of hectares and millions of tonnes).
Source: Created on the basis of MINAGRI and Buenos Aires Grain Exchange data.
agricultural sector. Total production grew at a rate of 3.5% per year between the 2000/01 and 2013/14 seasons, evolving from 64 to 105
million tonnes. The principal source of growth was the cultivated area, which grew at a rate of 2.5% per year (Graph 11).
120
100
80
60
40
20
0
20
00
/01
20
01/
02
20
02
/03
20
03
/04
20
04
/05
20
05
/06
20
06
/07
20
07
/08
20
08
/09
20
09
/10
20
10/1
1
20
11/1
2
20
12
/13
20
13/1
4
Total production Planted area y = 2,89x + 62,68
y = 0,67x + 22,72Drought

32 M. Regúnaga and A. Tejeda Rodriguez - Argentina’s Agricultural Policies, Trade, and Sus-tainable Development Objectives
Similar observations can be made for the limited growth in other activities, such as beef and dairy. In Table A-9 of the Appendix, the increased growth in beef and dairy production during the last decade in other MERCOSUR countries that did not apply these policies can be verified. Brazil, Paraguay and Uruguay took advantage of the opportunities provided by the world market to increase their production and exports.
Growth in total grains production was led by soy: production almost doubled during the analysed period (an increase of 4.6% per year). Corn production also increased, but at a slower rate, reaching 25 million tonnes during the 2013/14 season. In contrast, wheat production fell from 16 million tonnes in 2000/01 to 10 million in 2013/14 (Graph 13).
Graph 13. Evolution of the production of the principal grains. 2000/01–2013/14 period (in millions of tonnes)
Source: Created on the basis of MINAGRI and Buenos Aires Grain Exchange data
Graph 12. Evolution of the cultivated area and total production of grains in Argentina* during the 2001/01–2005/06 and 2006/07–2013/14 periods. Trends in each period (in millions of hectares and millions of tonnes)
Source: Based on MINAGRI and Buenos Aires Grain Exchange data.
Notes: *Grains include cereal grains and oilseeds. **According to a Chow Test, the hypothesis of no structural change in 2006 is rejected when estimating a trend for the production logarithm with a significance of 10% (value P=0.0548351). Observations for the 2008/09 season are excluded as they are considered exceptional (heavy drought).
100
80
60
40
20
0
Total production Planted area
y = 3,46x + 60,4
y = 0,70x + 22,5
20
00
/01
20
01/
02
20
02
/03
20
03
/04
20
04
/05
20
05
/06
120
100
80
60
40
20
0
y = 2,34x + 82,7
y = 0,52x + 27,5
20
06
/07
20
07
/08
20
08
/09
20
09
/10
20
10/1
1
20
11/1
2
20
12/1
3
20
13/1
4
Total production Planted area
Drought
110
90
70
50
30
10
-10
20
00
/01
20
01/
02
20
02
/03
20
03
/04
20
04
/05
20
05
/06
20
06
/07
20
07
/08
20
08
/09
20
09
/10
20
10/1
1
20
11/1
2
20
12
/13
20
13/1
4
Soy Corn Wheat Barley Sorghum Sunflower Other

33Agricultural Trade and Sustainable Development
The growing importance of oilseeds in Argentina’s productive structure is observed through the analysis of the evolution of the cultivated area. During the 2000/01–2013/14 period, the area cultivated with oilseeds grew significantly. In contrast, the area with cereals did not exhibit a growth trend
during those 13 seasons (Graph 14). This is attributable to the higher profitability of soy, its lower planting and cultivation costs, and the lesser uncertainty associated with government interventions (it was not subject to the NTBs applied to wheat and corn).
The share of soy exhibited a notable increase in the makeup of the total area cultivated with grains in Argentina: it evolved from 45% to 65% of the total between 2000/01 and 2013/14 (Graph 15). The area designated for soy grew by approximately 720 hectares per year during that period, exceeding 20 million hectares in 2013/14. Wheat was the crop that exhibited the greatest loss of cultivated area (250 thousand hectares per year), evolving from 6.5 million
hectares in 2000/01 to 3.6 million hectares in 2013/14, reaching its historical minimums. The rest of the principal annual crops (corn and sunflowers) lost part of their share in the total cultivated area. The exception was barley, which is produced during the same period as wheat. As a consequence of the trade restrictions on wheat starting in 2007, barley partially substituted it and tripled its cultivated area between 2007/08 and 2013/14.
Graph 14. Evolution of the area cultivated with cereals and oilseeds. 2000/01–2013/14 period (in millions of hectares)
Source: Created on the basis of MINAGRI and Buenos Aires Grain Exchange data
20
00
/01
20
01/
02
20
02
/03
20
03
/04
20
04
/05
20
05
/06
20
06
/07
20
07
/08
20
08
/09
20
09
/10
20
10/1
1
20
11/1
2
20
12
/13
20
13/1
4
25
20
15
10
5
0
Cereals Oilseeds
y = 0,68x + 13,03
y = -0,01x + 9,68

34 M. Regúnaga and A. Tejeda Rodriguez - Argentina’s Agricultural Policies, Trade, and Sus-tainable Development Objectives
The extremely high share of soy in the cultivated area and production, in part as a response to the Export NTBs applied to wheat and corn, is considered an evolution that fuels possible threats, from the viewpoint of both climate variability and environmental sustainability, as well as from the perspective of trade.
In terms of resource conservation, the sustainable intensification productive system developed in Argentina during the last two decades involves the use of crop rotation (for example, the sequences between soy, corn and wheat or barley), which make different contributions to the soil structure and differ in their nutrient requirements. Furthermore, soy monoculture can lead to the emergence of plant deseases or plagues by failing to interrupt their biological cycles with alternative crops in successive years. Additionally, the climate fluctuations to which agricultural production is subject to between the various periods of the year and between successive years also poses the risk of high dependence on the seasonality of a single crop.44
From a trade point of view, in spite of the fact that the worldwide demand for oilseeds and their by-products is one of the most dynamic,
the excessive concentration of exports on a single complex (somewhere over half of the agricultural sector’s total exports and more than 25% of Argentina’s total exports) also poses market risks and excessive dependence on the import markets for those products. The case of the export barriers on soybean oil in China has been mentioned. In this case, biofuel production helped diversify the demand (food and energy) and the import countries, which ended up being strategic and very positive for Argentina when China limited imports of Argentine soybean oil.
One positive aspect in terms of product and market differentiation is that, during the past 20 years, the Argentine oilseed milling industry has achieved an outstanding level of development that has placed it among the best and most modern crushing centres in the world, with plants located at the ports, modern technology and a highly competitive scale. Argentina is the export country that processes the greatest proportion of soy and sunflower production, exporting them as oil, meal and biodiesel. In addition to the abovementioned factors, industrial competitiveness has improved with the export tax differentials detailed in Graph 3.
Graph 15. Changes in the structure of the area cultivated with cereals and oilseeds in Argentina (% of total grains area)
Source: Created on the basis of MINAGRI and Buenos Aires Grain Exchange data
2000/01 2013/14
Sunflower
9%
Sunflower
5%
Wheat
28%
Wheat
12%
Barley
1%
Barley
4%
Sorghum
3%
Sorghum
3%Soy
45%
Soy
65%Corn
Corn

35Agricultural Trade and Sustainable Development
Impact on production structures and systems, the adoption of technology and competitiveness
The unfavourable relative domestic input-output price structure in effect in Argentina during the last decade, when compared with that of the principal competing countries that support their producers, or that do not apply agricultural policies that discriminate against trade, like those detailed in Chapter 3,45 has had various implications. On the one hand, it has generated disincentives for increased growth in cultivated area, yields and total agricultural production, as detailed in Graph 12 and Table A-9 of the Appendix. The price deductions that result from export taxes, Export NTBs and other trade policies reduce the competitiveness of all Argentina’s agriculture in comparison with that of its principal competitors, but especially in the case of the activities that are most demanding in terms of labour, technological supplies and capital, as well as those that are furthest from the ports, which are, in general, the poorest.
The context of less favourable relative prices for agricultural activities had diverse implications in different subsectors, regions and company types. Some subsectors were able to increase their competitiveness and grow (especially certain extensive grain crops in the Pampean region), while other regional livestock farming and agricultural activities (which are generally more demanding in terms of labour and inputs, including irrigation) grew at a lesser rate or even declined. The competitive disadvantages of these regions (their distance from the principal domestic markets and export ports, less favourable ecological conditions, high costs and lack of development in the transport infrastructure, productive structure with smaller units) did not allow them to absorb the trade deprotection, which especially limited development in the interior of the country.
The trade deprotection policies implemented during the last decade, which did not contemplate differentiation by size and which also were in effect during previous decades, had repercussions on the productive structure:
since the sixties, the size of the production units has exhibited a process of concentration and reduction in the number of producers, a trend that increased between the last two National Agricultural Census, from 2001 to 2008 (Figure A-3 of the Appendix). The policies in support of small producers, mentioned in Section 2.5, were insufficient to limit this concentration process, given that the lower prices received by the producers had a greater effect on the economic results of the smaller-sized units (Cetrángolo et al., 2011).
From another perspective, fairly unfavourable relative prices lead to the development of extensive production systems with lower costs per hectare, but with less production than their potential yield.46 In that context of less favourable input-output prices than those in effect in the USA or Europe, environmentally-friendly and very competitive production systems were developed. As detailed in Chapter 1, Argentine agriculture makes wide use of direct seeding (Figure A-4) and crop rotation, which involve less energy consumption, decreased necessity for fertilizers and use of insecticides, and better use of the available rainwater in the soil. Lower amounts of fertilizer were used than in other countries, fewer agrochemicals were used in general, tending toward biological pest control and genetic resistance of the seeds to facilitate control of weeds, diseases and plagues, and irrigation was practically unused in the greater part of the cultivated area. In this sense, the prevailing production systems are very efficient in the use of chemical and energy supplies and have a low impact on global warming (see Graphs A-7 and A-8 and Table A-12 of the Appendix). Figure A-9 enables us to observe the lower share of agrochemicals and fertilizers in Argentina’s GHG emissions as compared to France and the worldwide average. 47
However, the positive effects on the environ-ment (sustainability and global warming) are subject to threat when domestic prices and economic conditions become too much unfavourable, like those in effect in 2012–

36 M. Regúnaga and A. Tejeda Rodriguez - Argentina’s Agricultural Policies, Trade, and Sus-tainable Development Objectives
2014, because the tendency moves toward soy monoculture, the soil nutrients used up by the crops stop being replaced (insufficient amounts of fertilizer—Figure A-5) and improved seeds and other technological supplies stop being used. Graph 16 shows the drop exhibited in the year 2012/13 in the use of high levels of technology (from 47% to 37% of the total cultivated area), as a consequence of the impact of export taxes and restrictions, appreciation of the exchange rate and the decrease in international prices. The impact has been greater on wheat and corn crops, given the fact that they involve higher costs per hectare due to their greater consumption of fertilizer (Figure A-6).
Various studies (Trigo, 2012; PEA2, 2010, AACREA, 2013) indicate that agricultural productivity could grow notably in Argentina through technologies that are already available and those that are currently under development. The technological gaps are very wide in some livestock farming activities (in the order of 100% in cattle farming) and also significant in agricultural activities (in the order of 30% for the principal crops). This implies that, within a context of more favourable price incentives, production could make a quick response in the adoption of available technology, in additional to the corresponding increases in cultivated area.
Graph 16. Use of various levels of technology in 2010/11 and 2012/13 (in % of the total)
2010/11 2012/13
Impact on the evolution of Argentine agro-industrial exports
Exports of agro-industrial products grew during the analysed decade, exceeding 40 thousand
million dollars in 2013. This growth enabled the country to increase its participation in worldwide trade of those goods, from 2.6% in 2001 to 2.9% in 2013 (Graph 17).
High High
Median Median
Low Low
47%
42%
11% 13%
50%
37%Medium Medium
Source: ReTAA- Buenos Aires Grain Exchange, 2014.

37Agricultural Trade and Sustainable Development
Nevertheless, there are two distinct periods. Between 2001 and 2008, exports grew at an annual rate of 18%. This growth rate then decelerated due to the reasons already mentioned. In 2011, a historical maximum of 43.6 thousand million dollars was reached, but in the following years, exports declined with the country’s consequent loss of share in international trade.
Although exports had grown, upon investigating Argentina’s participation in world trade, there
are weaknesses that put the country in a vulnerable position. Exports are very focused on just a few products: those of the soy complex (beans, oil, flour and biodiesel) accounted for 49% of Argentina’s sales in products of the sector during the three-year period 2011–2013 (Table 6). They were followed in importance by the corn chain (13%), the wheat chain (6%) and the beef chain (5%). Exports from the wheat chain declined during the period under study.
Graph 17. Argentine agro-industrial exports and participation in worldwide trade (in millions of dollars and percentages)
Source: INAI Foundation, based on the COMTRADE Trademap.
ChainsAverage Value 2011–13 (in
millions of dollars)Share Total growth 01–13
Total 42.136 100% 264%
Soy 20.849 49% 324%
Corn 5.593 13% 525%
Wheat 2.630 6% -21%
Beef 2.192 5% 124%
Milk 1.617 4% 473%
Grapes 1.239 3% 504%
Sunflowers 1.115 3% 40%
Barley 1.081 3% 1196%
Other 5.821 14% 211%
Table 6. Exports of Argentina’s principal agro-industrial chains (in millions of dollars and percentages)
Source: Created on the basis of Trademap.
Note: Corresponds to the 32 principal agri-food chains, according to the methodology of Rebizo and Tejada (2011).
45 000
35 000
25 000
15 000
5 000
-5 000
4,0
3,0
2,0
1,0
0,02001 2002 2003 2004 2005 2006 2007 2008 2009 2010 2011 2012 2013
Argentine agricultural exports Argentine participation
Mill
ions
of
dolla
rs
Perc
ent

38 M. Regúnaga and A. Tejeda Rodriguez - Argentina’s Agricultural Policies, Trade, and Sus-tainable Development Objectives
In particular, the case of wheat exports to Brazil merits analysis. Brazil, the world’s second largest wheat importer, has historically covered nearly 80% of it cereal supply needs through purchases from Argentina (Graph 19). Argentina’s drop in production and exportable supply led the neighbouring country to increase its purchases from Uruguay and Paraguay. Nevertheless, the volume offered by these countries was not sufficient to cover the decrease in Argentine supplies. For this reason, Brazilian importers have turned to
wheat from the United States, Australia and Canada. On various occasions since the year 2008, faced with the impossibility of supplying the country’s needs through Argentina, Brazil’s Foreign Chamber of Commerce (CAMEX) decided to temporarily suspend the 10% Common External Tariff (CET) on wheat imports from non-MERCOSUR countries. The Brazilian authorities indicated that this decision was made in order to prevent supply shortages and domestic price increases on wheat and wheat by-products.
Concentration is also present in the destinations. More than 50% of the exports are targeted at 5 markets: the EU (20%), MERCOSUR (13%), China (10%), the United States (4%) and Chile (4%). In the principal exported products, high concentration is also observed: 45% of the soybean meal is exported to the EU, 45% of the soybean oil goes to India, Iran and China, 82% of the soybeans go to China, and 60% of the wheat goes to Brazil. In the case of corn, sales are more diversified: Colombia, Algeria, Peru, Malaysia, South Korea and Egypt acquire 55% of the total.
Another weakness is that the sales of products with second-stage industrial processing barely represent 15.4% of exports. Untransformed goods represent 30%, and more than half of Argentina agro-industrial exports (54%) correspond to first-stage processed goods,
principally soybean oil and meal. With an export structure concentrated in the first stages of the agri-food chains, Argentina misses out on a significant opportunity for global exchange, which for the most part corresponds to products with second-stage industrial processing (Anllo, G., Bisang, R. et. al., 2013).
If export volumes are taken into consideration, with the exception of corn, the principal products traded by Argentina suffered drops during the past few years. Throughout the analysed period, among those with the poorest performance were wheat, sunflowers and beef. Starting in the year 2007, with the introduction of the Export NTBs and other restrictions, exports of wheat and beef entered a phase of descent, currently situated at historic minimums (Graph 18). This has signified the loss of very important markets that Argentina supplied.
Graph 18. Evolution of Argentine exports of wheat and beef. 2001-2013 period (in thousands of tonnes)
Source: Created on the basis of Trademap.
14 000
12 000
10 000
8 000
6 000
4 000
2 000
0
500
400
300
200
100
0
2001 2002 2003 2004 2005 2006 2007 2008 2009 2010 2011 2012 2013
Wheat Boneless beef (secondary axis)

39Agricultural Trade and Sustainable Development
Graph 19. Evolution of Brazil’s wheat imports and Argentina’s share. 2001–2013 (in thousands of tonnes and in percentages)
Source: Based on Trademap data.
Bearing in mind Argentina’s reduced harvest in 2013/14 and its export restrictions (limited opening of the export registry), the country again lost positions in the Brazilian market to the USA and the remaining MERCOSUR partners. It is estimated that, during the 2013/14 season, Argentina had the lowest wheat exports to Brazil of the past 24 years, covering barely 25% of that market. Argentina has lost its status as a reliable provider to Brazil, which has resulted in that country forging relationships with other export sources outside of the region. If this trend continues, Argentina could lose its principal market for a traditional product that has contributed so much to its export basket and for which it enjoys a tariff preference implying higher prices received.
Similar comments could be made regarding beef exports. After recovering the necessary health safety status to export beef (the foot-and-mouth disease outbreak in 2001 practically closed access to all markets), starting in 2002, a process of rapid growth began in beef exports until 2005 (Graph 18). Subsequent government interventions limited the growth in production (in contrast to what happened in neighbouring MERCOSUR countries—Table A-9 of the Appendix)
and exports; the last ones dropped to a minimum in 2013, which has led to the loss of relevant markets, having reached the extremes of non-compliance with the preferential access rates to the EU. From another perspective, the drastic drop in cattle stock during the 2008–2011 period led to a significant decrease in Argentina’s GHG emissions (Figure A-10 of the Appendix).
Impact of the regulations on the grain futures markets
The high inflation rates that were in effect for many decades in Argentina until 1990 and the uncertainty in the evolution of the exchange rate in constant currency led to the futures market experiencing very little development in the previous decades (from the forties to the eighties). They signified the lack of an important mechanism for managing price risk. Graph 20 permits us to verify that the authorization to use quotations in dollars as of 1991 and the currency stability exhibited during the nineties led to a significant increase in the volumes traded, with the consequent advantages for all participants in the value chains (sellers and buyers) for mitigating the risks of the market and the exchange rate.
8 000
7 000
6 000
5 000
4 000
3 000
2 000
1 000
0
100%
90%
80%
70%
60%
50%
40%
30%
20%
10%
0%
2001 2002 2003 2004 2005 2006 2007 2008 2009 2010 2011 2012 2013
Imports from Argentina Total imports Argentine participation

40 M. Regúnaga and A. Tejeda Rodriguez - Argentina’s Agricultural Policies, Trade, and Sus-tainable Development Objectives
Source: MATba.
In 2002, trade in dollars was limited, which had a very serious initial impact on the use of this mechanism, as can be seen in Graph 20. However, mechanisms were subsequently found to partially mitigate the limitation, allowing the volume to grow until reaching a maximum in 2012, although the growth was of a lesser magnitude than that corresponding to grain production, as certain risks remained in relation to the evolution of the official exchange rate and the inflation rate.
At present, the principal problem facing the futures market is the implementation of the new Capital Market Law. The regulations impose requirements that fail to adequately account for the function of these types of commodity markets and that could result in a high concentration of traders. This has led to another decrease with regard to their use. To date, the authorities have not defined any alternatives that would enable preventing the disappearance of a large part of the traders and the negative implications it would entail.
Impact of the new legislation related to forests. Laws on the conservation and use of natural resources.
The forestry law that was approved in 2007 has led to better conservation and management of natural resources. Graph 21 shows that, in the most sensitive area of Argentina, the Northwest, a decrease was exhibited in the annual deforestation rate upon implementation of the new legislation.
Figure A-9 of the Appendix shows the relatively low impact of deforestation on the total GHG emissions of Argentine agriculture for the 2007–2011 period. Instead, one can observe the high share of GHG emissions that can be attributed to cattle farming. Argentina has one of the largest stocks of cattle in the world, which is why it appears on the list of the top 10 countries with the highest GHG emissions (Figure A-11 of the Appendix).
100 000
90 000
80 000
70 000
60 000
50 000
40 000
30 000
20 000
10 000
0
Volume traded (MATba) Total production19
98
198
9
199
0
199
1
199
2
199
3
199
4
199
5
199
6
199
7
199
8
199
9
20
00
20
01
20
02
20
03
20
04
20
05
20
06
20
07
20
08
20
09
20
10
20
11
20
12
20
13
Graph 20. Evolution of total grain production and the volume traded in the Buenos Aires Futures Market (MATba). 1988–2013 period (thousands of tonnes)

41Agricultural Trade and Sustainable Development
Graph 21. Evolution of the yearly deforested area in the Northwest of Argentina. 1950–2010 (ha./year)
Source: Viglizzo, E., 2001 based on Volante et al.
On the other hand, Argentina still does not have national legislation on land zoning and use, for which reason the responsibility for these matters is in the hands of the provincial governments. The lack of a national regulatory framework for zoning that takes land use into account is considered a significant missing element for achieving the desired objective of ensuring responsible management of natural resources. On the other hand, for the development of adequate and balanced legislation, the scientific information available in Argentina in relation to the response to the management of various types of land and environments is very limited, which poses the challenge of being able to rely on further public research on the subject.
Impact on biofuel production and export
Biofuel production experienced notable growth beginning in 2008. Biofuel production totalled 170 thousand tonnes in 2007 and multiplied until reaching nearly 2.5 million in 2012. The investments made were motivated by the virtuous combination of domestic policies that favoured the building of new plants (fiscal benefits to consumption and tiered export taxes) and leveraging local advantages of access to raw
materials, access to the ports and the short or negligible distance between the oil and biodiesel plants. The dynamic process of investments in the Argentine biodiesel industry brought the production capacity of the sector up to 3 million tonnes in 2011, with high-technology plants that were larger than those of the principal competitors.48 The industry initially developed as a result of the growing international demand generated by countries like the EU, which established mandatory blends for fossil fuels in order to diversify their energy matrices, but without having a sufficient local supply (Graph 22). In 2010, the Argentine government also established a mandatory blend for replacing fuel oil with biodiesel for the domestic market.49 This led to an increase in total demand, although of a lesser magnitude than the export demand.
During 2013 and 2014, biodiesel production faced problems in the domestic market and in exports. There were frequent changes in domestic legislation related to export taxes and domestic supply prices. On top of this, there were trade defence measures implemented by the EU, which paralysed sales to the principal Argentine biodiesel market in 2014 and seriously affected the sector’s production and exports.
0 50000
100000 150000 200000 250000 300000 350000 400000
1950 1960 1970 1980 1990 2000 2010 Satellite estimates

42 M. Regúnaga and A. Tejeda Rodriguez - Argentina’s Agricultural Policies, Trade, and Sus-tainable Development Objectives
Graph 22. Evolution of the production, domestic consumption and export of biodiesel in Argentina (thousands of tonnes)
Graph 23. Evolution of the production and domestic consumption of bioethanol in Argentina (thousands of tonnes)
Source: INDEC and CARBIO data.
Source: INDEC.
The production of ethanol made from corn and sugarcane has also shown significant growth during the past few years, reaching 374 thousand tonnes in 2013 (Graph 23), which involved investments in modern processing plants. In this case, the almost exclusive
destination has been the domestic market, created through the establishment of a mandatory blend for gasoline (in 2013, it was 6.5%).50 Private estimates indicate that, in 2013, 64% of the ethanol was produced from sugarcane and 36% from corn.
3000
2500
2000
1500
1000
500
0
2007 2008 2009 2010 2011 2012 2013
Production Consumption Exports
400
350
300
250
200
150
100
50
0
2009 2010 2011 2012 2013
Production Consumption

43Agricultural Trade and Sustainable Development
Integrated effect of the producers support policies implemented by Argentina in accordance with OECD methodology
Following OECD methodology for calculating producer subsidy equivalents (PSEs), Gallacher and Lema (2012) calculated the total support for Argentine agricultural producers during the period between the years 2007 and 2011. During those years, Argentine producers had negative PSEs, which signified transfers from the sector to the rest of the economy: to the government through tax collection and to consumers through lower prices for the products. The most important component of these transfers is the Market Price Support (MPS), calculated on the basis of the difference between the domestic prices paid to the producer under the public policies and the international baseline prices, which represent the theoretical potential price paid to the producer.
The policies on export taxes and restrictions led to producers receiving negative support,
through prices, by an average of more than 12 thousand million dollars per year for 2007–2011, which represented 34% of the production value. This loss of revenue for the producer has barely been compensated by the fiscal support and general service programmes,51 which on the average totalled 441 and 258 million dollars, respectively (Table 7).
The OECD producers and those of the remaining Latin American countries have positive total support (PSEs). In contrast, Argentine producers have had substantially negative PSEs. In 2011, those negative values represented 43% of their average gross income for the combined principal crops and livestock farming activities that were analysed52 (Graph 24). This means that, in order to export, Argentine producers must have 43% more competitiveness than would otherwise be necessary and 50–60% more than that of the principal competitors in the region and the world.
Mechanism 2007 2008 2009 2010 2011Annual average
2007-11Market Price Support (MPS)
-6.938 -17.158 -7.793 -9.059 -19.417 -12.073
Fiscal support 195 714 549 566 183 441,4
General Services (GSSE*) 189 229 253 263 357 258,2
Total Support (TSE**) -6.554 -16.215 -6.991 -8.230 -18.877 -11.373
Table 7. Transfers of resources from the agricultural sector to the rest of the economy (in millions of dollars)
Source: Gallacher and Lema (2012).
Notes: *General Services Support Estimate. **Total Support Estimate calculated as the sum of the PSEs, GSSE and transfers to the consumers from the taxpayers.

44 M. Regúnaga and A. Tejeda Rodriguez - Argentina’s Agricultural Policies, Trade, and Sus-tainable Development Objectives
Impact of the agricultural policies on production growth projections
The implemented agricultural policies have limited production growth rates. Furthermore, if they continue, they will have negative repercussions on the ability to continue growing at high rates during the coming years. Various projections made by specialized institutions have indicated that, within a decade, Argentina could reach a total grains production between 140 and 150 million tonnes if the political context is favourable (AACREA, 2013; GPS, 2012; FPC, 2010).
Additionally, the total grains production goals established for 2020 by the Agri-Food Strategic Plan (PEA2) were 157 million tonnes,53 which is an ambitious figure considering that in the baseline year (2010), production was at 100 million tonnes. The aforementioned goals were achievable within the 10-year term, bearing in mind the existing possibilities for continued increase in the cultivated area and yields. In the case of total grains, in order to reach the new production goal, set at 154.4 million tonnes by the MINAGRI, it would be necessary to grow at an average annual rate of 4.4% between 2010 and
2020. However, with the first four years of the PEA2 time horizon already passed, production has only grown by 25% of the necessary amount (0.9% per year).
Every year, the INAI Foundation makes production projections for the following decade using the PEATSim-Ar simulation model.54 Similarly to the way in which other outlooks have been made by various international institutions, the production and trade of agricultural products is simulated under a series of assumptions. Among them, it is assumed that Argentina’s current agricultural policies will continue. The estimation of the “Agricultural Reference Scenario for the World and Argentina to 2023” prepared by INAI indicates that, by the next few years, grain production would exhibit 2.7% annual growth, reaching only 125 million tonnes of grain (cereal grains and oilseeds) in 2020, which is only half of the goal established in the PEA. Graph 25 represents the evolution of both options and enables us to affirm that the continuation of current policies will significantly limit production growth and would not allow reaching the objectives set forth in the PEA that was amended in 2014.
Graph 24. Estimated support for agricultural producers (PSEs) in select countries. Year 2011 (% of the sector’s gross income)
Source: Malarín (2012).
Note: The PSE includes all of the various types of production support, including net market price support (MPS).
40%
30%
20%
10%
0%
-10%
-20%
-30%
-40%
-50%
30%
24%20%
16%12%
7%4% 3%
-43%
Colom
bia EU
Bolivia
USABra
zil
Chile
Argen
tina
Peru
Mex
ico

45Agricultural Trade and Sustainable Development
Similar observations can be made for other important areas of agro-industrial production in Argentina. Therefore, for example, Table 8 includes production projections for milk and beef up to 2020 made in other studies (Regúnaga et al, 2011), the goals included in the 2010 version of the PEA and those adjusted in 2014, and the results of the ERAMA 2023 projections, assuming the continuation of Argentina’s current agricultural policies. In these cases,
it can also be observed that, if the currently effective policies are not modified, livestock production growth rates will be far below the potential rates, and the same would happen with exports. In the case of beef, the export goal for 2020 in the PEA is in the range of 0.7 to 1 million tonnes. In the case of the ANAV study, the range runs from 1.1 to 1.7 million tonnes, while the ERAMA simulation only projects 0.25 million tonnes.
Given that Argentina is an exporter of all these products (grains and grain by-products, beef and dairy) and that per capita consumption of these is practically saturated, production increases are almost exclusively targeted at exports. For this reason, poor performance of local production not only has repercussions on Argentina’s growth, employment and
territorial development, but also has a direct negative impact on global food security. It is important to note that, due to the aforementioned circumstances, there is an interesting coincidence between Argentina’s sustainable development objectives based on long-term growth of the agro-industrial sector and global food security.
Graph 25. Projection of Argentine total grains production by 2020 and PEA2 goals (millions of tonnes)
Source: Based on data from MINAGRI, Grain Exchange, ERAMA-INAI, PEA2 and goals adjusted in 2014.
Notes: For the 2009/10 and 2013/14 seasons, historic production data from the Grain Exchange and MINAGRI were used. For the projected years, the ERAMA 2023 results from the INAI Foundation and the PEA goals were used.
Source: Data from ERAMA-INAI (2014); Regúnaga and García Tobar for ANAV (2011); MINAGRI-PEA (2010 and 2014).
Note: *These projections were made based on the assumption that livestock farming policies are reformulated in accordance with the proposed State Policies for the sector contained in Chapter VI of the referenced publication of the National Academy of Agricultural and Veterinary Sciences (ANAV).
ProductsBaseline year
2010Projections to the year 2020
ERAMA ANAV low* ANAV high* PEA2 (2010) PEA 2014
Milk 10,3 13,3 15,0 18,0 18,3 16,4
Beef 2,6 3,0 3,7 4,2 3,8 3,5
Table 8. Projections for Argentine milk and beef production by the year 2020 (in thousand million litres of milk and millions of tonnes of beef in carcass equivalent weight)
160
150
140
130
120
110
100
90
Real + ERAMA PEA
20
09
/10
20
10/1
1
20
11/1
2
20
12/1
3
20
13/1
4
20
14/1
5
20
15/1
6
20
16/1
7
20
17/1
8
20
18/1
9
20
19/2
0
100100 102104
90
109
102
114
105
119
107
124
110
130
114
136
119
142
123
148
125
154

46 M. Regúnaga and A. Tejeda Rodriguez - Argentina’s Agricultural Policies, Trade, and Sus-tainable Development Objectives
5. RECOMMENDATIONS FOR ARGENTINA’S AGRO-INDUSTRIALPOLICIES
The main lessons learned through the analysis of the results of the agricultural policies implemented during the past decade, which were described in Chapter 4, enable us to affirm that Argentina’s sustainable development and global food security could improve significantly from a change in the vision, mission and objectives of Argentina’s agri-food and agro-industrial sectors, by establishing and agreeing with economic and social stakeholders. This should be consolidated in State Policies, meaning long-term policies that would be desirable to establish with the corresponding national legislation in order to reduce the dependence on administrative decisions of the Executive Branch, which give rise to uncertainties and do not promote the investments that involve long maturation periods.
New proposed vision for the Argentine agro-industrial sector
The Argentine agri-food sector merits priority attention in the public policies due to the fact that it has an enormous potential for economic growth and could make significant contributions to sustainable development, based on: i) the existence of a dynamic international market of great magnitude for the principal products; ii) the high international competitiveness reached in each one of the principal links making up the agricultural value chains and the networks of companies linking them; iii) the development of business models that are economically sustainable and environmentally friendly, when provided with a suitable context; iv) the high multiplying effects on production and employment of the principal agricultural value chains, which are higher than the average multipliers of the economy; v) the high countrywide coverage involved in the agribusiness production and services industries, which makes their growth highly important for achieving a better balance in the development and territorial distribution of Argentina’s income.
Bearing in mind the above fundamentals, as well as the objectives of Argentina’s sustainable growth and global food security, it is suggested to review the strategies, priorities and roles
assigned to the agricultural sector during the analysed decade based on an alternative vision, as indicated below:
“The agro-industrial sector is one of the strategic components of a programme for sustainable social and economic growth in Argentina, genuine job creation and harmonic development throughout the nation and its regions.”
This new vision implies discarding the other previously established priorities. The competitiveness of the manufacturing sectors must be based on innovation and on their efficient integration into the global value chains, and not on low salaries, which require domestic food prices lower than those in effect in other countries that do not protect their agriculture. Agricultural policies also should not be a source of tax revenues with substantially higher tax pressure than that of the other economic sectors, given that such discrimination has an extremely negative impact on the regional distribution of income and on employment in the interior of the country.
The false dichotomy between export and supplying the domestic market, which has been the framework of the policies of the analysed decade, must also be discarded, as it has resulted in the obvious shortcomings described in Chapter 4. National provisions will be ensured if there are incentives to increase production. Additionally, consumer prices in Argentina will be lower than those in the international market if export volumes are proportionately high in relation to the country’s production. Agricultural policies can best contribute to inflation control by ensuring a sustained supply of products. Price controls may temporarily reduce inflation, but usually end up reducing the supply, which subsequently leads back to inflation.
Furthermore, in the area of food aid, there is broad international experience with policies of direct aid to the populations that are below the poverty line (such as the “Zero Hunger”

47Agricultural Trade and Sustainable Development
programme in Brazil and the Food Stamp programme in the USA, among others). Food programmes like these are much more efficient than programmes for mass reduction in food prices, which create disincentives for production and fail to take into consideration the fact that a high proportion of the poor are in rural areas.
The central ideas of the proposed vision are similar to the concepts prioritized in the vision of PEA2: 1) world leadership in agri-food production; 2) production of quality agri-food and agro-industrial goods and services with local value added; 3) ensuring national food provisions and satisfying international demands in terms of quantity and quality; and 4) promoting the economic and social growth of the nation and its regions in a framework of territorial equity, social inclusion and environmental sustainability. In Figure A-14 of the Appendix, those concepts that are contained in the PEA2 document are included.
In this regard, it should be pointed out that this document, which involved intense technical work and institutional consultation performed at MINAGRI during a period of more than one year, contains a good diagnosis of the sector, as well as a different vision and objectives than those that guided the trade and agricultural policies detailed in Chapters 2 and 3 of this document. It contains goals that, while ambitious, are feasible if suitable policies are applied, unlike those that have effectively been implemented during the last decade, which account for the failure to meet the established goals. Strangely, PEA2 does not contain the necessary policies and mechanisms for fulfilling its objectives and goals.55
Proposal for the main strategies, objectives and mechanisms of agricultural policies
The general framework of the proposals indicated below is based on the guidelines of a sustainable development strategy for Argentine agro-industry that envisages an adequate balance between the three dimensions of sustainability: economic, social and environmental.
5.1. Context of policies to promote growth in agriculture, aimed at eliminating the current deprotection
5.1.1. Eliminating trade deprotection on agricultural activities.
Trade deprotection, as synthesized in the extremely negative Producer Subsidy Equivalents (PSEs) and the high levels of tax pressure in the sector, focused on taxes levied on trade and financial transactions,56 are not compatible with a sustained and sustainable growth strategy that considers the dimensions mentioned above, as demonstrated so eloquently in Graphs 11, 15, 17, 18, 23 and 24.
In order for Argentine agriculture to grow in a sustainable manner, in all of its regions and all of its principal agro-industrial industries, and in order for it to be a dynamic factor in the growth of the national economy and employment, it requires a context of incentives similar to those enjoyed by producers in the most competitive export countries, which do not base their growth on subsidies (such as Australia, Brazil, Chile, New Zealand, Paraguay and Uruguay, among others). It is necessary to replace the strategies of import substitution and agricultural trade deprotection with an alternative agricultural policy aimed at promoting growth in production and exports, doing away with the taxes levied on exports and trade transactions, as well as the regulations and government interventions that distort the function of the markets and depress the prices of primary products. The objective is to achieve an improvement in the relative domestic input-output prices, in order to bring them in line with those that are in effect in the international market, contemplating the following aspects:
• Immediate elimination of the export quotas and other government interventions in domestic and foreign trade (implemented by the ONCCA, AFIP, UCESCI and the Secretary of Trade). For many decades, Argentina has not applied export bans on grains, meats and dairy products without exhibiting consequential shortages in domestic market
48 M. Regúnaga and A. Tejeda Rodriguez - Argentina’s Agricultural Policies, Trade, and Sus-tainable Development Objectives
supplies. Chapter 4 has shown evidence of the inefficiency of these policies for controlling inflation, as well as their negative impact on market performance.
• Elimination of export taxes, maintaining marginal strategic differentials (very small, as in the case of soy by-products), and substituting them with national taxes levied on profit, assets and VAT.57 The medium-term objective is for the agro-industrial sector to be taxed with the same co-partnered national tax structure that is applied to the other sectors of the economy. It is possible that the implementation of this objective may need to be phased until achieving the desired compensations. Any export taxes that are not initially eliminated could temporarily be considered as advance payments toward the Income Tax. Various studies that have been conducted indicate that an offset could be achieved within two or three years. There is prior evidence of elimination of these taxes and their offset with other taxes that do not discourage production and export, as was the case during the first five years of the nineties.
• Elimination of other taxes levied on domestic trade (financial transfers, barter operations) and their substitution with general taxes assessed on profit, assets and VAT. A certain degree of gradualness may also be necessary in this case.
• Reduction of the import taxes on certain strategic goods and inputs. Reducing the cost of capital goods is very important for updating equipment and improving competitiveness (for example, the fleet of trucks, which is seriously obsolete). There is prior experience in Argentina with the use of offsets for local industry.
5.1.2. Promoting good performance of the agricultural markets.
The serious decline in the public services for supporting and controlling the production and trade of agricultural products (which culminated
in the elimination of the ONCCA) and the direct public interventions through the implementation of bans, quotas, maximum prices and other mechanisms, have resulted in deficient performance in the principal agricultural markets.
It is necessary to increase transparency and promote competition in the domestic marketing and export of agricultural products through the adoption of clear, predictable, and stable regulations in place of the arbitrary exercise of the administrative authority.
To achieve good market performance, it is also a priority to provide institutional strengthening in the public agricultural sector in the areas of trade information and control, to substantially improve the information systems related to the supply, demand and prices of the principal chains, as well as to effectively limit the unfair competition practiced by some participants. In the case of beef and pork, the double standards in trade and sanitation constitute critical barriers to the sector’s modernization and international competitiveness.
In relation to the grain futures markets, it is necessary to review the scope of Law 26,831 and the corresponding regulations, in order to prevent an excessive concentration of traders and the uncertainty that has been generated. Here, too, it is essential to adopt clear, predictable, and stable regulations in place of the arbitrary exercise of the administrative authority. Furthermore, the unification of the exchange markets proposed in A-3 will again authorize trade in dollars without restrictions.
5.1.3. Creating a macroeconomic environment aimed at promoting investment and growth
A favourable macroeconomic context is a necessary condition for promoting investment and growth, but its scope exceeds the objectives of this document. Therefore, the principal components are only listed below briefly, but not aiming at going into the subject in depth.

49Agricultural Trade and Sustainable Development
It is considered a priority to return to macroeconomic stability, like that which is in effect in the majority of the countries in the world, which implies eliminating the main underlying sources of instability: the growth in public expenditures beyond the fiscal revenues. The structural fiscal balance must reconcile a countercyclical fiscal policy with the sustainability of the public debt. It is also necessary to progressively eliminate the elevated regressive subsidies that benefit the middle and high social sectors in favour of social programmes and investments in infrastructure.58 The exchange policy should lead toward a single exchange rate, and within a framework of price stability, macroeconomic management should avoid repeating the episodes of exchange rate overvaluation and extremely high foreign debt indebtedness, which demands prudent, sustainable and countercyclical fiscal behaviour.
5.2. Argentina must integrate itself into the world
The potential for growth in Argentine agriculture notably exceeds the needs of domestic consumption, for which reason the country could play a leadership role in addressing the problems of global food security, at the same time as it advances in its economic and social development hinging on the growth of the agro-industrial sector. For this to happen, it is necessary for Argentina to fulfil its international trade commitments and to actively participate in the new map of global economic and trade integration, which implies:
• Normalizing financial relations with the rest of the world. The enormous potential for growth in terms of Argentina’s energy, infrastructure and agro-industry would help promote immediate foreign investment in those sectors and improve its current account, for which it is necessary to re-establish good financial relations with the rest of the world.
• Dynamically inserting itself in the international markets. Argentina must actively participate in international negotiations that will drive global trade
without barriers to agricultural production and situate the country as a reliable, responsible supplier of food, fibres and biofuels.59 Access to the most important markets must be improved through an offensive strategy in terms of FTAs. This necessitates strict fulfilment of the trade commitments assumed in the WTO, doing away with the policies applied during the last decade, which have limited imports through administrative mechanisms and procedures that violate these agreements. Furthermore, it is necessary to strengthen MERCOSUR or change its scope in order to further the offensive integration strategy.
• Trade promotion is a key mechanism for improving the knowledge of, and access to markets, especially in products that are differentiated with value added. This implies substantially increasing the resources and political priority currently assigned to the promotion of foreign trade, through the creation of a relevant trade promotion agency.
5.3. Increasing productivity and efficiency in the use of natural resources
Argentina and the rest of the world face the major challenge of substantially increasing yields to address global food security, given the growing scarcity of new land that can be incorporated into food production. However, this purpose today confronts new challenges linked to the necessity of simultaneously achieving increased yields and greater efficiency in the use of resources (land, fertilizers, agrochemicals and energy) in order to conserve these resources and limit global warming. This implies assigning a high priority to agricultural research and development, redefining the priorities and strategies of the public-private agricultural R&D system. In recent decades, the public sector has not given the necessary priority to research of those aspects that are public assets, which are not normally conducted by the private sector (for example, knowledge of the natural resources and the implications of the alternatives for managing them). For all of this, the following is proposed:

50 M. Regúnaga and A. Tejeda Rodriguez - Argentina’s Agricultural Policies, Trade, and Sus-tainable Development Objectives
• Substantially increasing the intensity of public investment in agricultural R&D, giving high priority to biotechnology, nanotechnology and ICT.
• Promoting a significant increase in private investment through: i) adequate cooperation with the public system (a public-private strategic plan is lacking throughout);60 ii) respect for the intellectual property of the innovations;61 and iii) legal security of the investments.
• Redefining the priorities of the research and development agenda of the entire agricultural R&D system in order to contemplate increased efficiency in the use of resources, promote a better knowledge of natural resources and the impacts of management practices, and incorporate aspects of logistics and processing aimed at increasing efficiency in these links of the chains and reducing physical and quality losses in the post-harvest stages.62
5.4. Improving sanitation and quality standards
Argentina must aim for the highest standards in food sanitation, quality and safety. This will enable increasing the sale prices and consequently the competitiveness of the sector.
For this to happen, SENASA must avail of the necessary public resources to be able to rely on highly qualified professionals and implement institutional programmes and practices that will enable gaining recognition and trust on a worldwide level. Furthermore, it is necessary to redesign the public system’s management models in order to achieve an efficient mechanism for public-private cooperation in the areas of prevention, health campaigns, controls and certification.
5.5. Promoting the conservation of natural resources and good agricultural and livestock farming practices
It is necessary to have regulatory guidelines, developed on the basis of science and a good knowledge of these resources and the environment, which would enable promoting the conservation of natural resources, avoiding the current regulatory gaps and regulations that are not based on scientific criteria.63 For this, the following is proposed:
• Significantly increasing the public resources targeted at generating greater knowledge of the capacity and sustainable use of natural resources.
• Establishing a federal framework of Land and Water Conservation Policy for all agricultural production in conjunction with Zoning Regulations that the Provinces must implement for rational use of the country’s natural resources.
• Promoting best agricultural practices in the use of land, water and supplies (direct seeding, precision agriculture, integrated plague management, controlled use of chemicals, soil nutrient replacement, etc.). Similar observations apply to livestock farming, as well as the other links in the agro-industrial chains. With these purposes, it is recommended to increase the efforts for promoting GAPs to producers and other value chains participants, contemplating the development of an economic incentive programme.
• To foster forestry development, especially in those lands that are subject to erosion.

51Agricultural Trade and Sustainable Development
5.6. Increasing investments in logistics and transport infrastructure
In a manner similar to that indicated for the macroeconomic aspects, in this document, there is only a brief mention of the necessity for increased investment in logistics and transport infrastructure, given the fact that the current deficiencies have negative implications for the country’s economic and social growth (especially for the regions furthest from the ports and urban centres), as well as in market performance and post-harvest losses. There is no intention to approach the subject in depth, as its scope exceeds the specific objectives of this document.
The principal problem in this area is the lack of a vision and overall long-term strategy that is mutually agreed upon between the various jurisdictions and participants. Growth and development of the infrastructure have been almost spontaneous, in accordance with immediate needs, in other words, without a systematic long-term vision. As a medium- and long-term strategy, the following is proposed:
• Restoring and strengthening railway cargo transport by increasing public investments in the system and promoting private investments.
• Developing the highway network and its integration with railways and ports, through approval of the bill for the federal highway network, which has received the support of numerous institutions of the agro-industrial sector, as well as that of other civil society organizations.
• Guaranteeing the safe transit on rural roads, using the existing municipal transit taxes and other resources collected for this purpose, to reduce isolation, as well as to limit the inefficiencies and high costs of transport associated with this network.
• Developing transport by water. Solidifying the main three East-West transport axes: the Norte Grande Bi-oceanic Corridor, the Central Corridor and the Patagonian Corridor.
• Increasing productivity and incorporating new lands into the productive process through investments in irrigation and drinking water for livestock, primarily in the regional economies.
5.7. Strengthening social and support programmes for rural communities and agro-industrial SMBs
Bearing in mind the social and quantitative importance of small farmers and their communities, it is necessary to design and execute specific policies in support of family agriculture that would facilitate access to credit, technical assistance, and product and input markets through new organizational structures. This involves strengthening and professionalizing diverse programmes that have demonstrated success in times past, such as the Social Agricultural Programme, Rural Change, Pro-Orchard and various technical and financial assistance programmes for small farmers co-financed with funds from IFAD, IADB and other development institutions and agencies. It must be eliminated in their current use for political purposes. Furthermore, it is suggested to arrange a support programme for producers to reduce the costs of crop insurance, using National Government financing, in addition to that which is currently assigned for agricultural emergencies.
It is additionally proposed to arrange a transparent food aid programme (food card) targeted at the populations below the poverty line; and to redress the priorities of public social investment, bearing in mind the needs of rural communities in the investment decisions with regard to rural road infrastructure, education, health, communications and electric power, given that these communities show the greatest problems of poverty and human development of the country.
Providing business opportunities in agro-industrial production, as well as investing in social infrastructure and support for rural communities, is essential for limiting the traumatic rural-urban migration which has been registered for decades in the country.

52 M. Regúnaga and A. Tejeda Rodriguez - Argentina’s Agricultural Policies, Trade, and Sus-tainable Development Objectives
BIBLIOGRAPHY
Anania G. (2013). Agricultural Export Restrictions and the WTO, what options do policy makers have for Promoting Food Security? ICTSD.
Anlló, G., Bisang, R. et al. (2013). Claves para Repensar el Agro Argentino. Eudeba.
Baracat, E. et al. (2013). Sustaining Trade Reform, Institutional Lessons from Argentina and Peru. The World Bank.
Bisang, Roberto (2011). Agro y recursos naturales en la Argentina: ¿enfermedad maldita o desafío a la inteligencia colectiva? Boletín Informativo Techint.
Butler, I. (2014). Capacidad productiva y cadenas de valor en la estrategia de desarrollo y de inserción internacional. IERAL.
Calvo P. (2014). Welfare impact of wheat export restrictions in Argentina: Non-parametric analysis on urban households. UNCTAD.
Castro, J. (2014). Agricultura e Industria en la Argentina. Un futuro común. Ediciones Pluma Digital.
Castro and Diaz Frers (2008). Las retenciones sobre la mesa. Del conflicto a una estrategia de desarrollo. CIPPEC.
CEPAL (2014). Integración Regional. Hacia una estrategia de cadenas de valor inclusivas.
CEPAL 2014. Estadísticas tributarias en América Latina 1990-2012.
Cetrángolo H. et al (2008). Impuestos a las Exportaciones y otras Barreras no Arancelarias: Consecuencias, Impactos y Políticas Alternativas. Documento para el Banco Mundial. UdeSA.
Cincunegui, J. (2010). Análisis de factibilidad de generar valor agregado en los complejos cerealero y oleaginoso en base a experiencias de países seleccionados. Progr. BID-FOMIN de Inserción Agrícola.
Cohan L. (2012). El aporte de la cadena de la soja a la economía argentina.
Confederaciones Rurales Argentinas (2012). De la tierra a la mesa.
Costa and Puricelli (2009). Impact of the government policies on the Argentine Agriculture: the wheat case in the Southeast Buenos Aires. VII International Pensa Conference.
Dente and Vaio (2009). Intervención oficial en los mercados. El caso del trigo argentino 2006/09. Seminario “A Todo Trigo 09”.
Elverdín P. (2014). Los países del ABPU y su participación en la agricultura mundial. GPS.
Foro de la Cadena Agroindustrial Argentina (2009). Política Agroindustrial: fundamentos para el desarrollo sostenido y sustentable de la agroindustria.
Fundación INAI (2009). Modalidades de inserción agrícola para Argentina y marco jurídico internacional. Foro de la Cadena Agroindustrial.
Fundación INAI (2014). Escenario de Referencia Agroindustrial Mundial y Argentino al 2023.
Fundación INAI (2014). Nuevo Regionalismo: consecuencias para el comercio agroindustrial.
Illescas N. (2014). OMC: Fallo adverso para Argentina. Fundación INAI.

53Agricultural Trade and Sustainable Development
Krivonos and Dawe et al. Policy responses to high food prices in Latin America and the Caribbean. Country case studies. FAO.
Llach J. et al. (2004). La generación de empleo en las cadenas agroindustriales. Fundación Producir Conservando.
Llach and Lagos (2014). El País de las Desmesuras. Raíces del retraso de la Argentina. El Ateneo.
Lema and Gallacher (2012). Producer Support Estimates: Argentine Agriculture.Report prepared for the Inter-American Development Bank.
Liboreiro E., Tejeda Rodríguez A, e Illescas N. (2012), El diferendo comercial entre Argentina y China de 2010. Fundación INAI.
Lódola et al. (2010), Mapa de cadenas agroalimentarias argentinas. En Anlló, Bisang y Salvatierra, Cambios Estructurales en las Actividades Agropecuarias, de lo primario a las cadenas globales de valor. CEPAL-PROSAP.
López and Oliverio (2010), La Agricultura Argentina al 2020. Fundación Producir Conservando.
Malarín H. (2012). Argentina: aprovechando el potencial del agro a futuro. División de Desarrollo Rural, Medio Ambiente y Gestión de Riesgos de Desastres, Banco Interamericano de Desarrollo.
Martini M. (2009). Relevamiento de instrumentos de comercio destinados a limitar total o parcialmente las exportaciones. Programa BID-FOMIN de Inserción Agrícola.
MINAGRI (2011). PEA 2. Argentina Líder Agroalimentario. Plan Estratégico Agroalimentario y Agroindustrial Participativo y Federal 2010-2020.
Nogués and Porto (2007). Evaluación de impactos económicos y sociales de políticas públicas en la cadena agroindustrial. Foro de la Cadena Agroindustrial Argentina.
Nogués J. (2011). Agricultural export barriers and domestic prices in Argentina during the last decade.FAO.
Observatorio de la Deuda Social Argentina (2014). Un régimen consolidado de bienestar con desigualdades sociales persistentes. Claroscuros en el desarrollo humano y la integración social (2010 - 2013). Universidad Católica Argentina.
Peri G. (2009). Cadenas de producción. Análisis de Protección Efectiva. Programa BID-FOMIN de Inserción Agrícola.
Rebizo M. and Tejeda Rodríguez A. (2011). Balance de inserción internacional de las cadenas agroindustriales argentinas. CEPAL-PROSAP.
Reca L. et al. (2011). La Agroindustria para el Desarrollo Argentino. Aportes para una Política de Estado. CARI.
Regúnaga M. and J. García Tobar (2011). Cadenas de base pecuaria, una gran oportunidad. Academia Nacional de Agronomía y Veterinaria.
Regúnaga M. (2011). Implications of the Organization of the Commodity Production and Processing Industry. The Soybean Chain in Argentina. World Bank-LAC Occasional Papers Series.
Regúnaga, M. (2008) El escenario internacional agroalimentario y las opciones de políticas agropecuarias y alimentarias. CARI.

54 M. Regúnaga and A. Tejeda Rodriguez - Argentina’s Agricultural Policies, Trade, and Sus-tainable Development Objectives
Regúnaga, M. (2013). Seguridad Alimentaria Global y Recursos Naturales Agrícolas. Papel y visión de Argentina, Brasil, Paraguay y Uruguay. Grupo de Países Productores del Sur.
Rodriguez J. (2006). Los complejos agroalimentarios y el empleo: una controversia teórica y empírica. Realidad Económica 218.
Trejos, R. et al. (2004). Más que alimentos en la mesa: la real contribución de la agricultura a la economía. IICA. San José.
Viglizzo E. et al. (2011). Expansión de la Frontera Agropecuaria en Argentina y su Impacto Ecológico-Ambiental. INTA.
Viglizzo E. (2014). La Huella de Carbono en la Agroindustria. INTA.

55Agricultural Trade and Sustainable Development
ENDNOTES
1 As indicated by Trejos, Rafael et. al. (IICA 2004), various policy studies and recommendations have underestimated the contribution of agriculture to economic development, as they fail to consider all the links of the agricultural value chains, both upstream and downstream, including the service and commercial sectors that are considered in the Extended Agricultural GDP.
2 Data from the most recent available Input-Product Table in Argentina’s National Accounts. Many of the activities in the agro-industrial chains cannot be performed by robots, as they are in certain manufacturing sectors.
3 Trejos, R. et al (2004) highlight its strategic importance for territorial development and the production of environmental goods.
4 The majority of this production is carried out in the arid regions furthest from the urban centres and ports, in the provinces of the Northwest (Santa, Jujuy, Tucumán), the West (Mendoza, San Juan, Catamarca, La Rioja) and the Southwest (Río Negro y Neuquén). Another portion is produced without irrigation in the Northeast of Argentina (in the provinces of Misiones, Corrientes, Formosa and Chaco).
5 This approach to economic and trade policy has been applied in Argentina for the greater part of the last eight decades (1935–2014) and was one of the principal causes of the economic cycles that have characterized the economy’s evolution and that account for the limited long-term growth in the country’s per capita income during this long period. To describe this setback, Llach and Lagos (2014) point out that the income per resident of Argentina during the years 1901 to 1934 fluctuated between 80% and 90% of the average in Australia, Canada and New Zealand, and with the change in policies implemented from the mid-thirties to the present, per capita income dropped to 40% of the average for those countries during the 1990–2009 period.
6 The profitability of the sector was lower than it would have been without interference. As a supplement to the strategy of low domestic prices on agricultural products, the local production of manufactures of industrial origin was promoted with domestic prices for these goods that were higher than those in effect in the international market, through the application of high import tariffs, quantitative restrictions on imports and other non-tariff barriers.
7 Most of the exports of non-agricultural manufactures are targeted at MERCOSUR and other Latin American countries with which trade agreements and access preferences have been negotiated. It is very difficult to access other markets due to the fact that protection through import tariffs results in domestic prices that are substantially higher than international prices. When the domestic market or those that are accessed with regional preferences are saturated, it is very difficult to continue growing.
8 The majority of these instruments had already been designed and utilized during the previous decade.
9 As a temporary (non-systemic) measure, during the last decade, certain direct support was implemented (called “compensations”) for some of the participants in the grain, grain by-product and livestock product chains in order to partially offset the negative effects on income of the maximum sales prices to the domestic market set by the National Government and of the tariff and non-tariff barriers applied on the exports of those products.

56 M. Regúnaga and A. Tejeda Rodriguez - Argentina’s Agricultural Policies, Trade, and Sus-tainable Development Objectives
10 Only under exceptional circumstances were sales limited (short term closures of the export registry).
11 Previously, on various occasions, from the middle of 2006 until Resolution 543 was put into effect, temporary closures were made in the export registries of different products. In 2007 and 2008, the powers of the ONCCA were modified to authorize its intervention in trade and the granting of subsidies.
12 Sixty-eight WTO members have been identified as having limited exports of one or more agricultural products, primarily wheat. However, in contrast to what is happening in Argentina, most of them have done this only under exceptional emergency circumstances (Martini, 2009).
13 According to the WTO, import licenses are administrative procedures that require submitting a request and other documentation (other than that which is necessary for customs) to the pertinent official agency, as a prior condition to importing merchandise. They may be automatic, when they are automatically issued upon the fulfillment of certain conditions, or non-automatic, when they are granted with a delay of anywhere between 30 and 60 days. In the case of delays greater than those that are indicated, the WTO Dispute Settlement Body (DSB) considers such undue delays in granting licenses as an illegal restriction on import and has indicated that a discretional system in which the licenses are not granted automatically, but rather as a consequence of “non-specific” background elements, is in violation of WTO regulations.
14 i) An official communication from the Ministry of Industry indicated that… “the industrial sector will generate 1.5 million jobs based on the local market protection policies that are being implemented by the Government, such as non-automatic licenses and antidumping measures”…; ii) Previously, the Ministry had indicated that “…the commitment to defend the domestic market and impede the entry of products that could jeopardize a single Argentine job is stronger than ever…” (official communications of the Ministry of Industry on the 11th, 18th, 21st and 27th of August, 2011).
15 However, these policies have had relatively little impact on employment. In Technical Note No. 14, the Ministry of the Economy and Public Finance evaluated the impact of approving four new non-automatic licensing systems between October of 2008 and June of 2009, which brought the number of positions created to 270. The study shows that, based on the hypothesis that if something stopped being imported due to non-automatic licenses and was provided, instead, through national production, this mechanism would have contributed only 0.24 percentage points to GDP growth and would have preserved around 8,500 jobs.
16 Resolution 11/2013 of the Ministry of Economy. Amongst the repealed regulations is Resolution 45/2011 of the Ministry of Industry, which had extended the obligation of processing a special import permit to a total of 659 tariff positions.
17 The oil industry and the government agreed on a mechanism, financed and administered by the private sector, to offset the differences in price between the domestic market and exports, which has permitted substituting the compensations that were awarded by the State.
18 The exchange rates indicated in iv) and v) have less relative importance in the trade of goods.
19 Its institutional structure was described in Chapter 2.
20 A very small figure when compared with the contributions made by the sector in terms of export taxes; in this three-year period, such taxes accounted for 25 thousand million dollars (8.3 thousand million per year).

57Agricultural Trade and Sustainable Development
21 Analysis of the evolution and impacts on the main economic and social variables is difficult by the fact that government interference in the National Institute of Statistics and Census (INDEC) as of 2007 entailed substantial changes in surveying the information. For such reason the evolution of the data series and indicators published by this institute has raised serious objections and caused a loss of credibility. This has led to the necessity of consulting additional sources.
22 Significant devaluation of the currency in 2002 (carried out by the prior Administration), which substantially improved the competitiveness of all the economic sectors and contributed to increasing exports in the subsequent years. The devaluation had a very negative initial impact on salaries and purchasing power in the middle- and low-income sectors, but that was partially offset by social programmes for the most poor population.
23 The less the primary products participate in the cost of the final product, the less likely it is that the producer and consumer prices will be correlated. According to various studies conducted during recent years, the share of wheat in the cost of flour is around 48%, while the share of flour in the cost of bread is approximately 20%, which means that wheat represents less than 10% of the cost of bread (Nogués and Porto, 2007; CRA, 2012).
24 In a second scenario, Calvo (2014) estimated the effects of eliminating both the quantitative barriers and the domestic supply prices, artificially fixed by the government at lower levels than domestic wheat market prices. Assuming that they were the representative prices of wheat, the elimination of both policies in the fictitious scenario would have resulted in prices of products made from flour that were 6.4% higher than those in real life. In that case, the maximum loss of wellbeing in homes would be equivalent to 1.5%. These modest effects demonstrate that these restrictions are not efficient at generating significant effects on consumer wellbeing.
25 According to the General National Audit (AGN), based on data on the execution of the successive National Budgets, the expenditures of the National Administration grew by 889% in one decade. This entailed a gradual decrease in the fiscal surplus achieved during the first years of the analyzed period. In 2012, the fiscal deficit of the National Administration already represented 2.3% of the GDP. The estimate of that deficit for 2013 was 85 thousand million pesos, according to the General National Audit, which indicated that deficit financing had been accomplished in part through resources from the Central Bank and in part through the issue of not completely sterilized currency, which has had a significant impact on the increase in consumer prices.
26 In 2014, INDEC stopped reporting the poverty indicators, decision which had been the object of severe criticism.
27 The HDI is an indicator created by the UNDP for purposes of determining the level of development in the different countries of the world. It was conceived with the goal of knowing not only the income of a country’s people, but also evaluating whether the country provides its citizens with an atmosphere in which they can develop their life ambitions and conditions. The HDI uses three variables: 1) The level of health, represented by the life-expectancy from birth; 2) The level of education, represented by the adult literacy rate and the average years of schooling; and 3) Income, represented by the GDP per inhabitant, with a transformation that takes the difference in earning capacity between one country and another into account. (GDP/CEC). The HDI is a non weighted measurement that classifies countries or regions on a scale from 0 to 1.

58 M. Regúnaga and A. Tejeda Rodriguez - Argentina’s Agricultural Policies, Trade, and Sus-tainable Development Objectives
28 In the case of agricultural products, the international price increases contributed in the same sense and offset the increases in the export tax rates.
29 Regional Integration Document: toward a strategy of inclusive value chains (2014).
30 In this case, the duration was greater than that of previous cycles, attributable in part to high international prices on agricultural products, the level of foreign debt and the very favourable international financial context.
31 Castro, J. (2014) has formulated a very interesting, innovative proposal in this regard.
32 Subsequently, the EU also adopted a similar measure, but not limited to Argentina.
33 Between April of 2010 and the initial months of 2011, the Chinese market remained effectively closed to Argentine soybean oil imports, favouring exports from Brazil and the USA, which replaced Argentina as the principal providers. The situation was triggered when China announced that it would begin to apply the National Chinese Standard on imports of crude soybean oil. After this announcement, China stopped purchasing Argentine oil considering that it did not comply with this standard, although it continued purchasing oil with similar characteristics from other origins. This restriction significantly jeopardized the Argentine soybean oil industry, considering that China was the principal destination for that product at the time, with purchases of 1.9 million tonnes. Since then, Argentine sales to China have failed to regain previous levels, barely exceeding 600 thousand tonnes in 2013 (INAI, 2011).
34 In the first case, according to the claimants, Argentina demanded that economic traders adopt certain specific measures as conditions for import: a) requiring the export of a set value of merchandise from Argentina in proportion to the value of the imports; b) limiting the volume of imports, reducing the prices or both; c) refraining from repatriating funds from Argentina to another country; d) making investments in Argentina or increasing existing investments; e) incorporating national content in the merchandise produced in the country.
35 TF Report corresponding to the case designated “Argentina – Measures that affect the import of goods”.
36 These are the FTAs with Chile, Bolivia, Peru, Colombia, Ecuador and Venezuela, as well as the Framework and Automotive Agreements with Mexico.
37 Only the agreements with India and Israel are in effect.
38 The barriers applied on imports have garnered severe criticism on the part of the EU, whose representatives indicated that these types of measures were very poor indications for advances in the MERCOSUR-EU agreement negotiations.
39 Data calculated on the basis of 1993 GDP calculations. Table A-4 of the Appendix includes the available series based on 1993 and on 2004 figures recently reported by the Ministry of the Economy and Public Finances (MECON), which exhibit somewhat lower tax pressure.
40 CEPAL “Estadísticas tributarias en América Latina 1990–2012” (Tax Statistics in Latin America 1990–2012),
41 In the FADA document of March, 2014 “Renta agrícola y el efecto de la devaluación en la producción” (Agricultural Income and the Effect of the Devaluation on the Production) the products included and the concepts used in calculating the State share in Agricultural Income are detailed.

59Agricultural Trade and Sustainable Development
42 To come up with this price, export duties and the shipping and hadling costs incurred by the exporter (in converting the product condition from the domestic reference market price in the port (FAS) until it is in FOB conditions) were deducted from the FOB price. The data on the FOB prices and theoretical FAS prices reported by MINAGRI for 2008 show vast differences, which may be the result of official manipulation, by virtue of the fact that the increases in international prices gave way to frequent changes in the rules of the game and the establishment of sliding-scale taxes, which were then eliminated.
43 The calculations of extraordinary margins are indicators of the deficient market performance in each month. The total income transfers are not weighed, as they do not include the volumes transacted in each one of those months.
44 It should be noted that Argentina has developed a wide range of varieties of soy with different cycles, which adapt to the diversity of environments found in the country, partly mitigating this risk. However, in any case, it is not advisable to have a high dependence on a single crop.
45 The principal competing countries have more favourable relative domestic prices resulting from trade policies that tend to be neutral (as is the case of Australia, New Zealand, Brazil, Uruguay and Chile) or that support their agriculture with various mechanisms (EU, USA, India, China, Japan and Korea), according to the annual OECD and IADB reports.
46 The use of large amounts of fertilizers and agrochemicals and the high levels of capital invested per hectare, like those used in the USA or Europe, have not been profitable in Argentina, for which reason, yields have also been lower.
47 Figure A-9 also shows that the high cattle stock hold in Argentina plays a role in the GHG emissions.
48 The average plant in Argentina is 21% larger than those in Europe, 53% larger than those in Brazil and 133% larger than those in the USA (Cohan, 2012).
49 Although the mandatory blend established through Secretary of Energy Resolution 1125/2013 is 10%. In 2013 the effective blend was approximately 8%.
50 Secretary of Energy Resolution 44/2014 established a mandatory blend of 10% by December of 2014.
51 Of the amount attributed to fiscal support, 70% corresponds to the subsidies granted through the ONCCA, which totalled 1.55 thousand million dollars for the entire period. This support also counts subsidies on the interest rates and credit restructuring, as well as extension services and on-farm technical advice. General services include research and development programmes, sanitation services and investment in rural infrastructure.
52 Support through lower prices of feed resulting from export taxes on grains and by-products has been negative for the majority of the products, given that the implemented policies have resulted in domestic prices far below the international prices. The most negatively affected products were corn, wheat and sunflowers, in which these transfers were equivalent on the average to 60% of the production value. On the other hand, milk, poultry and pork received positive support through the prices on supplies and the export taxes on grain (Figures A-12 and A-13 of the Appendix).
53 Due to the stagnation in production during the last few years, this goal was reduced by MINAGRI in 2014 to 154.4 million tonnes.

60 M. Regúnaga and A. Tejeda Rodriguez - Argentina’s Agricultural Policies, Trade, and Sus-tainable Development Objectives
54 PEATSim-Ar is a partial equilibrium model adjusted to the conditions in Argentina, based on the PEATSim model developed by the University of Pennsylvania and the ERS-USDA.
55 In contrast, a group of former Secretaries of Agriculture from the past 34 years from various democratic governments agreed on a document that not only includes a vision and objectives, but also the principal public policies suggested as State Policies for the sector (Reca et al, 2011).
56 The State’s extremely high share of agricultural profits limits the capacity for savings and investment even in the most competitive areas of production in the Pampean Region.
57 The elimination of these taxes results in higher national tax revenues that can be co-partnered with the Provinces (Income Tax, VAT) and higher provincial and local tax revenues, thus increasing the resources of the Provinces, which are in charge of the majority of the social programmes (health, education, safety, etc.) and those related to natural resources. This implies offering them the possibility of improving local public investments in human development. Furthermore, the increased agricultural income and profit would help reduce the effects of the provincial taxes imposed on the land.
58 This objective implies fiscal reforms aimed at increasing the relative importance of co-partnered taxes, eliminating taxes that penalize investment, and increased productivity and supply, while satisfying the genuine needs for local and national revenues.
59 An important aspect to resolve is that of synchronization in the approval of GMOs in the various countries.
60 The management models of the public institutions do not sufficiently contemplate this objective.
61 Current seed legislation does not contribute to it.
62 To reduce the existing high percentages of post-harvest losses and increasing efficiency in the use of natural resources.
63 While the current legislation on native forests has helped limiting deforestation, it is a typical case of a legislative framework that is not based on scientific criteria.

61Agricultural Trade and Sustainable Development
APPENDIX20
00/0
120
01/0
220
02/0
320
03/0
420
04/0
520
05/0
620
06/0
720
07/0
820
08/0
9N
otes
Gre
en B
ox26
8.30
373
.512
119.
936
134.
631
169.
887
248.
760
333.
302
424.
808
557.
285
Gen
eral
ser
vice
s20
8.69
5 60
.971
10
0.94
5 11
0.04
8 14
2.95
8 21
4.69
3 27
8.39
8 35
8.86
6 36
5.64
7
- IN
TA94
.130
15
.500
53
.107
63
.067
74
.455
11
6.31
1 15
1.35
4 20
6.65
7 20
4.52
6
- S
ENAS
A11
4.43
7 41
.679
38
.140
42
.928
46
.797
76
.490
95
.124
11
3.79
1 12
3.02
0
Dir
ect
paym
ents
to
prod
ucer
s-
--
--
12.6
92
7.02
9 9.
173
11.1
90
FET
supp
ort
for
agri
cult
ural
ins
uran
ce a
nd
soci
al s
ecur
ity
Dis
conn
ecte
d su
ppor
t to
inc
ome
11.5
39
1.54
2 1.
418
3.37
5 3.
844
3.41
7 11
.334
24
.855
32
.075
Th
e m
ajor
ity
corr
espo
nds
to t
he F
ET
Nat
ural
dis
aste
r re
lief
paym
ents
1.66
5 55
5 1.
490
1.56
9 2.
645
1.93
4 9.
589
5.00
4 78
.016
Stru
ctur
al
reor
gani
zati
on
assi
stan
ce:
inve
stm
ent
supp
ort
46.0
33
10.4
43
16.0
82
19.6
39
20.4
40
16.0
23
26.9
51
26.9
10
70.3
58
Regi
onal
ass
ista
nce
prog
ram
me
371
0 0
0 0
0 0
0 0
Am
ber
Box
79.6
00
47.6
67
63.2
34
75.9
43
74.0
87
74.9
18
74.7
39
74.8
29
74.1
63
Excl
usiv
ely
for
toba
cco
De
min
imis
--
--
--
4.20
9 5.
302
7.39
0 Bo
nus
prog
ram
int
eres
t ra
te o
n cr
edit
for
sm
all
prod
ucer
sPo
rk-
--
--
-15
2 14
4 29
3
Poul
try
--
--
--
146
158
355
Beef
--
--
--
1.81
4 2.
106
3.65
7
Milk
--
--
--
2.09
6 2.
895
3.08
5
Tota
l sup
port
347.
903
121.
179
183.
170
210.
574
243.
974
323.
678
412.
250
504.
939
638.
838
Tabl
e A
-1:
Dom
esti
c Su
ppor
t to
Arg
enti
ne P
rodu
cers
Sour
ce:
Info
rmat
ion
repo
rted
to
the
WTO
.
Uni
ts:
Thou
sand
s of
pes
os i
n co
nsta
nt c
urre
ncy
for
1992
. N
ote:
FET
: Fo
ndo
espe
cial
del
taba
co (
Spec
ial
Toba
cco
Fund
).

62 M. Regúnaga and A. Tejeda Rodriguez - Argentina’s Agricultural Policies, Trade, and Sus-tainable Development Objectives
Product groupMaximum consolidated and
average tariffsMFN applied taxes
Average % tax-free Maximum Average % tax-free MaximumAnimal products 27,6 0 35 8,3 6,5 16
Dairy products 35 0 35 18,3 0 28
Fruits, vegetables, plants
33,8 0 35 9,8 5,6 35
Coffee, tea 34,2 0 35 13,3 0 20
Cereals and preparations
32,9 0 35 10,9 14,7 31
Oilseeds, oils 34,6 0 35 8,0 10,8 31
Sugars and sweets 33,9 0 35 17,6 0 20
Drinks and tobacco 35 0 35 17,2 0 20
Cotton 35 0 35 6,4 0 8
Other agricultural products
31 0,7 35 7,6 10,4 14
Fish and fish products 33,9 0 35 10,4 3,9 16
Minerals and metals 33,8 0 35 9,9 7,1 25
Petroleum 34,9 0 35 0,1 97,2 6
Chemicals 21,3 0 35 8,2 1,4 18
Wood, paper, etc. 33,4 0 35 10,7 3,3 18
Textiles 34,9 0 35 23,3 0 35
Clothing 35 0 35 35,0 0 35
Leather, footwear, etc. 35 0 35 15,5 2,8 35
Non-electrical equipment
34,9 0 35 12,7 11,8 20
Electrical equipment 34,9 0 35 14,1 10,5 20
Transportation equipment
34,5 0 35 14,3 12,0 20
Manufactures (non-itemized)
33,4 0 35 15,2 8,8 20
Table A-2: Argentine Import Tariffs by Product Group
Source: Secretary of the WTO.

63Agricultural Trade and Sustainable Development
Agr
eem
ent
Pref
. lin
es (
%
of t
otal
)
Tota
lA
gric
ultu
ral
prod
ucts
Non
-agr
icul
tura
l pr
oduc
tsTe
xtile
sM
otor
veh
icle
s
Ave
rage
Dut
y-fr
eeA
vera
geD
uty-
free
Ave
rage
Dut
y-fr
eeA
vera
geD
uty-
free
Ave
rage
Dut
y-fr
eeM
FN11
.67.
410
.38.
111
.77.
322
.60
1813
.8
MER
COSU
R re
gion
al e
cono
mic
com
plem
enta
tion
agr
eem
ents
wit
h:C
olom
bia
(AAP
.CE
59)
91,6
1,8
33,3
1,4
28,8
1,9
33,8
4,6
22,6
5,4
21,7
Ecua
dor
(AAP
.CE
59)
91,8
1,4
34,4
0,9
30,9
1,5
34,8
3,2
19,7
4,8
26,1
Vene
zuel
a (A
AP.C
E 59
)91
,81,
434
,40,
9
1,5
3,
2
4,8
Boliv
ia (
AAP.
CE
no.
36)
92,6
010
00
100
010
00
100
010
0
Chi
le (
AAP.
CE
no.
35)
92,6
099
,90
99,2
010
00
100
010
0
Cub
a (A
AP.C
E no
. 62
)23
,18,
728
,48
24,1
8,8
28,9
19,2
11,9
15,9
27,6
Peru
(AA
P.C
E no
. 58
)91
,93,
713
,63,
515
,33,
813
,57,
36,
37
14,3
Bila
tera
l eco
nom
ic
com
plem
enta
tion
ag
reem
ent
wit
h:
Mex
ico
(AAP
.CE
no.
6)41
,88,
238
,17,
717
,98,
340
,322
,21,
817
,614
,8
MER
COSU
R-In
dia
pref
eren
tial
ag
reem
ent
4,7
11,5
7,5
10,2
8,1
11,7
7,5
22,6
017
,914
,3
MER
COSU
R-Is
rael
FTA
26,7
10,1
31,9
1013
,510
,133
,821
,94,
114
,538
,9
Tabl
e A
-3:
Arg
enti
ne P
refe
rent
ial I
mpo
rt T
arif
fs in
201
2 (%
)
Sour
ce:
Secr
etar
y of
the
WTO
.

64 M. Regúnaga and A. Tejeda Rodriguez - Argentina’s Agricultural Policies, Trade, and Sus-tainable Development Objectives
Tax
2001
2002
2003
2004
2005
2006
2007
2008
2009
2010
2011
2012
Indi
vidu
als
Inco
me
tax
1,35
1,12
1,32
1,38
1,53
1,52
1,56
1,70
1,70
1,65
1,99
2,51
Corp
orat
e In
com
e ta
x2,
111,
392,
283,
363,
483,
333,
433,
202,
853,
403,
623,
72
VAT
5,71
4,88
5,57
6,92
6,93
7,20
7,71
7,77
7,63
8,07
8,37
8,80
Soci
al S
ecur
ity
cont
ribu
tion
s3,
232,
832,
833,
043,
273,
784,
515,
096,
747,
107,
458,
31
Expo
rt t
axes
0,02
1,61
2,45
2,29
2,32
2,25
2,52
3,49
2,80
3,16
2,94
2,83
Bank
ing
cred
it a
nd
debi
t fe
es1,
091,
551,
571,
721,
771,
791,
851,
891,
801,
861,
962,
03
TOTA
L N
ATIO
NA
L TA
XES
17,3
016
,51
19,6
222
,32
22,7
423
,26
24,8
926
,35
26,8
928
,72
29,6
231
,74
TOTA
L PR
OV
INCI
AL
TAXE
S3,
643,
393,
814,
044,
124,
174,
224,
404,
634,
765,
045,
63
TOTA
L N
ET P
RESS
URE
20,9
419
,90
23,4
326
,36
26,8
627
,44
29,1
130
,75
31,5
133
,48
34,6
637
,37
Tax
2004
2005
2006
2007
2008
2009
2010
2011
2012
2013
Tota
l Inc
ome
Tax
4,16
4,33
4,16
4,17
4,18
3,94
4,23
4,71
5,04
5,48
VAT
5,78
5,69
5,83
6,10
6,25
6,19
6,43
6,70
6,94
7,43
Soci
al S
ecur
ity
cont
ribu
tion
s2,
542,
693,
063,
564,
095,
475,
665,
966,
557,
05
Expo
rt t
axes
1,92
1,90
1,82
1,99
2,81
2,27
2,52
2,35
2,23
1,66
Bank
ing
cred
it a
nd
debi
t fe
es1,
431,
461,
451,
471,
521,
461,
491,
571,
601,
69
TOTA
L N
ATIO
NA
L TA
XES
18,6
418
,69
18,8
319
,68
21,1
921
,82
22,8
923
,69
25,0
325
,93
TOTA
L PR
OV
INCI
AL
TAXE
S3,
373,
393,
383,
343,
543,
753,
804,
034,
425,
21
TOTA
L N
ET P
RESS
URE
22,0
222
,08
22,2
023
,02
24,7
325
,57
26,6
827
,72
29,4
431
,14
Tabl
e A
-4:
Evol
utio
n of
Tax
Pre
ssur
e. S
elec
ted
mai
n N
atio
nal a
nd P
rovi
ncia
l Tax
es a
nd T
otal
s (%
of
GD
P)
Base
line
year
199
3
Base
line
year
200
4
Sour
ce:
Dat
a fr
om t
he S
ecre
tary
of
Taxa
tion
. N
atio
nal
Boar
d of
Fis
cal
Inve
stig
atio
n an
d A
naly
sis,
bas
ed o
n da
ta f
rom
the
A
FIP,
Nat
iona
l So
cial
Sec
urit
y A
dmin
istr
atio
n, N
atio
nal
Budg
et O
ffice
and
oth
er a
genc
ies.

65Agricultural Trade and Sustainable Development
YearMECON* IMF**
1993 prices 2004 prices Annual per capita2003 8,8% - 9,0% 7,7%
2004 9,0% - 8,9% 7,7%
2005 9,2% 9,2% 9,2% 8,0%
2006 8,5% 8,4% 8,4% 7,2%
2007 8,7% 8,0% 8,0% 6,8%
2008 6,8% 3,1% 3,1% 2,0%
2009 0,9% 0,1% 0,1% -1,1%
2010 9,2% 9,1% 9,1% 7,9%
2011 8,9% 8,6% 8,6% 7,3%
2012 1,9% 0,9% 0,9% -0,2%
2013 - 2,9% 2,9% 1,8%
Year INDECPrice Stats – Economist
Congress CPI*
2003 4%
2004 10%
2005 12%
2006 11%
2007 9% 19%
2008 7% 24%
2009 8% 17%
2010 11% 26%
2011 10% 24% 23%
2012 11% 26% 25%
2013 11% 28% 28%
2014 24% sd 38,5%
Table A-5: Evolution of the GDP and Per Capita GDP 2003–2013 (annual %)
Table A-6: Consumer Prices Evolution. Period 2003–2014 (annual rates in %)
Source: MECON: Ministerio de Economía (Ministry of the Economy); IMF: International Monetary Fund. Notes: *MECON recalculated growth with 2004 prices; **The IMF used the series based on 1993 prices for 2003–2007 and based on 2004 prices for 2008–2013.
Source: INDEC, The Economist and the National Congress
Note: *As a result of the lack of credibility in the INDEC figures as of 2007, other sources were taken into consideration; since 2011, the National Congress reports an indicator each month, averaging information from various private sources.

66 M. Regúnaga and A. Tejeda Rodriguez - Argentina’s Agricultural Policies, Trade, and Sus-tainable Development Objectives
Year INDECEDSA-UCA
Minimum Maximum2003 48% sd sd
2004 40% sd sd
2005 34% sd sd
2006 27% sd sd
2007 21% 28% -
2008 15% 29% -
2009 13% 30% -
2010 10% 28% 30%
2011 7% 23% 25%
2012 5% 25% 26%
2013 4% 26% 28%
Table A-7: Evolution of poverty based on income. Period 2003-2013 (% of the total population)
Source: National Institute of Statistics and Censuses; Encuestasobre la Deuda Social Argentina–Universidad Católica Argentina (Survey on the Argentine Social Debt—Catholic University of Argentina).
Notes: In 2014, INDEC stopped reporting these indicators, which had garnered serious objections. (n/d = no data)
Source: Based on COMTRADE data.
Sectors2000–2001 2012–2013
Export value
Import value
Trade balance value % of imp.
Export value
Import value
Trade balance value % of imp.
Total Manuf. of Industrial Origin
8.584 19.678 -11.094 56% 25.784 56.237 -30.453 54%
Total machinery and equipment
3.340 9.689 -6.348 66% 12.681 32.551 -19.869 61%
Automobiles and auto parts
2.084 2.386 -302 13% 9.956 13.682 -3.726 27%
Textiles and attire 307 903 -596 66% 325 1.572 -1.247 79%
Table A-8: Evolution of Argentine Exports, Imports and Trade Balances for Selected Manufactures of Industrial Origin. Annual Averages for Two-Year Periods 2000–2001 and 2012-2013 (values in thousand millions of dollars and % of trade balance/imports)

67Agricultural Trade and Sustainable Development
Source: USDA data.
CountriesYear Average annual growth
(%) 2000–20132000 2001 2005 2006 2012 2013Argentina 2.880 2.640 3.200 3.100 2.620 2.850 -0,2%
Brazil 6.520 6.895 8.592 9.025 9.307 9.675 2,8%
Paraguay 239 242 370 400 460 510 6,1%
Uruguay 440 317 600 640 530 525 2,4%
MERCOSUR 10.079 10.094 12.762 13.165 12.917 13.560 2,2%
CountriesYear Average annual growth
(%) 2000–20132000 2001 2005 2006 2012 2013Argentina 9.800 9.500 9.500 10.200 11.679 11.933 2,3%
Brazil 22.134 22.300 24.250 25.230 31.490 32.380 3,3%
MERCOSUR 31.934 31.800 33.750 35.430 43.169 44.313 3,0%
Table A-9: Evolution of Beef and Dairy Production in MERCOSUR Countries
Beef (thousands of tons in carcass equivalent weight)
Milk (in millions of litres)
Year Production Consumption Exports2007 168 0 180
2008 712 0 688
2009 1.179 0 1.148
2010 1.815 508 1.358
2011 2.427 749 1.682
2012 2.455 824 1.558
2013 1.997 884 1.141
Year Production Consumption Exports2009 18 2 0
2010 96 93 0
2011 134 131 0
2012 199 188 0
2013 374 376 0
Table A-10: Evolution of the Production, Domestic Consumption and Export of Biodiesel in Argentina (in thousands of tons)
Table A-11: Evolution of the Production, Domestic Consumption and Export of Bioethanol in Argentina (in thousands of tons)
Source: INDEC and CARBIO data.
Source: INDEC.

68 M. Regúnaga and A. Tejeda Rodriguez - Argentina’s Agricultural Policies, Trade, and Sus-tainable Development Objectives
Month/Year General CPI Food CPIJan 2003 66,57 63,52
Jan 2004 68,39 65,72
Jan 2005 73,33 69,93
Jan 2006 82,21 81,04
Jan 2007 90,18 90,47
Jan 2008 97,61 97,06
Jan 2009 104,26 101,11
Jan 2010 112,85 109,53
Jan 2011 124,79 123,89
Jan 2012 136,91 133,34
Jan 2013 152,09 146,57
Dec 2013 166,84 159,82
D 2013/J 2003 2,51 2,52D 2013/J 2006 2,03 1,97
Figure A-1: Evolution of the Consumer Price Index and the Food Consumer Price Index. Period 2003–2013(index baseline 2008=100)
Source: INDEC data for the entire analysed period.
Note: Indexes corresponding to January of each year, except the last column, which is for December of 2013.
180
160
140
120
100
80
60
40
20
0
2003 2004 2005 2006 2007 2008 2009 2010 2011 2012 2013 D
2013
IPC general IPC alimentos
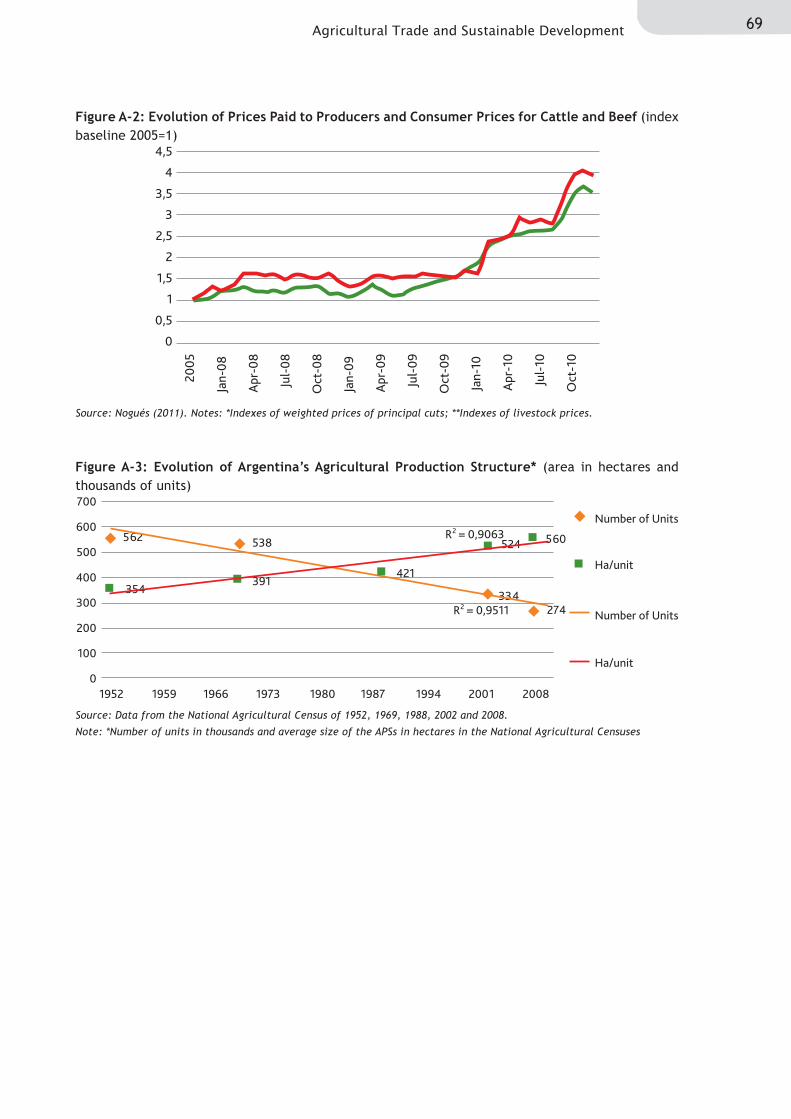
69Agricultural Trade and Sustainable Development
Figure A-2: Evolution of Prices Paid to Producers and Consumer Prices for Cattle and Beef (index baseline 2005=1)
Figure A-3: Evolution of Argentina’s Agricultural Production Structure* (area in hectares and thousands of units)
Source: Nogués (2011). Notes: *Indexes of weighted prices of principal cuts; **Indexes of livestock prices.
Source: Data from the National Agricultural Census of 1952, 1969, 1988, 2002 and 2008.
Note: *Number of units in thousands and average size of the APSs in hectares in the National Agricultural Censuses
4,5
4
3,5
3
2,5
2
1,5
1
0,5
0
20
05
Jan
-08
Ap
r-0
8
Jul-
08
Oct
-08
Jan
-09
Ap
r-0
9
Jul-
09
Oct
-09
Jan
-10
Ap
r-10
Jul-
10
Oct
-10
700
600
500
400
300
200
100
0
1952 1959 1966 1973 1980 1987 1994 2001 2008
562 538
354391
421
334274
560524
R = 0,95112
R = 0,90632
Number of Units
Ha/unit
Ha/unit
Number of Units

70 M. Regúnaga and A. Tejeda Rodriguez - Argentina’s Agricultural Policies, Trade, and Sus-tainable Development Objectives
Figure A-4: Use of Direct Seeding in Argentina’s Principal Crops in 2012/13 (% of total cultivated)
Figure A-5: Reduction in the Use of Fertilizers in Argentina between the Years 2010/11 and 2012/13 (in millions of tons of product)
100
90
80
70
60
50
40
30
20
10
0
74 89 89 93 95 85 92
Ad
op
tio
n o
f d
ire
ct s
ee
din
g (
%)
Sunflowers Wheat Barley Corn Soy Sorghum Country
Total
3,0
2,5
2,0
1,5
1,0
0,5
0,0
3,0
2,5
2,0
1,5
1,0
0,5
0,0
2010/11 2012/13
Fertilize FertilizeR ReTAA eTAA
Fert
iliz
er
(in
mil
lio
ns
of
ton
s)
Fert
iliz
er
(in
mil
lio
ns
of
ton
s)
Nitrogen-
based
Nitrogen-
based
Phosphate-
based
Phosphate-
based
Total N+P Total N+P
Fertilizar ReTAA Fertilizar ReTAA
Source: ReTAA-Buenos Aires Grain Exchanges, 2014
Source: ReTAA-Buenos Aires Grain Exchange, 2014.

71Agricultural Trade and Sustainable Development
Figure A-6: Technology Usage Levels in Different Crops in 2012/13 (in % of total cultivated)
Figure A-7: Argentine Production System with Low Use of Inputs and Energy (Direct Seeding)
100%
90%
80%
70%
60%
50%
40%
30%
20%
10%
0%
Ad
op
tio
n o
f n
ew
te
chn
olo
gie
s (%
)
Soy Wheat Corn Sunflowers Sorghum Barley
High Medium Low
11
54
35 28
36
36
39
54
7 6
69
25
5
66
29
11
35
53
+8
+8
-16
-10
+11
-1
-5
+13
-8
-10
+6
+4
+12
-2
-10-11
+8
+3
Source: ReTAA- Buenos Aires Grain Exchanges, 2014
Note: The numbers outside of the bars indicate the positive or negative evolution in relation to 2010/11.

72 M. Regúnaga and A. Tejeda Rodriguez - Argentina’s Agricultural Policies, Trade, and Sus-tainable Development Objectives
Figure A-8: European* Production System with High Use of Inputs and Energy
Source: Regúnaga, M. (2012). Note: *Photos of Tuscany, Italy.
Table A-12: Total Greenhouse Gas (GHG) Emissions per Hectare and Per Ton. Selected countries (CO2 equiv. tons/ha of productive land and CO2 equiv. tons/ton of grain produced, 1990–2011 averages)
Source: Viglizzo, E. (2014) with 2014 World Bank data.
Note: *Carbon emissions or sequestration by changes in forested area. **The information published by the World Bank has been used, but it should be noted that local sources indicate that this data overestimates the emissions of the South American direct seeding production systems.
GHG/ha of productive land GHG/ton of grain producedIncluding the
impact of forest land changes*
Not including the impact of
forest land changes
Including the impact of forest land changes*
Not including the impact of
forest land changes
Argentina 1,38 0,67 0,42 0,32
Brazil 6,16 1,91 2,27 0,74
Paraguay 3,60 1,73 1,65 0,57
Uruguay 1,07 0,90 0,30 0,47
France 4,16 2,26 0,61 0,68

73Agricultural Trade and Sustainable Development
Figure A-9: Breakdown of Total Agricultural Greenhouse Gas Emissions (average for 2007–2011) (CO2 equivalents)
Worldwide
Argentina
France
Source: http://faostat3.fao.org/browse/G1/*/E
Note: The structure of France’s intensive agriculture has a higher share of chemical fertilizers than Argentina’s extensive agriculture, which uses very little fertilizers. In Argentina, the large herds of cattle lead to a high amount of emissions stemming from enteric fermentation and the manure deposited in the pastures.
Agricultural waste3.6%
Organic soil cultivation2.6%
Rice cultivation9.8%
Savannah burning4.6%
Agricultural waste burning0.5%
Synthetic fertilizers13.5%
Manure management6.9%
Manure deposited in pastures15.6%
Manure applied to the soil3.5%
Enteric fermentation39.4%
Agricultural waste Organic soil cultivation
Rice cultivationSavannah burning
Agricultural waste burning
Synthetic fertilizers
Manure management Manure deposited in pastures
Manure applied to the soil
Enteric fermentation
5.4% 0.6%
1.1%1.1%
0.4%
4.8%
1.6% 24.7%
0.9%
59.6%
Agricultural waste Organic soil cultivation
Rice cultivationSavannah burning
Agricultural waste burning
Synthetic fertilizers
Manure management Manure deposited in pastures
Manure applied to the soil
Enteric fermentation
6 % 1.3%
0.3 %0 %
0.4%
18.9 %
14.8 % 7.1 %
8.2 %
42.9 %
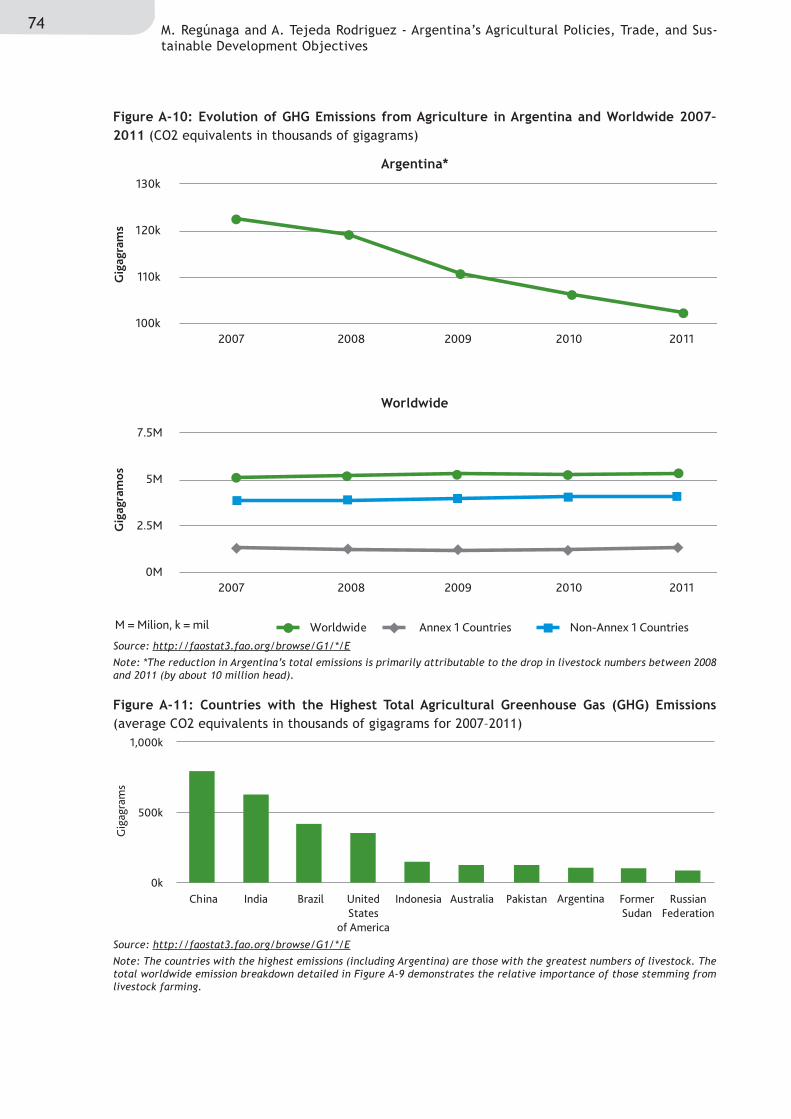
74 M. Regúnaga and A. Tejeda Rodriguez - Argentina’s Agricultural Policies, Trade, and Sus-tainable Development Objectives
130k
120k
110k
100k
2007 2008 2009 2010 2011
Gig
ag
ram
s
7.5M
5M
2.5M
0M
2007 2008 2009 2010 2011
Gig
ag
ram
os
M = Milion, k = mil Worldwide Annex 1 Countries Non-Annex 1 Countries
Figure A-10: Evolution of GHG Emissions from Agriculture in Argentina and Worldwide 2007–2011 (CO2 equivalents in thousands of gigagrams)
Source: http://faostat3.fao.org/browse/G1/*/E
Note: *The reduction in Argentina’s total emissions is primarily attributable to the drop in livestock numbers between 2008 and 2011 (by about 10 million head).
Argentina*
Worldwide
Figure A-11: Countries with the Highest Total Agricultural Greenhouse Gas (GHG) Emissions (average CO2 equivalents in thousands of gigagrams for 2007–2011)
Source: http://faostat3.fao.org/browse/G1/*/E
Note: The countries with the highest emissions (including Argentina) are those with the greatest numbers of livestock. The total worldwide emission breakdown detailed in Figure A-9 demonstrates the relative importance of those stemming from livestock farming.
1,000k
500k
0k
Gig
agra
ms
China India Bra ilz Indonesia Australia Pakistan Argentina Former
Sudan
Russian
Federation
United
States
of America

75Agricultural Trade and Sustainable Development
Figure A-12: Nominal Protection Coefficient for Soy, Corn and Wheat in Argentina 2007–2011 (coefficients expressed as a decimal; 1.00 equals the international price).
Source: Gallacher and Lema (2012).
Figure A-13: Nominal Protection Coefficients for the Principal Agricultural Activities in Argentina 2007–2011 averages (coefficients expressed as a decimal; 1.00 equals the international price).
Source: Gallacher and Lema (2012).
Figure A-14: Concepts included in the vision of PEA2
Source: MINAGRI, PEA2 (2010).
World leadership in the agri-food
and agro-industrial sectors
To ensure national food provisions and
meet international demand in both
quantity and quality
1
2
4
3
Agri-food and agro-industrial goods
and services of high quality with value
added, particularly at the source
Development of the nation and its regions:
• Territorial equality (property, territory occupation,
regional development)
Social inclusion (food security, employment, social security)
Environmental sustainability
••
1,00
0,80
0,60
0,40
0,20
0,00
2007 2008 2009 2010 2011
Soy Corn Wheat
0,7 0,6
0,9
1,2 1,0
0,70,60,7
Soy Corn Wheat Poultry Sunflower Dairy Beef Pork
ICTSD’s Programme on Agricultural Trade and Sustainable Development aims to promote food security, equity and environmental sustainability in agricultural trade. Publications include:
• Low-CarbonAgriculture in Brazil: The Environmental and Trade Impact of Current FarmPolicies.ByMarceloMarquesdeMagalhãesandDivinaAparecidaLeonelLunasLima.IssuePaper No. 54, 2014.
• The2014AgriculturalAct:U.S.FarmPolicyinthecontextofthe1994MarrakeshAgreementandtheDohaRound.ByVincentH.Smith.IssuePaperNo.52,2014.
• Public Stockholding for Food Security Purposes: Scenarios andOptions for a PermanentSolution.ByRaulMontemayor.IssuePaperNo.51,2014.
• Agricultural Export Restrictions and theWTO:What Options do Policy-Makers Have forPromotingFoodSecurity?ByGiovanniAnania.IssuePaperNo.50,2013.
• India’sAgriculturalTradePolicyandSustainableDevelopment.ByAnwarulHodaandAshokGulati.IssuePaperNo.49,2013.
• Global Biofuel Trade: How Uncoordinated Biofuel Policy Fuels Resource Use and GHGEmissions.ByS.Meyer,J.Schmidhuber,J.Barreiro-Hurlé.IssuePaperNo.48,2013.
• Agricultural Domestic Support and Sustainable Development in China. By Ni Hongxing.IssuePaperNo.47,2013.
• The2012USFarmBillandCottonSubsidies:AnassessmentoftheStackedIncomeProtectionPlan.ByHarrydeGorter.IssuePaperNo.46,2012.
• PotentialImpactofProposed2012FarmBillCommodityProgramsonDevelopingCountries.ByBruceBabcockandNickPaulson.IssuePaperNo.45,2012.
• USFarmPolicyandRiskAssistance.TheCompetingSenateandHouseAgricultureCommitteeBillsofJuly2012.ByCarlZulaufandDavidOrden.IssuePaperNo.44,2012.
• Net Food-ImportingDevelopingCountries:WhoTheyAre, andPolicyOptions forGlobalPriceVolatility.ByAlbertoValdésandWilliamFoster.IssuePaperNo.43,2012.
• TradePolicyResponses toFoodPriceVolatility inPoorNetFood-ImportingCountries.ByPanos Konandreas. Issue Paper No. 42, 2012.
• TradePolicyOptionsforEnhancingFoodAidEffectiveness.ByEdwardClay.IssuePaperNo.41, 2012.
• PossibleEffectsofRussia’sWTOAccessiononAgriculturalTradeandProduction.BySergeyKiselevandRomanRomashkin.IssuePaperNo.40,2012.
About the International Centre for Trade and Sustainable Development, www.ictsd.org Foundedin1996,theInternationalCentreforTradeandSustainableDevelopment(ICTSD)isanindependentthink-and-do-tankbasedinGeneva,Switzerlandandwithoperationsthroughoutthe world, including out-posted staff in Brazil, Mexico, Chile, Senegal, Canada, Russia, andChina. By enabling stakeholders in trade policy through information, networking, dialogue,well-targeted researchand capacity-building, ICTSDaims to influence the international tradesystemsothatitadvancesthegoalofsustainabledevelopment.ICTSDco-implementsallofitsprogrammethroughpartnersandaglobalnetworkofhundredsofscholars,researchers,NGOs,policymakersandthink-tanksaroundtheworld.
www.ictsd.org