ARGENTINA GREENHOUSE GAS (GHG) EMISSIONS (INCL. … · GREENHOUSE GAS (GHG) EMISSIONS (INCL....
15
G20 average 8 8.6 Argentina GREENHOUSE GAS (GHG) EMISSIONS (INCL. FORESTRY) PER CAPITA (tCO2e/capita) 1 ARGENTINA Country Facts 2018 Source: CAT 2018 Based on implemented policies, Argentina’s GHG emissions are expected to increase to around 470 MtCO2e by 2030 (excl. forestry). This emission pathway is not compatible with the Paris Agreement. 1 Argentina is one of the few countries that has increased its NDC targets, improving content and reflection of national policies but the NDC is not consistent with the Paris Agreement‘s temperature limit but would lead to a warming of between 3°C and 4°C. 2 Argentina’s sectoral policies still fall short of being consistent with the temperature limit, especially with respect to fossil fuels, agriculture and transport, but Argentina is showing some progress on renewable energy. 3 The government decided in 2017 to guarantee subsidies for gas exploitation until 2021. In 2016 the government launched a US$5.7bn invest- ment programme to push renewable energies, and received funding from the Green Climate Fund to guarantee the investment through the World Bank. Argentina implemented a carbon tax in 2017 (although it does not include emissions from natural gas) and has adopted important climate policies such as the Renewable Energy Act, and the Renewable Energy Distributed Generation Law. This country profile is part of the Brown to Green 2018 report. The full report and other G20 country profiles can be downloaded at: http://www.climate-transparency.org/g20-climate-performance/g20report2018 BROWN TO GREEN : THE G20 TRANSITION TO A LOW-CARBON ECONOMY | 2018 Source: Oil Change International 2017 Data from 2017 | Source: Enerdata 2018 ARGENTINA ? ? ? The gap: Is Argentina on track to stay below the Paris Agreement temperature limit? Recent developments: What has happened since the Paris conference? Brown and green performance: Where does Argentina lead or lag compared to G20 countries? Data from 2017 | Source: Enerdata 2018 + 4° + 3° + 2° + 1.5° + 1.3° Current NDC 2 Data from 2014 | Source: Argentina BUR 2017 ENERGY USE PER CAPITA (Total primary energy supply in GJ per capita) SHARE OF BROWN PUBLIC POWER FINANCE (2013-2015 annual average) 100 % G20 average: 67% G20 average: 97.2 SHARE OF NEW RENEWABLES (EXCL. HYDRO) IN ENERGY SUPPLY % G20 average: 5.4% 4.2 % 80.9
Transcript of ARGENTINA GREENHOUSE GAS (GHG) EMISSIONS (INCL. … · GREENHOUSE GAS (GHG) EMISSIONS (INCL....

G20 average88.6
Argentina
GREENHOUSE GAS (GHG) EMISSIONS (INCL. FORESTRY) PER CAPITA (tCO2e/capita)
1
ARGENTINA Country Facts 2018
Source: CAT 2018
Based on implemented policies, Argentina’s GHG emissions are expected to increase to around 470 MtCO2e by 2030 (excl. forestry). This emission pathway is not compatible with the Paris Agreement.1
Argentina is one of the few countries that has increased its NDC targets, improving content and refl ection of national policies but the NDC is not consistent with the Paris Agreement‘s temperature limit but would lead to a warming of between 3°C and 4°C.2
Argentina’s sectoral policies still fall short of being consistent with the temperature limit, especially with respect to fossil fuels, agriculture and transport, but Argentina is showing some progress on renewable energy.3
The government decided in 2017 to guarantee subsidies for gas exploitation until 2021.
In 2016 the government launched a US$5.7bn invest-ment programme to push renewable energies, and received funding from the Green Climate Fund to guarantee the investment through the World Bank.
Argentina implemented a carbon tax in 2017 (although it does not include emissions from natural gas) and has adopted important climate policies such as the Renewable Energy Act, and the Renewable Energy Distributed Generation Law.
This country profi le is part of the Brown to Green 2018 report. The full report and other G20 country profi les can be downloaded at: http://www.climate-transparency.org/g20-climate-performance/g20report2018
BROWN TO GREEN: THE G20 TRANSITION TO A LOW-CARBON ECONOMY | 2018
Source: Oil Change International 2017 Data from 2017 | Source: Enerdata 2018
ARGENTINA
???
The gap: Is Argentina on track to stay below the Paris Agreement temperature limit?
Recent developments: What has happened since the Paris conference?
Brown and green performance: Where does Argentina lead or lag compared to G20 countries?
Data from 2017 | Source: Enerdata 2018
+ 4°
+ 3°
+ 2°
+ 1.5°+ 1.3°
Current NDC2
Data from 2014 | Source: Argentina BUR 2017
ENERGY USE PER CAPITA (Total primary energy supply in GJ per capita)
SHARE OF BROWN PUBLIC POWER FINANCE (2013-2015 annual average)
100%
G20 average: 67% G20 average: 97.2
SHARE OF NEW RENEWABLES (EXCL. HYDRO) IN ENERGY SUPPLY%
G20 average: 5.4%
4.2%80.9

ARGENTINA Country Facts 2018
2
BROWN TO GREEN: THE G20 TRANSITION TO A LOW-CARBON ECONOMY | 2018
BACKGROUND INDICATORS: ARGENTINA
ARGENTINA’S EXPOSURE TO CLIMATE IMPACTS6
This indicator shows the extent to which human society and its supporting sectors are aff ected by the future changing climate conditions based on an approximately 2°C scenario. This sectoral exposure will be even higher given that the eff orts depicted in current NDCs will lead to an approximately 3°C scenario.
Own composition based on ND-GAIN 2017 (based on data for 2016). Note: Diff erent areas within the country have diff erent projections for the annual run off that may cause severe impacts. See Third National Communication of Argentina.
Projected climate impacts on cereal yields
Projected climate impacts on annual run-off
Projected climate impacts on a spread of malnutrition and diarrhoeal diseases
Projected climate impacts on biomes occupying the countries
Projected climate impacts on frequency of high temperature periods
Projected climate impacts on hydropower generation capacity
low
low
low
low
low
low
high
high
high
high
high
high
G20 country range
G20 country range
G20 country range G20
G20
G20 country range
G20
G20
G20
G20
G20
low
low
low
low
low
low
high
high
high
high
high
Projected increase of food demand due to population growth
Projected climate impacts on annual groundwater recharge
Projected climate impacts on spread of vector-borne diseases
Projected climate impacts on marine biodiversity
Projected climate impacts on frequency and severity of fl oods
Proportion of coastline impacted by sea level rise
FOOD
WATER
HEALTH
ECOSYSTEM SERVICE
HUMAN HABITAT
INFRASTRUCTURE
G20 country range
Data from 2017 | Source: UNDP 2018
20,79020,162G20 averageArgentina
0.83HUMAN DEVELOPMENT INDEX5
lowlow very high
high

GREENHOUSE GAS (GHG) EMISSIONS
ARGENTINA Country Facts 2018
3
BROWN TO GREEN: THE G20 TRANSITION TO A LOW-CARBON ECONOMY | 2018
Emissions from fuel combustion (MtCO2/year)
1990 1995 2000 2005 2010 2015 2017
Share of total CO2 emissions in 2017
Industries (incl. auto-producers)
Electricity, heat and other
Transport
Households, services,agriculture
25%
21 %
21 %
34%
250
200
150
100
50
0
MtCO2
195
CCPI PERFORMANCE RATING OF GHG EMISSIONS PER CAPITA 8
Agriculture
Industrial processes
Energy
Total emissions (excl. forestry), historical and projected
Historical emissions/removals from forestry
Waste
Other emissions
Historical emissions
Solvent and other process use
550
500
450
400
350
300
250
200
150
100
50
0
MtCO2e/year
1990 1995 2000 2005 2010 2015 2020 2025 2030
MtCO2e323
After emissions from agriculture, the next largest driver for overall GHG emissions is CO2 emissions from energy, which increased in Argentina by 4% (2012–2017). This trend was mainly driven by emissions from power generation and transport.
Source: CCPI 2018
Source: Argentina BUR 2017; CAT 2018
Recent developments
(2010-2015)very low low medium high very high
very low low medium high very high
very low low medium high very high
Current level (2015)
Current level compared to a well below 2°C pathway
ENERGY-RELATED CO2 EMISSIONS9
TOTAL GHG EMISSIONS ACROSS SECTORS7
Source: Enerdata 2018
low
low
very low
ARGENTINA
Argentina’s emissions (excl. forestry) increased by 43% between 1990 and 2014. The trend is expected to pick up speed towards 2030. The energy (including transport) and agriculture sectors contribute most to overall emissions.
DECARBONISATIONDECARBONISATION
ARGENTINA Country Facts 2018
4
BROWN TO GREEN: THE G20 TRANSITION TO A LOW-CARBON ECONOMY | 2018
very low low medium high very high
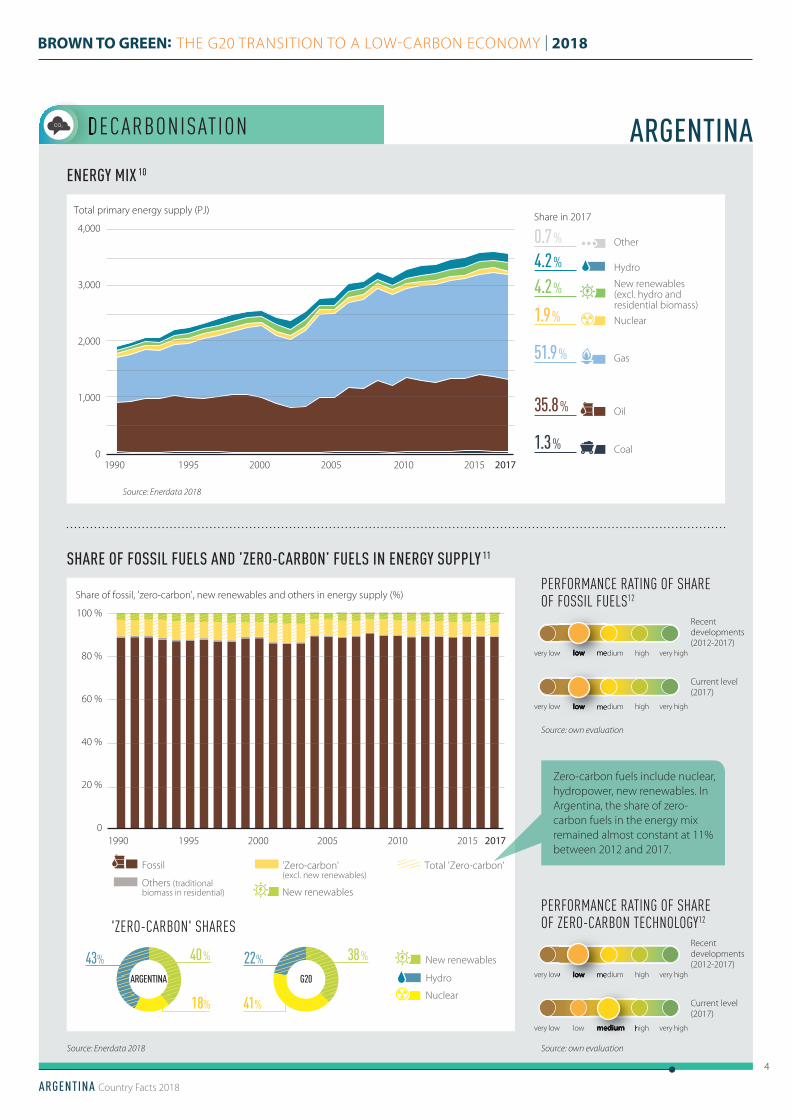
ENERGY MIX 10
Share in 2017
1.3 %
35.8 %
1.9 %4.2 %
51.9 % Gas
New renewables (excl. hydro and residential biomass)
Nuclear
Oil
Coal
4.2 % Hydro
Total primary energy supply (PJ)
1990 1995 2000 2005 20152010 2017 0
500
1000
1500
2000
2500
3000
3500
40004,000
3,000
2,000
1,000
0
0.7 % Other
Fossil
New renewables
'Zero-carbon'(excl. new renewables)
Others (traditional biomass in residential)
New renewables
Nuclear
Hydro
Total 'Zero-carbon'
Share of fossil, 'zero-carbon', new renewables and others in energy supply (%)
1990 1995 2000 2005 20152010 2017
18%
40 %43 % 22 % 38 %
41%
ARGENTINA
'ZERO-CARBON' SHARES
G20
0
20 %
40 %
60 %
80 %
100 %
Source: own evaluation
Source: Enerdata 2018
Source: Enerdata 2018
SHARE OF FOSSIL FUELS AND ’ZERO-CARBON’ FUELS IN ENERGY SUPPLY 11
PERFORMANCE RATING OF SHARE OF FOSSIL FUELS12
PERFORMANCE RATING OF SHARE OF ZERO-CARBON TECHNOLOGY12
very low low medium high very high
very low low medium high very high
very low low medium high very high
Recent developments (2012-2017)
Recent developments (2012-2017)
Current level (2017)
Current level (2017)
Source: own evaluation
Total 'Zero-carbon'
Zero-carbon fuels include nuclear, hydropower, new renewables. In Argentina, the share of zero-carbon fuels in the energy mix remained almost constant at 11% between 2012 and 2017.
very low low medium
very low low medium
very low low medium
medium high
ARGENTINA

DECARBONISATIONDECARBONISATION
ARGENTINA Country Facts 2018
5
BROWN TO GREEN: THE G20 TRANSITION TO A LOW-CARBON ECONOMY | 2018
Source: Enerdata 2018
NEW RENEWABLES13
Source: Enerdata 2018
PERFORMANCE RATING OFENERGY USE PER CAPITA12
PERFORMANCE RATING OFNEW RENEWABLES12
very low low medium high very high
very low low medium high very high
very low low medium high very high
very low low medium high very high
7AENERGY USE PER CAPITA 14
Recent developments (2012-2017)
Recent developments (2012-2017)
Current level (2017)
Current level (2017)
Source: own evaluation
Source: own evaluation
“New renewables” excludes unsustainable renewable sources such as large hydropower. New renewables account for only 4.23% of the energy mix, slightly below the G20 average of 5%. Biomass is the main source and was the driver for the 20% increase in generation between 2012 and 2017.
1990 1995 2000 2005 20152010 2017
Total primary energy supply (TPES) from new renewables (PJ)
4.17%
Share of TPES in 2017
Biomass (excl. traditionalbiomass in residential)
0.00% Geothermal
0.00% Solar
0.06% Wind
0
50
100
150
200
of totalPJ
4.23%
Total primary energy supply (TPES) per capita (GJ/capita)
1990 1995 2000 2005 20152010 2017
ARGENTINA G20
100
80
60
40
20
0
GJ/capita81
Energy use per capita in Argentina has increased at a similar pace as the G20 average but remains below the G20 average.
low medium
medium high very high
medium high
very low low medium
ARGENTINA
DECARBONISATIONDECARBONISATION
ARGENTINA G20
70
60
50
40
30
20
10
0
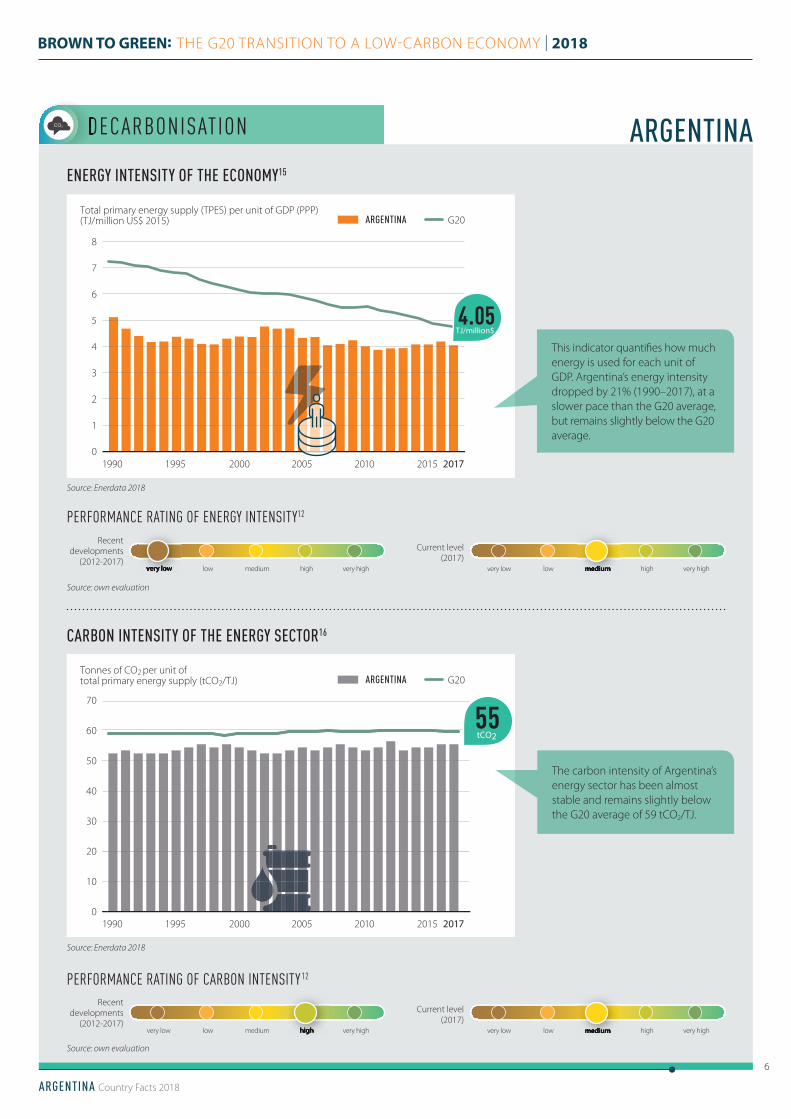
Tonnes of CO2 per unit of
total primary energy supply (tCO2/TJ)
1990 1995 2000 2005 20152010 2017
tCO255
ARGENTINA Country Facts 2018
6
BROWN TO GREEN: THE G20 TRANSITION TO A LOW-CARBON ECONOMY | 2018
PERFORMANCE RATING OF CARBON INTENSITY 12
ENERGY INTENSITY OF THE ECONOMY15
CARBON INTENSITY OF THE ENERGY SECTOR16
Total primary energy supply (TPES) per unit of GDP (PPP)(TJ/million US$ 2015)
1990 1995 2000 2005 20152010 20170
1
2
3
4
5
6
7
8
ARGENTINA G20
TJ/million$4.05
Source: Enerdata 2018
Source: own evaluation
PERFORMANCE RATING OF ENERGY INTENSITY12
This indicator quantifi es how much energy is used for each unit of GDP. Argentina’s energy intensity dropped by 21% (1990–2017), at a slower pace than the G20 average, but remains slightly below the G20 average.
The carbon intensity of Argentina’s energy sector has been almost stable and remains slightly below the G20 average of 59 tCO2/TJ.
Source: Enerdata 2018
Source: own evaluation
Recent developments
(2012-2017)
Current level (2017)
very low low medium high very high very low low medium high very highhigh medium
Recent developments
(2012-2017)
Current level (2017)
very low low medium high very high very low low medium high very highvery low medium
ARGENTINA

DECARBONISATIONDECARBONISATION
ARGENTINA Country Facts 2018
7
BROWN TO GREEN: THE G20 TRANSITION TO A LOW-CARBON ECONOMY | 2018
1.13
SECTOR-SPECIFIC INDICATORS
POWER SECTOR
TRANSPORT SECTOR
BUILDING SECTOR
ELECTRICITY DEMAND PER CAPITA(kWh/capita)
MARKET SHARE OF ELECTRIC VEHICLES IN NEW CAR SALES (%)
SHARE OF RENEWABLES IN POWER GENERATION (incl. large hydro)
SHARE OF POPULATION WITH ACCESS TO ELECTRICITY
SHARE OF POPULATION WITH BIOMASS DEPENDENCY
Data from 2017Source: Enerdata 2018
Data from 2017Source: Enerdata 2018
Data from 2017Source: IEA 2018
Data from 2017Source: AFAC 2018
Data from 2012 | Source: Government of Argentina 2017
Data from 2014 | Source: Ministry of Environment 2017
Data from 2016Source: Enerdata 2018
Data from 2017Source: Enerdata 2018
Data from 2016Source: World Bank 2018
Data from 2014Source: IEA 2016
EMISSIONS INTENSITY OF THE POWER SECTOR(gCO2/kWh)
0%G20 Argentina
Trend:
Trend:
Trend:
Trend:
Trend:
Trend
Trend:
Trend:
G20 average
G20 average
MOTORISATION RATE(Vehicles per 1000 inhabitants)
TRANSPORT EMISSIONS PER CAPITA(tCO2/capita)
Data from 2015Source: Argentina BUR 2017
INDUSTRY EMISSIONS INTENSITY (tCO2e/thousand US$2015 sectoral GDP (PPP))
0.25
Data from 2015Source: PRIMAP 2018
78%
Data from 2014Source: Argentina BUR 2017
AGRICULTURE EMISSIONS INTENSITY (tCO2e/thousand US$2015 sectoral GDP (PPP))
1.73
FOREST SECTORAGRICULTURE SECTORINDUSTRY SECTOR
G20 average: 24%
Data from 2016Source: Enerdata 2018
G20 average G20 average: 0.357 G20 average: 0.95
BUILDING EMISSIONS PER CAPITA(tCO2/capita)
100%
- 7%
-2%
no change -21%
+ 1%
+ 1%+ 7%
- 39%
bustraincar
roadrailinland waterways
Legend for trend: negative positive
n.a.300
ARGENTINA
2,931
1.09
3,920
The trend number shows developments over the past � ve years, where data is available
FREIGHT TRANSPORT(modal split in % of tonne-km)
PASSENGER TRANSPORT(modal split in % of passenger-km)
FOREST AREA COMPARED TO 1990 LEVEL (%)
490386
0.48 0.64
HydroNew renewables
taxisubwayother
26% 2%
(hydro & new renewables)
CLIMATE POLICY
ARGENTINA Country Facts 2018
8
BROWN TO GREEN: THE G20 TRANSITION TO A LOW-CARBON ECONOMY | 2018
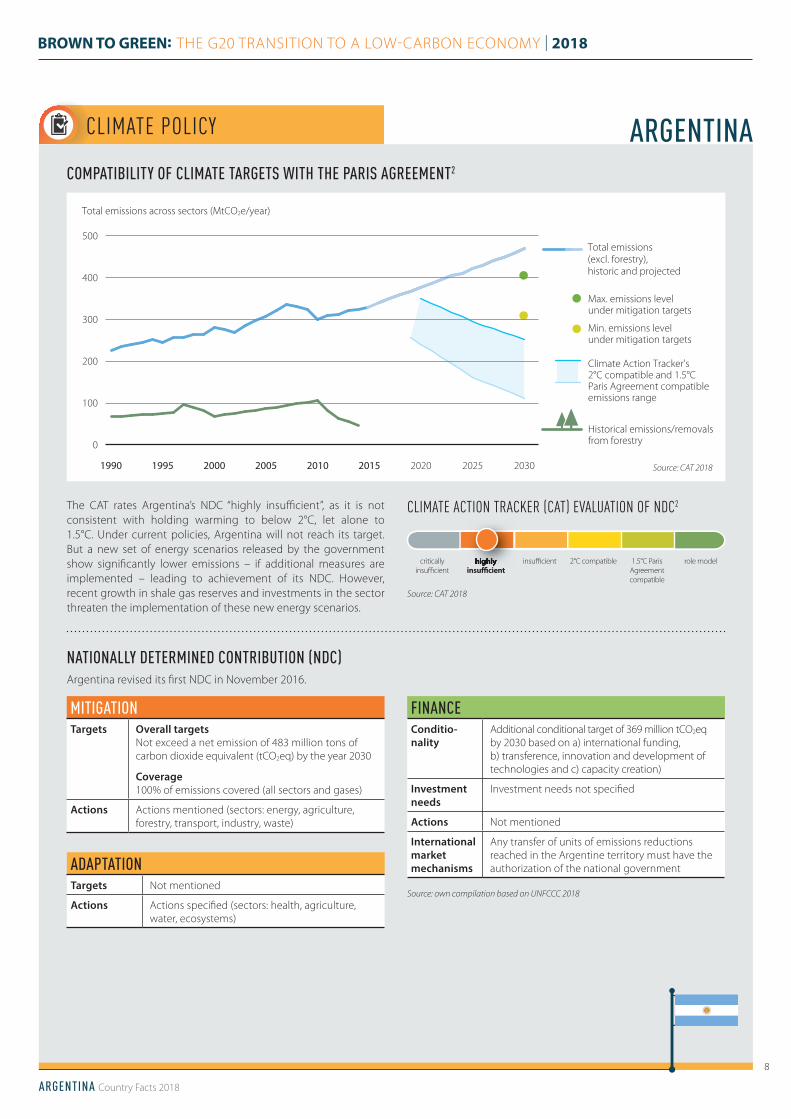
COMPATIBILITY OF CLIMATE TARGETS WITH THE PARIS AGREEMENT2
NATIONALLY DETERMINED CONTRIBUTION (NDC)
CLIMATE ACTION TRACKER (CAT) EVALUATION OF NDC2
critically insuffi cient
highly insu� cient
insuffi cient 2°C compatible 1.5°C Paris Agreement compatible
role model
The CAT rates Argentina’s NDC “highly insuffi cient”, as it is not consistent with holding warming to below 2°C, let alone to 1.5°C. Under current policies, Argentina will not reach its target. But a new set of energy scenarios released by the government show signifi cantly lower emissions – if additional measures are implemented – leading to achievement of its NDC. However, recent growth in shale gas reserves and investments in the sector threaten the implementation of these new energy scenarios.
Total emissions across sectors (MtCO2e/year)
Total emissions (excl. forestry), historic and projected
Historical emissions/removals from forestry
Climate Action Tracker's 2°C compatible and 1.5°C Paris Agreement compatible emissions range
Max. emissions level under mitigation targets
Min. emissions level under mitigation targets
1990 1995 2000 2005 2010 2015 2020 2025 20300
100
200
300
400
500
0
100
200
300
400
500
Source: CAT 2018
Source: CAT 2018
highly insu� cient
ARGENTINA
Argentina revised its fi rst NDC in November 2016.
Source: own compilation based on UNFCCC 2018
MITIGATIONTargets Overall targets
Not exceed a net emission of 483 million tons of carbon dioxide equivalent (tCO2eq) by the year 2030
Coverage100% of emissions covered (all sectors and gases)
Actions Actions mentioned (sectors: energy, agriculture, forestry, transport, industry, waste)
ADAPTATIONTargets Not mentioned
Actions Actions specifi ed (sectors: health, agriculture, water, ecosystems)
FINANCEConditio-nality
Additional conditional target of 369 million tCO2eq by 2030 based on a) international funding, b) transference, innovation and development of technologies and c) capacity creation)
Investment needs
Investment needs not specifi ed
Actions Not mentioned
International market mechanisms
Any transfer of units of emissions reductions reached in the Argentine territory must have the authorization of the national government

CLIMATE POLICY
ARGENTINA Country Facts 2018
9
BROWN TO GREEN: THE G20 TRANSITION TO A LOW-CARBON ECONOMY | 2018
low medium high frontrunner
GHG emissions target for 2050 or beyond
Long-term low emissions development strategy
Near-zero energy new
buildings low medium high frontrunner
! Net zero deforestation
!Renewable
energy in power sector
!Phase-out
fossil fuel light duty vehicles
Low-carbon new industry
installations
POLICY EVALUATION17
medium
The ratings evaluate a selection of policies that are essential pre-conditions for the longer-term transformation required to meet the 1.5°C limit. They do not represent a complete picture of what is necessary.
The government aims to increase the share of renewables in the electricity mix from 2% to 20% by 2025. It has awarded projects of approximately 5,000 MW, half the power required to reach the 2025 target, although fi nance for initial investment poses a challenge. In 2017, the government published a 2030 Energy and Climate Change action plan.
The share of coal in Argentina’s energy mix is negligible.
In its 2017 Transport Plan, the government envisages reducing transport emissions by 7.2% by 2030 compared to business-as-usual. The plan covers measures to target both freight and passenger transport, including the promotion of low-/zero-emission vehicles, but no phase-out date for fossil-based LDVs has been set. In 2017, Argentina adopted its fi rst effi ciency labelling scheme for LDVs. Vehicles need to comply with EURO 5a standards.
The government adopted an energy savings programme for public buildings, and educational programmes. No national building code exists but diff erent cities are developing and implementing energy building codes, e.g. requiring replacement of ineffi cient heating systems or the use of solar water heaters in new public buildings.
The government presented in 2018 an Industrial Mitigation Action Plan that includes measures such as substituting old electric motors for new, effi cient ones. The Renewable Energy Law mandates mid-size and large companies to consume 20% of their energy from renewable energy resources by 2025 and provides support to this end.
In 2017, Argentina adopted a National Action Plan on Forests and Climate Change, aiming to reduce GHG emissions from the forest sector by at least 27 MtCO2e by 2030. There is no target for reaching net zero deforestation.
low medium high frontrunner
low medium high frontrunner
low medium high frontrunnerlow medium high frontrunner
most important measures based on share of emissions and political relevance!
low No action medium Some action high Signifi cant action and a long-term vision frontrunner Signifi cant action, and a long-term vision that is compatible with 1.5°C
Legend:
Argentina is currently developing a long-term low emissions development strategy towards 2030 and beyond, but the government has not yet adopted an emissions target for 2050.
This strategy is being developed in the national climate change cabinet established in 2016.
TRANSPORT BUILDINGS
INDUSTRY FORESTS
PO WER
Coal phase-out not applicable
Source: own evaluation
ARGENTINA
high
CLIMATE POLICY
ARGENTINA Country Facts 2018
10
BROWN TO GREEN: THE G20 TRANSITION TO A LOW-CARBON ECONOMY | 2018
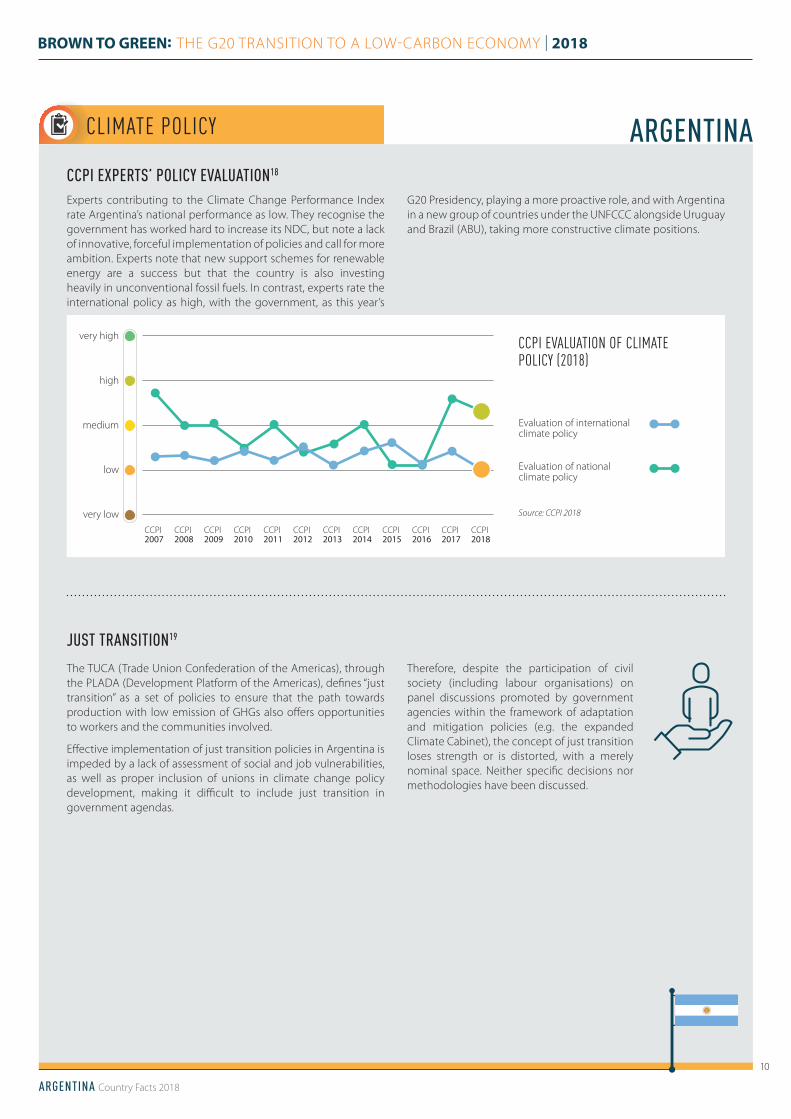
CCPI EXPERTS’ POLICY EVALUATION18
JUST TRANSITION19
Experts contributing to the Climate Change Performance Index rate Argentina’s national performance as low. They recognise the government has worked hard to increase its NDC, but note a lack of innovative, forceful implementation of policies and call for more ambition. Experts note that new support schemes for renewable energy are a success but that the country is also investing heavily in unconventional fossil fuels. In contrast, experts rate the international policy as high, with the government, as this year’s
G20 Presidency, playing a more proactive role, and with Argentina in a new group of countries under the UNFCCC alongside Uruguay and Brazil (ABU), taking more constructive climate positions.
The TUCA (Trade Union Confederation of the Americas), through the PLADA (Development Platform of the Americas), defi nes “just transition” as a set of policies to ensure that the path towards production with low emission of GHGs also off ers opportunities to workers and the communities involved.
Eff ective implementation of just transition policies in Argentina is impeded by a lack of assessment of social and job vulnerabilities, as well as proper inclusion of unions in climate change policy development, making it diffi cult to include just transition in government agendas.
Therefore, despite the participation of civil society (including labour organisations) on panel discussions promoted by government agencies within the framework of adaptation and mitigation policies (e.g. the expanded Climate Cabinet), the concept of just transition loses strength or is distorted, with a merely nominal space. Neither specifi c decisions nor methodologies have been discussed.
very high
high
medium
low
very low
CCPI 2008
CCPI 2009
CCPI 2007
CCPI 2010
CCPI 2011
CCPI 2012
CCPI 2013
CCPI 2014
CCPI 2015
CCPI 2016
CCPI 2017
CCPI 2018
Evaluation of international climate policy
Evaluation of national climate policy
CCPI EVALUATION OF CLIMATE POLICY (2018)
Source: CCPI 2018
ARGENTINA

FINANCING THE TRANSITION
ARGENTINA Country Facts 2018
11
BROWN TO GREEN: THE G20 TRANSITION TO A LOW-CARBON ECONOMY | 2018
■ FINANCIAL POLICIES AND REGULATIONS
■ FISCAL POLICY LEVERS
APPROACHES TO IMPLEMENTING THE RECOMMENDATIONS OF THE TASK FORCE ON CLIMATE-RELATED FINANCIAL DISCLOSURES (TCFD)20
FOSSIL FUEL SUBSIDIES
Through policy and regulation governments can overcome challenges to mobilising green fi nance, including: real and perceived risks, insuffi cient returns on investment, capacity and information gaps.
This indicator establishes the degree of government engagement with the recommendations of the G20 Financial Stability Board‘s Task Force on Climate-Related Financial Disclosure.
Fiscal policy levers raise public revenues and direct public resources. Critically, they can shift investment decisions and consumer behaviour towards low-carbon, climate-resilient activities by refl ecting externalities in prices.
In 2016, Argentina’s fossil fuel subsidies reached US$2.7bn, from US$11.3bn (2014). From 2014 to 2016, subsidies were above (US$0.008) the G20 average (US$0.004) per unit of GDP. This includes an estimate of consumption subsidies alone, adopting the price-gap approach. Analysing both production and consumption subsidies, FARN fi nds subsidies were more than US$1bn in 2016. Subsidies to fossil fuel production are increasing under the VacaMuerta and Los Molles megaproject.
0
2
4
6
8
10
12
Fossil fuel subsidies (US$ billions)
2007 2010 2013 2016
No formal engagement
with TCFD
Political and regulatory
engagement
Formal engagement with
private sector
Publication of guidance and action plans
Encoding into law
Source: CISL 2018
Source: OECD/IEA 2018; FARN 2018
CARBON REVENUES
In December 2017, Argentina launched a national carbon tax. The scheme will provide exemptions to natural gas products, expected to become a major power source in the coming years. No other carbon taxation or emissions trading schemes are currently planned, either national or subnational.
No evidence of formal engagement with TCFD-compliant initiatives was found in Argentina. It has, however, begun a process to examine how its fi nancial system supports sustainable fi nancing. As the G20 presidency holder this year, Argentina builds on past G20 presidencies to support sustainable fi nancing.
ARGENTINA
Source: I4CE 2018; FARN 2017
CO2NO EXPLICIT CARBON PRICING SCHEME FROM 2007 TO 2016.

FINANCING THE TRANSITION
ARGENTINA Country Facts 2018
12
BROWN TO GREEN: THE G20 TRANSITION TO A LOW-CARBON ECONOMY | 2018
NATIONAL AND INTERNATIONAL PUBLIC FINANCE IN THE POWER SECTOR21
PROVISION OF INTERNATIONAL PUBLIC SUPPORT
CONTRIBUTIONS THROUGH THE MAJOR MULTILATERAL CLIMATE FUNDS22
BILATERAL CLIMATE FINANCE CONTRIBUTIONS23
■ PUBLIC FINANCE Governments steer investments through their public fi nance institutions including via development banks, both at home and overseas, and green investment banks. Developed G20 countries also have an obligation to provide fi nance to developing countries and public sources are a key aspect of these obligations under the UNFCCC.
From 2013 to 2015, Argentina’s public fi nance institutions spent an annual average of US$1.4bn on brown and US$4m on green fi nancing in the power sector domestically. The largest transaction (US$2bn) was for fossil fuel exploration by state-owned enterprises. No grey public fi nancing was identifi ed, likely due to a lack of transparency. In 2018, FARN estimates brown fi nancing at closer to 93%.
Argentina is not listed in Annex II of the UNFCCC and is therefore not formally obliged to provide climate fi nance. While Argentina may channel international public fi nance towards climate change via multilateral and other development banks, this has not been included in this report.
2013-2015 annual average of power finance (US$ billions) Proportion of total public finance to power
0.0
0.3
0.6
0.9
1.2
1.5
Brown Green Grey
ARGENTINA 100%
10%10%
67%67%23%23%
G20
Note: No grey fi nancing was identifi ed.Source: Oil Change International 2017; FARN 2018
Source: Climate Funds Update 2017
Source: Country reporting to UNFCCC
Note: See Technical Note for multilateral climate funds
included and method to attribute amounts to countries
OBLIGATION TO PROVIDE CLIMATE FINANCEUNDER UNFCCC
Annual average contribution
(mn US$, 2015-2016)
n.a.
Theme of support
Mitigation Adaptation Cross-cutting Other
n.a. n.a. n.a. n.a.
Annual average contribution
(mn US$, 2015-2016)
Theme of support
Adaptation Mitigation Cross-cutting
n.a. n.a. n.a. n.a.
coal, oil and gas projects(and associated infrastructure)
brown
large-scale hydropower, biofuels, biomass, nuclear, incineration, transmission,
distribution, storage, energy effi ciency, other general electricity support
grey
renewable energy projects (excluding grey fi nancing)
green
ARGENTINA
NOYES

ARGENTINA Country Facts 2018
13
BROWN TO GREEN: THE G20 TRANSITION TO A LOW-CARBON ECONOMY | 2018
ANNEX G20
1) The 2030 projections of the future development of greenhouse gas (GHG) emissions under current policies are based on the Climate Action Tracker (CAT) estimates.
2) The CAT is an independent scientific analysis that tracks progress towards the globally agreed aim of holding warming to well below 2°C, and pursuing efforts to limit warming to 1.5°C. The CAT ”Effort Sharing“ assessment methodology applies state-of-the-art scientific literature on how to compare the fairness of government efforts and (Intended) Nationally Determined Contribution ((I)NDC) proposals against the level and timing of emission reductions consistent with the Paris Agreement. The assessment of the temperature implications of a country’s NDC is based on the assumption that all other governments would follow a similar level of ambition.
3) This assessment is based on the policy evaluation on page 9 of this Country Profile.
4) Gross Domestic Product (GDP) per capita is calculated by dividing GDP with mid-year population figures. GDP is the value of all final goods and services produced within a country in a given year. Here GDP figures at purchasing power parity (PPP) are used. Data for 2017.
5) The Human Development Index (HDI) is a composite index published by the United Nations Development Programme (UNDP). It is a summary measure of average achievement in key dimensions of human development. A country scores higher when the lifespan is higher, the education level is higher, and GDP per capita is higher.
6) The ND-GAIN index summarises a country’s vulnerability to climate change and other global challenges in combination with its readiness to improve resilience. This report looks only at the exposure indicators as part of the vulnerability component of the ND-GAIN index for six sectors. It displays the exposure scores provided by the ND-GAIN on a scale from low (score: 0) to high (score: 1).
7) The indicator covers all Kyoto gases showing historic emissions in each of the IPCC source categories (energy, industrial processes, agriculture, etc.). Emissions projections (excl. forestry) under a current policy scenario until 2030 are taken from the Climate Action Tracker and scaled to the historical emissions from PRIMAP (see Brown to Green Report 2018 Technical Note).
8) The ratings on GHG emissions are taken from the Climate Change Performance Index (CCPI) 2018. The rating of “current level compared to a well below 2°C pathway” is based on a global scenario of GHG neutrality in the second half of the century and a common but differentiated convergence approach.
9) CO2 emissions cover only the emissions from fossil fuels combustion (coal, oil and gas) by sector. They are calculated according to the UNFCCC methodology (in line with the 2006 IPCC Guidelines for National Greenhouse Gas Inventories).
10) Total primary energy supply data displayed in this Country Profile does not include non-energy use values. Solid fuel biomass in residential use has negative environmental and social impacts and is shown in the category “other”.
11) Zero-carbon fuels include nuclear, hydropower and new renewables (non-residential biomass, geothermal, wind, solar).
12) Climate Transparency ratings assess the relative performance across the G20. A high scoring reflects a good effort from a climate protection perspective but is not necessarily 1.5°C compatible.
13) New renewables include non-residential biomass, geothermal, wind and solar energy. Hydropower and solid fuel biomass in residential use are excluded due to their negative environmental and social impacts.
14) Total primary energy supply (TPES) per capita displays the historical, current and projected energy supply in relation to a country’s population. Alongside the intensity indicators (TPES/GDP and CO2/TPES), TPES per capita gives an indication on the energy efficiency of a country’s economy. In line with a well-below 2˚C limit, TPES per capita should not grow above current global average levels. This means that developing countries are still allowed to expand their energy use to the current global average, while developed countries have to simultaneously reduce it to that same number.
15) TPES per GDP describes the energy intensity of a country’s economy. This indicator illustrates the efficiency of energy usage by calculating the energy needed to produce one unit of GDP. Here GDP figures at PPP are used. A decrease in this indicator can mean an increase in efficiency but also reflects structural economic changes.
16) The carbon intensity of a country’s energy sector describes the CO2 emissions per unit of total primary energy supply and gives an indication of the share of fossil fuels in the energy supply.
For more detail on sources and methodologies, please refer to the Technical Note at: https://www.climate-transparency.org/wp-content/uploads/2018/11/Technical-Note_data-sources-and-methodology.pdf
ARGENTINA Country Facts 2018
14
BROWN TO GREEN: THE G20 TRANSITION TO A LOW-CARBON ECONOMY | 2018
ANNEX (continued) G20
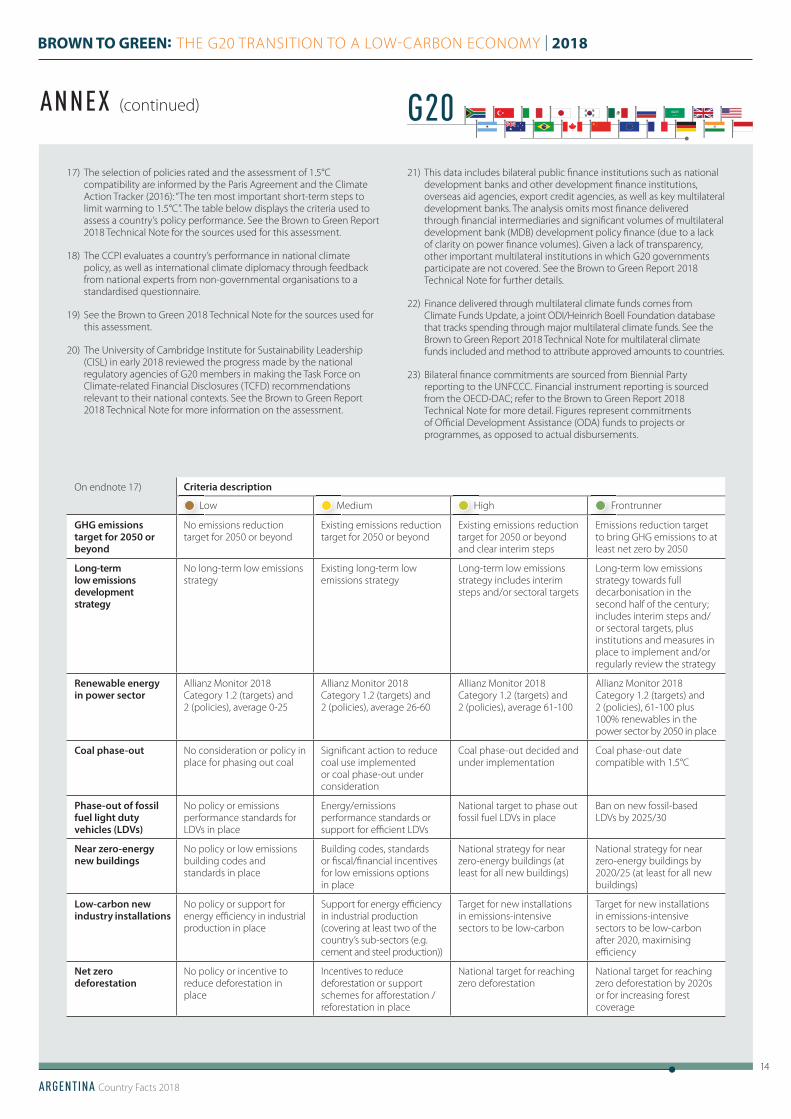
On endnote 17) Criteria description Low Medium High Frontrunner
GHG emissions target for 2050 or beyond
No emissions reduction target for 2050 or beyond
Existing emissions reduction target for 2050 or beyond
Existing emissions reduction target for 2050 or beyond and clear interim steps
Emissions reduction target to bring GHG emissions to at least net zero by 2050
Long-term low emissions development strategy
No long-term low emissions strategy
Existing long-term low emissions strategy
Long-term low emissions strategy includes interim steps and/or sectoral targets
Long-term low emissions strategy towards full decarbonisation in the second half of the century; includes interim steps and/or sectoral targets, plus institutions and measures in place to implement and/or regularly review the strategy
Renewable energy in power sector
Allianz Monitor 2018 Category 1.2 (targets) and 2 (policies), average 0-25
Allianz Monitor 2018 Category 1.2 (targets) and 2 (policies), average 26-60
Allianz Monitor 2018 Category 1.2 (targets) and 2 (policies), average 61-100
Allianz Monitor 2018 Category 1.2 (targets) and 2 (policies), 61-100 plus 100% renewables in the power sector by 2050 in place
Coal phase-out No consideration or policy in place for phasing out coal
Signifi cant action to reduce coal use implemented or coal phase-out under consideration
Coal phase-out decided and under implementation
Coal phase-out date compatible with 1.5°C
Phase-out of fossil fuel light duty vehicles (LDVs)
No policy or emissions performance standards for LDVs in place
Energy/emissions performance standards or support for effi cient LDVs
National target to phase out fossil fuel LDVs in place
Ban on new fossil-based LDVs by 2025/30
Near zero-energy new buildings
No policy or low emissions building codes and standards in place
Building codes, standards or fi scal/fi nancial incentives for low emissions options in place
National strategy for near zero-energy buildings (at least for all new buildings)
National strategy for near zero-energy buildings by 2020/25 (at least for all new buildings)
Low-carbon new industry installations
No policy or support for energy effi ciency in industrial production in place
Support for energy effi ciency in industrial production (covering at least two of the country’s sub-sectors (e.g. cement and steel production))
Target for new installations in emissions-intensive sectors to be low-carbon
Target for new installations in emissions-intensive sectors to be low-carbon after 2020, maximising effi ciency
Net zero deforestation
No policy or incentive to reduce deforestation in place
Incentives to reduce deforestation or support schemes for aff orestation /reforestation in place
National target for reaching zero deforestation
National target for reaching zero deforestation by 2020s or for increasing forest coverage
17) The selection of policies rated and the assessment of 1.5°C compatibility are informed by the Paris Agreement and the Climate Action Tracker (2016): “The ten most important short-term steps to limit warming to 1.5°C”. The table below displays the criteria used to assess a country’s policy performance. See the Brown to Green Report 2018 Technical Note for the sources used for this assessment.
18) The CCPI evaluates a country’s performance in national climate policy, as well as international climate diplomacy through feedback from national experts from non-governmental organisations to a standardised questionnaire.
19) See the Brown to Green 2018 Technical Note for the sources used for this assessment.
20) The University of Cambridge Institute for Sustainability Leadership (CISL) in early 2018 reviewed the progress made by the national regulatory agencies of G20 members in making the Task Force on Climate-related Financial Disclosures (TCFD) recommendations relevant to their national contexts. See the Brown to Green Report 2018 Technical Note for more information on the assessment.
21) This data includes bilateral public fi nance institutions such as national development banks and other development fi nance institutions, overseas aid agencies, export credit agencies, as well as key multilateral development banks. The analysis omits most fi nance delivered through fi nancial intermediaries and signifi cant volumes of multilateral development bank (MDB) development policy fi nance (due to a lack of clarity on power fi nance volumes). Given a lack of transparency, other important multilateral institutions in which G20 governments participate are not covered. See the Brown to Green Report 2018 Technical Note for further details.
22) Finance delivered through multilateral climate funds comes from Climate Funds Update, a joint ODI/Heinrich Boell Foundation database that tracks spending through major multilateral climate funds. See the Brown to Green Report 2018 Technical Note for multilateral climate funds included and method to attribute approved amounts to countries.
23) Bilateral fi nance commitments are sourced from Biennial Party reporting to the UNFCCC. Financial instrument reporting is sourced from the OECD-DAC; refer to the Brown to Green Report 2018 Technical Note for more detail. Figures represent commitments of Offi cial Development Assistance (ODA) funds to projects or programmes, as opposed to actual disbursements.

ARGENTINA Country Facts 2018
15
BROWN TO GREEN: THE G20 TRANSITION TO A LOW-CARBON ECONOMY | 2018
CLIMATE TRANSPARENCY
http://www.climate-transparency.org/g20-climate-performance/g20report2018
Funders:
Partners:
Data Partners:
Supported by:
based on a decision of the German Bundestag
Contact point for Argentina:
Enrique Maurtua Konstantinidis Fundación Ambiente y Recursos [email protected]