Egidio FERRARA, Plaintiff-Appellant, v. Olga FERRARA, 2012 ...

!
!
!
!
!
!
!
!!!!!!!!!!!!
!
!
!
!
!
!
!
!
!
!
by
Davide Antonioli, Simone Borghesi
and
Massimiliano Mazzanti!
!
!
!
!
!
!
!
!
!
!
!
!
Are$Regional$systems$greening$the$economy?$$The$role$of$environmental$innovations$and$agglomeration$forces!!!
!
!

!!
The!Sustainability!Environmental!Economics!and!Dynamics!Studies!(SEEDS)!is!an!inter9university!research!centre!that!aims!at!developing!and!promote!research!and!higher!education!projects!in!the!fields! of! ecological! and! environmental! economics,! with! a! special! eye! to! the! role! of! policy! and!innovation!in!the!path!towards!a!sustainable!society,!in!economic!and!environmental!terms.!Main!fields!of!action!are!environmental!policy,!economics!of! innovation,!energy!economics!and!policy,!economic! evaluation! by! stated! preference! techniques,! waste! management! and! policy,! climate!change!and!development.!!
!The!SEEDS!Working!Paper!Series!are!indexed!in!RePEc!and!Google!Scholar.!!Papers!can!be!downloaded!free!of!charge!from!the!following!websites:!http://www.sustainability1seeds.org/.!!Enquiries:[email protected]!!
!
!
!
SEEDS!Working!Paper!4/2014!February!2014!by!Davide!Antonioli,!Simone!Borghesi,!Massimiliano!Mazzanti.!!
!
!
!
!
!
!
!
!
!
!
!
!
!
!
!
The!opinions!expressed!in!this!working!paper!do!not!necessarily!reflect!the!position!of!SEEDS!as!a!whole.!

1
1
ARE REGIONAL SYSTEMS GREENING THE ECONOMY? THE ROLE OF ENVIRONMENTAL INNOVATIONS AND
AGGLOMERATION FORCES
Davide Antoniolij, Simone Borghesii, Massimiliano Mazzantij*
*Corresponding author, University of Ferrara, [email protected]
Abstract
The adoption and diffusion of environmental innovations (EIs) is crucial to greening the economy and achieving win-win environmental – economic gains. A large and increasing literature has focused on the levers underlying EIs that are external to the firm, such as stakeholder’s pressure and policy pressure. Little attention, however, has been devoted so far to the possible role of local spatial spillovers. The latter can be very relevant since growth depends on strong idiosyncratic regional factors – such asagglomeration economies - that must be integrated with the challenges posed by global markets. To overcome this drawback of the existing literature, we analyse here a rich dataset that covers the innovative activities and economic performances of firms in the Emilia-Romagna Region in Italy, a manufacturing district-rich area. We analyse firms’ performances through a two-step procedure. First, we look at the relevance of spatial levers, namely whether the agglomeration of EIs induces EIs in a given firm. Second, we test whether EIs have significantly increased firms’ economic performances. As to the importance of spatial levers, the role of agglomeration turns out to be fairly local in nature:we find that spillovers are significantly inducing innovation within municipal boundaries, which is coherent with the district-based Marshallian economies of north-eastern Italy. Regarding economic performances, firms' productivity is positively related to EI adoption; in particular,firms that adopt EIs and organizational change show a better economic performance.Our findings suggest that EIscanbe a key source of growth for regional systems, particularly when spurred by local spillovers, and an important way outof the ongoing crisis.
Keywords: environmental innovations, firm economic performances, local spillovers, manufacturing, agglomeration.
J.E.L. Classification: O38, Q55
jUniversity of Ferrara i University of Siena

2
2
1. Introduction
Environmental innovations (EIs) are receiving increasing attention as a key factor for the progress towards a greener and more competitive economy. As is well-known, innovation is a driver of productivity growth, and sustainable economic growth depends on investments in new ways of managing production, both from the technological and organizational viewpoint, that help preserving the environment. The notion of EI represents a broad concept that can encompass various dimensions (Kemp and Pontoglio, 2011).One of the most recent definitions of eco-innovation (used in this paper as synonymous of environmental innovations) describes it as the production, application or use of a product, service, production process or management system new to the firm adopting or developing it, and which implies a reduction in environmental impact and resource use (including energy) throughout its life-cycle (Kemp, 2010).
Given the potentially strategic role played by EIs for the sustainability of economic growth, many studies have examined the factors underlying them. In particular, as some authors have pointed out (Horbach, 2008; Horbach and Oltra, 2010), the drivers of EIs can be categorised both as internal (e.g. training) and external (e.g. cooperation with other agents) to the firm, including among the latter sector/structural features as well as policy levers (Borghesi et al., 2012; Veugelers, 2012). Moreover, Horbach et al. (2012) have recently framed the factors correlated to EIs around the dimensions of regulation, market push factors, technological factors and firms’ specific features. Beyond these factors, also spatial and geographical drivers mayplay a relevant role. Despite very recent works (Cainelli et al., 2012; Horbach, 2013), however, the analysis of EIs in regional settings has been generally overlooked so far. As Truffer and Coenen state (2012): ‘Much of the sustainability transitions literature can be criticized for being spatially blind and for (implicitly) overemphasizing the national level at the expense of other geographical levels. More specifically, the role of regions in sustainability transitions has received little attention in this literature’1.
To overcome this shortcoming of the existing literature, this paper aims at enriching the discussion over the relational/spatial factors (De Marchi, 2012) that might be behind EIs adoption and diffusion2 in economically agglomerated regional settings.
Spatial and spillover effects become crucially important under a perspective that defines ‘regional competitive advantages’ as a key factor to achieving sustainability and competitiveness aims. In this regard, it is noteworthy to observe that a sector-based and regional perspective is coherent with new policy and growth approaches in the EU. Recently, in fact, a rebalanced emphasis that explicitly includes the role of geographical aspects as a driver of development and growth is apparent in the re-launching of the redefined Lisbon agenda. Thus, EU growth policy is moving toward a more balanced perspective that accounts for both joint regional-sector based ‘smart’ specialisation which explicitly accounts for climate change, and environmentally related issues in light of the EU 20-20-20 strategy on environmental and energy targets (Iammarino and 1For a broad discussion on regional studies and sustainability transition issues we refer the interested reader also to Benneworth et al. (2012). 2 See Hall and Helmers (2013) for a discussion on inventions, innovation and diffusion concepts in the realm of green technologies.
3
3
McCann, 2006; Costantini and Mazzanti, 2013). A more specific conceptual reference that is relevant is the ‘regional systems of innovation’ approach (Iammarino, 2005). This approach investigates what are the key elements characterising the regions that foster innovations (Cainelli, 2008; Cainelli and Iacobucci, 2007).
The analysis of the diffusion of EIs at spatial and sector level is particularly relevant in the EU since, as it is well-known, small-medium enterprises (SMEs) and district-based industries play a crucial role in many EU countries. While much emphasis has been placed on the behaviour of large firms (e.g. corporates), environmental and innovation economists should deepen the analysis of how EIs spread and are adopted in economic contexts that are rich in SMEs (Brioschi et al., 2002; Cainelli and Zoboli, 2004; Mazzanti and Zoboli, 2009). This would also allow a fruitful integration between environmental economics and regional studies
In this work we attempt to originally extend the analysis of EI adoption and diffusion in two main ways.
In the first place, we aim at capturing the EIs levers that can be found in the firm’s territorial institutional and economic features. This extends the set of factors that favour the adoption of EIs (Horbach et al., 2012) and strictly embeds EIs within a regional setting environment.We aim at studying which geographical factors are relevant in supporting EIs in regional systems characterized by a high density of firms agglomerated into districts. This has been a somewhat overlooked issue regarding EIs, but it is relevant given the complementarity of EIs with techno-organisational change in a broader meaning (Antonioli et al., 2013). EIs are not only a technical box, but rather an embedded factor within a firm’s institutional features and the territory the firm belongs to. These local features then interplay and integrate with the global challenges firms face, namely exposure to international markets and, for the sake of this paper, the new challenges posed by climate change.
In the second place, we study the effects of EIs, possibly integrated with other firm strategies, on economic performances(see, among others, Horbach and Rennings, 2012; Cainelli et al., 2011;Jaffe et al., 1995; Ambec et al., 2010; Ambec and Barla, 2006; Ambec and Lanoie, 2008; De Marchi and Grandinetti, 2013; De Marchi et al., 2013) by adding the spatial component.In this regard, differently from most previous contributions, we place particular emphasis on SMEs, which represent the large majority of firms and the heart of industry in most EU countries. This focus is especially important in countries such as Italy where industry is historically structured on a web of SMEs, that are often ‘organised’ into districts and exploit networking and cooperation activities as resources that enhance competitiveness through knowledge transfer (Boschma and Lambooy, 2002; Beaudry and Breschi, 2003).
Summing up, the main aims of the empirical work are: (i) to assess whether regional systems rich with agglomeration economies are a pre-condition for EI diffusion, (ii) to investigate whether EIs are integrated with other techno-organisational strategies and finally (iii) to analyse whether EIs – taken alone or in integration with other innovations – impact on a firm’s productivity performances.
We carry out our empirical analysis on the basis of an original survey that covers more than 500 firms in the Emilia-Romagna Region in the North-East of Italy. Such a survey allows us to have

4
4
information on the firm’s spatial location and balance sheets, which enables to geta deeper understanding of the ‘firm’s behaviour’. The survey is temporally comparable with the CIS 2006-2008. We deliberately introduced ‘CIS-like’ questions3 on EI issues(see Borghesi et al., 2012; Cainelli et al., 2012 and Antonioli et al., 2013 for discussions on EU CIS issues). To study the EIs effects on economic performances we merge the innovation dataset with original balance account sheets at the firm level. To additionally control for environmental regional features, we also merge the innovation dataset with emission data.
The Emilia-Romagna Region is a case worth investigating under many respects. In the first place, it is a relevant industrial macro region of the EU that presents high innovation capacity (Brioschi et al., 2012; Putnam, 1993). It is thus worth assessing the extent to which EIsare a core firm strategy and whether the ‘Emilian model’ -founded on dense agglomeration economies and district-based competitive advantages (Cainelli, 2008)- is moving towards a greener economy. Though the region still remains relatively competitive, it harshly suffered duringthe 2009 crisis – due toa collapse in its exports – and is now moving towards a new industrial setting and new competitiveness sources. EIsmight be a relevant part of this new development. In fact, EIs are strictly linked to two market failures (under-provision of innovation and over-production of externalities) and might generate higher environmental and economic performances. The region, therefore, provides a good case study to analyse the evolution of an industrial context rich of SMEs towards a green economy path -- a ‘new’ growth path that might potentially generate value to the Italian economic system that has suffered a ‘productivity stagnation’ over the past 10-13 years (Figure 1)4.
Figure 1 – Labour Productivity trends in the EU
Source: Istat
In the second place, though the region’s innovative capacity is helping its environmental performances (Costantini et al., 2013), the heavy industrial structure penalises its overall performance, which does not particularly excel within the Italian scenario. The region, in fact, because of its industrial structure, ranks slightly above the national average (0 on the Y axis in fig.2 and 3) in terms of emissions per value added as it can be appreciated employing a shift 3 All questions are available upon request. 4In addition, it is worth noting that this ‘crisis’ is somewhat correlated to laggardness in environmental performances (Marin and Mazzanti, 2013).

5
5
share analysis on Italian emission data: values of emission per region above (below) 0 mean a worse (better) performance than the national average (see Mazzanti and Montini, 2010 for a detailed account of the shift share analysis from which the structural and efficiency component are derived) One explanation is that the relatively high environmental production efficiency of Emilia Romagna is currently not sufficient to compensate for the scale effect and the composition effect deriving from the structure of its economy (Figures 2 and 35).
Figure 2 - Shift share analysis - Regional gaps in terms of productive structure (structural component). Negative values represent performances better than the national average.
Source: NAMEA data, Istat
Figure 3 - Shift share analysis - Regional gaps in terms of efficiency of production (efficiency component). Negative values represent performances better than the national average.
Source: NAMEA data, Istat
Though the EI performance of the Emilia-Romagna region has been better than the average Italian performance in the last decade, this industrial macro region presents also some relevant
5 The two figures highlight that the region is more or less in line with the Italian average. Though the pure efficiency of production is higher than the average, this is only sufficient to compensate for the heavy economic structure. Looking at future development, further increases in efficiency are needed to do more than compensate for regional performance.
-0.2
-0.1
0.0
0.1
0.2
CO2
SOx
NOx
NMVOC
PM10
-0.3
-0.1
0.1
0.3
0.5
0.7
0.9
1.1
CO2
SOx
NOx
NMVOC
PM10

6
6
critical aspects to be addressed in the future. In particular, it will be important to complement the competitive advantage of Emilia Romagna in some traditionally strong sectors (principally heavy manufacturing sectors, such as ceramics and machinery) with the development of new sectors and new strategies within the old sectors.
The paper is structured as follows: Section 2 presents the main research hypotheses and data, section 3 outlines the empirical model and comments on the econometric evidence that emerges from the analysis, section 4 concludes.
2. The set of research hypotheses and the data
Though the role of factors external to the firm (e.g. cooperation with other firms, see Cassiman and Veugelers, 2002 for a seminal work) have recently been studied even in the ‘environmental innovation’ literature (Cainelli et al., 2012;; De Marchi, 2012), the understanding of such forces is still relatively in its first phases. Some recent key studies find that the internal resources devoted to R&D are not among the drivers of innovation adoption (Cainelli et al. 2012; Horbach and Oltra, 2010, Horbach, 2008; Borghesi et al., 2012).This makes the analysis of spatial and sector spillovers (possibly driven by cognitive proximity, Costantini et al., 2013) as a potentially omitted relevant covariate in innovation functions even more relevant.
Firms may in fact receive and exchange innovation inputs and knowledge at various geographical levels: regional, provincial, municipal, district. This favors ‘eco-innovation commons’, that is, royalty-free access to patented innovations or adoption of innovations new to firms and developed by (nearby) firms (Hall and Helmers, 2013), which can contribute to the diffusion of EIswithin a territory. To get a deeper understanding on this issue, it is therefore important to assess at the empirical level the boundaries within which agglomeration economies may operate. The latter highly dependon the institutional and economic features of a region. In this paper we exploit original information at our disposal on the firms’ location to test whether ‘within municipality’ or ‘outside municipality’ spillovers occurin the adoption of innovation, taking into account the fact that in Italy ‘district’ agglomeration are often within a municipal boundary. Building on the aforementioned reasoning and on the relevant literature, we define our first research hypothesis (H1) as follows.
H1 – The degree of closeness to other firms that adopt EIscan influence the diffusion of innovation through knowledge transfer and the presence of homogeneous institutional conditions in a given territory.
The relationship between EIs and their eventual economic effects is an important part of the possibility to integrate sustainability and competitiveness (Costantini and Mazzanti, 2013). On the one hand, environmental innovations are an important source of sustainability since they might reduce the environmental impact of firms; on the other hand, they can have a relevant economic impact, as it has been stressed since the early 90’s by the literature on the Porter hypothesis (van Leuwenen and Mohnen, 2013). Some specific studies have examined the relation between economic, innovation and environmental performances in different countries (see Cainelli et al., 2010 for a survey). In particular, Cainelli et al. (2011) have studied the
7
7
productivity effects of firms’ environmental strategies and green features in the case of the Italian manufacturing and service sectors; Earnhart and Lizal, (2010) have investigated the environmental-economic performances of the Czech firms, while Oberndorfer et al. (2013), have examined the extent to which stock market value incorporates a green firm’s features in the case of large stock market German firms. These research directions extend the literature on the determinants of EIs. What is possibly lacking in the current literature is the assessment of the economic effects of specific environmental innovations (Kemp and Pontoglio, 2011)6 instead of more general ‘green investments’ or ‘green actions’ on the part of the firms.7These comments lead to the second and third research hypotheses (H2 and H3), concerning the EI effects.
H2 – The adoption of product and process EIs by firms might enhance the competitiveness of productive organisations through value creation and efficiency achievements.
H3 - The higher the correlation of EIs with the other techno-organisational strategies of the firm, the higher their influence on the economic performance of the firm.
We test H2 and H3for two years: 20010 and2011, which represent the very first biennium after the deep recession of 2009 to understand whether EIs had impacts in two different years of the economic ‘crisis’8. Exploiting our data we use different indicators of firm’s productivity to enrich the evidence on the economic effects of environmental innovations and present some sensitivity tests.
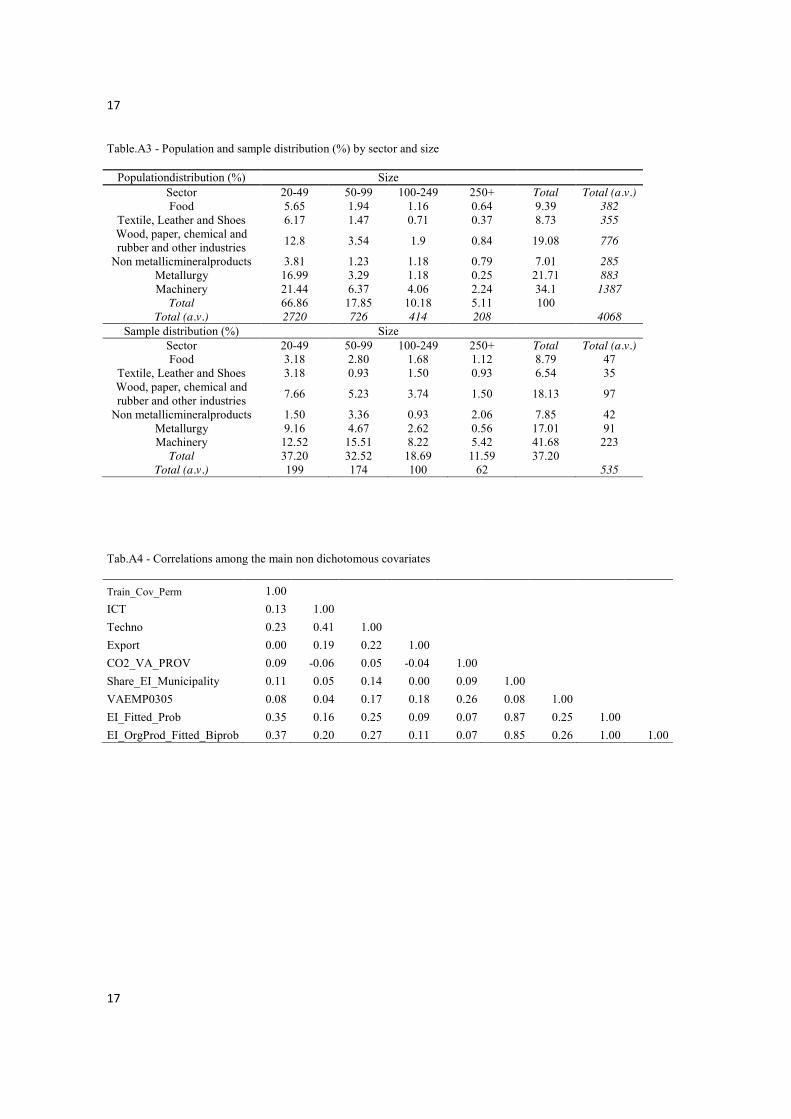
We test the hypotheses by using an original dataset constructed out of a firm-level survey on manufacturing firms with more than 20 employees (Huselid and Becker, 1996; Huselid, 1995) in the Emilia-Romagna Region(hereinafter ER) that is located in the North-East of Italy (Cainelli et al., 2012). This dataset can offer valuable insights on the extent to which EIs are really integrated within a firm’s strategies and on their impact on the firms’ economic performances. The sample is stratified by size, sector and geographical location of the firms and it is representative of the firm’s ‘population’ (see tab. A1 in Appendix). We focus on relatively larger firms given the complexity and richness of the data we aimed to gather (techno-organisational innovation, eco-innovations, international strategies, Human Resources Management). Interviews were carried out in 2009 by a professional company(SWG) specialised in polls and surveys. To allow for comparison with the EU CIS5, we covered 2006-2008. Eco-innovation questions specifically aim at replicating the CIS section on eco-innovation.9
Given the aim of this paper, we merge the Emilia-Romagna survey with balance account sheets that are available at the firm level for the period 2003-2011. The time span allows considerable flexibility in the use of account data. The latter are used both as EI covariate (using data before 6 The CIS usually does not allow to carry out such an assessment given its privacy statement. CIS micro data is either aggregated or anonymous. 7 Along somewhat different conceptual lines, Antonietti and Marzucchi (2013) analyse the extent to which the impacts on productivity determined by environmental strategies then generate diverse internationalisation activities. 8 In 2009 the GDP collapsed by about 6% in Italy, Germany and the region we analyse itself, which was largely dependent upon export performances. The years 2010 and 2011 are still years of economic crisis, but it was less severe than in 2009. What is more in 2010 the Italian economy experimented a brief recovery. 9While replicating most of the CIS questions, we also introduced some additional ones, which allows to get new information and test more hypotheses on the integration between EIs and other firm strategies. The full 12-page questionnaire is available upon request.

8
8
2006), in the first stage of analysis, and as the main dependent variable, in the second stage of analysis, to test the impact of EIs on productivityin 2010 and 2011.
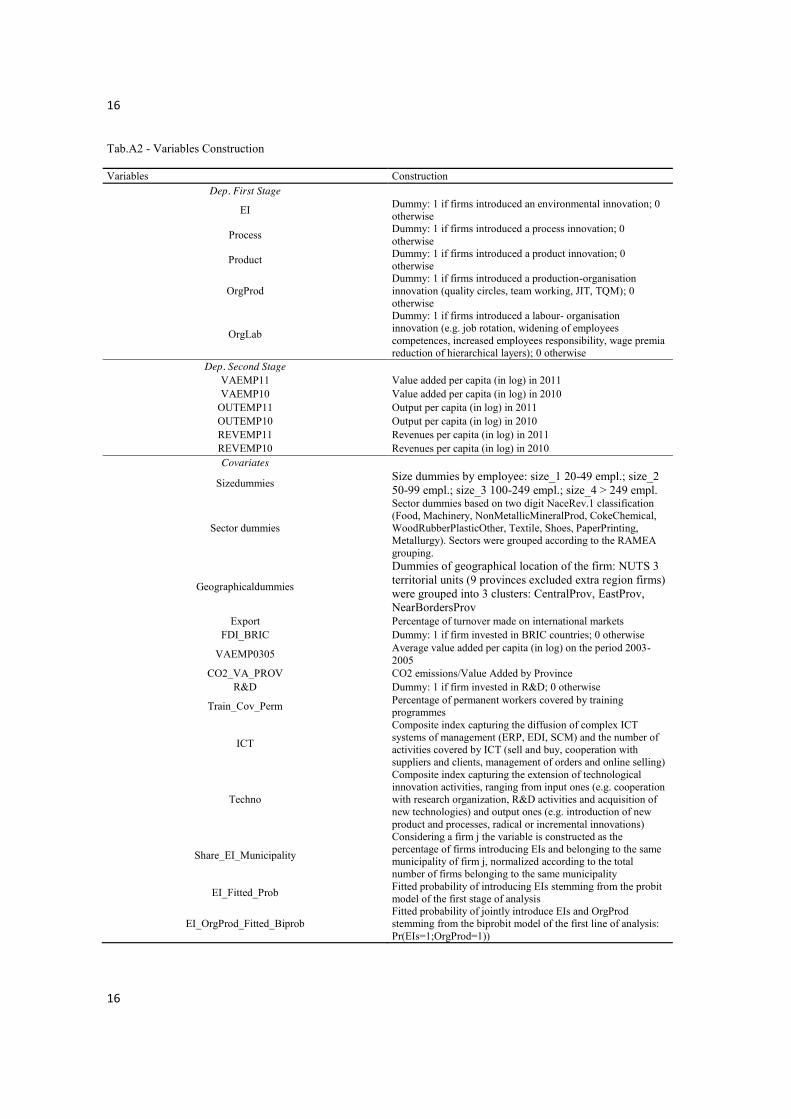
The rich set of information we have at our disposal allows us to use a relatively large block of controls in order to control for as much heterogeneity as possible in our estimation procedure. Indeed, firm level studies usually suffer from unobserved heterogeneity due to lack of data on managerial attitudes, which we are able to capture using variables that measure innovation in thetechnological, organizational and ICT spheres (see Tab.A2 and A3 in Appendix for a full description of the covariate and descriptive statistics). As emerges from the correlations reported in Tab.A4 in the Appendix, the main non-dichotomous regressors included in our estimations and described in the next section, do not seem to present severe multicollinearity problems.
3. The empirical evidence
We employ a two stage procedure to provide evidence regarding H1-H3 testable implications. First, we investigate the factors that are behind EIs through a full regional lens. The main addition we provide to the literature on the drivers of EIs is the inclusion of a 'spatially referred' term (Share_EI_Municipality) that absorbs omitted heterogeneity from a statistical point of view and gives information on the role of agglomeration as a force underlying the adoption of EIs in local industrial systems. In this first econometric stage, the factors behind EIs are studied both by taking innovations on a separate basis (probit models) and by verifying the relevance of correlation between various innovations (e.g. EIs and technological innovations) through the implementation of bivariate probits10. This scheme follows Hall et al.’s (2012) recent analysis of Italian firms. The first stage specification is as follows:
(1) EIi= c + a1(CONT)i + a2(Share_EI_Municipality)i + ei
where CONT is a set of covariates described in detail in sub-section 3.1 below, Share_EI_Municipality is the ‘spatially referred’ variable mentioned above, namely, the average adoption share of EI (bounded between 0 and 100) of firms located within the same municipality,and e is the error term.
The second part of our empirical exercise directly relies on the use in the second stage equation of the predicted values of the first stage regression, as well as on the use of accounting variables to construct dependents that proxy labour productivity. In this regard, we focus on several proxies of labour productivity: value added per employee (VAEMP), output per employee (OUTPUTEMP) and revenues per employee (REVEMP)11. All three productivity indicators are measured in 2010 and 2011. Since the covariates are measured on the time span 2006-2008, the diachronic nature of the second stage specification help us mitigating potential endogeneity problems due to simultaneity (Michie and Sheehan, 2003):
(2) PERFi,t= c + b1(CONT) i,t-1 + b2(EI_FITTED)i,t-1 + b3(INNO)i,t-1 + ui,t
10We also applied a multivariate probit as a robustness check and it gave the same results of the bivariate probits. 11As a sort of robustness check we also used a profitability measure given by EBITDA on sales as performance variable. No relations emerged with EIs. Results are not reported for space constraint, but they are available from the authors upon request.

9
9
where PERF indicates each performance indicator, CONT is again a set of controls and INNO is here a full set of innovation indexes usually related in the empirical literature to the economic performance of the firm (e.g. Hall et al. 2012), EI_FITTED is the fitted value of the probability of introducing environmental innovation given by the first stage. More specifically, EI_FITTED is the probability to jointly introduce EIs and other innovations (in Process, Product, Production Organisation and in Labour Organisation) since it comes from the multivariate probit estimation. Finally, u is the error term and the subscripts t and t-1 denote the time at which the variable is measured, showing the existence of a lag in the model between the covariates and the dependent variables.
3.1 The factors correlated to EI in a regional setting
Table 1 shows the results of the estimations performed at the first stage. Columns (2) to (5) report probit (column 1) and bi-probit (columns 2 to 5) estimations respectively12. As the table shows, the valued added per employee in the past (2003-2005) as well as the training of employees turn out to be statistically significant and positively correlated to EIs in all estimated regressions. These results, which are coherent with other findings in the literature (Cainelli et al., 2012), suggest that firms investing more in training activities and having more productive employees tend to be more prone to implement eco-innovation (whether alone or jointly with other forms of innovation). While the present estimations do not allow us to draw any conclusion on the direction of causality, it seems plausible to argue that training activities positively integrate with EIs and firms benefit from such integration.
Tab.1 – Results from first stage probit and biprobit Probit Biprobit EI EI and Proc EI and Prod EI and OrgLab EI and OrgProd dy/dx dy/dx dy/dx dy/dx dy/dx
For the case Pr(EI =1, Proc=1)
For the case Pr(EI =1, Prod=1)
For the case Pr(EI =1,
OrgLab=1)
For the case Pr(EI =1,
OrgProd=1) Size dummies yes yes yes yes yes Sector dummies yes yes yes yes yes BOMOREPR -0.049 -0.021 -0.026 -0.031 -0.028 (0.083) (0.047) (0.045) (0.062) (0.057) RARNFC 0.024 0.019 0.021 0.024 0.025 (0.078) (0.047) (0.045) (0.061) (0.056) Export 0.044 0.035 0.055 0.032 0.035 (0.055) (0.037) (0.036) (0.047) (0.044) CO2_05_VA_PROV -0.118 -0.077 -0.082 -0.098 -0.084 (0.089) (0.062) (0.060) (0.075) (0.070) Train_Cov_Perm 0.182*** 0.135*** 0.124*** 0.162*** 0.152*** (0.042) (0.028) (0.028) (0.035) (0.032) ICT 0.102 0.118** 0.099* 0.096 0.105 (0.078) (0.053) (0.052) (0.066) (0.064) RandD -0.001 0.031 0.045 0.001 -0.002 (0.042) (0.027) (0.028) (0.035) (0.032)
12Size and sector dummies are seldom significant. When sector dummies are significant (Food and Machinery) they have a negative sign, pointing to their less capacity to introduce EIs with respect to the benchmark sectors not included in the specification: Metallurgy, Textile, Shoes and PaperPrinting (the latter three are not included in the specification because they predict failure perfectly in the probit model).

10
10
FDI_BRIC 0.035 0.018 0.037 0.028 0.031 (0.059) (0.037) (0.036) (0.042) (0.041) VAEMP0305 0.274*** 0.195*** 0.170*** 0.232*** 0.220*** (0.066) (0.051) (0.049) (0.056) (0.055) Share_EI_Municipality 0.863*** 0.551*** 0.530*** 0.732*** 0.669*** (0.110) (0.062) (0.059) (0.071) (0.065) N 535 535 535 535 535 chi2(df) 100.294(18) 196.84 (36) 201.10(36) 493.25(36) 139.67(36) atrho \ 0.035 -0.112 0.274 0.353** (0.111) (0.115) (0.186) (0.140) Robust to heteroskedasticity standard errors in parentheses; * p< 0.10, ** p< 0.05, *** p< 0.01 Indeed, better trained workers are likely to be more productive given the change in their capabilities and absorptive capacity, due to training, that likely generatesa virtuous circles among EIs and economic performance13.As far as the past economic performance is concerned it is reasonable to hypothesize that ‘wealthier’ firms are more likely to introduce innovation, both EIs and other types, given they can invest more in R&D activities and they can also buy new technologies from external sources. A particularly interesting result, which supports H1, is that the share of firms performing EIs within each municipality (Share_EI_Municipality) is always statistically significant and positively related to the probability of adopting EIs. This suggests the existence of a positive spillover effect of EIs within the municipalities in ER: being located in a municipality with a higher share of EIs enhances the probability for each firm of adopting EIs14. The existence of EI spillover effects at the municipal level can probably be explained by the particularly large size of ER municipalities, which are about twice as large as those in Veneto and 4 times larger than the municipalities of Lombardy and Piedmont (the other main industrial regions in northern Italy). The relevance of the municipal context for EIs, moreover, is consistent with the findings of the literature on the Italian industrial districts which generally shows a long-standing trend towards the agglomeration of firms and specialisation within single municipalities (Brioschi et al., 2002). It is also coherent with the role of 'social capital' and civicness that Putnam (1993) highlights in his well-known seminal book. The Emilia-Romagna region is at the top of the civicness (p.97) and institutional performance ranking (p.84). This social capital glue (Cainelli et al., 2007) also creates the pre-condition for firms to engage in solid networking. 'Space' is relevant in many dimensions, not only as a 'distance' concept (see for example Boschma, 2005): the proximity of firms and agents in a context that offers reliability in terms of socio-institutional performances goes beyond the mere physical space element. Moreover, the relevance of the municipal context that emerge in the present analysis recalls the important role historically played by municipalities in the development of Italian capitalism, at least in the North (Putnam, 1993).15
13 The same argument could be applied for ICT, given the positive correlation with EIs adoption. However, in this case the significance level in tab.1is spurred by the correlation between ICT and Prod and Proc rather than between EIs and ICT. 14 The same does not apply to the share of firms adopting EIs across neighbouring municipalities that is not statistically significant in all estimated regressions. This seems to confirm that EI spillover effects in ER tend to occur within single municipalities rather than across them. The same results occurred when we tested spillover effects arising from both overall neighbouring firms and from neighbouring firms within the same sector. More than sector features, it is the location in the municipal area that supports EI diffusion. See Figure A1 in Appendix which sketches how the four ‘spillover-oriented’ variables are conceptually constructed. 15In Chapter 5 of his above-mentioned volume, Putnam stresses that 'although regional governments were established in 1970 [...] the regions themselves had far deeper historical roots. Over the period 1000-1500 a.C., an

11
11
3.2 The economic performance impact of eco innovations
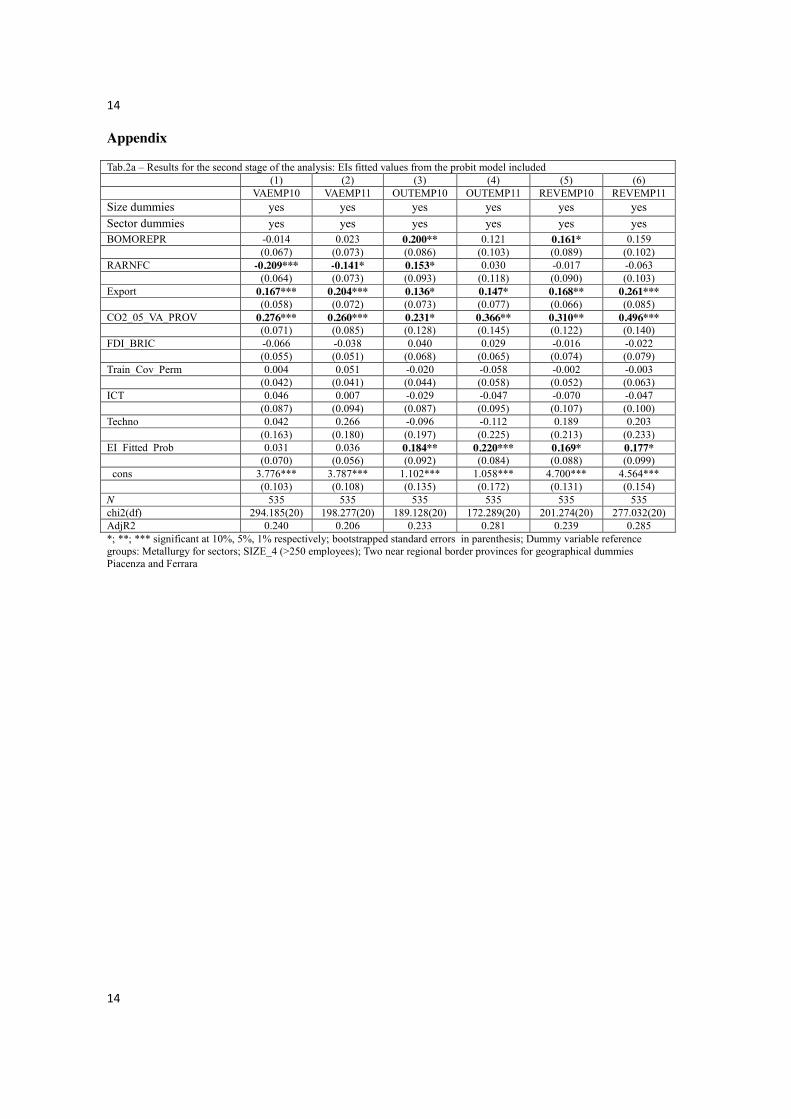
Tables 2a and 2b show the correlation of several covariates (including EIs) on three alternative performance indicators that refer to 2010 and 2011: (1) production volume, (2) valued added per employee and (3) revenues per employee. As the tables show, EIs fitted values, which are probabilities, from the first stage of the analysis turn out to be positively and significantly correlated to two of the three dependent variables (production volume and revenues per employee) for both the years. In particular, tab.2a supports H2 since it shows the significant and positive relation between EIs fitted value from the probit model (EI_Fitted_Prob) in the first stage and two out of three indicators of firm’s productivity. Moreover, also H3 is supported if we compare the results of tab.2b with those of tab.2a focusing the attention on the EIs fitted values in both the tables. In tab.2b the EIs fitted (EI_OrgProd_Fitted_Biprob) stems from the biprobit model in the first stage that relates EIs and changes in organization of production (OrgProd). Indeed, it is only for such a couple of innovation variables that a relation emerges, as shown by the significance level of the rho coefficient in tab.1; that is, they are likely to be jointly adopted within the firms16. As it is possible to appreciate the coefficients associated to EI_OrgProd_Fitted_Biprob(tab.2b), the joint probability to adopt both EIs and change in production organization, are almost always greater than those associated to EI_Fitted_Prob (tab.2a). Such an evidence support H3 since it tells us that when EIs is integrated with complementary organizational changes the ‘impact’ on the economic performance of the firm, when significant, is larger than in the case of simple EIs adoption, proxied by EI_Fitted_Prob.
Beyond eco- and organizational-innovation, other relevant factors that emerge from the analysis are the firms' export level, their emission intensity, their geographical location and the sector they belong to. As for the export variable, its positive sign confirms the importance of having access to foreign markets for ER firms, particularly during the years 2010 and 2011 in which the internal demand tended to collapse due to the on-going economic crisis, while the foreign aggregate demand tend to increase. This result is consistent with the findings of previous studies in the literature that also emphasize the crucial role played by exports as a driver of firms' economic performance in this region (Antonioli et al., 2010).
CO2 emission intensity in 2005 is also positively and significantly related to all the dependent variables taken into account. This is likely to reflect the fact that the largest and best performing firms were also generally more polluting in 2005, namely, before the European Emission Trading Scheme (EU-ETS) on GHG emissions came into force. While the actual effectiveness of the EU- unprecedented form of self-government emerged in the towns of Northern Italy: the 'commune' (that is to say, the municipality) that represented a new form of political and social organisation of life, even in economic terms. In the words of Putnam (1993, p.124), 'by the twelfth century communes had been established in Florence, Venice, Bologna, Genua, Milan and virtually all the other major towns of Northern and central Italy, rooted historically in these primordial social contracts'. As communal life evolved, craftsmen and tradesmen were of key importance for the development of those areas. Mostly relevant 'to provid[ing] self-help and mutual assistance of social as well as [to] strictly occupational purposes' (p.125). 16 We showthe results of the joint probability to introduce both EIs and OrgProd (Pr(EIs=1; OrgProd=1)), however, as robustness checks we also run our regressions including the conditional probability of introducing EIs given OrgProd(Pr(EIs=1 | OrgProd=1)) and the marginal probability of introducing EIs (Pr(EIs=1); marginal success probability for equation 1). The results holds true for alle the types of EIs fitted we use, but they are not reported for space constraint. They are available from the authors upon request.
12
12
ETS and its impact on firms' performance is currently the object of debate in literature (Cainelli et al., 2013), it seems plausible to claim that the largest (and therefore also most polluting) firms in 2005 were still better performing than the rest of the market in 2010 from an economic viewpoint, whether still relatively more polluting or not.
Differently from the estimation results in stage 1 (see previous section 3.1), the set of ‘province dummy’ proves statistically significant for some dependent variables in stage 2. This is not surprising since most productive firms tend to concentrate in Emilia (BOMOREPR accounting for about 72% of all firms in our sample), while the area of Romagna (RARNFC) has relatively little/no industries, therefore also little Value Added (VA), which can explain its worse performance in terms of VA per employee.
Finally, some sectors17 (particularly food, coke and chemical)show a strongly positive correlation with the performance indicators. While the benchmark sector (metallurgy) was severely affected by the crisis, in fact, these sectors showed a significantly better trend, as expected, due to the sustained inner and/or foreign demand for their products (food and energy, respectively).
4. Conclusions
In a regional setting that is characterised by historically high innovation intensity and relevant local environmental impacts, we study the role of agglomeration economies, that is knowledge/innovation spillovers, as a potential relevant force behind the adoption of environmental innovations. The increasing literature on EIs has devoted little (if any)attention to the possible effects of agglomeration economies. The latter, however, are crucial, especially in areas where the richness of districts and networking influences the overall performance of firms. We analyse the role of EIs in manufacturing firms through a survey-based dataset that covers various high performance work practices and innovative strategies. Original geographical information on firms’ location and data regarding economic and environmental performances allows us to verify two main interconnected and testable research questions. First, whether ‘local external conditions’, primarily geographical agglomeration, influence EI diffusion. Second, and consequentially, whether the diffusion of EIs exert any impact on the firm’s productivity.
As to the first question, we find that local conditions do play a substantial role, namely firms that are located in the same municipality of more eco innovative firms tend to adopt eco innovations with higher probability. This highlights the relevance of agglomeration economies and local institutional conditions in providing concrete (innovative) contents to the green economy paradigm. EI adoptions correlate to internal firm features (e.g. training, sector structural features) and to ‘external’ factors, among which we emphasise for the first time the role of specific geographical elements. Firms receive support for EI adoption from being located in a defined municipality. This is coherent with the historical importance of ‘communes’ in the economic development of northern Italy (Putnam, 1993), a backbone of the ‘district’-based model of capitalism. Nevertheless, municipal level spillovers tend to prevail over other geographical
17 The results for sectors are not reported in the tables for scope constraint, but they are available from the authors upon request.

13
13
factors as well as over sector belonging. It is mainly within the municipal area that EI adoption spreads.
EIs tend to be adopted in correlation to some other of the firm’s techno-organisational strategies. Among those, innovations related to the organisation of production (team work, quality circle, etc..) appear the most relevant factor in this strategic ‘green’ integration of practices. This outcome reinforces the possibility of a potential integration of EIs within a firm’s production processes - when EIs are not merely end of pipe in nature - which recent works have highlighted (Antonioli et al. 2013).
As to the second question, we observe that the productivity performances of firms tend to be higher for enterprises that jointly adopt EIs and organisational innovations: the greening of the economy passes through a full reorganisation of the productive process. EIs are not an isolated strategy even when firms do not face strict environmental policy constraints as in the Italian context. Innovations that occur in small and medium-sized firms are an important part of the story for the success or failure of the new green economic paradigm. This result is even more relevant in the Italian case in which the opportunities offered by green technology invention and adoption might contribute to reverse the current critical stagnation of labour productivity.
Future research might proceed along these lines by further extending the analysis of spatial factors, as well as by investigating the EI effects on other social aims of the firm, including among others employment and environmental performances.
14
14
Appendix
Tab.2a – Results for the second stage of the analysis: EIs fitted values from the probit model included (1) (2) (3) (4) (5) (6) VAEMP10 VAEMP11 OUTEMP10 OUTEMP11 REVEMP10 REVEMP11 Size dummies yes yes yes yes yes yes Sector dummies yes yes yes yes yes yes BOMOREPR -0.014 0.023 0.200** 0.121 0.161* 0.159 (0.067) (0.073) (0.086) (0.103) (0.089) (0.102) RARNFC -0.209*** -0.141* 0.153* 0.030 -0.017 -0.063 (0.064) (0.073) (0.093) (0.118) (0.090) (0.103) Export 0.167*** 0.204*** 0.136* 0.147* 0.168** 0.261*** (0.058) (0.072) (0.073) (0.077) (0.066) (0.085) CO2_05_VA_PROV 0.276*** 0.260*** 0.231* 0.366** 0.310** 0.496*** (0.071) (0.085) (0.128) (0.145) (0.122) (0.140) FDI_BRIC -0.066 -0.038 0.040 0.029 -0.016 -0.022 (0.055) (0.051) (0.068) (0.065) (0.074) (0.079) Train_Cov_Perm 0.004 0.051 -0.020 -0.058 -0.002 -0.003 (0.042) (0.041) (0.044) (0.058) (0.052) (0.063) ICT 0.046 0.007 -0.029 -0.047 -0.070 -0.047 (0.087) (0.094) (0.087) (0.095) (0.107) (0.100) Techno 0.042 0.266 -0.096 -0.112 0.189 0.203 (0.163) (0.180) (0.197) (0.225) (0.213) (0.233) EI_Fitted_Prob 0.031 0.036 0.184** 0.220*** 0.169* 0.177* (0.070) (0.056) (0.092) (0.084) (0.088) (0.099) _cons 3.776*** 3.787*** 1.102*** 1.058*** 4.700*** 4.564*** (0.103) (0.108) (0.135) (0.172) (0.131) (0.154) N 535 535 535 535 535 535 chi2(df) 294.185(20) 198.277(20) 189.128(20) 172.289(20) 201.274(20) 277.032(20) AdjR2 0.240 0.206 0.233 0.281 0.239 0.285 *; **; *** significant at 10%, 5%, 1% respectively; bootstrapped standard errors in parenthesis; Dummy variable reference groups: Metallurgy for sectors; SIZE_4 (>250 employees); Two near regional border provinces for geographical dummies Piacenza and Ferrara

15
15
Tab.2b – Results for the second stage of the analysis: EIs fitted values from the biprobi model included (1) (2) (3) (4) (5) (6) VAEMP10 VAEMP11 OUTEMP10 OUTEMP11 REVEMP10 REVEMP11 Size dummies yes yes yes yes yes yes Sector dummies yes yes yes yes yes yes BOMOREPR -0.014 0.024 0.202* 0.122 0.162** 0.160** (0.074) (0.073) (0.106) (0.096) (0.077) (0.072) RARNFC -0.210*** -0.141** 0.154 0.030 -0.016 -0.062 (0.070) (0.067) (0.113) (0.090) (0.088) (0.086) Export 0.167*** 0.204*** 0.135** 0.146* 0.168** 0.261*** (0.065) (0.061) (0.061) (0.080) (0.075) (0.092) CO2_05_VA_PROV 0.276*** 0.261*** 0.232* 0.367*** 0.311*** 0.496*** (0.079) (0.085) (0.138) (0.133) (0.107) (0.129) FDI_BRIC -0.066 -0.038 0.038 0.028 -0.017 -0.023 (0.053) (0.043) (0.079) (0.066) (0.076) (0.071) Train_Cov_Perm 0.004 0.050 -0.024 -0.062 -0.005 -0.006 (0.044) (0.049) (0.052) (0.053) (0.058) (0.064) ICT 0.045 0.006 -0.036 -0.053 -0.076 -0.053 (0.079) (0.103) (0.092) (0.080) (0.096) (0.116) Techno 0.042 0.266 -0.098 -0.112 0.188 0.203 (0.153) (0.178) (0.222) (0.241) (0.201) (0.263) EI_OrgProd_Fitted_Biprob 0.032 0.042 0.217** 0.251*** 0.196* 0.203* (0.085) (0.075) (0.095) (0.094) (0.109) (0.111) _cons 3.777*** 3.787*** 1.101*** 1.058*** 4.700*** 4.564*** (0.110) (0.105) (0.139) (0.146) (0.126) (0.136) N 535 535 535 535 535 535 chi2 276.917(20) 211.182(20) 187.431(20) 256.902(20) 302.216(20) 334.761(20) r2_a 0.240 0.206 0.234 0.281 0.240 0.286 *; **; *** significant at 10%, 5%, 1% respectively; bootstrapped standard errors in parenthesis; Dummy variable reference groups: Metallurgy for sectors; SIZE_4 (>250 employees); Two near regional border provinces for geographical dummies Piacenza and Ferrara Tab.A1- Descriptive statistics Variable Obs Mean Std. Dev. Min Max
Dep. First Stage EI 535 0.19 0.39 0 1
Process 535 0.69 0.47 0 1 Product 535 0.70 0.46 0 1 OrgProd 535 0.81 0.39 0 1 OrgLab 535 0.95 0.22 0 1
Dep. Second Stage* VAEMP11 535 4.00 0.44 1.04 5.65 VAEMP10 535 4.01 0.40 2.19 5.36
OUTPUTEMP11 535 1.52 0.51 -2.16 4.36 OUTPUTEMP10 535 1.52 0.47 0.43 4.24
REVEMP11 535 5.26 0.60 1.74 7.62 REVEMP10 535 5.30 0.49 3.43 7.37 Covariates Sizedummies 535 \ \ 0 1
Sector Dummies 535 \ \ 0 1 Geographicaldummies 535 \ \ 0 1
Export 535 0.33 0.31 0 1 FDI_BRIC 535 0.09 0.28 0 1
VAEMP0305 535 4.03 0.26 2.98 5.39 CO2_VA_PROV 535 0.31 0.23 0.07 1
R&D 535 0.79 0.40 0 1 Train_Cov_Perm 535 0.38 0.37 0 1
ICT 535 0.48 0.21 0 1 Techno 535 0.22 0.11 0 0.59
Share_EI_Municipality 535 0.20 0.22 0 1 EI_Fitted_Prob 535 0.11 0.17 0 0.91
EI_OrgProd_Fitted_Biprob 535 0.18 0.23 0 0.97 * For the accounting variables the missing values have been replaced by interpolated values
16
16
Tab.A2 - Variables Construction Variables Construction
Dep. First Stage EI Dummy: 1 if firms introduced an environmental innovation; 0
otherwise
Process Dummy: 1 if firms introduced a process innovation; 0 otherwise
Product Dummy: 1 if firms introduced a product innovation; 0 otherwise
OrgProd Dummy: 1 if firms introduced a production-organisation innovation (quality circles, team working, JIT, TQM); 0 otherwise
OrgLab
Dummy: 1 if firms introduced a labour- organisation innovation (e.g. job rotation, widening of employees competences, increased employees responsibility, wage premia reduction of hierarchical layers); 0 otherwise
Dep. Second Stage VAEMP11 Value added per capita (in log) in 2011 VAEMP10 Value added per capita (in log) in 2010
OUTEMP11 Output per capita (in log) in 2011 OUTEMP10 Output per capita (in log) in 2010 REVEMP11 Revenues per capita (in log) in 2011 REVEMP10 Revenues per capita (in log) in 2010 Covariates
Sizedummies Size dummies by employee: size_1 20-49 empl.; size_2 50-99 empl.; size_3 100-249 empl.; size_4 > 249 empl.
Sector dummies
Sector dummies based on two digit NaceRev.1 classification (Food, Machinery, NonMetallicMineralProd, CokeChemical, WoodRubberPlasticOther, Textile, Shoes, PaperPrinting, Metallurgy). Sectors were grouped according to the RAMEA grouping.
Geographicaldummies
Dummies of geographical location of the firm: NUTS 3 territorial units (9 provinces excluded extra region firms) were grouped into 3 clusters: CentralProv, EastProv, NearBordersProv
Export Percentage of turnover made on international markets FDI_BRIC Dummy: 1 if firm invested in BRIC countries; 0 otherwise
VAEMP0305 Average value added per capita (in log) on the period 2003-2005
CO2_VA_PROV CO2 emissions/Value Added by Province R&D Dummy: 1 if firm invested in R&D; 0 otherwise
Train_Cov_Perm Percentage of permanent workers covered by training programmes
ICT
Composite index capturing the diffusion of complex ICT systems of management (ERP, EDI, SCM) and the number of activities covered by ICT (sell and buy, cooperation with suppliers and clients, management of orders and online selling)
Techno
Composite index capturing the extension of technological innovation activities, ranging from input ones (e.g. cooperation with research organization, R&D activities and acquisition of new technologies) and output ones (e.g. introduction of new product and processes, radical or incremental innovations)
Share_EI_Municipality
Considering a firm j the variable is constructed as the percentage of firms introducing EIs and belonging to the same municipality of firm j, normalized according to the total number of firms belonging to the same municipality
EI_Fitted_Prob Fitted probability of introducing EIs stemming from the probit model of the first stage of analysis
EI_OrgProd_Fitted_Biprob Fitted probability of jointly introduce EIs and OrgProd stemming from the biprobit model of the first line of analysis: Pr(EIs=1;OrgProd=1))
17
17
Table.A3 - Population and sample distribution (%) by sector and size
Populationdistribution (%) Size Sector 20-49 50-99 100-249 250+ Total Total (a.v.) Food 5.65 1.94 1.16 0.64 9.39 382
Textile, Leather and Shoes 6.17 1.47 0.71 0.37 8.73 355 Wood, paper, chemical and rubber and other industries 12.8 3.54 1.9 0.84 19.08 776
Non metallicmineralproducts 3.81 1.23 1.18 0.79 7.01 285 Metallurgy 16.99 3.29 1.18 0.25 21.71 883 Machinery 21.44 6.37 4.06 2.24 34.1 1387
Total 66.86 17.85 10.18 5.11 100 Total (a.v.) 2720 726 414 208 4068 Sample distribution (%) Size Sector 20-49 50-99 100-249 250+ Total Total (a.v.)
Food 3.18 2.80 1.68 1.12 8.79 47 Textile, Leather and Shoes 3.18 0.93 1.50 0.93 6.54 35 Wood, paper, chemical and rubber and other industries 7.66 5.23 3.74 1.50 18.13 97
Non metallicmineralproducts 1.50 3.36 0.93 2.06 7.85 42 Metallurgy 9.16 4.67 2.62 0.56 17.01 91 Machinery 12.52 15.51 8.22 5.42 41.68 223
Total 37.20 32.52 18.69 11.59 37.20 Total (a.v.) 199 174 100 62 535 Tab.A4 - Correlations among the main non dichotomous covariates Train_Cov_Perm 1.00
ICT 0.13 1.00 Techno 0.23 0.41 1.00
Export 0.00 0.19 0.22 1.00 CO2_VA_PROV 0.09 -0.06 0.05 -0.04 1.00
Share_EI_Municipality 0.11 0.05 0.14 0.00 0.09 1.00 VAEMP0305 0.08 0.04 0.17 0.18 0.26 0.08 1.00
EI_Fitted_Prob 0.35 0.16 0.25 0.09 0.07 0.87 0.25 1.00 EI_OrgProd_Fitted_Biprob 0.37 0.20 0.27 0.11 0.07 0.85 0.26 1.00 1.00

18
18
Figure A1 – Four shares of Eco-innovation diffusion: contiguous municipality all sectors (left-up), contiguous municipality all same sector (left-down), same municipality all sectors (right-up), contiguous municipality same sector (right-down)
Note: Different shares of EIs diffusion are calculated in 4 ways: 1 contiguous municipality all sectors (left-up), 2 contiguous municipality same sector (left-down), 3 same municipality all sectors (right-up), 4 same municipality same sector (right-down)

19
19
References
Ambec, S. Barla, P., 2006, Can Environmental Regulations Be Good for Business? An
Assessment of the Porter Hypothesis, Energy Studies Review,14(2), pp. 42–62.
Ambec, S., Cohen, M., Elgie, S., Lanoie, P., 2010, Chair’s paper for the conference ‘Porter
hypothesis at 20 : can environmental regulation enhance innovation and competitiveness?,
Montreal, Canada, 27-28 June, available at www.sustainableprosperity.ca
Ambec, S., Lanoie, P., 2008, Does it Pay to be Green? A Systematic Overview, Academy of
Management Perspectives, vol. 22, pp 45-62.
Antonietti R: Marzucchi A. (2013), From green investment strategies to internationalisation,
mimeo.
Antonioli D. Mancinelli S. Mazzanti M. (2013), Are Environmental Innovations embedded
within organizational change? Research Policy, i-first.
Antonioli D. Mazzanti M. Pini P. (2010). Productivity, innovation strategies and industrial
relations in SMEs. Empirical evidence for a local production system in northern Italy,
International Review of Applied Economics, 24(4), pages 453-482.
Beaudry C. Breschi S. (2003), Are firms in clusters really more innovative?, Economics
ofInnovation and new technology, 12, 4, 325-41.
Benneworth, P. Coenen L. Truffer B. (2012). Toward a spatial perspective on sustainability
transitions, Research Policy, vol. 41(6), 968-979.
Borghesi S. Cainelli G. Mazzanti M. (2012), Brown sunsets and green dawns in the industrial
sector FEEM nota di lavoro, FEEM, Milan (paper presented at the SIE conference 2011,
Roma Tre, October).
Boschma R.A. Lambooy J.G. (2002), Knowledge, market structure, and economic coordination,
Growth and Change, 33, 3, 291-311.
Boschma, R. (2005). Proximity and innovation: a critical assessment. Regional studies 39(1), 61-
74
Brioschi F. Brioschi M.S. Cainelli G. (2002), From the Industrial District to the District Group.
An Insight Into the Evolution of Local Capitalism in Italy, Regional Studies, 36, 9, 1037-
1052.
Cainelli G. (2008), Spatial Agglomeration, Technological Innovations, and Firm Productivity:
Evidence from Italian Industrial Districts, Growth and Change, 39, 3.
Cainelli G. Mazzanti M. 2013, Environmental Innovations in services, Research Policy, forth.
Cainelli G. Mazzanti M. Zoboli R. 2013, Environmental Performance and Firm Growth in
Manufacturing Sectors. Empirical evidence on structural factors and dynamic

20
20
relationships, Environmental Economics and Policy Studies, forthcoming.
Cainelli G. Zoboli R. (2004), The Evolution of Industrial Districts. Changing Governance,
Innovation and Internalisation of Local Capitalism in Italy. Contributions to Economics.,
PhysicaVerlag, Heidelberg
Cainelli G., Iacobucci D. (2007), Agglomeration, Technology and Business Groups, Edwar Elgar
Publishing, Cheltenham.
Cainelli G., M. Mancinelli S. Mazzanti M. (2007), Social Capital and innovation dynamics in
district based local systems,Journal of Socio-Economics 36, 6, 932-48.
Cainelli G., Mazzanti M., Zoboli R., 2011, Environmentally-oriented innovative strategies and
firm performance in services. Micro-evidence from Italy,International Review of Applied
Economics, January.
Cainelli, G, Mazzanti, M. and Montresor S. (2012) ‘Environmental Innovations, Local Networks
and Internazionalitation’, Industry and innovation, 19: 697-734.
Cassiman, B. and Veugelers R. 2002, R&D cooperation and spillovers: Some empirical evidence
from Belgium. The American Economic Review 92 (4), 1169–1184.
Coenen L. Truffer B. (2012). Environmental Innovation and Sustainability Transitions in
Regional Studies, Regional Studies , vol. 46(1), pages 1-21, November.
Costantini V. Mazzanti M. 2012, On the green side of trade competitiveness? Research Policy,
January.
Costantini V. Mazzanti M. 2013, The Dynamics of Economic and Environmental Systems.
Innovation, Policy and Competitiveness, Springer.
Costantini V. Mazzanti M. Montini A. (2013), Environmental Performance, Innovation and
Regional Spillovers,Ecological Economics, in press
Costantini V., Mazzanti M. (2012), On the green and Innovative side of trade competitiveness?
The Impact of Environmental Policy and Innovation on EU Exports, Research Policy, 41:
132-153.
De Marchi V. (2012), Environmental innovation and R&D cooperation: Empirical evidence from
Spanish manufacturing firms, Research Policy, 41(3), 614–623
De Marchi V., Di Maria E., Micelli S., (2013) Environmental Strategies, Upgrading and
Competitive Advantage in Global Value Chains, Business Strategy & the Environment,
22(1):62-72.
De Marchi V., Grandinetti R. (2013) Knowledge strategies for environmental innovations: the
case of Italian manufacturing firms, Journal of Knowledge Management, 17(4)
Earnhart D. Lizal L. (2010), Effect of Corporate Economic Performance on Firm-Level

21
21
Environmental Performance in a Transition Economy, Environmental & Resource
Economics, 46, 303-29.
Gilli M. Mazzanti M. Nicolli F. 2013, Sustainability, Environmental Innovations and
competitiveness in evolutionary perspectives. Evidence from the EU, Journal of Socio
Economics, forthcoming.
Hall B. Helmers C. (2013), Innovation in clean/green technology: Can patent commons help?.
Journal of Environmental Economics and Management, forthcoming
Hall B. Mairesse J. Lotti F. (2012), Evidence on the impact of R&D and ICT investment on
innovation and productivity in Italian firms, Economics of Innovation and New
Technology, also NBER Working Paper No. 18053 (November 2011).
Horbach J. (2008), Determinants of environmental innovation—New evidence from German
panel data sources,Research Policy, 37, 1, 163-173
Horbach J. (2013), Do Eco innovations need specific regional characteristics? An econometric
analysis for Germany, Review of Regional Research, Online First, doi 10.1007/s10037-
013-0079-4.
Horbach J. and Oltra V. (2010), Determinants and Specificities of Eco-innovations – An
Econometric Analysis for the French and German Industry based on the Community
Innovation Survey, paper presented at the world conference of environmental economists,
Montreal, June- Research July 2010.
Horbach J. Rennings K. (2012), Environmental Innovation and Employment Dynamics in
Different Technology Fields - An Analysis Based on the German Community Innovation
Survey 2009, ZEW Discussion Paper No. 12-006, Mannheim.
Horbach, J., Rammer, C., &Rennings, K. (2012),Determinants of eco-innovations by type of
environmental impact—The role of regulatory push/pull, technology push and market pull.
Ecological Economics, 78: 112-122.
Huselid, M. (1995). The Impact of Human Resource management Practices on Turnover,
Productivity, and Corporate Financial performance,Academy of Management Journal, 38
(3), pp.635-672.
Huselid, M., & Becker, B. (1996). Methodological issues in Cross-Sectional and Panel
Estimatesof the Human Resource-Firm Performance Link,Industrial Relations, 35 (3),
pp.400-422.
Iammarino S. McCann P. (2006), The structure and evolution of industrial clusters: transactions,
technology and knowledge spillovers, Research Policy, 35, 7, 1018-36.
Jaffe, A., Peterson, S.R., Portney, P.R., Stavins, R. (1995), “Environmental Regulation and the
22
22
Competitiveness of US Manufacturing: What does the Evidence tell us?” Journal
ofEconomic Literature, 33, 132-63.
Kemp, R. (2000), Technology and Environmental Policy—Innovation effects of past policies and
suggestions for improvement, paper for OECD workshop on Innovation and Environment,
19 June 2000, Paris.
Kemp, R. (2010) Eco-innovation: definition, measurement and open research issues,
EconomiaPolitica, 3: 397–420.
Kemp, R., and S. Pontoglio (2011) The innovation effects of environmental policy instruments—
A typical case of the blind men and the elephant?, Ecological Economics, 72: 28-36
Marin G., Mazzanti M., 2013, The evolution of environmental and labour productivity dynamics,
Journal of Evolutionary Economics, April.
Mazzanti M. Zoboli R., (2009), Embedding Environmental Innovations in Local Production
Systems: SME strategies, networking and industrial relations, International Review of
Applied Economics, vol.23, n.2, 169-195.
Mazzanti M., Montini A. (2010), Embedding the drivers of emission efficiency at regional level
— Analyses of NAMEA data,Ecological Economics, 69, 2457-2467.
Michie, J. & Sheehan, M. (2003), 'Labour Market Deregulation, 'Flexibility' and Innovation',
Cambridge Journal of Economics27(1), 123-143.
Oberndorfer U. Schmidt P. Wagner M. Ziegler A. (2013), Does the stock market value the
inclusion in a sustainability stock index? An event study analysis for German firms,
Journal of Environmental Economics and Management, forth.
Putnam, R. (1993), Making Democracy Work: Civic Traditions in Modern Italy. Princeton:
Princeton University Press.
Van Leeuwen, G. Mohnen, P. (2013) Revisiting the porter hypothesis: An empirical analysis of
green innovation for the Netherlands, UNU-MERIT Working Paper Series 002, United
Nations University, Maastricht Economic and social Research and training centre on
Innovation and Technology.
Veugelers R. (2012), Which policy instruments to induce clean innovating?
Research Policy, 41, 1770-1778