Click to edit Master title style What are you worth? Vince Hines, Managing Director.

Are You Paid to Do What You Are Worth?
The State of Pay for Information Security Jobs and Skills
Foote Partners, LLCFoote Research Group
www.footepartners.com
Foote Partners, LLCFoote Research Group
www.footepartners.com
David Foote([email protected])

2
Tonight’s Agenda
Page
3 Summary findings
7 IT Skills & Certifications Pay Trends (Q1 2008 data) • Research demographics• General pay trending (2000 – 2008)• Q1 2008 Noncertified and certified skills pay data
29 IT Salaries (Q1 2008)
32 2008 IT Spending Trends (driving skills acquisition)
36 Other Indicators: Demand for IT Skills & Jobs in 2008• Top technologies and strategies; business and technology priorities; management
priorities
42 IT Security Trends (Foote Partners analysis)• Pay drivers• Challenges• Current and emerging skills• Strategies
56 Speaker information

3
Summary: FP’s Q1 2008 In-Demand IT Skills
Customer-facing SkillsApplications Development skills: --SAP modules: FI, CO, MM, CRM, ERP, MDM,
NetWeaver BI/BW, HCM, PP, IM, PS SD, WM. --SAP skills: NetWeaver applications server, SAP
ASAP, BI Accelerator--Ajax; Ruby/Ruby On Rails;.NET, PHP; SAS;
SQL Windows, XML--Oracle Enterprise Apps; Oracle/Business
Objects, Oracle Developer AD
Infrastructure Skills
Virtualization (EMC, IBM certs and skills)
Storage/SAN mgt (EMC, Brocade, IBM, SNIA certs)
Information/Network Security: CISM, CISSP, Cisco, Planet3 (wireless), GIAC/SANS (GSE, intrusion, audit); Check Point master certs
Networking skills:--Hybrid network management--Network security management --Cisco--VoIP/IP telephony (Cisco)--Unified communications Source: 2008 IT Workforce Research Series, Foote Partners LLC
RAD/Extreme Programming
Database skills:--Oracle DB/ERP--Microsoft: SQL Server, Commerce Server,
Identity Integration Server
Help desk/tech supportUnified messaging
Wireless network mgt skills (Planet3, Cisco, SANS/GIAC certs)
Systems: Citrix; Windows Server
Web services/SOA experience (IBM SOA, WebSphere Process Server certs)
DW/BI: Oracle, Teradata SQL, Teradata master cert,
Remote and mobile user support
Database/data management

4
Summary: FP’s Q1 2008 In-Demand IT Skills
Enabling Skills
Business intelligence
Architecture experience (IT Certified Architect, Citrix, EMC, SNIA certs)
Project management experience (PMP, Microsoft PM certs)
Business process design and management
Source: 2008 IT Workforce Research Series, Foote Partners LLC

5
Business Skills
• Project/program management (lead, plan, budget, schedule)
• Strategist/Internal consultant• Internal relationship management• IT finance• Vendor management• IT HR• Business analysis
Technology Skills
• SAP (prolonged skills shortage) • Applications development (mashups,
composite apps) • Networking/Hybrid networks• Security (esp. embedded)• IP telephony/unified communications • Mobile/remote user support(VPNs)• Virtualization• SOA/Web services• SaaS
• Database management• Metadata management/MDM/CDI• Architecture• Storage/SAN• Help desk/User support• Web 2.0
Other
• Process Mgt/Governance (ex: ITIL)• IT change management• Data mining/DW/BI• ERP
Source: 2008 IT Workforce Research Series, Foote Partners LLC
Summary: Hot IT Skills - Next 2 years

6
Non-Tech Skills Most Highly Prized
• Business analysis; enabling analytical skills (business technology)
• Functional area knowledge; specific business process/operations knowledge
• Industry-specific experience• Collaboration, team building• Project management, esp. global• Strategic thinking, planning • Problem solving• Oral and written communications• Ability to lead and motivate• Negotiation skills• Ethics and tolerance
…and multi-lingual, well-traveled, adaptable, and a great attitude doesn’t hurt either.

7
IT Skills & Certifications Pay Trends
Q1 2008 Update
To see a complete list of skills surveyed:
http://www.footepartners.com/htscpi_latest.htm

8
• 78,000 IT workers tracked continuously for their salaries, IT skills pay, attitudes, and management practices. 82 cities in N.America, 1,900 employers
• 30+ private sector industries; federal/state/local governments, educational and not-for-profit institutions.
• Demographics of the participating organizations:• 15% of participating organizations have $3 billion+ in sales/$15+ billion in total assets
• 27% of participating organizations earn more than $1 billion in annual revenues or more than $3 billion in total assets
• 45% of participating organizations have $500+ million in sales/$1+ billion in total assets/$500+ million in premiums/$500+ million operating budget (government, educational, not-for-profit)
• 55% of participating organizations fall in the SMB (small-to-medium sized business) segment, generally defined as organization under $500 million in sales.
• [Public sector] 5% have operating budgets of $500 million or more, 4% with operating budgets $100 million to less than $500million (nonprofit/government/educational sectors)
1Q 2008 Foote Partners Compensation Research Domain

9
1Q 2008 Research Engine Reach
Canadian Cities
Tier 1 Cities (U.S.)Atlanta, GABoston, MAChicago, ILDallas, TXDetroit, MI
Houston, TXLos Angeles/Orange Cty, CAMiami, FLMinneapolis, MNNew Jersey/Northern
New York, NY Philadelphia/So. NJPhoenix, AZSan Diego, CASan Francisco, CA
San Jose, CASeattle, WASt. Louis, MOWashington, DCWestchester County, NY/Lower
Fairfield Cty, CT
Tier 2 Cities (U.S.)
Greenville/Spartanburg/
Oakland/Walnut Creek/
Calgary, ALTAEdmonton, ALTAHalifax, NSHamilton, ONTKitchner, ONT
London, ONTMississauga, ONTMontreal, QUEOshawa, ONTOttawa, ONT
Greensboro/WinstonSalem, NC
Anderson, SCHartford, CTIndianapolis/Ft WayneKansas City, MOLas Vegas, NVLong Island, NYLouisville, KYMemphis, TNMadison, WI
Milwaukee, WINashville, TNNew Orleans, LANorfolk/Virginia Beach/ Newport News, VA
Concord CAOklahoma City, OK
Orlando, FLPeoria, IL
Omaha, NE
Pittsburgh, PA
Portland, ORPrinceton/So. NJProvidence, RIRaleigh/Durham, NCSacramento,CA Salt Lake City, UTSan Antonio, TXTampa, FL
Upper Fairfield County/ New Haven, CT
Tulsa, OK
Albuquerque/Santa Fe,NMAustin, TXBaltimore, MDBirmingham, ALCharlotte, NCCincinnati, OHCleveland/Akron,OHColumbus OHColorado Springs, CODayton, OH
Denver, COGrand Rapids, MI
Des Moines, IA
Quebec, QUERegina, SASKSaskatoon, SASKSt. Catherines, ONT
Toronto, ONTVancouver, BCWindsor, ONTWinnipeg, MAN
Greensboro/Winston
Anderson, SCHartford, CTIndianapolis/Ft WayneKansas City, MOLas Vegas, NVLong Island, NYLouisville, KY
Memphis, TN

10
• Verified skills pay data from 21,675 IT professionals in North America
• Current market pay premiums for 164 noncertified IT skills and 166 IT certifications
• IT skills trends: historical, current, projections
• Updated and published quarterly since 1999
• 266 pages
IT Skills and Certifications Pay IndexTM
1Q 2008 Survey edition (ITSCPI)

11
Current market pay premiums for 330 certified and noncertified skills in these categories:
164 Noncertified Skills:- Apps Development Tools/Platforms- Database- Enterprise Business Applications- Messaging/e-mail/Groupware- Management, Methodology & Process- Systems/Networking and Communications- Operating Systems- Web/e-Commerce Development
166 Certified Skills:- Applications Develop./Prog Languages- Architecture & Project Management- Database- General and Training- Networking and Internetworking - IT Security - Systems Eng./Admin/NOS - Web Development
IT Skills and Certifications Pay IndexTM
1Q 2008 Survey edition

12
Win a free $2000 ITSCPI !!• Monthly drawing • Losers automatically re-entered • All FISD entrants will qualify to opt-in
select mail list (receive free research)
HOW TO ENTER--Your business card tonight--http://www.footepartners.com/Monthlydrawing_ITSCPI.htm

13
Average Premium Pay (as % of Base Salary)330 IT Skills - Q1 2008 Update
8.26%
8.58%
6.76%
7.14%
6.62%
6.85%
7.79%7.83% 7.84%7.95%
10.2%
7.73% 7.74%
8.05%8.25%
8.07%8.25%
6.0%
6.5%
7.0%
7.5%
8.0%
8.5%
9.0%
9.5%
10.0%
10.5%
3Q 20
00 4Q
1Q 20
01 2Q 3Q 4Q1Q
2002
2Q 3Q 4Q
1Q 20
03 2Q 3Q
4Q1Q
2004 2Q 3Q 4Q
1Q 20
05 2Q 3Q 4Q1Q
2006 2Q 3Q
4Q
1Q
2007 2Q 3Q
4Q
1Q
2008
166 Certified Skills (Median average, single skill)
164 Noncertified Skills
What are individual IT skills earning? Certified vs. Noncertified, 2000 to 2008
Noncertified skills: 6.1% growthlast 12 mos.
Certifications: -2.8% declinelast 12 mos.
Source: ©2008 Foote Partners LLC, IT Skills and Certifications Pay IndexTM

14
Pay for Certified vs. Noncertified IT Skills: 6/12/24 Month Trends
Pay PerformanceCertified & Noncertified IT Skills
(330 IT Skills Surveyed; 21,675 IT professionals)
6 mos Annual 2 years
-1.6%
1.8%
-2.9%
6.1%
-4.9%
15.7%
-10.0%
-5.0%
0.0%
5.0%
10.0%
15.0%
20.0%
% C
hang
e in
Val
ue(e
ndin
g 4/
1/08
)
Growth/Decline in Pay for 330 IT Skills
166 IT certifications 164 Noncertified IT skills
6 mos Annual 2 years
-1.6%
1.8%
-2.9%
6.1%
-4.9%
15.7%
-10.0%
-5.0%
0.0%
5.0%
10.0%
15.0%
20.0%
% C
hang
e in
Val
ue(e
ndin
g 4/
1/08
)
Growth/Decline in Pay for 330 IT Skills
166 IT certifications 164 Noncertified IT skills
Source: ©2008 Foote Partners LLC, IT Skills and Certifications Pay IndexTM

15
Certified IT Skills Pay Trends
Q1 2008 Update
Foote Partners Briefing

16
Growth/Decline - IT Certifications Value(through 4/1/07)
-5.4%
-4.7%
-0.6%
-3.1%
-0.8%
-2.7%
-1.1%
-4.8%
0.0%
0.0%
1.7%
0.0%-8.0%
3.6%
-5.4%
-2.1%
-2.7%
-4.9%
-10% -5% 0% 5% 10%
Percent Change in Ave. Median Premium Pay, By Category
% Change, Annual
% Change, Last 6 mos
Copyright©2007 Foote Partners LLC
Project Management
ALL IT CERTIFICATIONS SURVEYED
System Admin & Eng/Network OS
Web Development
Apps Development/ Prog. Languages
IT Security
Networking/ Internetworking
Database
General and Training
Source:Foote Partners LLC, “Hot Technical Skills & Certifications Pay Index – Q1 2007 edition”
Source:Foote Partners LLC, “Hot Technical Skills & Certifications Pay Index – Q1 2007 edition”
Certified IT Skills Pay: 1 year ago1Q 2007 data1Q 2007 data1Q 2007 data

17
Certified IT Skills Pay: NOW
Growth/Decline - IT Certifications Value(through 4/1/08)
-10.2%
-9.7%-3.7%
-2.2%
-1.7%
-1.6%
-3.5%
-9.1%
3.3%
1.2%
-4.5%
3.1%
-16.0%
9.1%
-8.3%
-4.9%
-6.1%
-11.9%
-20% -15% -10% -5% 0% 5% 10%Percent Change in Ave. Median Premium Pay, By Category
% Change, Last 2 Years% Change, Last 6 mos
Copyright©2008 Foote Partners LLC
ALL IT CERTIFICATIONS SURVEYED
IT Security
Database
General and Training
Project Management/Architecture
System Admin & Eng/Network OS
Web Development
Apps Development/ Prog. Languages
Networking/Internetworking
Q1 2008 dataQ1 2008 dataQ1 2008 data
Source:Foote Partners LLC, “Hot Technical Skills & Certifications Pay Index – Q1 2008 edition”
Source:Foote Partners LLC, “Hot Technical Skills & Certifications Pay Index – Q1 2008 edition”

18
Ave. Premium Pay - Single Skill as a % of Base Salary (Median)
CERTIFICATIONS CATEGORIES 1Q 2006 1Q 2007 1Q 2008% Change
6 mos% Change ANNUAL
% Change 2 yrs
General and Training 5.0% 4.6% 4.2% -4.5% -8.7% -16.0%Apps Development/Prog. Languages 8.1% 7.7% 7.1% -3.4% -7.3% -11.9%Database 8.8% 8.3% 7.9% -2.2% -5.2% -10.3%Web Development 6.1% 6.3% 5.6% -9.0% -12.2% -9.0%Networking 9.1% 8.6% 8.4% -1.8% -3.1% -8.3%System Admin & Eng/Network OS 7.9% 7.6% 7.2% -3.6% -5.3% -9.7%Security 8.9% 8.9% 9.2% 1.2% 3.7% 3.1%Architecture/Project Management 11.0% 10.7% 10.3% 3.3% -3.2% -6.1%
164 CERTIFIED SKILLS SURVEYED 8.3% 8.1% 7.8% -1.6% -2.9% -5.0%
Certified IT Skills Pay
Certification Pay Premiums by Category (median)
(through 4/1/08)
Source: ©2008 Foote Partners LLC, IT Skills and Certifications Pay IndexTM

19
Certified IT Skills Pay: Ranked by Most Growth –Last 6 mos.(through 4/1/08)
Q1 2008 6 mos. ANNUAL
RISING PAY: CERTIFIED SKILLS% change - last
6 mos% change - last
12 mosCertified Information Security Manager (CISM) 27.3% 33.0%GIAC Security Expert (GSE) 25.0% 34.5%Planet3 Certified Wireless Network Administrator (CWNA) 20.0% 20.0%IT Certified Architect(ITCA/Open Group) 20.0% 20.0%SAS Certified Advanced Programmer 14.3% 14.3%Planet3 Certified Wireless Analysis Professional (CWAP) 14.3% 14.3%Cisco Certified Network Professional (CCNP) 14.3% 14.3%Planet3 Certified Wireless Security Professional (CWSP) 12.5% 12.5%Brocade Certified SAN Manager (BCSM) 10.0% 10.0%Citrix Certified Integration Architect (CCIA) 10.0% 10.0%Cisco Certified Security Professional (CCSP) 9.2% 20.0%InfoSys Security Architecture Professional (ISSAP/CISSP) 8.3% 0.0%Cisco Certified Internetwork Expert (CCIE) 7.7% 7.7%Certified Information Systems Security Professional(CISSP) 7.7% 7.7%
Source: ©2008 Foote Partners LLC, IT Skills and Certifications Pay IndexTM

20
Certified IT Skills Pay: Ranked by Most Growth –Last 12 mos.(through 4/1/08)
Q1 2008 6 mos. ANNUAL
RISING PAY: CERTIFIED SKILLS% change - last
6 mos% change - last
12 mosGIAC Security Expert (GSE) 25.0% 34.5%Certified Information Security Manager (CISM) 27.3% 33.0%Planet3 Certified Wireless Network Administrator (CWNA) 20.0% 20.0%IT Certified Architect(ITCA/Open Group) 20.0% 20.0%Cisco Certified Security Professional (CCSP) 9.2% 20.0%Teradata Certified SQL Specialist 0.0% 16.7%SAS Certified Advanced Programmer 14.3% 14.3%Planet3 Certified Wireless Analysis Professional (CWAP) 14.3% 14.3%Cisco Certified Network Professional (CCNP) 14.3% 14.3%Certified Hacking Forensics Investigator (CHFI) 0.0% 14.3%Planet3 Certified Wireless Security Professional (CWSP) 12.5% 12.5%GIAC Certified Intrusion Analyst (GCIA) 0.0% 11.1%GIAC Systems and Network Auditor (GSNA) 0.0% 11.1%Brocade Certified SAN Manager (BCSM) 10.0% 10.0%Citrix Certified Integration Architect (CCIA) 10.0% 10.0%InfoSys Security Engineering Professional (ISSEP/CISSP) 0.0% 8.3%Cisco Certified Internetwork Expert (CCIE) 7.7% 7.7%Certified Information Systems Security Professional(CISSP) 7.7% 7.7%
Source: ©2008 Foote Partners LLC, IT Skills and Certifications Pay IndexTM

21
Certified IT Skills Pay: Ranked by Most Decline –Last 6 mos.(through 4/1/08)
Q1 2008 6 mos. ANNUAL
DECLINING PAY: CERTIFIED SKILLS% change - last
6 mos% change - last
12 mosCompTIA Internet Technician (I-Net+) -33.3% -33.3%Microsoft Certified Professional+Internet (MCP+I) -20.0% -20.0%IBM Certified Specialist - iSeries -16.7% -27.5%Linux Professional Institute certification (LPIC-Level 2) -16.7% -16.7%EC-Council Certified Security Analyst -16.7% -16.7%Prosoft Master CIW Administrator -14.3% -25.0%CompTIA Certified Technical Trainer (CTT+) -14.3% -14.3%IBM Certified Systems Expert - i5 iSeries -14.3% -14.3%Sun Certified Systems Administrator for Solaris -14.3% -14.3%GIAC Certified Firewall Analyst (GCFW) -14.3% -14.3%IBM Certified Application Developer – Lotus Notes/Domino -12.5% -25.0%IBM Certified Advanced Application Developer – Lotus Notes/Domino -12.5% -12.5%Microsoft Certified IT Professional (MCITP/all) -12.5% -12.5%Novell/Certified Internet Professional (CIP) -12.5% -12.5%Brocade Certified SAN Designer (BCSD) -12.5% -12.5%Check Point Certified Security Administrator (CCSA) -12.5% -12.5%IBM Certified Advanced Technical Expert - pSeries and AIX 5L -11.1% -11.1%Novell/Certified Novell Engineer (CNE) -11.1% -11.1%GIAC Certified Unix Security Administrator (GCUX) -11.1% -11.1%Oracle Forms Developer Certified Professional (OCP) -10.0% -15.2%IBM DB2 Universal Database Certified Solutions Expert (DB2) -10.0% -10.0%IBM Certified Solutions Developer: WebSphere (all) -9.1% -9.1%SNIA Certified Storage Networking Expert -8.3% -8.3%Project Management Professional(PMP) -6.7% -6.7%
Source: ©2008 Foote Partners LLC, IT Skills and Certifications Pay IndexTM

22
Certified IT Skills Pay: Ranked by Most Decline –Last 12 mos.(through 4/1/08)
Q1 2008 6 mos. ANNUAL
DECLINING PAY: CERTIFIED SKILLS% change - last
6 mos% change - last
12 mosTeradata Certified Professional 0.0% -40.0%CompTIA Internet Technician (I-Net+) -33.3% -33.3%LAN Server Engineer (LSE) 0.0% -33.3%IBM Certified Specialist - iSeries -16.7% -27.5%Prosoft Master CIW Administrator -14.3% -25.0%IBM Certified Application Developer – Lotus Notes/Domino -12.5% -25.0%Microsoft Certified Professional (MCP) 0.0% -25.0%CompTIA Linux+ 0.0% -25.0%Microsoft Certified Professional+Internet (MCP+I) -20.0% -20.0%Microsoft Certified Solution Developer (MCSD) 0.0% -20.0%Cisco IP Telephony Design Specialist 0.0% -20.0%Linux Professional Institute certification (LPIC-Level 2) -16.7% -16.7%EC-Council Certified Security Analyst -16.7% -16.7%Prosoft Master CIW Designer 0.0% -16.7%Microsoft Certified Desktop Support Technician(MCDST) 0.0% -16.7%Oracle Forms Developer Certified Professional (OCP) -10.0% -15.2%CompTIA Certified Technical Trainer (CTT+) -14.3% -14.3%IBM Certified Systems Expert - i5 iSeries -14.3% -14.3%Sun Certified Systems Administrator for Solaris -14.3% -14.3%GIAC Certified Firewall Analyst (GCFW) -14.3% -14.3%CompTIA Server+ 0.0% -14.3%Microsoft Certified Systems Administrator(MCSA) 0.0% -14.3%IBM Certified Advanced Application Developer – Lotus Notes/Domino -12.5% -12.5%Microsoft Certified IT Professional (MCITP/all) -12.5% -12.5%Novell/Certified Internet Professional (CIP) -12.5% -12.5%Brocade Certified SAN Designer (BCSD) -12.5% -12.5%Check Point Certified Security Administrator (CCSA) -12.5% -12.5%Microsoft Certified Applications Developer(MCAD) 0.0% -12.5%Microsoft Certified Professional Developer (all) 0.0% -12.5%Novell Certified Linux Engineer (CLE) 0.0% -12.5%IBM Certified Specialist - AIX Basic Ops 0.0% -12.5%Microsoft Certified Systems Engineer(MCSE) 0.0% -12.5%Sun Certified Network Administrator for Solaris 0.0% -12.5%IBM Certified Advanced Technical Expert - pSeries and AIX 5L -11.1% -11.1%Novell/Certified Novell Engineer (CNE) -11.1% -11.1%GIAC Certified Unix Security Administrator (GCUX) -11.1% -11.1%Planet3 Certified Wireless Network Trainer (CWNT) 0.0% -11.1%IBM DB2 Universal Database Certified Solutions Expert (DB2) -10.0% -10.0%Sniffer Certified Master 0.0% -10.0%Red Hat Certified Architect (RHCA) 0.0% -10.0%
Source: ©2008 Foote Partners LLC, IT Skills and Certifications Pay IndexTM

23
Certified IT Skills Pay: Ranked by Highest Paying(through 4/1/08)
Depending on corporate compensation policies, IT
skills premiums are typically paid out as a cash bonus or
incorporated directly into base salary (as a solution to the job
title/job content mismatch problem common with IT
professionals).
HIGHEST PAYING CERTIFIED IT SKILLS % of base pay*
1Q 2008GIAC Security Expert (GSE) 15%Certified Information Security Manager (CISM) 14%Certified Information Systems Security Professional(CISSP) 14%Cisco Certified Internetwork Expert (CCIE) 14%InfoSys Security Management Professional (ISSMP/CISSP) 14%Project Management Professional(PMP) 14%Certified Information Systems Auditor (CISA) 13%InfoSys Security Architecture Professional (ISSAP/CISSP) 13%InfoSys Security Engineering Professional (ISSEP/CISSP) 13%Cisco Certified Security Professional (CCSP) 12%EMC Proven Professional Technology Architect - Expert 12%HP/Master Accredited Systems Engineer (Master ASE) 12%IT Certified Architect(ITCA/Open Group) 12%Oracle DBA Administrator Certified Master (OCM) 12%
* at median
Source: ©2008 Foote Partners LLC, IT Skills and Certifications Pay IndexTM

24
Certified IT Skills Pay: Ranked by Lowest Paying(through 4/1/08)
LOWEST PAYING CERTIFIED SKILLS% of base pay
1Q2008*Certified Computing Professional (CCP) 2%CompTIA PC Technician (A+) 2%
LAN Server Engineer (LSE) 2%CompTIA Convergence+ 3%CompTIA Linux+ 3%CompTIA RFID+ 3%CompTIA Security+ 3%GIAC Security Essentials Certification (GSEC) 3%Microsoft Certified Professional (MCP) 3%Prosoft CIW Associate 3%Siebel Certified Consultant (SCC) 3%Siebel Customer Certified Consultant (SCCC) 3%Teradata Certified Implementation Specialist 3%Teradata Certified Professional 3%Cisco Certified Network Associate (CCNA) 4%CompTIA Internet Technician (I-Net+) 4%CompTIA Network Technician (Network+) 4%Microsoft Certified Professional+Internet (MCP+I) 4%RedHat Certified Technician 4%
* at median
Depending on corporate compensation policies, IT
skills premiums are typically paid out as a cash bonus or
incorporated directly into base salary (as a solution to the job
title/job content mismatch problem common with IT
professionals).
Source: ©2008 Foote Partners LLC, IT Skills and Certifications Pay IndexTM

25
Noncertified IT Skills Pay Trends
Q1 2008 Update
Foote Partners Briefing

26
Noncertified IT Skills Pay: NOW
Growth/Decline - Noncertified IT Skills Value (4/1/08)
13.6%
15.7%
-5.2%
1.8%
5.9%
2.3%
1.3%
1.6%
0.0%
0.0%
2.0%
8.1%
-2.8%
25.8%12.0%
16.1%
1.6%
9.2%
-10% -5% 0% 5% 10% 15% 20% 25% 30%
Percent Change in Ave. Median Premium Pay, By Category
% Change, Last 2 Years% Change, Last 6 mos
Copyright©2008 Foote Partners LLC
Database
ALL NONCERTIFIED SKILLS SURVEYED
Management, Process & Methodology
Operating Systems
Web/E-Commerce Development
Enterprise Business Apps
Messaging, E-mail, Groupware
Apps Development Tools/Platforms
Network/System
Q1 2008 dataQ1 2008 data
Source:Foote Partners LLC, “Hot Technical Skills & Certifications Pay Index – Q1 2008 edition”
Source:Foote Partners LLC, “Hot Technical Skills & Certifications Pay Index – Q1 2008 edition”

27
IT Noncertified Skill Pay: Ranked byMost Growth –Last 6 mos.(through 4/1/08)
Q1 2008 6 mos. ANNUAL
RISING SKILLS PAY: Noncertified Skills% change - last
6 mos% change - last
12 mosNetwork security management 25.0% 37.0%Wireless network management (LANs, GSM) 22.2% 22.2%Business intelligence 20.0% 33.3%PHP 20.0% 20.0%SAP MDM (Master Data Management) 20.0% 20.0%Oracle DB / 8i/9i/10g/11i 18.2% 30.0%SAP ERP 18.0% naNetWeaver BI (SAP BW) 16.7% 16.7%SAN/Storage Area Networking 14.3% 23.1%Oracle Workflow 12.5% naXML (all variants) 12.5% 23.0%SAP Business Objects 12.5% 12.5%Security (various, project-based) 12.5% 12.5%Unified messaging (various) 12.5% 12.5%Windows Server 2003 (all editions) 12.5% 12.5%Database management 11.1% 22.0%VoIP/IP telephony 11.1% 11.1%SAP HCM (SAP HR) 11.1% 0.0%CRM 10.0% naSAP CRM (Customer Relationship Management) 10.0% naSAP MM (Materials Management) 10.0% 18.2%SAP Netweaver Applications Server 9.1% naAJAX (Asynchronous JavaScript and XML) 9.1% 20.0%Oracle Enterprise Apps 9.1% 19.0%Apple OSX/Leopard 9.0% 12.0%NetWeaver 7.1% 15.4%Microsoft .Net (Visual Studio .Net, Visual Basic .Net, ASP.Net 6.7% 14.3%
Source: ©2008 Foote Partners LLC, IT Skills and Certifications Pay IndexTM

28
IT Noncertified Skill Pay: Ranked by Highest Paying(through 4/1/08)
Depending on corporate compensation policies, IT skills
premiums are typically incorporated directly into base salary (as a solution to the job
title/job content mismatch problem common with IT
professionals) or paid out as a cash bonus.
HIGHEST PAYING NONCERTIFIED IT SKILLS% of base pay
1Q2008*Security (various, project-based) 18%Microsoft .Net (Visual Studio .Net, Visual Basic .Net, ASP.Net) 16%RAD, Extreme Programming (XP) 16%SAN/Storage Area Networking 16%Virtualization (various) 16%NetWeaver 15%Network security management 15%NetWeaver BI (SAP BW) 14%SAP ERP (multi-skills) 14%Oracle DB / 8i/9i/10g/11i 13%Accelerated SAP (ASAP) 12%AJAX (Asynchronous JavaScript and XML) 12%Business intelligence 12%Oracle Enterprise Apps 12%Project management 12%SAP BI Accelerator 12%SAP Controlling (CO) 12%SAP Financial Accounting (FI) 12%SAP MDM (Master Data Management) 12%SAP Netweaver Applications Server 12%
* at median
Source: ©2008 Foote Partners LLC, IT Skills and Certifications Pay IndexTM

29
IT Security Salary Trends
Q1 2008 Update

30
Average ANNUAL BASE PAY - NE, Mid-Atlantic
$71,542
$79,209$83,058
$88,387$84,814
$81,019$79,500$78,118
$73,000$71,794$73,908
$89,048
$91,250
$96,650 $98,000
$92,543$94,935
$92,574
$77,939
$87,855$92,592
$100,100
$103,700 $105,000 $111,568
$121,568 $123,211
$85,521
$95,262 $95,936
$102,822
$110,420$113,000
$120,296
$130,660$134,525
$131,000$128,311
$127,000$125,000
$119,000
$112,200$107,812
$103,257
$93,501
$165,000
$101,787
$116,226
$124,513
$131,500
$140,000
$156,750
$148,000$143,000
$70,000
$90,000
$110,000
$130,000
$150,000
$170,000
1 2 3 4 5 6 7 8 92000 2002 2003 2004 2005 2006 2007 2008
VP/Dir, IT Security
DW/BI Security MgrDW/BI Security Mgr
Manager, IT SecurityManager, IT Security
Web Security Mgr
Sr. Security AnalystSr. Security Analyst
Security SysAdmSecurity SysAdm
Source: ©2008 Foote Partners LLC, IT Professional Salary Survey

31
Annual TOTAL CASH Compensation - NE, Mid-Atlantic
$84,625
$144,975
$96,677
$90,327$87,375$85,065$83,977$78,475$76,461$78,696 $82,222
$99,427$105,378
$94,271 $97,062$99,463
$105,349 $107,910
$104,111
$147,997
$101,851$99,276
$88,461
$111,612
$120,420$115,626
$141,372$137,372
$131,670$125,879
$114,041$107,448$110,504
$99,204
$155,906
$165,754
$159,350
$107,526
$120,811 $120,749$125,580
$138,040$145,000
$149,274$154,350
$185,000
$175,000
$159,340$153,774
$123,162
$141,796
$191,822
$197,954
$209,818
$70,000
$90,000
$110,000
$130,000
$150,000
$170,000
$190,000
$210,000
$230,000
1 2 3 4 5 6 7 8 92000 02 2003 2004 2005 2006 2007 2008
VP/Dir, IT Security
DW/BI Security MgrDW/BI Security Mgr
Manager, IT SecurityManager, IT Security
Web Security Mgr
Sr. Security AnalystSr. Security Analyst
Security SysAdmSecurity SysAdm
Source: ©2008 Foote Partners LLC, IT Professional Salary Survey
32
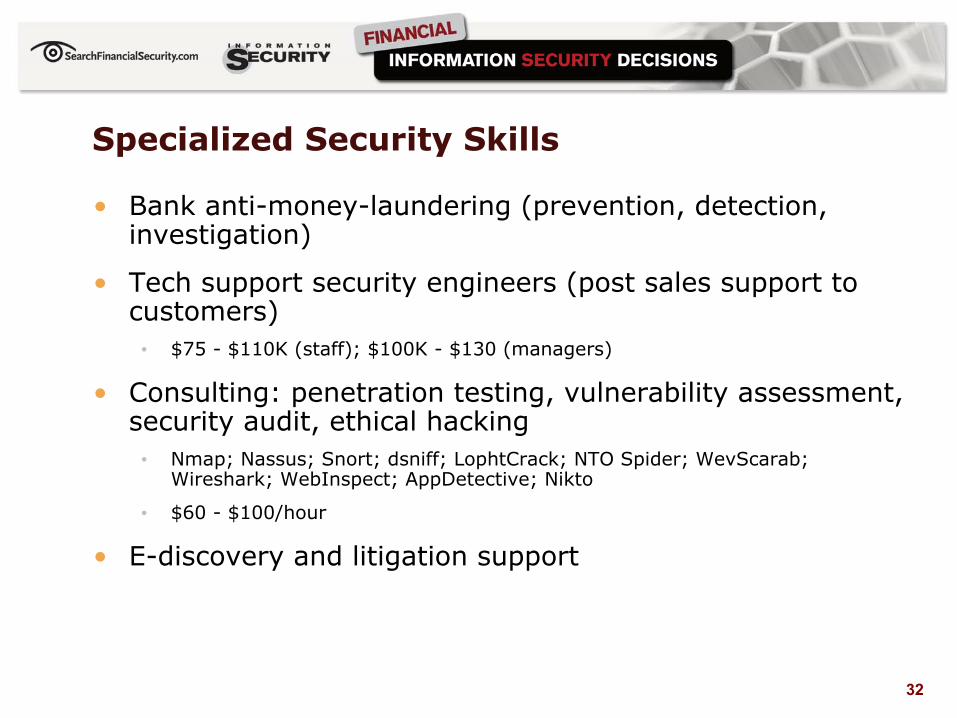
Specialized Security Skills
• Bank anti-money-laundering (prevention, detection, investigation)
• Tech support security engineers (post sales support to customers)• $75 - $110K (staff); $100K - $130 (managers)
• Consulting: penetration testing, vulnerability assessment, security audit, ethical hacking• Nmap; Nassus; Snort; dsniff; LophtCrack; NTO Spider; WevScarab;
Wireshark; WebInspect; AppDetective; Nikto
• $60 - $100/hour
• E-discovery and litigation support

33
Specialized Security Skills
• Technical • Autocorrelation• Incident response• Forensics• Packet-level network skills• Applications network use and packet skills• Identity management and LDAP• Wireless security• VoIP security• Legal compliance, audit and remediation• Data-leak prevention/DLP• Two-factor authentication• ID/access
• Incident response as a management team, outsourced technical resources
• Emphasis on communications skills and documentation effort vs. tech stuff

34
IT Spending Trends (driving skills acquisition)
Q1 2008 Update
Foote Partners Briefing

35
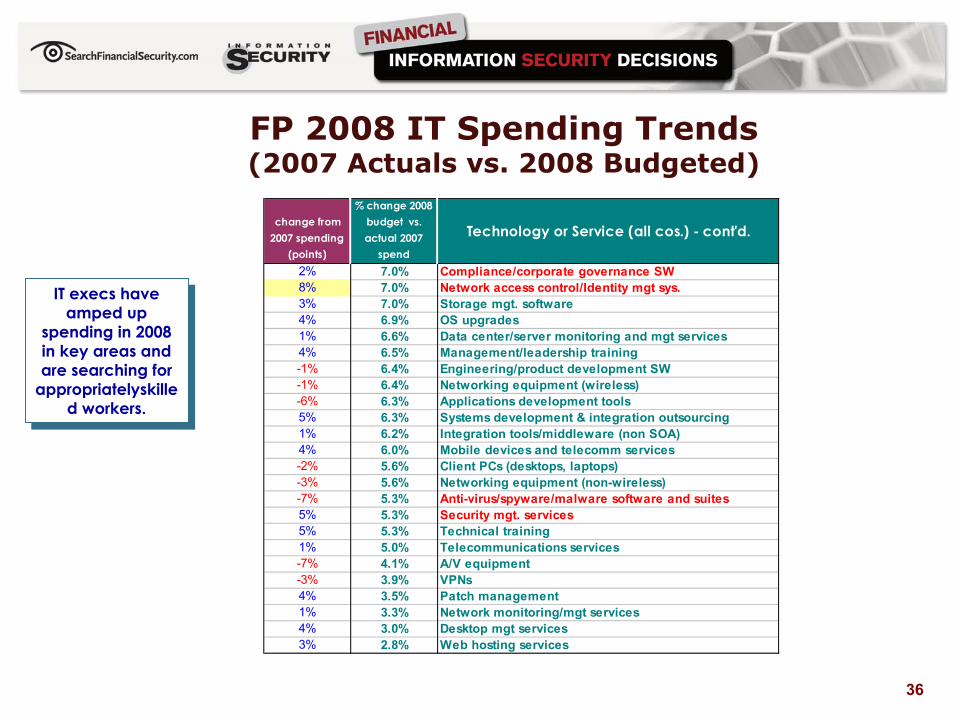
FP 2008 IT Spending Trends(2007 Actuals vs. 2008 Budgeted)
IT execs have amped up
spending in 2008 in key areas and are searching for
appropriatelyskilled workers.
IT execs have amped up
spending in 2008 in key areas and are searching for
appropriatelyskilled workers.
change from 2007 spending
(points)
% change 2008 budget vs. actual 2007
spend
Technology or Service (all cos.)
15% 20.1% Virtualization (servers/storage) 5% 16.6% Customer self-service technologies and applications 2% 15.4% Open source applications/systems 5% 14.8% Collaboration software 2% 13.9% Storage equipment
10% 13.8% VoIP 2% 13.2% CRM software 9% 13.1% BI/analytics/data mining software 6% 13.1% Corporate portals 4% 12.8% SaaS/ASPs 3% 12.7% ERP systems
8% 12.6%Content/Information lifecycle mgt. software (incl. digital asset/document mgt)
-1% 12.1% Database systems 7% 11.8% Business process mgt. and modelling SW 7% 10.8% IT governance, asset mgt. software 4% 10.7% IT strategy consulting and advisory services 1% 10.2% E-commerce systems -1% 10.1% Servers (mainframe) 4% 9.5% Web services/SOA -7% 9.0% E-mail/instant messaging SW8% 8.8% Disaster recovery/business continuity services3% 8.1% BPO outsourcing 7% 8.1% Telecommunications equipment 0% 7.7% Intrusion prevention/detection systems 0% 7.5% Servers (non-mainframe) 4% 7.2% Storage/remote backup systems
36
IT execs have amped up
spending in 2008 in key areas and are searching for
appropriatelyskilled workers.
IT execs have amped up
spending in 2008 in key areas and are searching for
appropriatelyskilled workers.
change from 2007 spending
(points)
% change 2008 budget vs. actual 2007
spend
Technology or Service (all cos.) - cont'd.
2% 7.0% Compliance/corporate governance SW 8% 7.0% Network access control/Identity mgt sys. 3% 7.0% Storage mgt. software 4% 6.9% OS upgrades 1% 6.6% Data center/server monitoring and mgt services 4% 6.5% Management/leadership training -1% 6.4% Engineering/product development SW -1% 6.4% Networking equipment (wireless) -6% 6.3% Applications development tools 5% 6.3% Systems development & integration outsourcing 1% 6.2% Integration tools/middleware (non SOA)4% 6.0% Mobile devices and telecomm services-2% 5.6% Client PCs (desktops, laptops)-3% 5.6% Networking equipment (non-wireless) -7% 5.3% Anti-virus/spyware/malware software and suites5% 5.3% Security mgt. services5% 5.3% Technical training1% 5.0% Telecommunications services -7% 4.1% A/V equipment-3% 3.9% VPNs4% 3.5% Patch management1% 3.3% Network monitoring/mgt services4% 3.0% Desktop mgt services3% 2.8% Web hosting services
FP 2008 IT Spending Trends(2007 Actuals vs. 2008 Budgeted)

37
Higher spending priorities for SMBs v. large cos:
ERP systemsE-commerce systems
Storage/remote BUData center/server services
Technical trainingManagement/Leader training
Lower spending priorities for SMBs v. large:
Customer Self-service tech.Collaboration S/W
Higher spending priorities for SMBs v. large cos:
ERP systemsE-commerce systems
Storage/remote BUData center/server services
Technical trainingManagement/Leader training
Lower spending priorities for SMBs v. large:
Customer Self-service tech.Collaboration S/W
*SMB: < $500 million revs
change from 2007 spending
(points)
% change 2008 budget vs. actual 2007
spend
Technology or Service (SMB only)
17% 23.4% Virtualization (servers/storage) 12% 15.8% VoIP 5% 14.7% ERP systems 1% 13.7% E-commerce systems 2% 13.5% CRM software 0% 12.5% Storage equipment 5% 11.7% Storage/remote backup systems
10% 10.9%Content/Information lifecycle mgt. software (incl. digital asset/document mgt)
-6% 10.8% E-mail/instant messaging SW1% 10.7% Database systems 2% 10.3% Data center/server monitoring and mgt services
11% 9.9% BI/analytics/data mining software 2% 9.4% Intrusion prevention/detection systems
10% 9.1% Telecommunications equipment 6% 8.6% IT strategy consulting and advisory services 5% 8.1% Collaboration software 4% 8.1% Web services/SOA
11% 8.0% Disaster recovery/business continuity services4% 8.0% Systems development & integration outsourcing 3% 7.9% OS upgrades 8% 7.7% Network access control/Identity mgt sys. -1% 7.5% Servers (non-mainframe) -6% 7.2% Applications development tools 7% 7.2% Technical training8% 6.9% Management/leadership training 4% 6.8% Storage mgt. software 4% 6.3% Mobile devices and telecomm services-6% 5.4% Anti-virus/spyware/malware software and suites3% 5.4% Telecommunications services -3% 4.5% Client PCs (desktops, laptops)4% 4.2% Network monitoring/mgt services4% 4.2% Web hosting services-1% 3.7% VPNs8% 3.5% Patch management-9% 1.7% A/V equipment
FP 2008 IT Spending Trends – SMBs*(2007 Actuals vs. 2008 Budgeted)
38
Other Indicators of Demand for IT Skills and Jobs in 2008
Foote Partners Briefing

39
2008: Top IT Technologies & Strategies(Opinion Survey)
Mid-Market companies $100-$999M
1. Business intelligence/data mining2. Collaboration and workflow3. Data and systems integration4. Virtualization5. Business process management and modeling
Mid-Market companies $100-$999M
1. Business intelligence/data mining2. Collaboration and workflow3. Data and systems integration4. Virtualization5. Business process management and modeling
Source: CIO Insight by-invitation survey
251 respondents, (all heads of IT).
Company size: ’07 revenue: <$100M (68 resp.), $100M to $999.9M (82 resp.), $1B+ (101 resp.)
All companies
1. Business intelligence/data mining2. Collaboration and workflow3. Data and systems integration4. Business process management and modeling5. Virtualization6. Web services/SOA7. Disaster recovery/business continuity/enterprise risk mgt8. Bandwidth, load and demand management tools9. CRM10. Corporate portalsLeast mentioned: Social networking; Blog/podcast/Webcast
production; virtual world tech
40
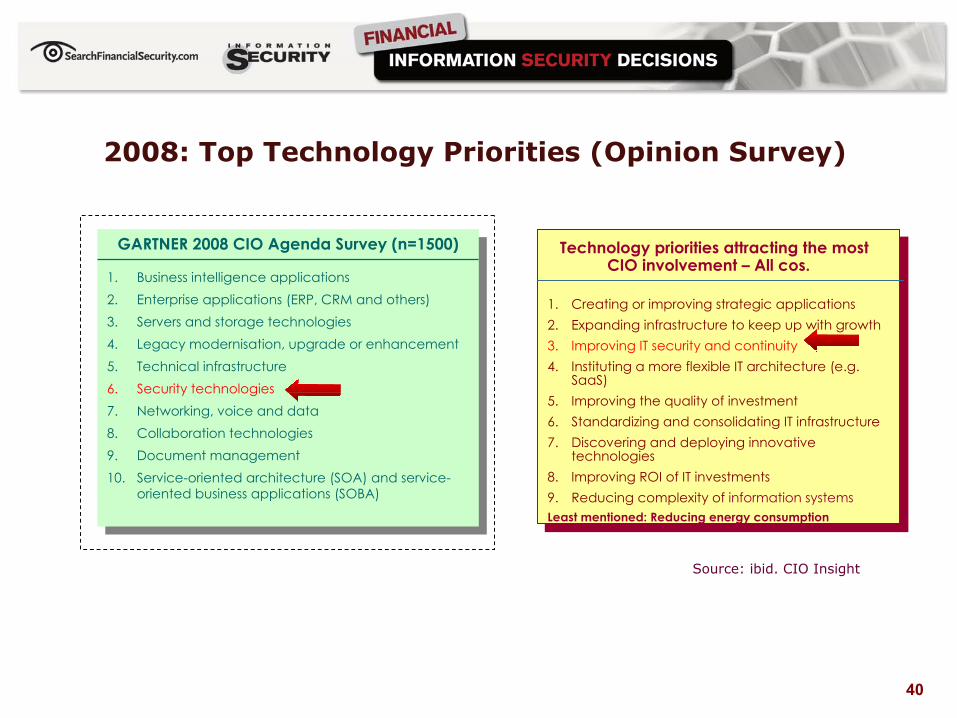
2008: Top Technology Priorities (Opinion Survey)
Technology priorities attracting the most CIO involvement – All cos.
1. Creating or improving strategic applications2. Expanding infrastructure to keep up with growth3. Improving IT security and continuity4. Instituting a more flexible IT architecture (e.g.
SaaS) 5. Improving the quality of investment6. Standardizing and consolidating IT infrastructure7. Discovering and deploying innovative
technologies8. Improving ROI of IT investments9. Reducing complexity of information systemsLeast mentioned: Reducing energy consumption
Source: ibid. CIO Insight
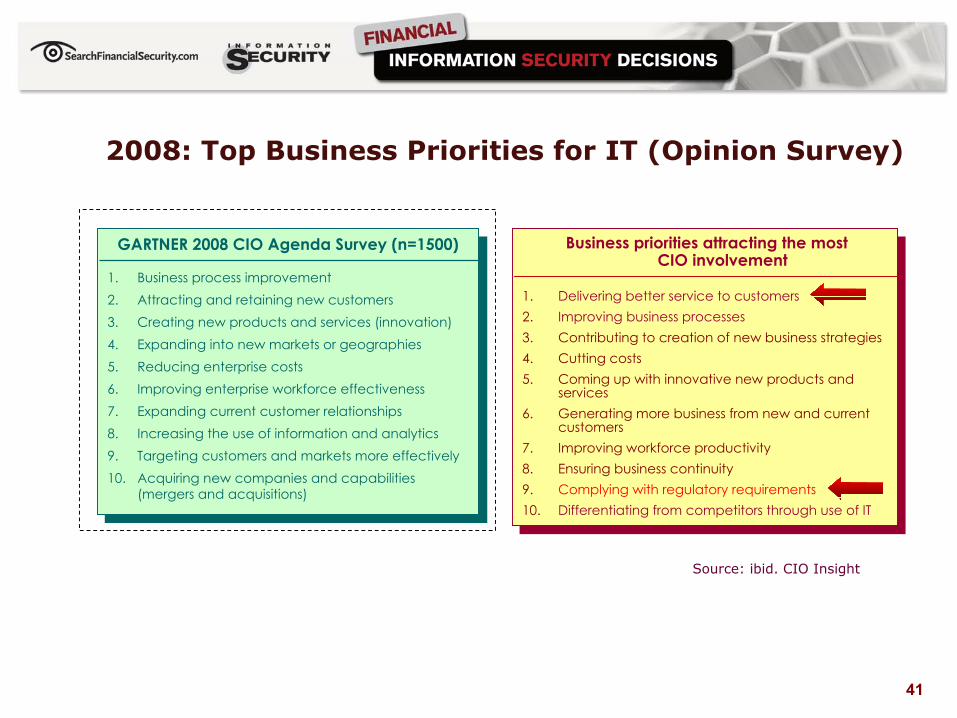
GARTNER 2008 CIO Agenda Survey (n=1500)
1. Business intelligence applications 2. Enterprise applications (ERP, CRM and others) 3. Servers and storage technologies 4. Legacy modernisation, upgrade or enhancement 5. Technical infrastructure 6. Security technologies7. Networking, voice and data 8. Collaboration technologies 9. Document management 10. Service-oriented architecture (SOA) and service-
oriented business applications (SOBA)
41
Business priorities attracting the mostCIO involvement
1. Delivering better service to customers2. Improving business processes3. Contributing to creation of new business strategies 4. Cutting costs5. Coming up with innovative new products and
services6. Generating more business from new and current
customers7. Improving workforce productivity8. Ensuring business continuity9. Complying with regulatory requirements10. Differentiating from competitors through use of IT
2008: Top Business Priorities for IT (Opinion Survey)
GARTNER 2008 CIO Agenda Survey (n=1500)
1. Business process improvement 2. Attracting and retaining new customers 3. Creating new products and services (innovation) 4. Expanding into new markets or geographies 5. Reducing enterprise costs 6. Improving enterprise workforce effectiveness 7. Expanding current customer relationships 8. Increasing the use of information and analytics 9. Targeting customers and markets more effectively 10. Acquiring new companies and capabilities
(mergers and acquisitions)
Source: ibid. CIO Insight

42
2008: Top Management Priorities (Opinion Survey)
Management priorities attracting the most CIO involvement – All cos. (2008 survey)
1. Improving alignment with business objectives2. Improving IT planning processes3. Improving project management capabilities4. Reducing IT costs 5. Improving ROI on IT spending6. Improving leadership and management
development7. Improving systems development capabilities8. Recruiting and retaining IT staff9. Instituting ITIL10. Reorganizing the IT dept.
Source: ibid. CIO Insight

43
Toughest IT Challenges: Next 5 – 10 years
IT management priorities attracting the most CIO involvement – All companies (2008 survey)
1. Maintaining IT security and data privacy2. Developing IT strategies for competitive advantage3. Maintaining a 24/7 infrastructure4. Attracting young Americans to the IT profession 5. Demonstrating and measuring IT’s value6. Recruiting and retaining IT professionals, managers7. Managing and integrating information8. Retaining a loyal, stable core IT staff9. Providing real-time, cost-effective capabilities10. Reducing IT costs
IT management priorities attracting the most CIO involvement: $5M - $500M (2008 survey)
1. Maintaining IT security and data privacy2. Maintaining a 24/7 infrastructure3. Developing IT strategies for competitive advantage4. Demonstrating and measuring IT’s value5. Managing and integrating information6. Providing real-time, cost-effective capabilities 7. Attracting young people to the IT profession 8. Recruiting and retaining IT professionals, managers9. Retaining a loyal, stable core IT staff10. Reducing IT costs
Source: ibid. CIO Insight

44
IT Security and Privacy Skills Demand
Foote Partners Analysis

45
IT Security Trends Driving Pay (Macro)
• Dismantling of the IT security "empire”• Overall information risk management versus tactical, technical focus on IT
operations
• IT governance, IT risk management and IT compliance (GRC) will continue to converge into one discipline• But convergence is moving very slowly
• Greater attention paid to metrics, staffing and organizational structure
• Regulation…SarBox, FFIEC, FISMA, HSPD-12, FIPS, EDPA, CA SB1286, just for starters• Public Company Accounting Oversight Board (PCAOB) continues to evolve
• Requirements for automated, repeatable controls and processes around the classic information compliance drivers

46
IT Security Trends Driving Pay (Macro), cont.
• Legal risk and the implications of noncompliance intensifying • Fines, irrevocable damage of company brand and reputation; jail time for
executives
• Changes to the Rules of Civil Procedure regarding document retention making it harder for companies to mount effective litigation defense.
• Customers are pressuring vendors to build better security into products and services…or else
• Big vendor dominance (more acquisitions)
• Security organizations splitting into strategy teams (business issues of risk management) and operational teams (technical, esp. networking)• Security technology baked into infrastructure

47
IT Security Trends Driving Pay (Macro), cont.
• Security organizations split into strategy teams (business issues of risk management) and operational teams (technical, esp. networking)
• Security technology baked into infrastructure
• Datacentric security: Working with business to classify data to determine who gets to see it and how to protect it.
• Proactive security programs spanning entire application lifecycles

48
Virtualization and Security
• 70% of enterprises report they're running at least one virtualized server, yet < 12% report that they have a VM security strategy (FP survey)• Nearly half without VM security plans believe that virtual machines are as
secure as traditional servers
• Another 18% admit they don't know whether virtualization changes the rules of the game for security
• Two fronts for new security threats:• Additional software footprint for both desktop and servers
• How multiple virtual machines communicate with each other on the same system, plus the ability to move running VMs from machine to machine
Special needs for:
• VM-specific operational security• Disaster recovery plans need to incorporate changes to virtualized servers using
blade technology• Architecture and life-cycle processes to manage a wide variety of “VM sprawl”
issues

49
Virtualization Security Issues
• A virtual OS/applications machine can be attacked in the same way as a physical system (PS)
• A system containing a trusted virtual machine (VM) on an untrusted host poses a greater risk than a system containing a trusted host with an untrusted VM
• Arguments: • A VM poses a higher security risk than an identically configured PS OS/apps
system (reason: hypervisor)
• A VM can be made more secure than similar PS when functionality and content is separated
• Aggregated VMs on the same PS can only be made more secure (thanseparate PS’s) by modifying the VMs configurations to offset hypervisor risk

50
Virtualization Security Solutions
• Hardware vendors designing end-user systems from the ground up, provide administrator-controlled VM partitions and hypervisor layers
• Virtual appliances (e.g. grid computing, SaaS)

51
Areas of Greatest Security Risk Exposure
16%
30%
31%
48%
55%
0% 10% 20% 30% 40% 50% 60%
Disturbances of org's Websites
Noncompliance with securityregulations
Physical theft of org'scomputers/storage/portable
media
Network-based theft ofdata/intellectual
property/customer data
Infection of org's computerswith malware

52
Security Challenges and Holes
• User education on security issues (more people than ever have access to critical data, ignorance of privacy regs, etc.)
• Communication between IT and business executives about security: understanding the business and where it’s heading…not letting technology drive strategy.
• Traditional perimeter-type approaches are missing many threats.• Trusted users and partners: They have access to sensitive data
• Web applications vulnerabilities: 75% of attacks at apps layer, many through quick-code Web apps with little ‘baked-in’ security
• Missing devices: Unencrypted lost laptops, mobile devices containing sensitive info
• Custom malware: Proliferating malware operating under the radar of established signatures
• Social engineering: Policy creation + education + enforcement = incremental success.

53
Security Challenges and Holes, cont.
• Aligning security spending with the true risks and threats being addressed• Gap between security spend and today’s risk is shocking
• EX: spending for network-centric perimeter type technologies vs. data and information security threat levels
• Comprehensive knowledge of IT architecture to enable secure design (ground-up secure infrastructures)
• Full awareness and security coverage of the enterprise computing environment• Mobility security
• Identity and access management
• Protecting data and intellectual property
• Vulnerability management
• Threat management
• Trust management

54
Security Challenges and Holes, cont.
• Immaturity and expense of newer technologies (EX: DLP)
• Security metrics: finding better ones, using them more adroitly

55
Security Strategies
• Pushing for active, not passive, anticipatory prevention defenses
• Combating acceleration of hacker efforts between vulnerability publication and exploit
• Inclusion of security components in traditional technologies (routers, switches, servers, desktops, PDAs, etc.)
• Aggressive attacks on zombie technologies, which are becoming stealthier

56
Security Strategies
• Staffing is arguably the biggest issue for most• Too expensive to create/maintain a security team; credentialed, skilled
expertise is tough to find
• Not enough in-house experience or time to deal with all manner of deadly serious security issues common to operational environments
• Diversity of security requirements: Problems get ignored when they are beyond internal capabilities, institutional understanding
• Outsourcing of security technology functions
• Outsourcing of security skill sets

57
Foote Partners Information

58
• Senior team of former Gartner, Meta Group, McKinsey & Co., and Towers Perrin analysts and consultants; former HR, IT, and business executives and managers
• Grounding in evolving technology, HR and business drivers of IT workforce change
• Research partnerships with 1,900 employers/78,000 IT workers yields high quality validated, reliable data, updated regularly
• Only industry compensation survey that correct for IT job title/job content disconnects before loading data into survey engine
• Industry’s most comprehensive and up-to-date IT skills pay survey
• All primary research: no aggregated data sources
All products and services backed by a proprietary research database and custom surveys/data collection methods
Foote Partners LLC (est. 1997)Foote Partners, LLC
Foote Research Group
www.footepartners.com
Foote Partners, LLCFoote Research Group
www.footepartners.com
59
“IT Insider” Analytical Research Series
Research engine continuously tracking IT pay, attitudes, and management practices at thousands of North American employers
2008 IT Workforce and Compensation Survey Publications
• IT Insider Professional Salary SurveyTM reports (140 positions)• IT Skills and Certifications Pay IndexTM (330 certified/noncertified skills) • IT Salary+Skills Pay Survey TM reports• IT Insider Workforce Trends SeriesTM reports• IT Insider Professional Job DescriptionsTM
Foote Partners LLC (est. 1997)Foote Partners, LLC
Foote Research Group
www.footepartners.com
Foote Partners, LLCFoote Research Group
www.footepartners.com

60
IT Professional Salary Survey (job families)
Business Applications DeliveryBusiness Systems AnalystsBusiness TechnologyData Warehousing/BIDatabase Administration Database Developers E-Commerce Enterprise ApplicationsEnterprise InfrastructureEnterprise MessagingHelp Desk IT Architecture IT Security Management
Java DevelopersLotus Notes.NET DevelopersNetwork EngineeringNetwork OperationsSystems EngineeringSystems Operations Project ManagementSAPStorage/SAN AdministrationSix Sigma Unix/NT/Linux Voice EngineeringWeb Systems
Foote Partners LLC (est. 1997)Foote Partners, LLC
Foote Research Group
www.footepartners.com
Foote Partners, LLCFoote Research Group
www.footepartners.com

61
Management Consulting / Custom Advisory Services
IT Executive & Professional CompensationIT Management & Organization ServicesOutsourcing/Offshoring/Strategic Resource ManagementMarket/Competitive Intelligence Workforce Performance Management Professions and Retention Services Enterprise Project DeliveryOrganization / Transition ManagementCorporate Strategy and Business Development
Foote Partners LLC (est. 1997)Foote Partners, LLC
Foote Research Group
www.footepartners.com
Foote Partners, LLCFoote Research Group
www.footepartners.com

62
For additional information contact:
FOOTE PARTNERS LLC 4445 North A1A, Suite 200Vero Beach, Florida 32963 USA
Tel: 772-234-2787Fax: 775-262-6619
www.footepartners.com Foote Partners, LLCFoote Research Group
www.footepartners.com
Foote Partners Research Briefing