
Are trucks taking their toll? - Transport & Environment › sites › te › ... · Are trucks...
57
Report Delft, January 2009 Authors: Eelco den Boer Femke Brouwer Arno Schroten Huib van Essen Are trucks taking their toll? The environmental, safety and congestion impacts of lorries in the EU CE Delft environment, economy and Oude Delft 180 2611 HH Delft The Netherlands tel: +31 15 2 150 150 fax: +31 15 2 150 151 website: www.ce.nl KvK 27251086 Solutions for technology e-mail: [email protected]
Transcript of Are trucks taking their toll? - Transport & Environment › sites › te › ... · Are trucks...
CE Delft
Report Delft, January 2009 Authors: Eelco den Boer Femke Brouwer Arno Schroten
Huib van Essen
Are trucks taking their toll?
The environmental, safety and congestion impacts of lorries
in the EU
Solutions forenvironment
tel: +31 15 2150 150
,
economy and technology
Oude Delft 180
2611 HH Delft
The Netherlands
fax: +31 15 2150 151
e-mail: [email protected]
website: www.ce.nl
KvK 27251086
CE Delft
environment,
economy and
Oude Delft 180
2611 HH Delft
The Netherlands
tel: +31 15 2 150 150
fax: +31 15 2 150 151
website: www.ce.nl
KvK 27251086
Solutions for
technology
e-mail: [email protected]
Publication Data
Bibliographical data: Eelco den Boer, Femke Brouwer, Arno Schroten, Huib van Essen Are trucks taking their toll? : The environmental, safety and congestion impacts of lorries in the EU Delft, CE Delft, January 2009 Lorries / Environment / Effects / EU / External effects / Costs / Environmental pressure / Emissions Publication code: 09.4846.01 CE publications are available from www.ce.nl Commissioned by: T&E, the European Federation for Transport and Environment Further information on this study can be obtained from the contact person Eelco den Boer. © Copyright, CE, Delft
CE Delft Solutions for environment, economy and technology
CE Delft is an independent research and consultancy organisation specialised in developing structural and
innovative solutions to environmental problems. CE Delfts solutions are characterised in being politically
feasible, technologically sound, economically prudent and socially equitable.
For the latest information on CE Delft check out our website: www.ce.nl.
This report is printed on 100% recycled paper.

Contents
Summary 1
1 Introduction 5 1.1 Introduction 5 1.2 Project framework 5 1.3 Report outline 6
2 Road freight transport: demand and trends 7 2.1 Introduction 7 2.2 Demand trends (tonne-km) 7 2.3 Vehicle-kilometre data 9 2.4 Vehicle utilisation 12
3 Environmental and other impacts of road freight transport 15 3.1 Introduction 15 3.2 Fuel consumption, greenhouse gases and air pollution 15
3.2.1 Methodology 15 3.2.2 Comparison of emission factors 16 3.2.3 Total fuel consumption and CO2 emissions 19 3.2.4 Total emissions of air pollutants 22
3.3 Noise 24 3.4 Traffic accidents 28
3.4.1 Fatalities due to accidents involving HGV 29 3.4.2 Injuries due to accidents involving HGV 32 3.4.3 Underreporting 34
3.5 Congestion 34
4 External and infrastructure costs of road freight transport 35 4.1 Introduction 35 4.2 Valuing the external effects of road transport 35 4.3 CO2 emissions 37 4.4 Air pollution 37 4.5 Noise 39 4.6 Traffic accidents 40 4.7 Congestion 41 4.8 Infrastructure costs 42 4.9 Total external costs 42 4.10 Balance between external costs and taxes paid 44
Literature 45
A Road transport emissions in the EU-27 51
B Safety data availability 53


Summary
To inform its position on the upcoming Eurovignette debate in the European Parliament and Council, T&E asked CE Delft to assess the contribution of heavy goods vehicles (HGV) in the EU-27 to emissions of CO2 and air pollutants, noise, traffic accidents and congestion. The main conclusions of this report are as follows. In the overall context of road transport, HGV represented 7% of vehicle-km of road transport in 1995, which is projected to rise to 9% by 2030. Volume trends − Road freight transport (tonne-km)1 has grown sharply over the past few
decades and is expected to grow by a further 60% in the EU-27 between 2005 and 2030, due not only to economic growth, increased internal EU trade and globalisation, but also to supply-side effects such as improved quality and stable or declining freight prices.
− The current share of road transport in total continental freight transport, around 75%, is expected to remain stable until 2030, in the absence of new policy interventions.
− Based on a limited number of countries, the overall utilisation of the tonne-km capacity of an average HGV is 40-45%. Most countries for which data is available show decreasing utilisation trends. A focus on time management rather than efficient transport may have contributed to this trend.
− HGV charging creates an incentive to increase utilisation rates. However, positive trends in Germany and Switzerland following the introduction of charging schemes cannot clearly be distinguished from the effects of other accompanying measures.
− Especially on short trips, the share of empty running is high. Due to empty running, the overall utilisation factor is over 50% lower compared to loaded trips only on trips between 0 and 100 km. In addition, the type of cargo has a major influence on utilisation rates.
Environmental and other impacts − Over the last 15 years there has been no significant change in the fuel
efficiency of road freight transport. − Every year around 500 million barrels of oil are needed to fuel European
lorries, at a cost of around €60 billion. − HGV are responsible for 23% of the total CO2 emissions generated on
roads, with vans emitting a further 8%. In the EU-27 road transport is responsible for 21% of total CO2 emissions2. HGV account for 5-6% of
1 The statistical data on vehicle-kilometres required to estimate the environmental pressures associated with
road freight transport are not available at the EU level. As a second-best option, we used data modelling to make our calculations.
2 If non-CO2 greenhouse gas emissions are also taken into account (mainly methane and N2O), the share of road transport is 17%, that of HGV 4-5%.
4.846.1/Are trucks taking their toll? January 2009
1

aggregate CO2 emissions in the EU-27, vans 2%. Both shares are expected to keep on growing, as energy efficiency improvements in road freight transport are lagging behind.
− The annual growth of total HGV CO2 emissions has been around 2% per year since 1995.
− In line with the projected volume trend, total CO2 emissions and fuel consumption of road freight transport are on course to increase by around 55% between 2005 and 2030 alone if no additional measures are taken to reduce fuel consumption and improve fuel efficiency.
− If no measures are taken to address freight transport emissions, the share of HGV in total CO2 emissions will rise to 7-8% by 2020, which may undermine the EU climate package targets to reduce the emissions of other sectors by 15-20% relative to 2006.
Figure 1 CO2 emissions of HGV, vans and total road transport in the EU-27 and share of these vehicle categories in total CO2 emissions (2006)
0
200
400
600
800
1000
1200
1995 2000 2010 2020 2030
Passenger road Vans HGV
78%
14%2% 6%
Rest of economy Passenger road Vans HGV − As a result of EU emissions standards for tailpipe air pollutant emissions,
the NOx and PM emission factors (emissions per vehicle-km) of HGV have declined significantly since the beginning of the nineties.
− The total HGV emissions of NOX and PM10 have consequently decreased, and they will continue to do so as new emissions legislation is introduced over the next years.
− 210 million people in the EU-253 are exposed to road traffic noise levels over 55dB, leading to annoyance, sleep disturbance, heart disease and in some cases mortality. 47% of the costs associated with traffic noise can be attributed to HGV, reflecting their relative noisiness. Around 21,000 fatal heart attacks annually can be linked to truck noise, and 110,000 cases of ischemic heart disease.
− Based on intrinsic risks, 13% of all road accident fatalities can be attributed to HGV, amounting to around 6,500 fatalities in the EU-27 in 2006. In terms of the number of fatalities per billion vehicle-kilometres, countries with a high average level of safety perform well, but several of these countries have high shares of HGV-related fatalities, implying that safe freight transport is harder to achieve than safe passenger transport. The number of injured people
3 Cyprus and Malta not included.
4.846.1/Are trucks taking their toll? January 2009 2
attributable to accidents involving HGV is about half the number of deaths, reflecting the relatively high fatality rate in such accidents. Per billion vehicle-km, trucks are responsible for twice the number of deaths compared with passenger cars, vans and motorcycles.
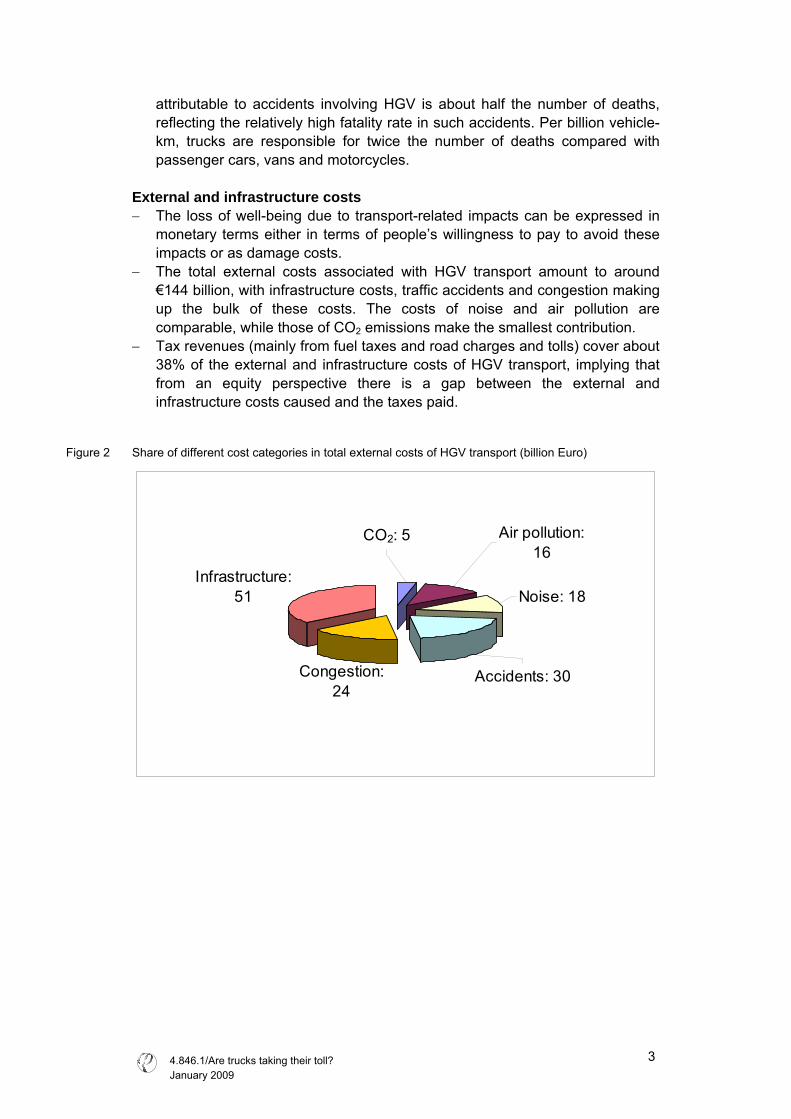
External and infrastructure costs − The loss of well-being due to transport-related impacts can be expressed in
monetary terms either in terms of people’s willingness to pay to avoid these impacts or as damage costs.
− The total external costs associated with HGV transport amount to around €144 billion, with infrastructure costs, traffic accidents and congestion making up the bulk of these costs. The costs of noise and air pollution are comparable, while those of CO2 emissions make the smallest contribution.
− Tax revenues (mainly from fuel taxes and road charges and tolls) cover about 38% of the external and infrastructure costs of HGV transport, implying that from an equity perspective there is a gap between the external and infrastructure costs caused and the taxes paid.
Figure 2 Share of different cost categories in total external costs of HGV transport (billion Euro)
Infrastructure: 51
Accidents: 30
CO2: 5 Air pollution: 16
Noise: 18
Congestion: 24
4.846.1/Are trucks taking their toll? January 2009
3

4.846.1/Are trucks taking their toll? January 2009 4

1 Introduction
1.1 Introduction
Today, European society is highly dependent on freight transport, with people’s welfare and well-being extensively influenced by the capacity to move and transport goods. At the same time, though, there are concerns about the sustainability of transport and its impact on human health and well-being. The dilemma is that all motorised modes of transport serve us well but at the same time harm the environment and local quality of life, albeit to varying degrees. Over the next few decades, reducing the emissions of air pollutants, noise and CO2, as well as reducing the number of fatalities and impacts on biodiversity are issues that will require continuous attention. Consumption patterns may also need to be changed. One means to improve the environmental performance of transport is by internalising the external costs. When it comes to road freight, the Eurovignette Directive on the charging of heavy goods vehicles (HGV) is currently being revised, enabling charging of these vehicles for the marginal social costs of congestion, noise and air pollution to which they give rise. To inform its position on the upcoming Eurovignette debate in the European Parliament and Council, T&E asked CE Delft to assess the contribution of HGV in the EU-27 to emissions of CO2 and air pollutants, noise, traffic accidents and congestion. The contribution of HGV to aggregated, Europe-wide impacts is poorly documented. This is partly to a lack of statistical data, on the total number of vehicle-kilometres, among other things. One consequence of this is that the contribution of the various transport modes to several environmental themes cannot readily be compared.
1.2 Project framework
The goal of this project is: − To provide an overview of trends in the road freight transport sector in terms
of tonne-kilometres and vehicle-kilometres as well as capacity utilisation. − To gather information on the environmental performance (CO2, NOx en PM10
emissions, noise, safety) of HGV as well as congestion costs in relation to the performance of the total freight transport sector and passenger transport by cars at the EU-27 level.
− To weigh up the costs of HGV-related environmental and other impacts against the taxes paid and the value added by the road freight sector.
In this report a heavy goods vehicle is defined as a vehicle with a gross vehicle weight (GVW) of over 3.5 tonnes.
4.846.1/Are trucks taking their toll? January 2009
5
1.3 Report outline
Chapter 2 focuses on historical and projected volume trends in road freight transport (both tonne-km and vehicle-km). Using estimated figures for vehicle-km, in Chapter 3 the CO2, NOX and PM emissions of road freight transport are calculated. This chapter also analyses the contribution of HGV to noise, traffic accidents and congestion. Chapter 4 calculates the costs to society for each of the environmental and other themes considered and compares these with taxes paid.
4.846.1/Are trucks taking their toll? January 2009 6

2 Road freight transport: demand and trends
2.1 Introduction
In this chapter we report trends in road freight transport volumes and consider these in the broader context of total European freight and road passenger transport. We then focus on utilisation of road freight transport capacity in the various EU countries. As the environmental impacts calculated in Chapter 3 are linked more closely to vehicle-kilometres than tonne-kilometres, we will estimate the former as well. Tonne-kilometre data are available from Eurostat transport statistics. Vehicle-kilometres are not available on such an aggregated scale, however, and for this purpose we therefore used data from the TREMOVE model, version 2.7 (see textbox below).
A brief description of the TREMOVE model TREMOVE is a model that estimates the effects of particular political decisions on demand for transport, the corresponding emissions and energy consumption, and welfare. The model has been developed by the Catholic University of Leuven and Transport and Mobility Leuven. It takes into account passenger as well as freight transport and includes data for 31 countries in Europe. Input to the tool consists of political choices on the basis of which results are calculated in several modules (transport demand, vehicle stock, fuel consumption, emissions and welfare), yielding, among other data, the number of kilometres covered annually by each mode in each country and the corresponding emissions of air pollutants and greenhouse gases.
2.2 Demand trends (tonne-km)
Demand for road freight transport can be illustrated by two indicators. The first is total demand for such transport. The second indicator is the ‘modal split’, i.e. the relative share of transport demand attributable to road transport compared with other modes. There are several sources that report on total transport demand as well as on the modal split. These show broad similarity on their figures for both current and future total transport demand (TREMOVE; Eurostat; DG TREN outlook to 20304). Total freight transport demand (all modes) is projected to rise from around 2,500 billion tonne-km in 2005 to around 3,800 billion tonne-km in 2030, a growth of 52%. Fuel prices play a major role in demand for transport. The cited projections are from ‘baseline scenarios’ keyed to the current policy and economic context.
4 The projections of DG TREN are based on oil prices increasing from 55 $/barrel in 2005 to 63 $/barrel in
2030 (2005 prices).
4.846.1/Are trucks taking their toll? January 2009
7

What interests us here, however, is road freight transport demand and therefore the estimated modal split. This split is estimated by both DG TREN and TREMOVE, as depicted in Figure 3.
Figure 3 Modal split of freight transport in 2005 and 2030 according to DG TREN and TREMOVE
Note: Due to rounding, the percentages in the first figure sum to 101%.
DG TREN projects a slight decrease in the share of road transport between 2005 and 2030 (from 77% to 75%). TREMOVE, however, predicts a modal shift towards road transport, with the share of road transport increasing from 78% in 2005 to 83% in 2030. The total demand for road freight transport predicted by TREMOVE is consequently slightly higher than that projected by DG TREN; this is illustrated in Figure 4.
DG TREN 2005
Road; 77%
Rail; 18%
Inland shipping; 6%
TREMOVE 2005
Road; 78%
Rail; 16%
Inland shipping; 6%
DG TREN 2030
Road; 75%
Rail; 15%
Inland shipping;
10%
TREMOVE 2030
Road; 83%
Rail; 12%
Inland shipping; 5%
4.846.1/Are trucks taking their toll? January 2009 8
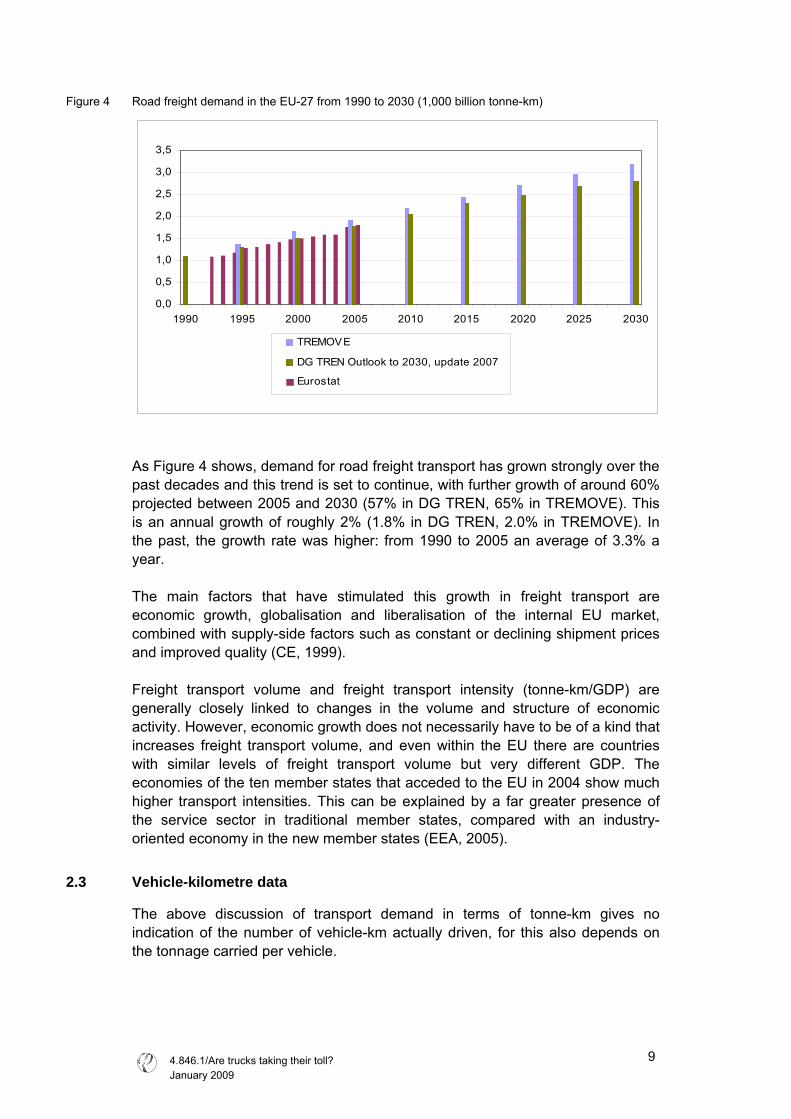
Figure 4 Road freight demand in the EU-27 from 1990 to 2030 (1,000 billion tonne-km)
0,0
0,5
1,0
1,5
2,0
2,5
3,0
3,5
1990 1995 2000 2005 2010 2015 2020 2025 2030
TREMOVE
DG TREN Outlook to 2030, update 2007
Eurostat
As Figure 4 shows, demand for road freight transport has grown strongly over the past decades and this trend is set to continue, with further growth of around 60% projected between 2005 and 2030 (57% in DG TREN, 65% in TREMOVE). This is an annual growth of roughly 2% (1.8% in DG TREN, 2.0% in TREMOVE). In the past, the growth rate was higher: from 1990 to 2005 an average of 3.3% a year. The main factors that have stimulated this growth in freight transport are economic growth, globalisation and liberalisation of the internal EU market, combined with supply-side factors such as constant or declining shipment prices and improved quality (CE, 1999). Freight transport volume and freight transport intensity (tonne-km/GDP) are generally closely linked to changes in the volume and structure of economic activity. However, economic growth does not necessarily have to be of a kind that increases freight transport volume, and even within the EU there are countries with similar levels of freight transport volume but very different GDP. The economies of the ten member states that acceded to the EU in 2004 show much higher transport intensities. This can be explained by a far greater presence of the service sector in traditional member states, compared with an industry-oriented economy in the new member states (EEA, 2005).
2.3 Vehicle-kilometre data
The above discussion of transport demand in terms of tonne-km gives no indication of the number of vehicle-km actually driven, for this also depends on the tonnage carried per vehicle.
4.846.1/Are trucks taking their toll? January 2009
9
TREMOVE is the only source providing information on vehicle-km in the EU-27. Although there are no statistical data available at this aggregated level, many EU countries do gather such data at the national level. The TREMOVE data can be verified by examining the assumed average load of an HGV, obtained by dividing tonne-km by vehicle-km. While data on vehicle loading was not found at the EU level, either, such data is available for the Netherlands and for Germany. The average load is 6.5 tonnes per vehicle. TREMOVE estimates an increase of 2% in load between 1990 and 2030 (0.1% annually), implying a slight improvement in transport efficiency in the coming decades. By comparing load figures from other sources, the reliability of TREMOVE can be assessed. The average load in TREMOVE is comparable with German data from the TREMOD5 model (6.8 tonne/vehicle), developed for the German Environment Ministry. Dutch data give an average figure of 8.0 tonnes/vehicle (CBS, 2008). The German Federal Motor Transport Authority reports an average of 10.9 tonne/vehicle, but this seems to exclude smaller lorries, as the maximum payload is 19 tonnes, on average, compared with 25 for a 40-tonne HGV (KBA, 2007). From this comparison it might be concluded that the vehicle-km reported in TREMOVE is a slight overestimate of the actual situation. However, this is not confirmed by the estimate of COPERT (EEA, 2008a) for the number of vehicle-km in 2005 in the EU-15. This source provides an estimate that is almost 60% higher than the corresponding figure according to TREMOVE. TRENDS (EEA, 2003) provides information on the EU-15 as well, and again these data are far higher than the TREMOVE data6. Figure 5 shows the original data on vehicle-km in the EU-27 from the TREMOVE basecase (TREMOVE: 6.5 tonne/vehicle). It also shows the vehicle-km, assuming an average load of 8 tonne/vehicle. The estimation from COPERT for 2005 is for the EU-15 and is still very much higher than the TREMOVE data for the EU-27.
5 TREMOD stands for Transport Emission Model. 6 In this comparison vans were included in both the TRENDS data and the TREMOVE data.
4.846.1/Are trucks taking their toll? January 2009 10

Figure 5 HGV vehicle-km in the EU-27 (TREMOVE) and EU-15 (COPERT) (1,000 million vkm)
0
100
200
300
400
500
600
1995 2000 2005 2010 2015 2020 2025 2030
TREMOVE baseline (6.5 tonne/veh)TREMOVE (based on 8 tonne/veh)Copert EU-15
As TREMOVE is the only source of data with EU-27 coverage, the TREMOVE vehicle-km data will be used for calculating emissions. It should be borne in mind, however, that the TREMOVE data need to be interpreted with care. To put the vehicle-km of freight transport in the overall context of road transport, Figure 6 shows the vehicle-km reported by TREMOVE for passenger transport and freight transport by HGV and vans. The share of HGV in total road vehicle-kilometres is projected to increase from 7% in 1995 to 9% in 2030.
Figure 6 Vehicle-km in the EU-27 of HGV, all road freight transport and all road transport (1,000 million vkm)
0
1000
2000
3000
4000
5000
6000
1995 2000 2005 2010 2015 2020 2025 2030
HGVVansPassenger road transport
4.846.1/Are trucks taking their toll? January 2009
11

2.4 Vehicle utilisation
HGV load factors are generally below the theoretical maximum, as depicted in Figure 7. Overall vehicle utilisation is influenced by two factors: the loaded trip and the empty return run. While it is relatively easy to achieve full load on an outward trip, it is a complex puzzle to find return loads and empty return trips are therefore frequent. In addition, transport of certain goods requires specialised vehicles, making it impossible to find return loads – a petrol tanker can carry neither milk nor pallets on the return run. Loads are further constrained by volume or deck space, making it impossible to achieve the theoretical maximum.
Figure 7 Utilisation factors in road freight transport (% use of tonne-km available)
20%
30%
40%
50%
1990 1992 1994 1996 1998 2000 2002 2004 2006
The NetherlandsUnited kingdomDenmarkGermany
HGV-charge introduction
Note: Vehicles over 3.5 tonne GVW covered, except for Denmark. For Denmark, vehicles over 6 tonne
GVW are covered. Source: Official national statistics.
A marked development is the falling trend in several countries, except for Germany which shows a more or less stable utilisation7. The falling trends may be due to the fact that shipping companies are often more concerned with efficient time management than efficient transport, resulting in a growing number of trips and a declining size of shipment (TNO, 1999), thereby contributing to lower efficiencies. ‘Just-in-time’ deliveries may be reinforcing this trend. On the other hand, increased use of IT has contributed to better fleet management and may have compensated somewhat. This is not reflected by the available data, however. After introduction of the German HGV charge there was slight decrease in the share of empty running. Some sources mention a decrease in empty running of 7 Germany introduced road tolls in 2005, which is indicated in the graph.
4.846.1/Are trucks taking their toll? January 2009 12
about 13% over one year (BAG, 2006). Other sources tell that this trend had been apparent for a number of years already and was not significantly affected by introduction of the charge (BGL, 2007b). In Switzerland the average load increased by 10.6% (inland traffic) and the number of vehicle-km decreased significantly (a reduction of 23% compared with business as usual) with the introduction of the HGV charge. However, it should be noted that there was also a simultaneous increase in the vehicle weight limit (ARE, 2007). It is unclear to what extent these changes can be attributed to introduction of the charge. The load factor is influenced by several parameters, including cargo type and shipping distance. This is illustrated in Figure 8.
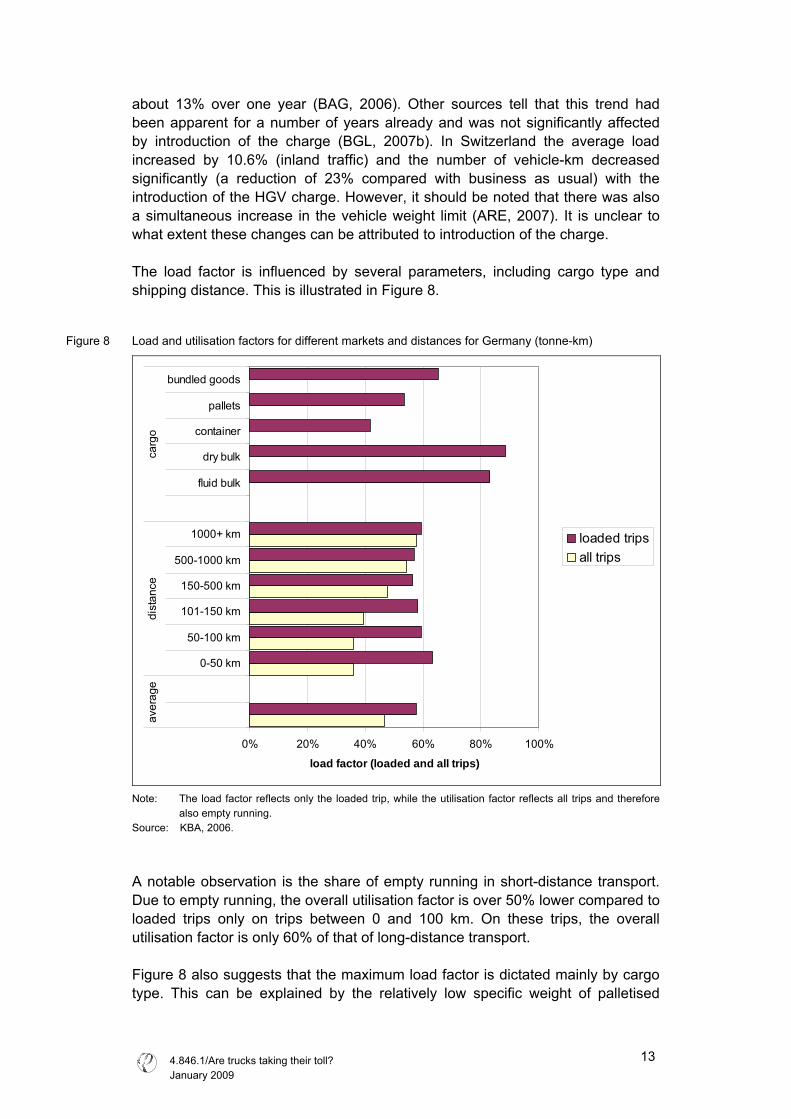
Figure 8 Load and utilisation factors for different markets and distances for Germany (tonne-km)
0% 20% 40% 60% 80% 100%
0-50 km
50-100 km
101-150 km
150-500 km
500-1000 km
1000+ km
fluid bulk
dry bulk
container
pallets
bundled goods
aver
age
dist
ance
carg
o
load factor (loaded and all trips)
loaded tripsall trips
Note: The load factor reflects only the loaded trip, while the utilisation factor reflects all trips and therefore
also empty running. Source: KBA, 2006.
A notable observation is the share of empty running in short-distance transport. Due to empty running, the overall utilisation factor is over 50% lower compared to loaded trips only on trips between 0 and 100 km. On these trips, the overall utilisation factor is only 60% of that of long-distance transport. Figure 8 also suggests that the maximum load factor is dictated mainly by cargo type. This can be explained by the relatively low specific weight of palletised
4.846.1/Are trucks taking their toll? January 2009
13

goods and containers. On the other hand, even for high-density goods the load factor of loaded trips is still below the theoretical maximum. That there is scope for improving load factors above the current average is illustrated in the textbox below.
Different measures of vehicle fill Traditionally, load factors are measured as the percentage utilisation of a vehicle’s maximum available weight capacity. However, there are frequent situations in which the vehicle, while fully loaded, is still far from making full use of its maximum weight capacity. High-volume/low-weight goods provide a typical example. Ideally, this should be taken into account. In the United Kingdom several surveys have been carried out to investigate different measures of vehicle fill. The results show that in most cases the limiting factor was available deck space (usually measured in numbers of pallets). The graph reproduced here also shows that the spread around the average varies significantly for the different vehicle fleets, suggesting significant room for improvement.
Figure 9 Percentage vehicle utilisation across 22 fleets in the UK in non-food retail distribution
Source: DfT, 2003.
4.846.1/Are trucks taking their toll? January 2009 14

3 Environmental and other impacts of road freight transport
3.1 Introduction
In this chapter we discuss the pressures on the environment and society caused by road freight transport. We successively examine greenhouse gas emissions, air pollutants, noise exposure, safety and congestion.
3.2 Fuel consumption, greenhouse gases and air pollution
Ideally, HGV fuel consumption should be directly available from fuel sales statistics. However, EU statistics do not distinguish between fuel tanked by lorries and by passenger vehicles and vans. HGV fuel consumption therefore needs to be calculated by means of a bottom-up calculation proceeding from mileage (TREMOVE) and per-kilometre fuel consumption. Below we describe the method used here to estimate the fuel consumption and CO2 and air pollutant emissions of heavy goods vehicles.
3.2.1 Methodology
To estimate total HGV emissions in the EU-27, we calculate the product of the aggregate number of vehicle kilometres (vkm) and the tank-to-wheel emission factors (g/vkm) for the greenhouse gas CO2 and the air pollutants NOx and PM10. Figure 10 illustrates the methodology. The total number of vkm in the EU-27 have already been estimated in Chapter 2. In this chapter we examine the emissions per vkm and subsequently the total emissions per pollutant (a synopsis is provided in Appendix A). Before the total emissions are calculated, in Section 3.2.2 the emission factors from two different leading sources will be compared, so as to guarantee the quality of the results.
4.846.1/Are trucks taking their toll? January 2009
15

Figure 10 Schematic overview of methodology for emission estimation
Vehicle-kilometres
Emission factors
Total emissions
Tonne-kilometres(Eurostat)
Emission measurement (HBEFA, COPERT)
Chapter 2 Chapter 3
x =
We estimate emissions on the basis of vkm rather than tonne-km, because the various forms of environmental pressure are linked to actual vehicle-kilometres driven rather than tonnes carried. Emission factors are principally on laboratory emission measurements on vehicle tailpipes, representing on-road conditions.
3.2.2 Comparison of emission factors
In Europe there are two leading sources of vehicle emission factors: the Handbook of Emission Factors for Road Transport (HBEFA8) published by INFRAS consulting group and COPERT data from the European Topic Centre on Air and Climate Change (part of the European Environment Agency, EEA). The COPERT data do not provide straightforward emission factors, but calculate the emission factor as a function of speed, road type, gradient, vehicle age, etc. TREMOVE, however, provides emission factors. These emission factors are based on the COPERT methodology. To make a comparison of emission factors, average numbers could be extracted from TREMOVE as well as from HBEFA. These averages are based on the average situation (speed, gradient, etc.) in Europe. There may however be differences between the two sources, in the assumptions for this average situation. Below we present average emission factors for CO2 and air pollutants as well as those for particular vehicles under particular circumstances (for example, a 3.5-10 tonne HGV on a flat, motorway trajectory). This permits comparison not only of actual emission factors but also of assumptions about the ‘average’ HGV.
8 http://www.hbefa.net/
4.846.1/Are trucks taking their toll? January 2009 16
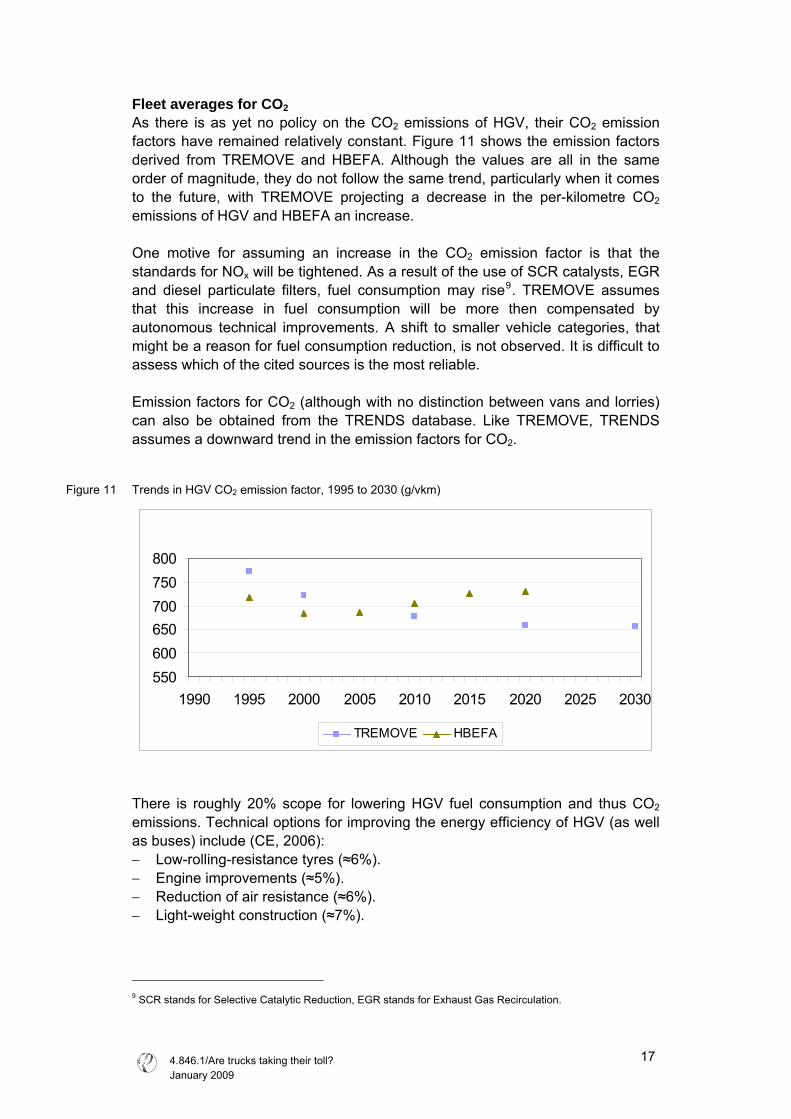
Fleet averages for CO2 As there is as yet no policy on the CO2 emissions of HGV, their CO2 emission factors have remained relatively constant. Figure 11 shows the emission factors derived from TREMOVE and HBEFA. Although the values are all in the same order of magnitude, they do not follow the same trend, particularly when it comes to the future, with TREMOVE projecting a decrease in the per-kilometre CO2 emissions of HGV and HBEFA an increase. One motive for assuming an increase in the CO2 emission factor is that the standards for NOx will be tightened. As a result of the use of SCR catalysts, EGR and diesel particulate filters, fuel consumption may rise9. TREMOVE assumes that this increase in fuel consumption will be more then compensated by autonomous technical improvements. A shift to smaller vehicle categories, that might be a reason for fuel consumption reduction, is not observed. It is difficult to assess which of the cited sources is the most reliable. Emission factors for CO2 (although with no distinction between vans and lorries) can also be obtained from the TRENDS database. Like TREMOVE, TRENDS assumes a downward trend in the emission factors for CO2.
Figure 11 Trends in HGV CO2 emission factor, 1995 to 2030 (g/vkm)
550600650700750800
1990 1995 2000 2005 2010 2015 2020 2025 2030
TREMOVE HBEFA
There is roughly 20% scope for lowering HGV fuel consumption and thus CO2 emissions. Technical options for improving the energy efficiency of HGV (as well as buses) include (CE, 2006): − Low-rolling-resistance tyres (≈6%). − Engine improvements (≈5%). − Reduction of air resistance (≈6%). − Light-weight construction (≈7%).
9 SCR stands for Selective Catalytic Reduction, EGR stands for Exhaust Gas Recirculation.
4.846.1/Are trucks taking their toll? January 2009
17

Fuel efficiency standards, currently under discussion (as they are for passenger cars), may help reduce HGV fuel consumption. Japan has set target values that aim to improve fuel economy of HGV’s by about 12% between 2002 and 2015.
Fleet averages for NOx and PM Emission factors for air pollutants are regulated by the so-called ‘Euro’ standards. These EU standards for all newly sold vehicles were introduced around 1990 and are progressively tightened every 3 to 6 years. Thanks to these standards there has been a steady decline in the air pollutant emission factors of the average fleet. Figure 12 and Figure 13 show fleet-average emission factors as estimated by HBEFA and TREMOVE.
Figure 12 Trends in HGV fleet-average NOx emission factor, 1995 to 2030 (g/vkm)
02468
1012
1990 1995 2000 2005 2010 2015 2020 2025 2030
TREMOVE HBEFA
Figure 13 Trends in HGV fleet-average PM emission factor, 1995 to 2030 (g/vkm)
0.00
0.10
0.20
0.30
0.40
0.50
1990 1995 2000 2005 2010 2015 2020 2025 2030
TREMOVE HBEFA
4.846.1/Are trucks taking their toll? January 2009 18

It should however be noted that measured results of roadside air quality fall short of the emissions reductions predicted by modelling. This is due to a discrepancy between test cycle emissions performance and real world emissions performance when driving (Hörmandinger, 2007).
Emission factors per vehicle In addition, the emission factors of individual vehicles have been investigated in greater detail. As Figure 14 shows, the emission factors for ‘Euro 2’ vehicles given by HBEFA and TREMOVE are in fairly close agreement, though the former are consistently slightly lower. This may be due to minor differences in assumed engine load and vehicle speed between the two. For other ‘Euro’ emission classes, the differences are also limited.
Figure 14 Emission factors for CO2, NOx and PM of a Euro 2 HGV with a GVW of <7.5 tonne and >32 tonne on a flat motorway (g/vkm)
0
200
400
600
800
1000
1200
CO2 (g/km) NOx (100 g/km) PM (mg/km)
TREMOVE, <7,5HBEFA, <7,5TREMOVE, >32HBEFA, >32
Note: Note the different scales used.
The differences between TREMOVE and HBEFA are thus limited, and in the following sections we calculate the total emissions of CO2 and air pollutants of HGV transport using the TREMOVE figures.
3.2.3 Total fuel consumption and CO2 emissions
The total CO2 emissions and total fuel consumption of the various segments of the road vehicle fleet can be calculated by multiplying vehicle-kilometres by CO2 emission factors and fuel consumption data, respectively. Figure 15 reports projected trends in the total CO2 emissions of lorries, vans and passenger road vehicles in the EU-27. According to these data, the total CO2 emissions of HGV are set to increase by around 55% between 2005 and 2030. This growth far exceeds that projected for passenger cars, for which CO2 legislation will have a significant impact over the coming decades. As a
4.846.1/Are trucks taking their toll? January 2009
19

consequence, the share of HGV in total road transport CO2 emissions will increase from 21% in 1995 to an estimated 29% in 2030.
Figure 15 CO2 emissions from HGV and total road transport in the EU-27 according to TREMOVE (Mtonne, excl. WTT).
0
200
400
600
800
1000
1200
1995 2000 2010 2020 2030
Passenger road Vans HGV
Note: For the exact figures, see Appendix A. ‘Passenger road’ is defined as all road vehicle categories (incl. passenger cars, motorcycles and buses).
Fuel consumption is directly linked to CO2 emissions and will therefore follow the same trends. Total HGV fuel consumption is projected to increase from 2,385 PJ in 1995 to 4,653 PJ in 2030. This means that both fuel consumption and CO2 emissions will have increased by 95% over the period 1995-203010. The cost of oil imports for road freight transport Every year around 500 million barrels of oil are needed to fuel European lorries. Generally, 85% of the oil consumed in the EU derives from imports from outside the EU (DG TREN, 2007). The main regions for oil imports are the Middle East and Russia, each responsible for a third of EU imports. Assuming a price of 100 $ per barrel – the average between the summer and autumn of 2008 – and an exchange rate of 1.3511, the total costs of oil imports for road freight transport amount to 60 billion Euro a year (based on 2005 energy consumption data). TREMOVE HGV CO2 emissions versus fuel consumption data We compared the TREMOVE CO2 emissions figures with national road transport CO2 emission data for all EU-27 countries, gathered for official submission to
10 Biofuels may reduce vehicle CO2 emissions slightly, on average, while increasing emissions in other sectors
because of greenhouse gas emissions during crop growing and fuel production. As it is limited, this effect has not been included.
11 Derived from ECB on 16 October 2008: http://www.ecb.eu/stats/exchange/eurofxref/html/eurofxref-graph-usd.en.html
4.846.1/Are trucks taking their toll? January 2009 20

UNFCCC. The latter are based on national fuel sales and their accuracy can therefore be assumed to be high. As Figure 16 shows, the total CO2 emissions estimated using TREMOVE correspond closely with the data submitted to UNFCCC. In the case of diesel fuel consumption, however, the TREMOVE estimate is 13% lower, implying that TREMOVE may underestimate the CO2 emissions of HGV. This is taken into account below. Unfortunately, though, it is not feasible to check these total HGV CO2 emissions against any figures for diesel sales specifically to HGV, because no such division is made in fuel sales statistics.
Figure 16 Comparison of TREMOVE data with data for UNFCCC submission (2005, Mtonne)
0100200300400500600700800900
1000
UNFCCC EU-15 TREMOVE EU-15 UNFCCC EU-27 TREMOVE EU-27
diesel petrol
Note: LPG is not included; in EU-27 its share in the fuel mix is under 1%, however. As TREMOVE provides estimates for 2000 and 2010 only, the 2005 figure has been linearly interpolated.
Source: EEA, 2008b.
The share of road transport in total CO2 emissions Using the data submitted to UNFCCC by the 27 countries of the EU, the contribution of HGV (based on TREMOVE) to total reported CO2 emissions can be calculated. This comparison can be made either on the basis of CO2 emissions only, or on the basis of all greenhouse gas (GHG) emissions (i.e. also including the non-CO2 emissions of methane and N2O). Although non-CO2 emissions are not very relevant for transport, they are for agriculture and livestock breeding, for example. Figure 17 shows the share of road transport in total CO2 and total GHG emissions. Restricting the scope to CO2 emissions (e.g. from fossil fuel burning), road transport is responsible for 21% of total emissions and HGV transport for 5-6%. If non-CO2 emissions are also taken into account, the overall share of total transport is 17% and that of HGV 4-5%. The bandwidth is due to the allocation the underestimation of diesel consumption in TREMOVE to passenger transport (low estimate) and vans or to trucks (high estimate).
4.846.1/Are trucks taking their toll? January 2009
21

Figure 17 Share of road transport in total GHG emissions, 2006: A) non-CO2 emissions included; B) NOT included
A) B)
83%
12% 1% 4%
Rest of economy Passenger road Vans HGV
78%
14%2% 6%
Rest of economy Passenger road Vans HGV Note: ‘Rest of economy’ emissions include bunker fuels and do not include Land Use, Land Use Change
and Forestry. Transport emissions cover only tank-to-wheel emissions. Well-to-tank emissions are covered under ‘rest of economy’.
HGV emissions are raised with 6%, assuming that the underestimate of diesel consumption in TREMOVE is equally divided over HGV and passenger cars and vans.
Source: EEA, 2008b.
Although the EU’s climate package will be having an impact by 2020, transport emissions will continue to grow, with the share of transport in total CO2 emissions increasing to 30% if emissions remain stable in other sectors compared with 2006, or to 38% if emissions in other sectors decline by 15-20% compared with 2006. With these assumptions, the share of HGV in total CO2 emissions is expected to increase to 7-8%.
3.2.4 Total emissions of air pollutants
As with CO2 emissions, total HGV emissions of NOx and PM are calculated by multiplying vehicle-kilometres by the corresponding emission factors. Figure 18 presents the total NOx emission from lorries. The share of this vehicle category in total road transport NOX emissions is projected to increase from 35% in 1995 to 67% in 2030. This is due to two factors: the more pronounced reduction in passenger car emission factors and the greater anticipated volume growth for HGV. As a control, we compared the figures for total road transport emissions according to the TREMOVE model and the EMEP database12. For total NOx emissions these two sources give very similar figures. Figure 19 presents the total PM emissions of HGV as well as total road transport as reported by TREMOVE. As can be seen, the trend for PM differs from that for NOx, with the share of HGV in total road transport emissions remaining more or less constant at around 35%.
12 EMEP (European Monitoring and Evaluation Programme) is a scientifically based and policy-driven
programme under the Convention on Long-range Transboundary Air Pollution on international cooperation to resolve transboundary air pollution problems.
4.846.1/Are trucks taking their toll? January 2009 22
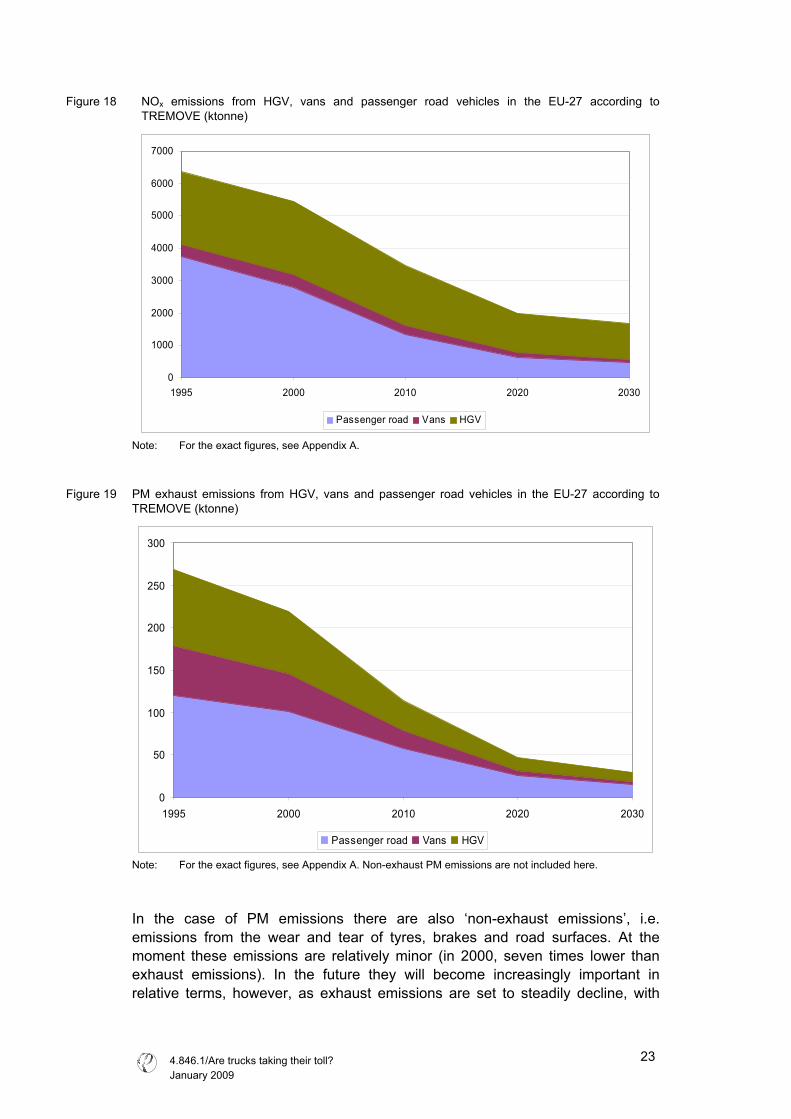
Figure 18 NOx emissions from HGV, vans and passenger road vehicles in the EU-27 according to TREMOVE (ktonne)
0
1000
2000
3000
4000
5000
6000
7000
1995 2000 2010 2020 2030
Passenger road Vans HGV
Note: For the exact figures, see Appendix A.
Figure 19 PM exhaust emissions from HGV, vans and passenger road vehicles in the EU-27 according to TREMOVE (ktonne)
0
50
100
150
200
250
300
1995 2000 2010 2020 2030
Passenger road Vans HGV
Note: For the exact figures, see Appendix A. Non-exhaust PM emissions are not included here.
In the case of PM emissions there are also ‘non-exhaust emissions’, i.e. emissions from the wear and tear of tyres, brakes and road surfaces. At the moment these emissions are relatively minor (in 2000, seven times lower than exhaust emissions). In the future they will become increasingly important in relative terms, however, as exhaust emissions are set to steadily decline, with
4.846.1/Are trucks taking their toll? January 2009
23

non-exhaust emissions remaining constant. In 2030, total non-exhaust emissions will be an estimated 1.6 times greater than total exhaust emissions; for the exact values, see Appendix A. The above emission estimates are based on the assumption that emission legislation will be fully effective. The emissions factors used to calculate future air pollutant emissions are based on the test cycle rather than real world driving performance. There is a discrepancy between real world emissions and test cycle performance. Therefore the future air pollutant emissions for all types of vehicle may be underestimated above. As long as the test cycle for type approval is not representative of actual operation of HGV engines, the potential effect of emission legislation may not be fully measurable on vehicle tailpipes on the roads. Because real-world emissions are higher than projected on the basis of emission standards, there is a delay in the improvement of air quality. Air pollution currently leads to some 330,000-350,000 premature deaths a year in the EU-2513. The severest human health effects are due to exposure to PM2.5. Most PM2,5 emissions result from fossil fuel combustion, with HGV traffic contributing significantly (Watkiss, 2005).
3.3 Noise
The most widespread problem caused by exposure to traffic noise is simply annoyance. It is the main cause of sleep disturbance. Among the ways annoyance can express itself are fear, uncertainty and mild anger. The degree of annoyance triggered by noise is determined first of all by the noise level, but is also affected by acoustic and personal factors. Night-time noise exposure can lead to sleep disturbance and has a negative effect on the functioning of the human body, via increased blood pressure and increased (stress) hormone levels. In addition, traffic noise exposure can lead to cardiovascular diseases, disturbed cognitive functioning and intensified mental illness. The mechanisms are shown schematically in Figure 20.
13 Excluding Romania and Bulgaria.
4.846.1/Are trucks taking their toll? January 2009 24

Figure 20 The mechanisms of noise-induced health effects
Source: CE, 2007b.
In the year 2000, over 210 million people were exposed to harmful road traffic noise of 55 dB or more in the EU-2514, with over 54 million exposed to levels of 65dB (CE, 2007b); see Figure 21. For comparison, the number of people exposed to rail noise is also shown. More people are exposed to road transport noise, but the volume of shipped freight is also significantly greater than for rail. The data in this figure are for the year 2000. Given growth in traffic volumes and the fact that legislation and standards have hardly changed in the meantime, these exposure figures probably underestimate the true extent of the problem.
Exposure to sound
Other determinants of: • Physical
environment • Social
environment • Lifestyle
Processing by the organism
Genetic and acquired characteristics
(attitude, sensitivity, coping style, etc.)
Disturbance of sleep, activities, performance,
concentration.
Annoyance and stress
Biological risk factors (blood dynamics, hormones)
Cardiovascular diseases, psychiatric disorders
Appraisal as noise
Vegetative response
Environment Health effects
14 Data for Cyprus and Malta is not available.
4.846.1/Are trucks taking their toll? January 2009
25

Figure 21 Number of people exposed to road and rail traffic noise in 25 EU countries in 2000
0
40
80
120
160
200
55-65 dB 65-70 dB > 70 dB
mill
ions
of p
eopl
e ex
pose
d
RoadRail
Note: This figure covers the EU-27 except Cyprus and Malta. Source: INFRAS/IWW (2004), OECD/INFRAS/Herry (2002), calculations by CE Delft (for Estonia,
Latvia, Lithuania).
Now that the total number of people exposed to traffic-related noise has been estimated, the question remains as to how the nuisance is to be attributed to the various vehicle categories and how the different degrees of exposure are to be taken into account. In (CE, 2007b) the number of people exposed in the different noise categories presented in Figure 21 were valuated using their willingness to pay for noise reduction, and the total sum allocated across the various vehicle classes on the basis of their actual contribution to noise emissions, calculated from vehicle-kilometre data and weighting factors reflecting the noise emission of a single vehicle. Figure 22 shows the resultant figures for the noise-related costs of the different vehicle classes.
4.846.1/Are trucks taking their toll? January 2009 26

Figure 22 Share of vehicle classes in total noise-related costs in 22 EU countries (EU-27 minus Cyprus, Estonia, Latvia, Lithuania and Malta)15
Light-duty vehicle48%
Heavy-duty vehicle47%
Bus1%Motorcycle
4%
Note: Light-duty vehicle covers both passenger cars and vans. Source: CE, 2007b.
Figure 22 shows that lorries are responsible for 47% of the total noise-related costs to society of road transport. These costs include both annoyance and health effects like heart attacks. Based on the number of people exposed to noise levels over 60 dB and probability figures for heart diseases from Germany, Denmark and the Netherlands, the number of fatal heart attacks that can be attributed to HGV is approximately 21,000 in the EU-25, the same as the number attributable to the noise of light-duty vehicles. In addition, around 110,000 people are affected by ischemic heart disease16 due to exposure to lorry noise (CE, 2007b).
15 The EU-22 covers 98.4% of the EU-27’s population. 16 Ischemic heart disease is a disease characterised by reduced blood supply to the heart muscle.
4.846.1/Are trucks taking their toll? January 2009
27
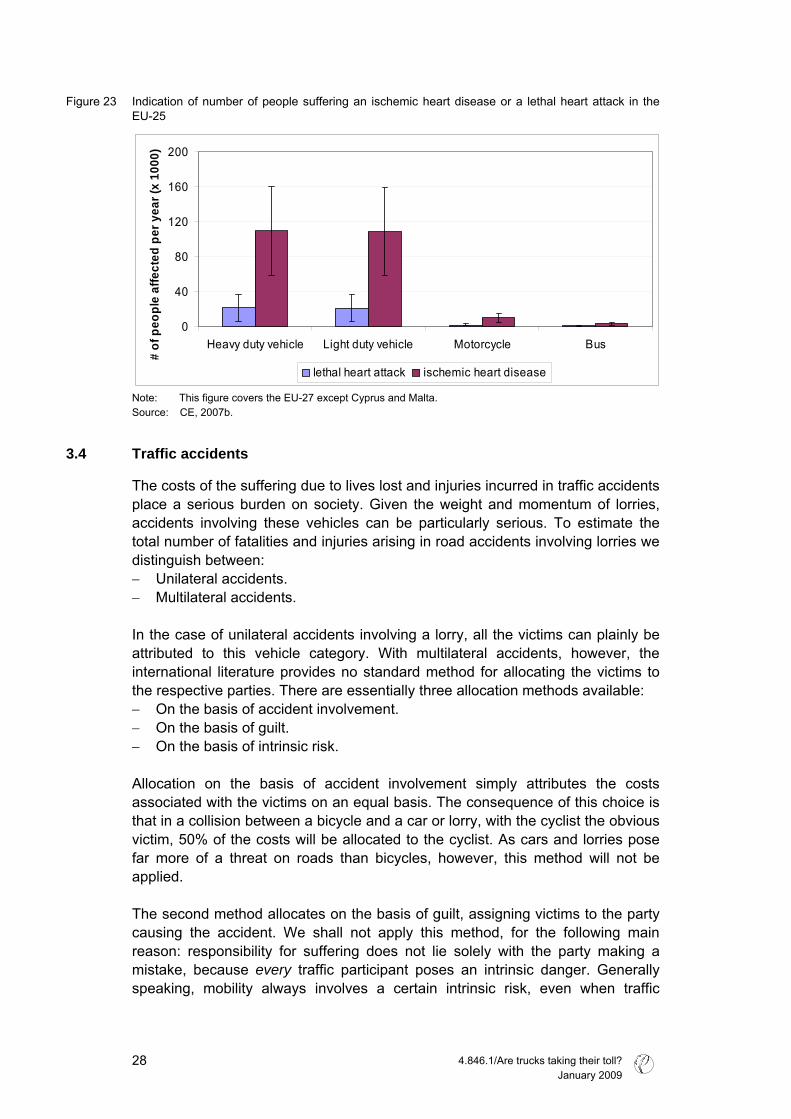
Figure 23 Indication of number of people suffering an ischemic heart disease or a lethal heart attack in the EU-25
0
40
80
120
160
200
Heavy duty vehicle Light duty vehicle Motorcycle Bus
# of
peo
ple
affe
cted
per
yea
r (x
1000
)
lethal heart attack ischemic heart disease
Note: This figure covers the EU-27 except Cyprus and Malta. Source: CE, 2007b.
3.4 Traffic accidents
The costs of the suffering due to lives lost and injuries incurred in traffic accidents place a serious burden on society. Given the weight and momentum of lorries, accidents involving these vehicles can be particularly serious. To estimate the total number of fatalities and injuries arising in road accidents involving lorries we distinguish between: − Unilateral accidents. − Multilateral accidents. In the case of unilateral accidents involving a lorry, all the victims can plainly be attributed to this vehicle category. With multilateral accidents, however, the international literature provides no standard method for allocating the victims to the respective parties. There are essentially three allocation methods available: − On the basis of accident involvement. − On the basis of guilt. − On the basis of intrinsic risk. Allocation on the basis of accident involvement simply attributes the costs associated with the victims on an equal basis. The consequence of this choice is that in a collision between a bicycle and a car or lorry, with the cyclist the obvious victim, 50% of the costs will be allocated to the cyclist. As cars and lorries pose far more of a threat on roads than bicycles, however, this method will not be applied. The second method allocates on the basis of guilt, assigning victims to the party causing the accident. We shall not apply this method, for the following main reason: responsibility for suffering does not lie solely with the party making a mistake, because every traffic participant poses an intrinsic danger. Generally speaking, mobility always involves a certain intrinsic risk, even when traffic
4.846.1/Are trucks taking their toll? January 2009 28

regulations are adhered to. This is the case with a car entering a residential area, but is equally true on the motorway. Vehicles that are faster and heavier obviously pose a greater threat, an intrinsic risk that can be clearly derived from the statistics. In an accident involving a passenger car and a lorry, the driver of the former has a far smaller chance of survival than the lorry driver. Even though the latter may not be guilty of making a mistake, then, the mere presence of lorries on the roads creates a responsibility for the severity of the accidents they are involved in. The principle of intrinsic risks is also applied in the law as a means of protecting vulnerable road users like pedestrians and cyclists. The question now is how the notion of intrinsic risk can be used to derive a key for allocating costs across the various vehicle categories. Here, we have opted to allocate victims inside the lorry to the opposite party in multilateral accidents and vice versa. Data is derived from accident statistics, since a combination of the EU CARE database and national statistics indicates how casualties are distributed across HGV and other categories in multiple-vehicle accidents.
3.4.1 Fatalities due to accidents involving HGV
From an analysis of the CARE database, which contains national data on multilateral accidents from 20 EU countries, it can be derived that HGV are involved in 14% of all road traffic accidents leading to fatalities; see Figure 24.
Figure 24 Percentage of road accident fatalities arising in accidents involving HGV
0%
2%
4%
6%
8%
10%
12%
14%
16%
18%
20%
1990 1992 1994 1996 1998 2000 2002 2004 2006
Note: Countries included: Austria, Belgium, Czech Republic, Denmark, Estonia, Finland, France, Great
Britain, Greece, Hungary, Ireland, Italy, Luxembourg, Malta, the Netherlands, Northern Ireland, Poland, Portugal, Spain, Sweden. Since 2005 data availability has been lower, causing the spike in 2005. Data availability since 1996 can be derived from Appendix B.
Source: CARE database.
This database also includes data on the number of fatalities among lorry drivers and co-drivers. According to the method chosen, fatalities inside the lorry in a multilateral lorry accident need to be attributed to the opposite party. On the basis
4.846.1/Are trucks taking their toll? January 2009
29

of statistical data from the Netherlands and Germany, the share of deaths inside the lorry in multilateral accidents is estimated at around 8% of the total number of fatalities arising in such accidents. This implies that the total share of deaths that can be attributed to lorries is 13%17. A share of around 8% of the fatalities in lorries in multilateral accidents means that by far the majority of fatalities are in the other vehicle. The number of people killed on the roads in the EU-27 in 2006 was almost 43,000. This means that almost 6,500 fatalities can be attributed to lorries. See Table 1.
Table 1 Fatalities attributable to HGV in the EU-27
Total no. of fatalities in the EU-27 (2006) 42,953Share of fatalities attributable to HGV 13%Total no. of fatalities attributable to HGV in the EU-27 6,443
Source: CARE database.
Lorries can be compared with vans and passenger cars by calculating the respective number of fatalities per vehicle-km. Using the vehicle-km data from Section 2.3, we calculate that lorries are responsible for 21 fatalities per billion vehicle-km. Other vehicles (vans, passenger vehicles and motorcycles) are responsible for 11 fatalities per billion vehicle-km. Heavy goods vehicles thus account for twice the number of road deaths per billion kilometres driven than other road vehicles. Comparing non-urban and urban areas, 70% of all traffic fatalities involving lorries occur in non-urban areas. This can be explained by the limited number of kilometres driven by lorries in urban compared with non-urban areas. Countries with a relatively safe transport system and the lowest number of deaths per million inhabitants like Denmark, Great Britain and Sweden show relatively high shares of fatalities attributable to lorries; see Figure 25. This implies that safe freight transport is harder to achieve than safe passenger transport and reflects the intrinsic risk of having lorries on the roads. The relatively high number of deaths in freight transport also complicates achievement of the goals set in the European Commission’s 2001 White Paper and the Road Safety Action Programme.
17 13% = 92% * 14%.
4.846.1/Are trucks taking their toll? January 2009 30
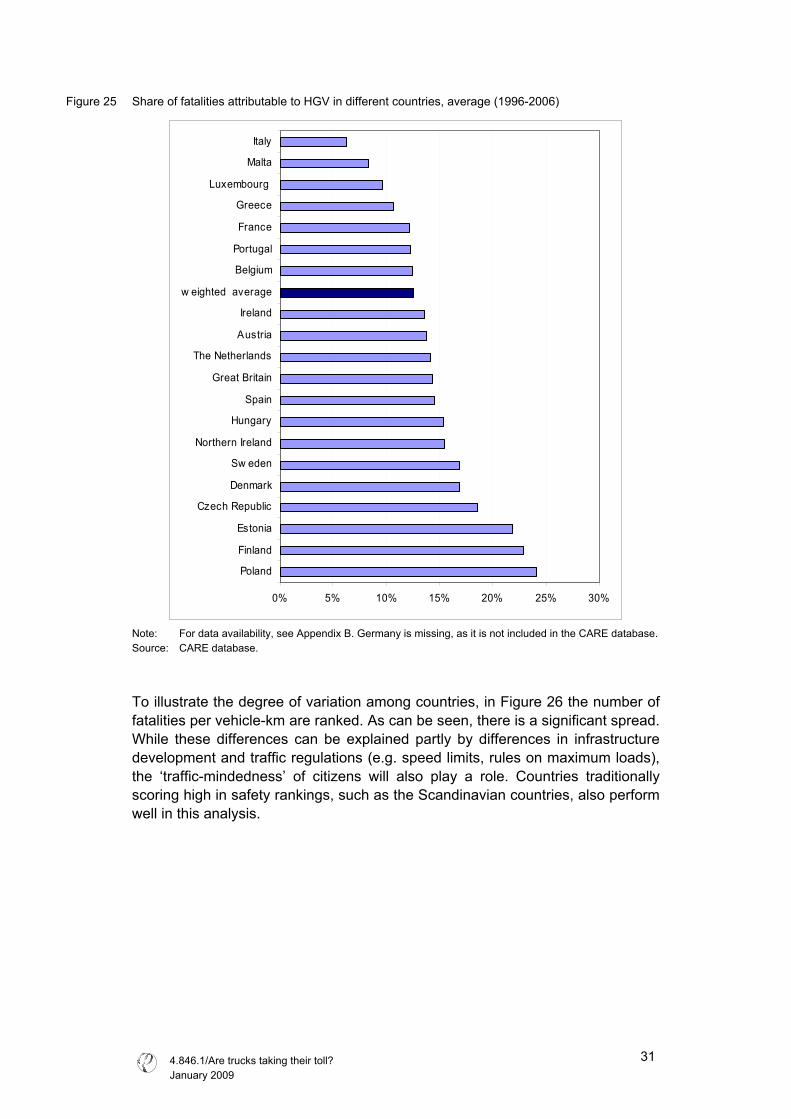
Figure 25 Share of fatalities attributable to HGV in different countries, average (1996-2006)
0% 5% 10% 15% 20% 25% 30%
Poland
Finland
Estonia
Czech Republic
Denmark
Sw eden
Northern Ireland
Hungary
Spain
Great Britain
The Netherlands
Austria
Ireland
w eighted average
Belgium
Portugal
France
Greece
Luxembourg
Malta
Italy
Note: For data availability, see Appendix B. Germany is missing, as it is not included in the CARE database. Source: CARE database.
To illustrate the degree of variation among countries, in Figure 26 the number of fatalities per vehicle-km are ranked. As can be seen, there is a significant spread. While these differences can be explained partly by differences in infrastructure development and traffic regulations (e.g. speed limits, rules on maximum loads), the ‘traffic-mindedness’ of citizens will also play a role. Countries traditionally scoring high in safety rankings, such as the Scandinavian countries, also perform well in this analysis.
4.846.1/Are trucks taking their toll? January 2009
31
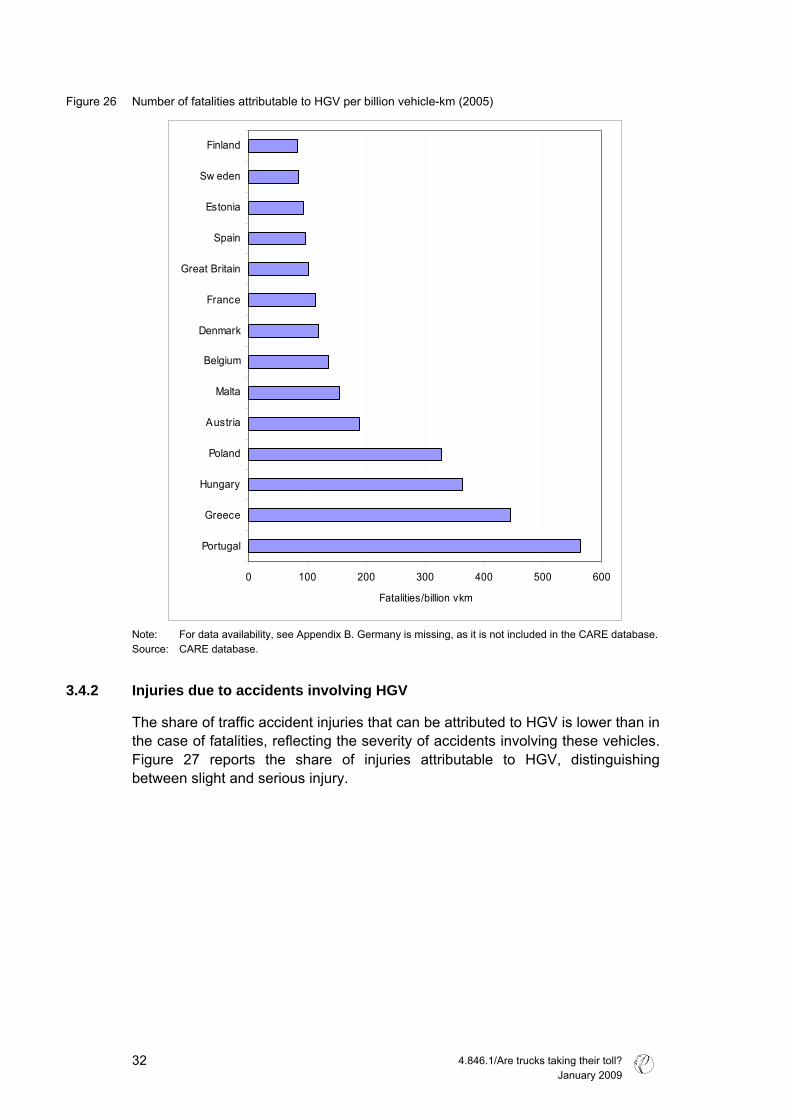
Figure 26 Number of fatalities attributable to HGV per billion vehicle-km (2005)
0 100 200 300 400 500 600
Portugal
Greece
Hungary
Poland
Austria
Malta
Belgium
Denmark
France
Great Britain
Spain
Estonia
Sw eden
Finland
Fatalities/billion vkm
Note: For data availability, see Appendix B. Germany is missing, as it is not included in the CARE database. Source: CARE database.
3.4.2 Injuries due to accidents involving HGV
The share of traffic accident injuries that can be attributed to HGV is lower than in the case of fatalities, reflecting the severity of accidents involving these vehicles. Figure 27 reports the share of injuries attributable to HGV, distinguishing between slight and serious injury.
4.846.1/Are trucks taking their toll? January 2009 32
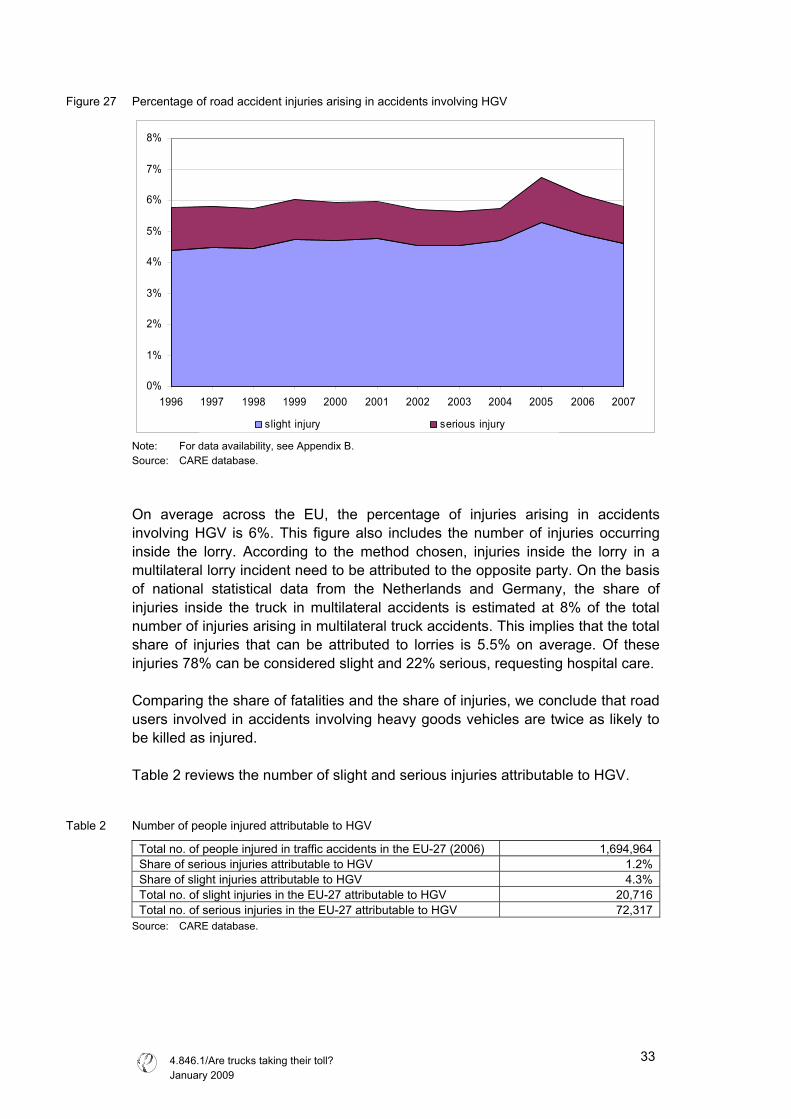
Figure 27 Percentage of road accident injuries arising in accidents involving HGV
0%
1%
2%
3%
4%
5%
6%
7%
8%
1996 1997 1998 1999 2000 2001 2002 2003 2004 2005 2006 2007
slight injury serious injury
Note: For data availability, see Appendix B. Source: CARE database.
On average across the EU, the percentage of injuries arising in accidents involving HGV is 6%. This figure also includes the number of injuries occurring inside the lorry. According to the method chosen, injuries inside the lorry in a multilateral lorry incident need to be attributed to the opposite party. On the basis of national statistical data from the Netherlands and Germany, the share of injuries inside the truck in multilateral accidents is estimated at 8% of the total number of injuries arising in multilateral truck accidents. This implies that the total share of injuries that can be attributed to lorries is 5.5% on average. Of these injuries 78% can be considered slight and 22% serious, requesting hospital care. Comparing the share of fatalities and the share of injuries, we conclude that road users involved in accidents involving heavy goods vehicles are twice as likely to be killed as injured. Table 2 reviews the number of slight and serious injuries attributable to HGV.
Table 2 Number of people injured attributable to HGV
Total no. of people injured in traffic accidents in the EU-27 (2006) 1,694,964 Share of serious injuries attributable to HGV 1.2% Share of slight injuries attributable to HGV 4.3% Total no. of slight injuries in the EU-27 attributable to HGV 20,716 Total no. of serious injuries in the EU-27 attributable to HGV 72,317
Source: CARE database.
4.846.1/Are trucks taking their toll? January 2009
33

3.4.3 Underreporting
The number of fatalities and injuries reported in official statistics and databases does not reflect the total number of accidents, fatalities and injuries actual occurring. For some countries figures on underreporting are available, though these are sometimes based on rather outdated methods of estimation. In HEATCO European average correction factors are presented; see Table 3 (HEATCO, 2005).
Table 3 Recommendation for European average correction factors for unreported accidents
Fatality Serious injury Slight injury Average injury
Damage only
Average 1.02 1.50 3.00 2.25 6.00 Car 1.02 1.25 2.00 1.63 3.50 Motorbike/ moped
1.02 1.55 3.20 2.38 6.50
Bicycle 1.02 2.75 8.00 5.38 18.50 Pedestrian 1.02 1.35 2.40 1.88 4.50
Source: HEATCO (2005). There are no specific underreporting figures available for HGV. As safety statistics are based on police reports, however, and because accidents involving HGV have a greater impact on traffic flow, there may be less underreporting for this vehicle category. For lack of relevant information, we have introduced no correction here.
3.5 Congestion
The following issue giving rise to external costs is congestion. External congestion costs are those costs experienced by other system users when a new user enters the system. These costs are not generally taken into account by transport users, leading to a decrease in social welfare. They are thus subject to corrective pricing measures. Congestion arises from the mutual disturbance of users competing for limited transport system capacity. Lorries contribute to congestion because of their presence in traffic jams. It is also worth noting that congestion, entailing stop-start traffic and idling engines, also causes increased fuel consumption and therefore greater CO2 and air pollutant emissions, compared to free-flowing traffic. However, policies aimed at reducing congestion do not always reduce emissions, as demand-increasing measures such as infrastructure expansion attract new traffic. The net climate effect may therefore sometimes even be negative. Increased travel time is the single most important effect of congestion. Applying standard valuations of travel time losses, this category commonly accounts for 90% of economic congestion costs. The additional 10% consists of additional fuel costs, vehicle provision and operating costs, and costs due to less reliable travel times.
4.846.1/Are trucks taking their toll? January 2009 34
4 External and infrastructure costs of road freight transport
4.1 Introduction
In this chapter we present an estimate of the total external costs of HGV traffic. In doing so, the main aim is to indicate the overall magnitude of the problem. The reported figures cannot be adopted directly as a basis for charges, for example. To this end the environmental and other impacts discussed in Chapter 3 are expressed in monetary terms, for the year 2006. Infrastructure costs are also included for reference, but these are not discussed in detail. The methodology and valuation methods adopted here are in line with the IMPACT project carried out by CE Delft, INFRAS and other institutes in the light of the revision of the Eurovignette Directive. External cost estimates can be used as a basis for transport pricing. In that case it is usually the marginal social costs that are calculated, i.e. the additional cost of an additional vehicle-kilometre. In the IMPACT approach, too, it was marginal costs that were estimated. In this chapter, however, we present the total external costs (as well as the infrastructure costs). These provide an indication of the total damage caused by HGV traffic. We compare these costs with the total revenues from taxes and charges paid by operators of these vehicles. This comparison is particularly relevant from an equity perspective: does the road freight transport sector pay the costs it imposes on society as whole? Congestion forms a special cost category. When discussing total external costs, the costs of congestion should be excluded, because the road transport sector bears these costs itself. When discussing internalisation based on marginal external costs, congestion charging is an efficient way of optimising scarce road capacity. A tabular synopsis of all the emissions used in the external cost calculations is provided in Appendix A.
4.2 Valuing the external effects of road transport
The loss of well-being associated with the environmental and other impacts of road freight transport can be expressed in monetary terms. The amount of money people are willing to pay to avoid adverse effects provides a good estimate of the loss of well-being they experience. In some instances the market will provide reliable estimates of this willingness to pay (WTP).
4.846.1/Are trucks taking their toll? January 2009
35
For many of the external effects of road freight transport, there are no such market prices, however. To estimate the WTP to avoid these effects, various methods can be used. Generally speaking, there are two relevant valuation methods (CE, 2007a): − The damage cost approach. − The avoidance cost approach. Damage cost approach This method assesses all the physical external impacts of transport and then assigns a value to the economic impacts to which they give rise. For example, traffic accidents result in a certain number of fatalities per year (physical impact), leading to costs being incurred in the form of production losses and the grief and suffering of relatives and friends. Various methods can be used to value the physical effects. Generally, two types of approach are distinguished: stated-preference methods and revealed-preference methods. In stated-preference methods, surveys are used to ask people directly how much they would be willing to pay to avoid certain physical impacts related to road freight transport. In revealed-preference methods, on the other hand, the economic price of external effects is estimated using price developments on other, economic markets. For example, the WTP to avoid transport-related noise nuisance can be derived from variations in house prices, determined in part by differences in ambient noise levels. These differences can be seen as the WTP to avoid the adverse effects (especially annoyance) of noise. To value mortality due to traffic noise means assigning a monetary value to a statistical human life. In the field of environmental valuation this has always been a controversial topic, for the WTP to avoid the loss of one’s life is infinite, is it not? Nonetheless, in their everyday lives people make plenty of choices that increase their risk of dying. For example, we may choose to drive a motorcycle, despite being aware that this involves a greater risk of lethal accident than driving a car. With the aid of this kind of information on risk behaviour, a value can be determined for a statistical human life. Avoidance cost approach This method is based on a cost-effectiveness analysis that determines the least-cost option to achieve a required environmental result, related to a policy target, for example. The target can be specified at various levels: national, EU or global. An important drawback of this method is the implicit assumption that the policy target is a perfect reflection of the preferences of individuals. Preference is therefore often given to valuing environmental effects using the damage cost approach. However, if the physical impacts of environmental effects are hard to estimate and if policy targets are available, then an avoidance cost approach may be preferable (as in the case of CO2 emissions, for example).
4.846.1/Are trucks taking their toll? January 2009 36

4.3 CO2 emissions
There is a huge amount of literature on the issue of valuing the impacts of CO2 emissions. A review of this literature is to be found in CE Delft (2008a). This review shows that the costs of CO2 emissions are currently estimated using both the damage cost and avoidance cost approach. CE Delft (2008a) concludes that the spread of results from studies assessing the (external) costs of CO2 emissions based on avoidance costs is significantly smaller than for studies using the damage costs approach, indicating a higher level of uncertainty in the damage cost approach. In addition, it is important to note that a number of clear policy targets have been agreed for the short term (2020), while this is not the case for the longer term. Consequently, CE Delft (2008a) recommends that valuation of CO2 emissions in the short term be based on the avoidance cost approach. The recommended values for 2010, which can also be used for CO2 emissions in 2006, range from € 7 to € 45 per tonne CO2 (based on the avoidance cost for the economy as a whole18). In 2006 the social costs of the CO2 emissions of heavy goods vehicles in the EU-27 were an estimated 1.4 to 9.1 billion Euro. This means that in 2006 HGV accounted for about 23% of the total social CO2 costs (6.2-39.7 billion Euro) of road transport. Note that according to IMPACT, CO2 costs are expected to rise substantially in the future, based on damage costs, to an average of 85€/tonne CO2 in 2050 (CE, 2008a).
4.4 Air pollution
Air pollution costs are caused by the emission of air pollutants such as particulate matter (PM) and NOx and consist of health costs and the costs associated with damage to buildings and materials, crop losses and damage to the ecosystem (biosphere, soil, water). Health costs (due mainly to PM and NOx from exhaust emissions) constitute by far the most important cost category. CE Delft (2008a) presents, for all European countries, cost figures (per tonne of pollutant) for the principal air pollutants, taking the various cost categories into account. For PM, these figures are differentiated according to metropolitan, urban and non-urban region, moreover. Thus, the external costs for PM are calculated per country, with differentiation among types of region. The reason for this is that the damage costs differ significantly across Europe. Using the cost figures from CE Delft (2008a), with HEATCO as primary source, the costs of PM (both exhaust and non-exhaust) and NOx emissions of HGV in the EU-27 were estimated (see Figure 28). The costs of air pollutant emissions by this vehicle category are highest for NOx: about 11 billion Euro. The costs of PM emissions are approximately 5 billion Euro.
18 Damage costs are in the same range, but with greater bandwidth. EU estimates for achieving 2020 EU
climate targets are around 40 €/tonne. For more information, see (CE Delft, 2008a).
4.846.1/Are trucks taking their toll? January 2009
37

Figure 28 Total costs of air pollutants emitted by HGV in the EU-27 (2006)
0
2
4
6
8
10
12
NOx PM (exhaust) PM (non-exhaust)
billi
on E
uro
Figure 28 shows how the various road transport segments contribute to the total external costs of air pollution. In the EU-27, passenger transport accounts for the greatest share: about 48%. However, HGV are also responsible for a significant share of air pollution costs: around 39%.
Figure 29 Share of transport segments in air pollution costs of road transport (billion Euro)
Road passenger: 20
Vans: 6
HGV: 16
HGV Vans Road passenger
4.846.1/Are trucks taking their toll? January 2009 38

4.5 Noise
Noise costs consist of the costs associated with annoyance and impacts on human health. Annoyance due to transport noise may lead to social and economic costs, in the form of restricted enjoyment of desired leisure activities, discomfort or inconvenience (including pain), etc. Health costs, on the other hand, consist of two aspects: medical costs and the cost of premature death. The social cost estimates presented here for noise are based on valuation studies by INFRAS/IWW (2004), OECD/INFRAS/Herry (2002) and Link (2000). INFRAS/IWW and Link provide cost estimates for Western European countries, OECD/INFRAS/Herry for East European countries. With these sources, the social costs of HGV traffic noise can be quantified for the EU-22 (EU-27 without Cyprus, Estonia, Latvia, Lithuania and Malta)19. INFRAS/IWW and Link cover partly the same countries, with the two studies presenting somewhat different estimates for some of them20. Since it not clear which of the studies presents the most reliable estimates, in calculating the social costs of HGV noise in the EU-22 the average of the two has been taken for the relevant countries. The social costs of HGV noise in the EU-22 are estimated to be 18 billion Euro (14-21 billion Euro) in 2006, based on WTP-based studies. Since this estimate only covers noise over 55 dB, it probably underestimates the actual costs. Heavy goods vehicles account for around 47% of the total noise costs associated with road transport. We assume below that the cited monetary figure holds for the EU-27 as whole, as 98% of the population is covered and the countries not included have a low population density.
19 The EU-22 covers 98.4% of the EU-27’s population. 20 Important reasons for these differences are:
• The number of people reported to be exposed to traffic noise differs between the two studies because of different data sources used.
• Link separately estimate the monetary value of sleep disturbance due to traffic noise, while INFRAS/IWW assumes that this loss of well-being is included in the monetary value for annoyance.
• INFRAS/IWW value the increased mortality due to traffic noise using the so-called Risk Value approach (which is among other things based on the value of a statistical life), while Link use the value of a life year lost (VLYL) to value mortality.
• Link use a more elaborate method than INFRAS/IWW to value the medical costs.
4.846.1/Are trucks taking their toll? January 2009
39

Figure 30 Share of transport modes in external costs of traffic noise in the EU-22
0
4
8
12
16
20
24
Passengercar
Bus Motorcycle Heavy goodsvehicle
Passengertrain
Freight train
billi
on e
uro
Note: This figure covers the EU-27 except Cyprus, Estonia, Latvia, Lithuania and Malta. Source: CE Delft, 2007b. The noise cost estimates are based on cost figures for 2000 and have been adjusted for inflation. The physical impacts of transport noise may well have changed between 2000 and 2006, owing to increased traffic volumes or insulation of buildings, for example. As there is no way of estimating these changes, however, the data presented on the social costs of HGV noise are based on physical impacts as of 2000.
4.6 Traffic accidents
Accident costs consist of the cost of pain, grief and suffering, material damages, medical costs, administrative costs and production losses. CE Delft (2008a) report cost figures that can be used to value the cost of traffic accidents. This figures are dominated by the costs of pain, grief and suffering of the average transport accident victim. For fatalities these costs can be estimated by using the value of a statistical life (VSL), for which an average value for Europe of € 1.5 million is recommended. For severe and slight injuries these values are respectively 13% and 1% of the VSL. In addition to the costs of pain, grief and suffering, further direct and indirect economic costs (medical costs, net production losses, administrative costs, etc.) have to be considered. For fatalities these economic costs are estimated at 10% of the VSL. Based on CE Delft (2008a) it is estimated that for severe and slight injuries these percentages are 2% and 0.1% of the VSL, respectively.
4.846.1/Are trucks taking their toll? January 2009 40
Using these figures and the number of fatalities and injuries reported in Chapter 3, it is estimated that the uncovered21 accident costs attributable to HGV in the EU-27 amount to some 30 billion Euro. The bulk of these costs, around 88%, consist of the costs of pain, grief and suffering due to fatalities and severe injuries.
4.7 Congestion
Congestion on roads can have a range of impacts: increased travel time, increased vehicle operating costs, including fuel costs, costs due to less reliable travel times, etc. The total external congestion costs of road transport in the EU-15 plus Norway and Switzerland have been estimated at 63 billion Euro (2000 price level) (INFRAS/IWW, 2004). UNITE (2003) have reported an even higher estimate: 68 billion Euro in 1998 (1998 price level) for ten European countries (Austria, Denmark, France, Germany, Greece, Ireland, Netherlands, Portugal, Spain, UK). In many European countries, roads are becoming ever more congested. In the Netherlands, travel delays due to motorway congestion increased by 43% between 2000 and 2006 (KiM, 2008). In the UK, too, marked growth in congestion levels is projected, with an increase of around 30% forecast in average delays between 2003 and 2025 (Eddington, 2006). It is therefore highly likely that congestion costs have risen since 2000. CE Delft (2008b) estimate that the total congestion costs in the ‘EU-19’ may be in the order of magnitude of 100 billion Euro in 2005 (price level of 2000). This corresponds with 117 billion Euro at the price level of 2006. This very rough estimate can also be applied to the EU-27, since the countries with the most congested roads are included in the ‘EU-19’. To arrive at a congestion cost figure for HGV, the total costs need to be allocated across the various road transport modes. To this end we use the number of vehicle-kilometres in combination with the concept of PCE (Passenger Car Equivalent) factors, used to weight the traffic volume of each vehicle type in proportion to the road capacity it occupies (see Table 4). By planning loading and unloading operations during rush hour periods as far as possible, there may be an inherent tendency for HGV to avoid rush hours. We have no data to underpin this, however. On the other hand, accidents involving HGV may cause more congestion than those involving only passenger cars. On balance, these two effects may well be approximately in balance.
Table 4 PCEs of various modes
Car Motor-cycle
Bus Van HGV 3.5-7.5 t
HGV 7.5-16 t
HGV 16-32 t
HGV >32 t
PCE 1 0.5 2 1.5 2 2.5 3 3,5 Source: CE Delft, 2008c.
21 Uncovered costs those costs not covered by insurance.
4.846.1/Are trucks taking their toll? January 2009
41

The congestion costs associated with HGV, vans and road passenger vehicles are presented in Figure 31. Although the highest congestion costs are caused by passenger vehicles, the contribution of HGV is also significant: in the order of 24 billion Euro in 2006. It should be noted that these estimates of congestion costs are very uncertain and should merely be seen as providing a rough indication.
Figure 31 Share of transport segments in congestion costs of road transport (very rough estimates; billion Euro)
Road passenger:
81
HGV: 24
Vans: 12
Road passenger Vans HGV
4.8 Infrastructure costs
The IMPACT project provided estimates for the infrastructure costs of road transport in the EU. Here we refrain from discussing the methodological issues involved in preparing these estimates, merely adopting them from the relevant IMPACT report (CE, 2008b). The total infrastructure costs attributable to HGV in the EU-27 thus amount to an estimated 51 billion Euro at the price level of 2006.
4.9 Total external costs
According to the calculations of the previous sections, the results of which are summarised in Table 5, the total external and infrastructure costs of HGV transport in the EU-27 amounted 144 billion Euro in 2006.
4.846.1/Are trucks taking their toll? January 2009 42

Table 5 Synopsis of external costs of road freight transport, by category (billion Euro, 2006)
Average Minimum Maximum CO2 5 1 9Air pollutants 16 Traffic accidents
fatalities 12 severe injuries 18
slight injuries 0 Noise 18 14 22Congestion 24 Infrastructure 51 Total HGV 144
Figure 32 provides a breakdown of the total external costs according to the various cost categories distinguished. Infrastructure, congestion and traffic accidents are the greatest contributors. The contributions of noise and air pollution are comparable, while CO2 emissions make the smallest contribution to total social costs.
Figure 32 Breakdown of external costs of HGV traffic in the EU (billion Euro)
Infrastructure: 51
Accidents: 30
CO2: 5 Air pollution: 16
Noise: 18
Congestion: 24
Note: Data for congestion are no more than a rough indication.
It should be noted that, unlike the other costs, congestion costs are generally sector-internal, so borne by the road transport sector.
4.846.1/Are trucks taking their toll? January 2009
43

4.10 Balance between external costs and taxes paid
The total revenues of taxes and charges paid by HGV operators in the EU-27 are estimated at 54 billion Euro (2006 level) (CE, 2008b). The breakdown of these charges is shown in Figure 33.
Figure 33 Breakdown of revenues from taxes paid in the EU-27 (billion Euro)
fuel taxes: 33
km charges/ road tolls: 16
other taxes: 5
These revenues cover about 38% of the social costs of HGV transport. When congestion costs are excluded, following the argument that they are sector-internal22, the cost coverage is still only 45%23. As stated earlier, this type of comparison is relevant from an equity point of view, rather than from the perspective of providing optimal price incentives.
22 Despite the fact that congestion is a sector-internal issue, congestion charges can be efficient way to
optimise the use of scarce road capacity. See also the introduction to this chapter. 23 The comparison made here differs from the one presented in IMPACT Deliverable 3 (CE, 2008b). The main
difference is that in this report we present total external cost, while IMPACT Deliverable 3 revenues from purely marginal cost based charges are presented. Note that for accident and noise, average cost are considerably higher than marginal cost. Another difference is that IMPACT Deliverable 3 also includes a few other external costs (like costs of nature and landscape and the external cost of emissions from fuel production), but these cost are relatively small and therefore have a minor impact on the cost coverage rates.
4.846.1/Are trucks taking their toll? January 2009 44

Literature
ARE, 2007 Heini Sommer; Helen Simmen, Christoph Lieb (Ecoplan Bern/Altdorf), Markus Maibach, Martin Peter, Christoph Schreyer (Infras AG, Zürich) Volkswirtschaftliche Auswirkungen der LSVA mit höherer Gewichtslimite : Schlussbericht Bern : Bundesamt für Raumentwicklung ARE, 2007 BAG, 2006 Marktbeobachtung Güterverkehr, Internetgestützte frachtvermittllung Bündesamt fur Güterverkehr, Februar 2006 www.bag.bund.de BGL, 2007 Aktuelle Pressemeldungen 19.10.2007 Frankfurt am Main : Bundesverband Güterkraftverkehr, Entsorgung und Logistik e. V. (BGL), 2007 http://www.bgl-ev.de CBS, 2008 Publicatiebestanden beroeps- en eigenvervoer over de weg door Nederlandse ondernemingen Heerlen : Centraal Bureau voor de Statistiek, 2008 CARE database European Road Accident Database http://ec.europa.eu/transport/roadsafety/road_safety_observatory/care_en.htm database not publicly available CE, 1999 J.M.W. Dings, D. Metz, B.A. Leurs, A.N. Bleijenberg Beter aanbod, meer goederenvervoer? Delft : CE Delft, September 1999 CE, 2006 Richard Smokers, Bettina Kampman Energy Efficiency in the Transport sector :Discussion paper for PEEREA Delft : CE Delft, 2006 CE, 2007a S.M. (Sander) de Bruyn, M.J. (Martijn) Blom, A. (Arno) Schroten, M. (Machiel) Mulder Leidraad MKBA in het milieubeleid : Versie 1.0 Delft : CE Delft, 2007
4.846.1/Are trucks taking their toll? January 2009
45

CE, 2007b L.C. (Eelco) den Boer, A. (Arno) Schroten Traffic noise reduction in Europe : Health effects, social costs and technical and policy options to reduce road and rail traffic noise Delft : CE Delft, 2007 CE, 2008a M. Maibach, C. Schreyer, D. Sutter (INFRAS) ; H.P. van Essen, B.H. Boon, R. Smokers, A. Schroten (CE Delft) ; C. Doll (Fraunhofer Gesellschaft – ISI) ; B. Pawlowska, M. Bak (University of Gdansk) Handbook on estimation of external costs in the transport sector : .Internalisation Measures and Policies for All external Costs of Transport (IMPACT) Delft : CE Delft, 2008 CE, 2008b Internalisation measures and policy for the external cost of transport : Internalisation Measures and Policies for All external Costs of Transport (IMPACT) Delft : CE Delft, 2008 DfT, 2003 Benchmarking guide 77 : Key Performance Indicators for Non-Food Retail Distribution London : UK Department for Transport, 2003 DG TREN, 2007 European Commission, Directorate-General for Energy and Transport, Energy and transport in figures 2007, http://ec.europa.eu/dgs/energy_transport/figures/pocketbook/ Eddington, 2006 R. Eddington Transport demand to 2025 and the economic case for road pricing and investment: Research Annex 3.1 to the Eddington Transport Study London : TSO, 2006 EEA, 2005 Indicator Fact Sheet TERM 2005 12a Passenger transport demand by mode and purpose Copenhagen : EEA, May 2005 EEA, 2003 European Topic Centre on Air and Climate change. TRansport and ENvironment Database System (TRENDS), managed by Eurostat: http://air-climate.eionet.europa.eu/databases/TRENDS/index_html
4.846.1/Are trucks taking their toll? January 2009 46

EEA, 2008a European Topic Centre on Air and Climate change : COPERT 4 Thessaloniki : Aristotle University of Thessaloniki, Laboratory of applied thermodynamics http://lat.eng.auth.gr/copert/ EEA, 2008b Annual European Community greenhouse gas inventory 1990–2006 and inventory report 2008 : Version 27 Submission to the UNFCCC Secretariat Copenhagen : European Environmental Agency (EEA), 2008 Eurostat, 2008 Transport Statistics http://ec.europa.eu/eurostat HEATCO, 2005 P. Bickel, A. Burgess, A., Hunt, J. Laird, C. Lieb, G. Lindberg, T. Odgaard Developing Harmonised European Approaches for Transport Costing and Project Assessment (HEATCO) Deliverable 2: State-of-the-art in project assessment Stuttgart : Universität Stuttgart, 2005 Hörmandinger, 2007 A view of the needs and potential of Euro VI for EU Air Quality Presentation for AECC Technical Seminar on Heavy-duty Engine Emissions Thursday, 25 October 2007 INFRAS/IWW, 2004 External Costs of Transport, Update Study Zürich/Karlsruhe : INFRAS/IWW, 2004 KBA, 2006 KBA, 2006 Statistische Mitteilungen 2006 Flensburg : Kraftfahrt-Bundesamt, Bundesamt für Güterverkehr, 2006. http://www.kba.de/ KBA, 2007 Verkehr deutscher Lastkraftfahrzeuge, Verkehrsaufkommen ; Eigenschaften der Fahrt, Jahr 2007 Flensburg : Kraftfahrt-Bundesamt, Bundesamt für Güterverkehr, 2007 KiM, 2008 Kennisinstituut voor Mobiliteitsbeleid Mobiliteitsbalans 2008 : Congestie in perspectief The Hague : Ministerie van Verkeer en Waterstaat, 2008
4.846.1/Are trucks taking their toll? January 2009
47

Link, 2000 H. Link, et al. The Accounts Approach : UNIfication of accounts and marginal costs for Transport Efficiency (Unite) Leeds : ITS, University of Leeds, 2000 OECD/INFRAS/Herry, 2002 External Costs of Transport in Central and Eastern Europe. Final Draft Report. Study by INFRAS and HERRY for OECD Environment Directorate and Austrian Ministry for Agriculture and Forestry, Environment and Water Management, 2002. TNO, 1999 R. Demkes, R. ter Brugge, and T. Verduin Trilog-Europe summary report Delft : TNO Inro http://www.inro.tno.nl/trilog/ Unite, 2003 C. Nash, et al. UNIfication of accounts and marginal costs for Transport Efficiency (Unite), Final Report Leeds: ITS, University of Leeds, 2003 Watkiss, 2005 Baseline Scenarios for Service Contract for carrying out cost-benefit analysis of air quality related issues, in particular in the clean air for Europe (CAFE) programme Didcot, United Kingdom AEA: Technology Environment http://www.cafe-cba.org/reports/
4.846.1/Are trucks taking their toll? January 2009 48

CE Delft
Are trucks taking their toll?
The environmental, safety and congestion impacts of lorries
in the EU
Annexes
Report Delft, January 2009 Authors: Eelco den Boer Femke Brouwer Arno Schroten
Huib van Essen
Solutions for environment, economy and
technology
Oude Delft 180
2611 HH Delft
The Netherlands
tel: +31 15 2150 150
fax: +31 15 2150 151
e-mail: [email protected]
website: www.ce.nl
KvK 27251086
CE Delft
environment,
economy and
2611 HH Delft
The Netherlands
tel: +31 15 2 150 150
fax: +31 15 2 150 151
website: www.ce.nl
KvK 27251086
Solutions for
technology
Oude Delft 180
e-mail: [email protected]
4.846.1/Are trucks taking their toll? January 2009
49

4.846.1/Are trucks taking their toll? January 2009 50
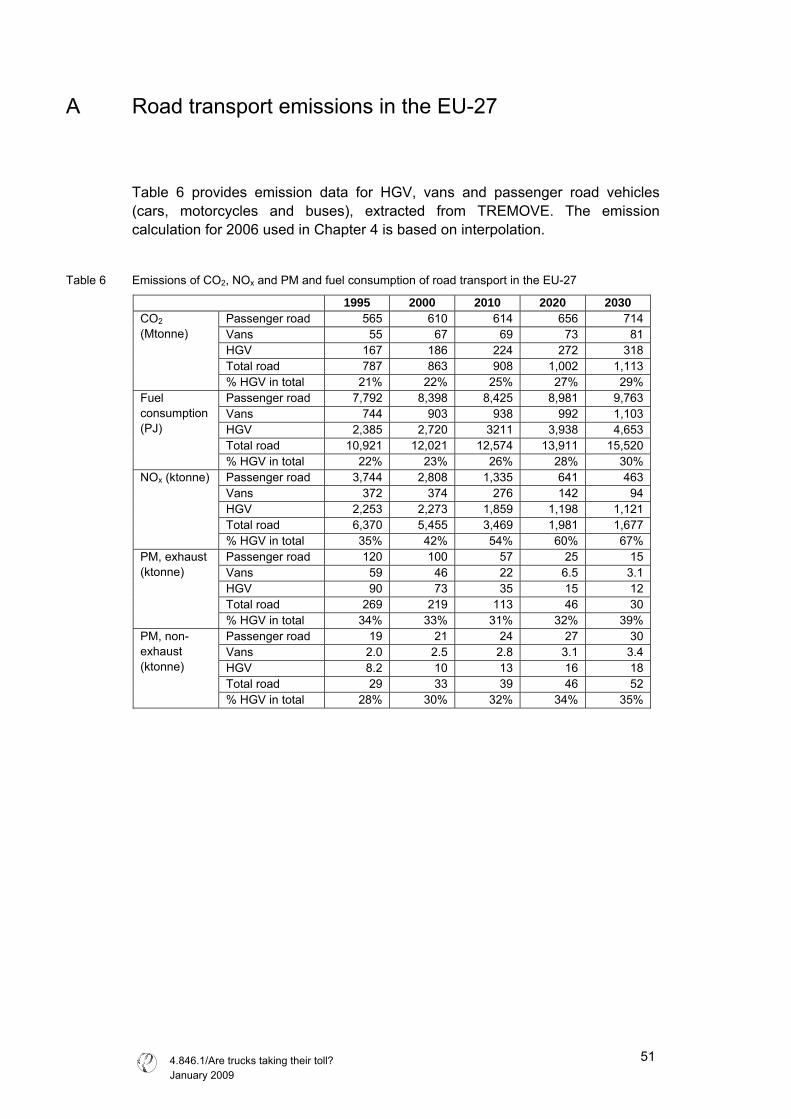
A Road transport emissions in the EU-27
Table 6 provides emission data for HGV, vans and passenger road vehicles (cars, motorcycles and buses), extracted from TREMOVE. The emission calculation for 2006 used in Chapter 4 is based on interpolation.
Table 6 Emissions of CO2, NOx and PM and fuel consumption of road transport in the EU-27
1995 2000 2010 2020 2030 Passenger road 565 610 614 656 714 Vans 55 67 69 73 81 HGV 167 186 224 272 318 Total road 787 863 908 1,002 1,113
CO2 (Mtonne)
% HGV in total 21% 22% 25% 27% 29% Passenger road 7,792 8,398 8,425 8,981 9,763 Vans 744 903 938 992 1,103 HGV 2,385 2,720 3211 3,938 4,653 Total road 10,921 12,021 12,574 13,911 15,520
Fuel consumption (PJ)
% HGV in total 22% 23% 26% 28% 30% Passenger road 3,744 2,808 1,335 641 463 Vans 372 374 276 142 94 HGV 2,253 2,273 1,859 1,198 1,121 Total road 6,370 5,455 3,469 1,981 1,677
NOx (ktonne)
% HGV in total 35% 42% 54% 60% 67% Passenger road 120 100 57 25 15 Vans 59 46 22 6.5 3.1 HGV 90 73 35 15 12 Total road 269 219 113 46 30
PM, exhaust (ktonne)
% HGV in total 34% 33% 31% 32% 39% Passenger road 19 21 24 27 30 Vans 2.0 2.5 2.8 3.1 3.4 HGV 8.2 10 13 16 18 Total road 29 33 39 46 52
PM, non-exhaust (ktonne)
% HGV in total 28% 30% 32% 34% 35%
4.846.1/Are trucks taking their toll? January 2009
51

4.846.1/Are trucks taking their toll? January 2009 52

B Safety data availability
The availability of data in the CARE database can be derived from Table 7.
Table 7 Data availability in the CARE database on number of people killed (k) and injured (i) in traffic accidents
1996 1997 1998 1999 2000 2001 2002 2003 2004 2005 2006 Austria k/i k/i k/i k/i k/i k/i k/i k/i k/i k/i k/i Belgium k/i k/i k/i k/i k/i k/i k/i k/i k/i k/i k/i Czech Republic k/i k/i Denmark k/i k/i k/i k/i k/i k/i k/i k/i k/i k/i k/i Estonia k k Finland k k k k k k k k k k k France k/i k/i k/i k/i k/i k/i k/i k/i k/i k/i k/i Greece k/i k/i k/i k/i k/i k/i k/i k/i k/i k/i k/i Great Britain k/i k/i k/i k/i k/i k/i k/i k/i k/i k/i k/i Hungary k/i k/i k/i k/i Ireland k/i k/i k/i k/i k/i k/i k/i k/i Italy k k k k k k k k k Luxembourg k/i k/i k/i k/i k/i k/i k/i k k Malta i k/i Netherlands k/i k/i k/i k/i k/i k/i k/i k/i Northern Ireland k/i k/i k/i k/i k/i k/i k/i k/i k/i k/i Poland k/i Portugal k/i k/i k/i k/i k/i k/i k/i k/i k/i k/i k/i Spain k/i k/i k/i k/i k/i k/i k/i k/i k/i k/i k/i Sweden k/i k/i k/i k/i k/i k/i k/i k/i k/i k/i k/i
4.846.1/Are trucks taking their toll? January 2009
53


![INDEX [] FULL CATALOG LOW RES.pdf · 2 Toll-Free: 1-800-558-7750 Mon-Fri 8am-5pm, Sat 8am-12pm Close-up of wheel flare texture Looks great on new trucks or old trucks! Cover Up Wheel](https://static.fdocuments.in/doc/165x107/5fd0c33f5155c05ede4fa217/index-full-catalog-low-respdf-2-toll-free-1-800-558-7750-mon-fri-8am-5pm.jpg)


![KEEP YOUR TRUCKS RUNNING WITH OTC...KEEP YOUR TRUCKS RUNNING WITH OTC The Bosch ESI[truck] platform is unlike any other in the industry, taking heavy duty diagnostics to the next level](https://static.fdocuments.in/doc/165x107/5f2c32619396b740bf4170c9/keep-your-trucks-running-with-otc-keep-your-trucks-running-with-otc-the-bosch.jpg)


