
Chapter 8 Understanding Real Estate Markets. Chapter 8 Real Estate Space Market Real Estate…

ARE INTERNATIONAL REAL
ESTATE MARKETS INTEGRATED: EVIDENCE FROM CHAOTIC
DYNAMICS
RESEARCH REPORT JANUARY 2007
LIOW KIM HIANG JAMES R. WEBB National University of Singapore Cleveland State University Email: [email protected] Email: [email protected]

CONTENTS EXECUTIVE SUMMARY..........................................................................3 INTRODCUTION........................................................................................5 RELATED LITERATURE ……………………………………………………..8 DATA……………………………………………………………………………..11 METHODOLOGY………………………………………………………………13 RESULTS………………………………………………………………………..17 ADDITIONAL INVESTMENT IMPLICATIONS…………………………..22 CONCLUSIONS………………………………………………………………..23 REFERENCES…………………………………………………………………..25 TABLES…………………………………………………………………………..27 FIGURES…………………………………………………………………………36 Acknowledgement We wish to gratefully acknowledge the funding of this research project by the Real Estate Research Institute (RERI). We also wish to thank our project mentors, Drs Marc Louargand and Lijian Chen, for their time spent and comments offered throughout the project
------------------------------------------------------------------------------------------------------------------------------------------------------ Are international real estate markets integrated? Evidence from chaotic dynamics
3
EXECUTIVE SUMMARY Chaos, also referred to as nonlinear dynamic analysis, is a nonlinear deterministic process that appears random. A system may be nonlinear, and yet can be either simple or chaotic. If a price series has some degree of nonlinear dependency on their past movements, it may generate complex behavior and be described by chaotic theory. In the case of specific “chaotic” nonlinearities, such as the logistic map, the dependency can evolve from passive and predictable states to violent and unpredictable states. Real estate markets may be characterized by non-linear “chaotic” behavior resulting from the presence of market frictions and significant transaction costs, the interaction of informed and irrational market players as well as economy wide fluctuations. Consequently, the dynamic behavior of returns may give rise to asymmetric dynamics for returns of different size. In the context of market integration, the usual notion is that national real estate markets are segmented because of differing degrees of market imperfections, such as illiquidity and transaction costs, with each market exhibiting unique microstructure characteristics that further distinguish one market from other markets. The disparity in characteristics in turn might induce non-linearities in real estate market returns and help explain differences in the level and behavior of returns across markets. Our study is believed to be the first comprehensive work to combine the non-linearities and chaos dynamics of national real estate market returns with market integration in international real estate. Six major national real estate markets are included in this study; those of the USA, UK, Australia, Japan, Hong Kong and Singapore, as well as the World real estate market over the period January 1990 through June 2006. For each market, we examine four data series (EPRA/NAREIT weekly original series, EPRA/NAREIT weekly hedged series; EPRA/NAREIT daily original series and EPRA/NAREIT daily hedged series) to form an “on the balance of evidence” picture. The BDS statistics applied to the standardized residuals of the AR and GARCH model reject the null hypothesis that the real estate return data are independently and identically distributed, suggesting that the linear dependencies and conditional heteroskedasticity are not the causes of the nonlinear structure in the data. On the other hand, tests of chaos, based on the K-map components of a logistic model indicate that real estate market returns exhibit chaotic behavior in some instances. Of the 28 real estate return series, there are six weekly original series, two weekly hedged series, five daily original series and two daily hedged series that have at least one K-map term that is statistically significant. This K-map evidence thus implies an exponential relationship by which current real estate market returns affect future real estate market returns. Further tests on a full logistic map which is made up of a non-linear component (K-map) and a behavioral component (Z-map) reveal that many of the Z-map coefficients are statistically significant and positive, a finding which supports the notion of market integration among the six national real estate markets and with the world stock market. The Z-map in this study serves either as an indicator of the degree of market integration among the six national real estate markets or proxy for the degree of integration of the national real estate markets with the world stock market (represented by the MSCI world equity index). Table 1 provides a summary that allows for the interaction of the Z-map term (represented by the MSCI equity index) with the K-map terms (chaos) for 12 real estate series. For the 9 original series, evidence of varying levels of market integration is documented. In addition, the lagged same country’s market returns (K-map) combine with the MSCI returns (Z-map) help determine the future evolution of the same country’s market returns; the effects of chaos are however weaker. On the contrary, there appears to be some dominance of K-map influence in the three hedged real estate series with two of the three Z-map coefficients being statistically insignificant. If the hedged real estate is considered a better proxy for the direct real estate market, the results imply that national direct real estate markets are still segmented with the world stock market, and that past non-linear returns might affect the level of future returns to a greater degree (K-map).

------------------------------------------------------------------------------------------------------------------------------------------------------ Are international real estate markets integrated? Evidence from chaotic dynamics
4
Table 1
Non-linear TAR-GARCH (1, 1)-M regressions of market returnsand MSCI index: the K-map and Z-map
Types of index
Market Significant K-map terms
Z-map coefficient
Adj R2 (due to K-
map)
Adj R2 (due to Z-
map)
Total Adj R2 (K+Z
maps) Weekly-original
US R2 0.403*** 2.6% 19.7% 22.3%
UK R3 0.539*** 2.1% 16.3% 18.4% AUS R3 0.344*** 2.5% 11.6% 14.1% JP R3, R4 1.217*** 3.2% 16.4% 19.6% WRE R2, R4 0.697*** 1.7% 45.3% 47.0%
Weekly-hedged
HK R2, R4 0.051*** 2.1% 2.5% 4.6%
SG R2 -0.032 4.4% -0.6% 3.8% Daily-
original UK R3 0.318*** 3.3% 7.5% 10.8%
JP R2 0.963*** 1.6% 12.3% 13.9% HK R3, R4 0.549*** 3.5% 8.6% 12.1% WRE R3 0.495*** 4.9% 34.5% 39.4%
Daily – hedged
HK R3, R4 0.007 1.9% -0.3% 1.6%
Notes: (1) For each index, statistically significant nonlinear lagged returns (K-map terms) is analyzed
with tttttt RbRbRbRbaR ε+++++= −−−− )()()()( 14
413
312
2110 , (2) A non-linear TAR-GARCH (1, 1) – M regression is run to estimate the joint impact of the K-map and Z-map (proxied by the MSCI world equity index). The non-linear TAR-GARCH (1, 1) - M model has the following specification:
tttttttt dMSCIDummycbRaRaRaRaaR εσ ++++++++= −−−− )(2443322110
)(412
132
122
1102 DummyeIeeee ttttt ++++= −−−− σσεσ
a2 – a4 are the coefficients for the K-map terms; d is the coefficient for the Z-map (MSCI) term *** indicates two-tailed significance at the 1percent level
Finally, if the non-linear expressions are more descriptive than the linear relationship, are they also better predictors? In general, the comparisons of the forecasting accuracy show that incorporating the K-map components in the model appears to improve the forecasting performance over the conventional linear model. However, this finding is at best inconclusive due to the mixed results obtained for some individual series. Overall, the important contributions of this study include significant evidence of nonlinearity and low deterministic chaotic behavior in some real estate market returns. These results are important because knowing that real estate market returns exhibit chaotic behavior can help us understand the evolution of real estate market returns better and find ways of predicting them. In this respect the results also have practical implications, because they suggest that international integration models for real estate market returns should include some nonlinear terms to be correct. In the international context, if real estate markets are in fact chaotic, the co-movements among them may also take non-linear form. Accordingly, global investors should be cautious in formulating their diversification strategies since gains from diversification may not occur in the long-run.

------------------------------------------------------------------------------------------------------------------------------------------------------ Are international real estate markets integrated? Evidence from chaotic dynamics
5
Abstract A logistic model of chaos is employed to test real estate returns in several countries for non-linear dependencies. These nonlinearities could arise as a nonlinear function of past observations. Furthermore, evidence of varying evels of market integration among the major real estate markets, and with the MSCI world stock market is documented for these series. This study also accounts for non-linear chaotic behavior in forecasting models in order to obtain potentially more accurate real estate forecasts. 1. INTRODUCTION The purpose of this study is to study the behavior of real estate market returns over
time with regard to their non-linear structures and chaos and explore the modeling
implications for real estate and stock market integration. “Chaos” is a technical term that
refers to irregular, complex behavior that seems random, but actually has some hidden order.
This behavior is typical of deterministic non-linear systems, such as the logistic map (Larrain,
1991).1 The presence of chaos, or low-dimensional non-linearities, in financial market price
movements is indicative of a deterministic link wherein past price observations predict the
outcome of future observations. Furthermore, while the linear links between the past prices
and future prices, in general, tend to be more stable, the non-linear or exponential links tend
to be associated with wider price fluctuations. In the case of specific “chaotic” non-linearities,
such as the logistic maps, the link can evolve from passive and predictable states to violent
and unpredictable states. Finally, as Hsieh (1991) explains, one important reason to test for
the presence of chaos is that it can help investors and policy makers to understand and explain
fluctuations in the economy and financial markets which appear to be random.2
There are several possible reasons why non-linearities may be observed in real estate
market returns. At the onset, the strategic interactions among market participants, the process
1 Chaos has been identified in hydrodynamic turbulence, lasers, electrical circuits, chemical reactions, biological reactions and climatic change. Hsieh (1991) considers several examples about the chaotic process. They are the univariate chaotic system (tent maps and logistic maps), bivariate chaotic system (Henon maps), trivariate chaotic system (Lorenz maps), Mackey-Glass equation and general chaotic maps. The logistic maps generate “low dimensional” chaos, in that the linear structure can be easily detected. They generate the sequence of x r according to: )1( 11 −− −= ttt xAxx , where A is between 0 and 4 and x0 is between 0 and 1. For small values of A, the system is stable and well behaved. However as the value of A approaches 4, the system becomes chaotic. 2 In the chaotic growth model, the economy follows nonlinear dynamics, which are self-generating and never die down.

------------------------------------------------------------------------------------------------------------------------------------------------------ Are international real estate markets integrated? Evidence from chaotic dynamics
6
by which information is incorporated into asset prices, and the dynamics of economy-wide
fluctuations are all inherently non-linear. Specifically, non-linearities could arise because of
the presence of real estate market imperfections, such as illiquidity and significant transaction
costs. Consequently, this may affect the speed with which profitable real estate transactions
can be implemented and lead to the clustering of price changes. Another possible reason is
that not all the market participants are rational. For example, while some investors react to
information instantaneously, others instead delay their response until other investors respond
first. Also, some other investors overreact to bad news and under-react to good news. Hence,
the market’s response to information might not necessarily give an aggregate linear feedback
all the time. Third, the characteristics of the real estate and financial market microstructure,
such as restrictions on short-sales and other trading rules, information disclosure requirements
and rules and/or control on foreign ownership might lead to delays in executing arbitrage
transactions. This in turn might induce non-linearities in the real estate returns. Finally, a
“chaotic” real estate market may cause sudden bursts of volatility and occasional large price
movements. For example, the July 1997 Asian economic crisis was associated. with large
movements in real estate market returns and volatility in some Asian economies.
The finding of a non-linear return structure would open the possibility for non-linear
pricing models that could better explain certain aspects of the real estate return-generating
process.3 Additionally, the accuracy of forecasting property returns may be reduced unless
non-linear structures are incorporated into property forecasting models. Another implication
is that it would raise questions about market efficiency and about the linear form of asset
pricing models used in tests of market integration. The question whether real estate markets
are segmented or integrated is always debatable among practicing professionals and
academics alike. The usual notion is that national real estate markets are still segmented
because of various market imperfections, with each market exhibiting unique characteristics
3 The random walk properties of stock returns is an outcome of the Efficient Markey Hypothesis (EMH) which states that stock prices exhibit unpredictable behavior given available information. The EMH has guided theoretical and empirical research on financial markets.

------------------------------------------------------------------------------------------------------------------------------------------------------ Are international real estate markets integrated? Evidence from chaotic dynamics
7
that distinguish one market from other markets. The disparity in characteristics is thought by
some to explain differences in the level and behavior of returns across markets. In this study,
the term “market integration” is defined as the relationships (i.e. co-movements) of the
different national real estate returns, as well as the relationships between each of the national
real estate returns and the world stock market returns. If the various national real estate
markets are integrated, it implies that there is at least a “common factor” in international real
estate returns (Liow and Webb, 2006).
A number of studies have found evidence of non-linearities in the short-term
movements of stock market and REIT returns (Hsieh, 1991; Chu, 2003 and Ambrose et al,
1992). However, very little is understood about this issue for the major international real
estate markets. With recent studies highlighting the portfolio diversification benefits of
including publicly listed international real estate in a portfolio (Conover et al, 2002; Worzala
and Sirmans, 2003), considerable attention has been given to examining various aspects of
securitized real estate performance in Asia and internationally. It is therefore timely and
important to examine whether there is chaos or non-linear dependence in international real
estate returns and the resulting implications on real estate and stock market integration. This
effort is important and offers an alternative perspective to institutional investors who mainly
rely on the random walk hypothesis for common stock and real estate asset pricing.
Six major real estate markets are included in this study; those of the USA, UK,
Australia, Japan, Hong Kong, and Singapore; and the World real estate market over the period
1990 through June, 2006. Since inadequate time series data for direct real estate returns in all
countries renders the examination of the non-linear dynamics impossible, this study uses
listed property as a proxy for private property. Both weekly and daily real estate security
series are examined. A total-hedged real estate security return series (both weekly and daily)
is also examined. On a scientific level, this study thus requires the adoption of conclusions
from presenting the tests on four datasets to obtain “balanced” inferences. This approach is
specially needed as the subject (non-linearities and chaotic dynamics) is relatively under-

------------------------------------------------------------------------------------------------------------------------------------------------------ Are international real estate markets integrated? Evidence from chaotic dynamics
8
researched in the international real estate literature. Following Larrain (1991), this study uses
a logistic map that is capable of nesting both K-map and Z-map models to examine whether
non-linearities exist in the real estate markets, the presence of which can potentially impact
real estate market integration as well as with the world stock market. Additionally, return for
each market is specified as a non-linear Threshold Autoregressive GARCH – in mean [TAR –
GARCH (1, 1) - M] process to ensure that the non-linearities in returns are not due to
volatility changes. Finally, the forecasting performance of the non-linear and linear TAR-
GARCH models is compared to ascertain if the former can outperform the latter in long range
forecasting.
This is believed to be the first comprehensive study to examine the non-linearities and
chaos dynamics of international real estate markets and market integration from the combined
K- and Z-map perspective. However, Ambrose et al, (1995), Newell et al, (1996), Newell and
Matysiak (1997), and Liow (2006) have investigated the individual non-linear behavior of US
REITs, the listed UK property company shares and international real estate securities from the
“long-memory” and “chaotic” perspectives without considering the market
integration/segmentation and forecasting performance issues.
2 RELATED LITERATURE
In contrast to the widely-accepted linear perspective adopted in the study of financial
asset returns, several stock market studies have questioned this assumption in favor of non-
linearities in mature markets. In addition, other research into the non-linear behavior of stock
markets was motivated by suggestions that low-dimensional non-linear deterministic systems
(i.e. “chaotic”) may generate price behavior as apparently random series (Hsieh, 1991;
Scheinkman & Lebaron, 1989). Savit (1988) suggests that asset returns may not follow a
stochastic process and instead might be generated by deterministic chaos such that the
forecasting errors grow exponentially and the process appears to be stochastic. Scheinkman
and LeBarin (1989) find that stock returns may follow a non-linear dynamic system in the

------------------------------------------------------------------------------------------------------------------------------------------------------ Are international real estate markets integrated? Evidence from chaotic dynamics
9
US. Hsieh (1991) also finds evidence of non-linearities in the daily returns of US stocks.
Other stock market studies include Wiley (1992), Kohers et al, (1997), Antoniou et al, (1997),
Opong et al, (1999), Chu (2002), and Appiah-Kusi and Menyah (2003) whereby the linear
stochastic model or random walk has been shown to be inappropriate in explaining the
complex dynamics of the stock markets. For example, using a Hurst statistic and the BDS
test, Opong et al. (1999) examine the main indices in the UK market (All shares, FTSE100,
FTSE250 and FTSE350) and are able to reject the hypothesis that the series are random,
independent and identically distributed. They also find that some cycles or patterns show up
more frequently than would be expected in a truly random series.
Chaos is a subset of non-linear analysis. According to Larrain (1991), financial price
series that appear to be random may actually have some hidden order or auto-dependency. If
a series has a certain degree of non-linear auto-dependency, it will generate complex behavior
which can be described by fractal and chaotic tests. These tests reveal to what degree the
series is random (unexplainable), or to what degree it is dependent on its past performance.
Non-linearity may be explained in terms of a non-linear feedback mechanism in price
movements. For example, the univariate quadratic logistic map (equation 1 below) is a
function that maps the value at time t-1 into the value at time t. The second term in the
equation is a negative non-linear feedback term which competes with the linear term in
stabilizing the series. This term (feedback mechanism) is non-linear if the corrective measure
taken by the market is not proportional to the original deviation.
12
111 )1( −−−− −=−= ttttt aPaPPaPP (1)4
In applying the non-linear techniques to the US Treasury bills, Larrain (1991) points
out that the important question to address is how and when past interest rates (technical
factors) combine with fundamental factors that will help determine the evolution of future
4 Equation (1) is an example of a logistic map. Hsieh (1991) provides a non-technical explanation of Equation (1). Select P0 between 0 and 1, and generate the sequence of Pt according to equation (1), where a is between 0 and 4. For small values of a, the system is stable and well behaved. But as the value of a approaches 4, the system become chaotic. Hence, for some values of the parameter (a), the dynamics may be simple; while for other values, the dynamics may be chaotic.

------------------------------------------------------------------------------------------------------------------------------------------------------ Are international real estate markets integrated? Evidence from chaotic dynamics
10
interest rates. Larrain (1991) develops a model (equation 2) made up of a non-linear
component, which is called the K-map, and a behavioral component, which is called the Z-
map:
)()(1 itn
itt ZgRfR −−+ += (2)
Here, the structural Z-map model, the second term on the right-hand side of equation
(2), assumes that adaptive adjustments take place slowly with substantial lags. Equation (2) is
expanded into equation (3):
∑ −+++−+−+−= ++ ttttt
nt
nt CYgMfPeYdmapZRcRbamapKR )()()()(:{})()(:{ 1
1
(3)
Here, the exponent n depicts the degree of non-linearity of interest rates, R. The
terms Y, P, M and (Y-C) represent the real GNP, consumer price index, nominal money
supply and savings, respectively, where C is real personal consumption.
Following Larrain (1991), Sewell et al. (1996) examine the issue of stock market and
foreign exchange rate integration between the US and five Asian countries. Their analyses
reveal that some of the time series examined display non-linear dependence and there exists
varying levels of market integration among the time series. On the contrary, there has been
only limited examination of the potential presence of chaotic behavior and non-linear
dependence in real estate markets to date. Ambrose et al, (1992) test real estate investment
trusts (REITs) returns for evidence of the presence of a fractal structure, a subset of non-linear
dynamics. By determining the presence of non-linear dependence versus random behavior,
they hope to conclude whether there was difference in the structure between the real estate
and stock markets and, as a consequence, whether there was evidence of market
segmentation. Using rescaled range analysis and Lo’s test, no evidence of chaotic (long
memory) behavior was found by them. Liow (2006) broadens the analysis into an
international environment. He investigates whether persistence in international real estate
market return and volatility takes the form of long memory using both original (unhedged)
and hedged real estate security returns series. The range of econometric tests applied in his

------------------------------------------------------------------------------------------------------------------------------------------------------ Are international real estate markets integrated? Evidence from chaotic dynamics
11
study is also more extensive than the basic tests by Ambrose et al, (1992) and provide the
potential to differentiate between non-linear (long memory) and linear stochastic structure.
Newell et al, (1996) examine Australian property trusts returns over the 1980-1994 period.
Using an extensive range of tests, which include the BDS test, Lo’s test, correlation
dimension, Lyapunov exponents and three moments test, Newell et at, (1996) find little
evidence of chaos, with stochastic non-linear models being more appropriate to model the
Australian property trust returns. Applying the same methods, Newell and Matysiak (1997)
find that the underlying structure present in the various UK property series is not chaotic, and
that non-linear stochastic models seem the most appropriate models to capture the underlying
dynamic process.
3. DATA
Since direct property performance series do not have sufficient data points for the
analyses conducted in this study, the real estate data used are weekly and daily FTSE
EPRA/NAREIT total return indexes maintained by the European Real Estate Association
(EPRA) for the six most significant real estate markets in the respective regions. The markets
analyzed are the USA, the UK, Australia, Japan, Hong Kong, Singapore and a world real
estate index. This data approach is consistent with that of Ambrose et al, (1982) in utilizing
the US REIT returns over 1962-90, since the US direct real estate performance series (e.g.
NCREIF) do not have sufficient data points to effectively determine the presence of chaos.
The starting date for the EPRA data indexes from Datastream is 29 December 1989.
Therefore this study period starts from January 1990 and covers through June 2006, the
longest weekly (861 observations) and daily (4304 observations) time series that are available
from Datastream. Relying on weekly return series restricts the analysis to shorter time series
with less than 1000 points, and nonstationarity can become an issue as the time period
increases. On the contrary, the use of a daily return series, although it provides sufficient data

------------------------------------------------------------------------------------------------------------------------------------------------------ Are international real estate markets integrated? Evidence from chaotic dynamics
12
points, might exhibit artificial dependence in the non-linearity tests (Gilmore, 1993).
Recognizing that there is no ideal solution, this study includes both weekly and daily tests to
form an “on the balance of evidence” picture. Figure 1 plots the weekly real estate indices.
(Figure 1)
The country level and world equity indices are compiled by the Morgan Stanley
Capital Index (MSCI) and were obtained from the Datastream on-line information system.
The MSCI stock market indices are widely used by international fund managers for asset
allocation decisions and performance measurement, as well by researchers for academic
studies. The returns (R) are obtained by taking the natural logarithmic difference of the index
times 100. Taking the first difference may not only ensure that the time series are stationary,
but is a common practice in standard econometric work to “whiten” a time series. All the
return series are expressed in US dollars and are therefore adjusted for foreign exchange
fluctuations and facilitates cross-country comparisons. As such, the perspective of the US
investors is taken in this study.
Although the EPRA database is constructed to be representative of the universe of
public real estate companies, it is likely that returns on these securities might not accurately
reflect returns in private real estate markets. In order to address this issue, this study also
examines a total-hedged real estate security return series following the procedures developed
by Liang et al. (1996). To the extent that real estate security performance is affected by
general market conditions, the former may contain information about the latter. In contrast,
the total-hedged real estate security data remove the stock market influence from the raw real
estate security index and the resulting index generates a return series that should track real
estate factors more closely.
Following Liang et al. (1996), equation (4) below is first run to estimate the total-
hedge ratio (h):
ttt MKThcRESI ε++= * (4)
------------------------------------------------------------------------------------------------------------------------------------------------------ Are international real estate markets integrated? Evidence from chaotic dynamics
13
Where: RESI t = weekly (daily) real estate security index’s total return and MKT t = weekly
(daily) total return on the market index.
Successive values of h are derived via 52-week or 260-day rolling windows. These
values are used to hedge the 53th week’s (261th day’s) stock market movements. The resulting
total-hedged RESI is calculated as (equation 5):
ε+−−= )( tbillMKThRESIRESIhedged (5)
Where RESI hedged = return for the total-hedged RESI index and tbill = return on the 3-
month US T-bill index.
Because of the loss of observations due to the rolling regression procedures, the
formal analysis with the hedged series commences from January 1991 through June 2006
with 809 weekly and 4044 daily observations for all data series.
4. METHODOLOGY
The empirical framework follows the modeling approach of Larrain (1991) to
investigate whether or not the six major real estate markets are integrated among themselves
and with the world capital market in the presence of return non-linearities. Essentially, the
modeling involves the use of a logistic map that is capable of nesting both linear and non-
linear specifications. As indicated in equation 1, a logistic map is a type of non-linear
function that maps the price of an asset at time t-1 to the price at time t. The analysis in this
study covers five steps which are briefly described below
(a) The non-parametric BDS is employed (Brock et al, 1986) to distinguish
between stochastic systems and non-linear systems that may involve chaos. The BDS test has
been used to test for nonlinear behavior in a wide range of financial data including national
stock indices and exchange rates. It detects departures from the independent and identical
distribution (IID) hypothesis by measuring the statistical significance of the correlation
integral showing the correlation dimension of the time series. The non-IID alternatives

------------------------------------------------------------------------------------------------------------------------------------------------------ Are international real estate markets integrated? Evidence from chaotic dynamics
14
include non-stationarity and linear and non-linear dependence. A white noise process is
completely disorderly and has infinite dimension; a purely random process also has infinite
dimension; a chaotic or non-linear system has a finite dimension. Methodologically, the
correlation integral calculates the probability that any two points that are part of two
trajectories in phase space are ε units apart. As ε increases, the probability scales according
to increases with the fractal dimension of the phase space.
All the real estate return series with an autoregressive (AR-p) model are filtered to
remove linear dependences, where the lag length p is selected based on the Minimum Akaike
Information Criterion (MAICE). The residuals are tested with the BDS procedure. A
Generalized Autoregressive Conditional Heteroskedasticity (GARCH) model is also
employed to remove conditional heteroskedascity. The residuals from the GARCH models
are again tested with the BDS procedure. The null hypothesis tested here is that each of the
real estate series is IDD. Under the null hypothesis that the index series under study is
random, the null hypothesis can be rejected with 95% confidence when the BDS statistic
exceeds 2.0. If the BDS statistics reject the null of IDD, we then proceed with step 2 to
investigate whether deterministic chaos could exist for the real estate series.
(b) The effects of the non-linear components in the logistic map are referred to as
the K-map. In step 2, whether non-linearities exist in the index series is analyzed with
equation (6):
tttttt RbRbRbRbaR ε+++++= −−−− )()()()( 14
413
312
2110 (6)
Where R t is the return and tε is an error term at time t. Equation (6) is also labeled
as a K-map logistic equation. As pointed out by Larrain (1991), equation (4) is an alternative
form of logistic map that generates chaotic behavior. The main purpose of using this approach
is not to determine the precise nature of any non-linearity, but rather to ascertain whether any
non-linearity exists. Furthermore, the chaotic behavior of non-linear difference equations is
rather insensitive to the details of the non-linear term, so long as it is non-linear. Hence, by
extending equation 6 to include lagged values raised to the fourth power, the non-linear

------------------------------------------------------------------------------------------------------------------------------------------------------ Are international real estate markets integrated? Evidence from chaotic dynamics
15
process should be approximated. If none of the non-linear terms is found to be significant, a
linear model is implied; otherwise, evidence of non-linearity would indicate changes in the
risk-return relationship that might induce non-linear returns in accordance with the
implications of the logistic map.
(c) Once the statistically significant lagged values have been determined, in step
3 a full logistic map is formed which is made up of a non-linear component (K-map) and a
behavioral component, which is called the Z-map. Specifically the Z-map in this study can be
defined in two ways. First, it serves as an indicator of the degree of market integration among
the six national real estate markets. As an example, suppose that all of the K-map variables
for Japan are significant when equation (6) was estimated, the Z-map model for Japan would
be:
)7......().........()()()()()()()()(
9876
514
413
312
2110
tttt
tttttt
HKRbSGRbAURbUKRbUSRbJPRbJPRbJPRbJPRbaJPR
+++++++++= −−−−
The coefficients b5 – b9 in equation (7) would capture the Z-map effect and allow an
examination of the degree of market integration among the national real estate markets.
Alternatively, the MSCI world equity index is used to proxy for the Z-map effects on
the degree of integration of the national real estate markets with the world capital market
(Equation 8):
)()()()()( 14
413
312
2110 tttttt MSCIcJPRbJPRbJPRbJPRbaJPR +++++= −−−− (8)
The coefficient c would capture the Z-map effect. The interaction between the K-
map and Z-map is another issue of interest from equation (6). Specifically, if the K-map
dominates the Z-map it indicates that the country specific real estate factors dominate world-
wide capital market factors, and hence is an indicator of market segmentation. On the
contrary, Z-map dominance indicates a greater degree of market integration between the real
estate and the world stock market.
(d) The relationship between the conditional real estate market returns and
conditional volatility is investigated for those markets where at least one of the K-map
------------------------------------------------------------------------------------------------------------------------------------------------------ Are international real estate markets integrated? Evidence from chaotic dynamics
16
coefficients is statistically significant. Equation 8 is expanded and estimated by the Threshold
Autoregressive GARCH – in mean specification [TAR – GARCH (1, 1) - M] as follows:
tttttttt dMSCIDummycbRaRaRaRaaR εσ ++++++++= −−−− )(2443322110 (9)
)(412
132
122
1102 DummyeIeeee ttttt ++++= −−−− σσεσ (10)
In the mean equation 9, the market return R t is specified as a first-order
autoregressive process with the non-linear variables (K-map), world capital market (MSCI)
(Z-map), its own conditional variance and a Asian financial crisis dummy (DUMMY), which
takes a value of 1 for the period July 1997 – August 1998; and zero otherwise. The main
objective in including this crisis dummy is to control for regime swifts in the three Asian real
estate markets (i.e. Japan, Hong Kong, and Singapore) following the Asian financial crisis in
July 1997. A research study by Kallburg et al (2002) finds that there was a reduction in the
real estate market returns and increases in the volatility and correlations following the crisis.
The parameter b for the conditional variance tests the linkage between the return and
conditional volatility. A significant value for b, which can be either positive or negative,
means that the conditional volatility contributes to the risk premium.
The conditional variance in equation (10) is assumed to be predicted by the previous
variance 21−tσ , the square of the previous shock 2
1−tε and the crisis dummy. Additionally,
the positive and negative shocks are differentiated by the indicator variable 1−tI that takes a
value of 1 when the previous shock is negative and zero otherwise. The asymmetric effect is
thus captured by the hypothesis that 3e >0. A positive 3e implies that a negative innovation
increases conditional volatility.
(e) The forecasting accuracy of the non-linear TARCH (1, 1) - M and linear
TARCH (1, 1) – M models is evaluated in term of static forecast (one-step ahead) and two
years–step dynamic forecast. The main objective is to answer the following question: if the
non-linear expressions are more descriptive than the linear relationship, are they also better

------------------------------------------------------------------------------------------------------------------------------------------------------ Are international real estate markets integrated? Evidence from chaotic dynamics
17
predictors? Four criteria are employed: root mean square errors (RMSE), mean absolute
errors (MAE), mean absolute percentage errors (MAPE), and Theil’s inequality coefficient.
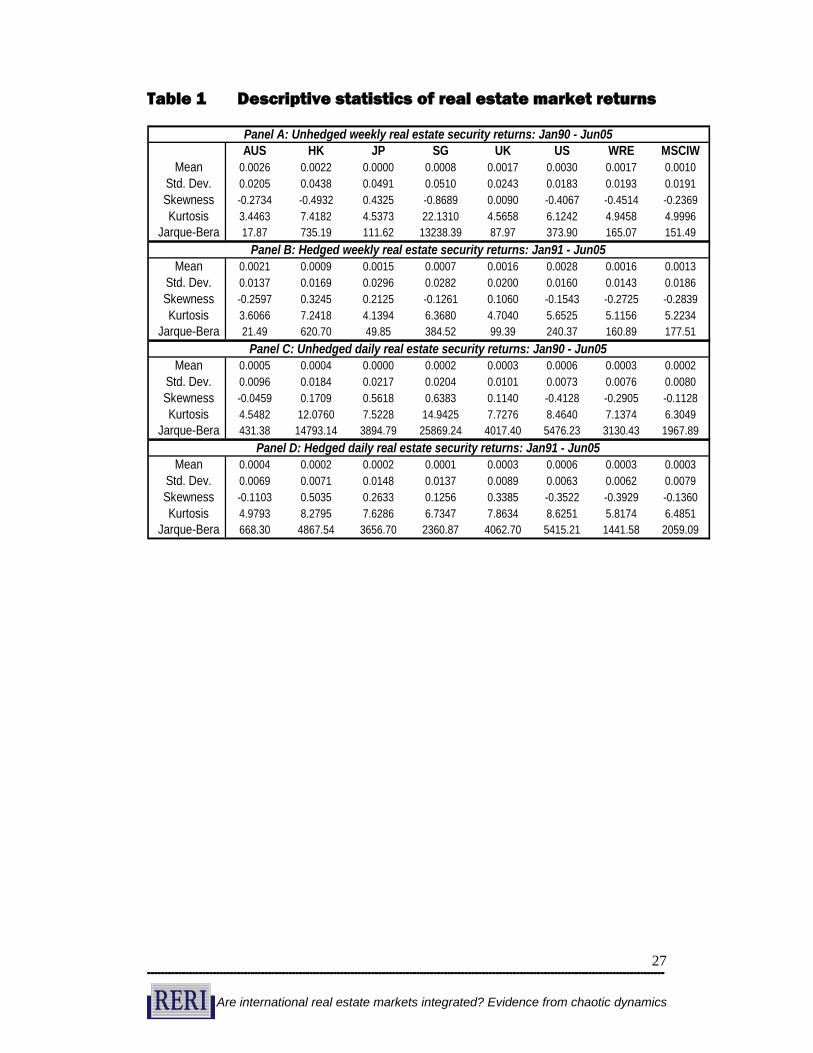
5. RESULTS 5.1 Descriptive statistics
Table 1 provides details of the mean, standard deviation, skewness, kurtosis and
Jarque-Bara statistic of both the original and hedged real estate return series. It can be seen
that for all six national markets and World real estate the use of the weekly and daily hedged
indices results in a reduction in the standard deviation of the series. In some cases this
reduction is quite significant. For example, in the case of the Hong Kong market, the weekly
standard deviation of the hedged series is 1.69%, in comparison to an original figure of
4.38%. In addition, with the exception of Japan, each of the seven markets sees a slight
reduction in the mean weekly returns. It is also noticeable that in three cases (UK, US, and
WRE) the mean daily returns for the hedged series are similar to those of the original series.
With minor exceptions, all series are significantly skewed and leptokurtic relative to the
normal distribution. Finally, Figure 2 and Figure 3 plot the weekly and daily hedged ratios
for the real estate series. The average weekly hedge ratios are 0.498 (US), 0.624 (AUS), 0.668
(UK), 0.837 (WRE), 1.157(HK), 1.233 (JP) and 1.300 (SG). The respective average daily
hedge ratios are however smaller: 0.359 (US), 0.519 (UK), 0.589 (AUS), 0.717 (WRE), 1.083
(HK), 1.092 (JP) and 1.160 (SG).
(Table 1, Figure 1 and Figure 2 here) 5.2 Non-linearity and Chaos – BDS results
The BDS statistics are needed to determine whether each of the real estate series is
stochastic or is a non-linear system. The values for the BDS statistic are shown in Table 2
(weekly), Table 3 (hedged weekly indices), Table 4 (daily) and Table 5 (hedged daily
indices). The analyses are conducted on the return residuals after each return series passed

------------------------------------------------------------------------------------------------------------------------------------------------------ Are international real estate markets integrated? Evidence from chaotic dynamics
18
through its corresponding autoregressive and GARCH filters. All residual series are
examined for embedding dimensions between 2 and 5 (weekly series) and between 2 and 10
(daily series) respectively.5 The value of ε is 0.5, 1.0, 1.5, and 2.0 times the standard
deviation of the series.
(Tables 2 to 5 here)
With most of the results exceeding 2, the BDS results indicate that the original and
hedged real estate series are not independently and identically distributed. The main
exception is with the UK hedged weekly series where the null cannot be rejected in nine of
sixteen cases. This indicates that the series is probably stochastic6. These significant values
of the BDS test for the real estate series points to a possible non-linear structure in the series.
The preliminary conclusion is that for most of the real estate series, some non-linear structure
is probably present; but provides no evidence as to whether this non-linear structure is
deterministic (i.e. chaotic) or stochastic.
5.3 K-map results
Based on the BDS statistics reported above, it appears that the UK hedged weekly
real estate series is stochastic. Further analysis is therefore not justified.
The K-map results conducted on equation 6 are reported in Table 6. There is some
evidence that the non-linear (K-map) terms influence the real estate index returns. Of the 28
real estate series, there are six weekly indices (US, UK, AUS, JP, SG, and World Real
Estate), two hedged weekly indices (HK and SG), five daily indices (UK, JP, HK, SG, and
World Real Estate) and two hedged daily indices (HK and AUS), respectively, that has at
least one K-map term that is statistically significant. The Adj R2 values for these 15 series
5 The number of n-histories (embedding dimensions) constructed from each series is limited to (no of obs)/200 or 10 to allow a comparison across a wide range of dimensions. 6 Some scattered insignificant BDS values are observed for the UK weekly series, Australia and Hong Kong weekly hedged series and the UK daily series. With some reservation, the study will proceed with the K-map and Z-map analyses and report the results together with other series whose null of IID is consistently rejected by the BDS test.

------------------------------------------------------------------------------------------------------------------------------------------------------ Are international real estate markets integrated? Evidence from chaotic dynamics
19
range between 0.7 and 4.9 percent. Comparatively, only four hedged series have a significant
K-map term. One possible interpretation is that since stock prices are consistent with a non-
linear data generating process (Scheinkman and LeBaron, 1989), we would probably expect
the hedged real estate return series (with the stock market influence removed) to have no or
weaker evidence of non-linearities than the original real estate series, and this was the case.
(Table 6) 5.4 Non-linearities and market integration
Table 7 reports the full logistic map results based on equation 7 for the 13 non-linear
real estate series (excluding the two world real estate series). The model contains both lagged
exponential same country market returns (K-map) and other real estate markets’ returns (Z-
map). The regression results in Table 7 thus give an indication of the relative strength of
same country lagged exponential returns versus other markets’ returns. 7 There is some
evidence that the K-map terms influence the markets. Of the thirteen real estate return series,
there is at least one significant K-map coefficients in five cases; two K-map coefficients in
seven cases; in one case (HK hedged daily series) the three non-linear coefficients are highly
significant and appear to indicate K-map dominance. Furthermore, there are five, nine, and
eight, respectively, significant coefficients for the R2, R3 and R4 terms. For n = 2 (i.e. R2), the
nature of the dependency of returns on past returns is either negative (3 cases) or positive (2
cases). These two coefficients represent, respectively, non-linear growth and declining rates
for past returns. For n = 3 (R3), the nature of the dependency of returns on past returns is
mainly negative (6 cases, 66.7%); whereas the nature of the dependency of returns on past
returns is mainly positive (5 cases, 62.5%) for n = 4 (R4).
Table 7 also shows that in the cases of the weekly and daily real estate series, most of
the Z-map coefficients are statistically significant and positive, a finding which supports the
notion of market integration among the major national real estate markets. The Adj R2 values
7 A non-linear specification could also be appropriate for the Z-map components (i.e. other real estate markets’ returns). Since the focus is on the non–linear dynamics in self-returns, non-linearity in the Z-map components was not included.

------------------------------------------------------------------------------------------------------------------------------------------------------ Are international real estate markets integrated? Evidence from chaotic dynamics
20
range between 10.1 and 38.5 percent. The implication is that the lagged same country’s
market returns (K-map) combine with other markets’ returns (Z-map) help determine the
future evolution of the same country’s market return; and that the effects of chaos are weaker.
On the contrary, there appears to have some dominance of K-map influence in the four
hedged real estate series; the K-map coefficients are large and significant and there are
relatively more insignificant z-map coefficients. One possible explanation is that if the hedged
real estate security series are considered a better proxy for the direct real estate market, the
findings imply the national direct real estate markets are still largely segmented, and that past
non-linear returns affect the level of future returns to a greater degree (K-map).8
In order to further test whether these results are valid over varying historical time
periods, recursive regressions on equation 8 are conducted to test for constancy of the
significance of the K-map components. Figure 4 plots the recursive t-values for the 22
significant K-map coefficients over the full study period. Focusing on the 95% significant
bands where (t >. 1.96) and (t< - 1.96), the evidence indicates that although several K-map
coefficients are statistically insignificant over some estimation periods, all of them are
statistically significant (positive or negative) more than 50 percent of the time, with
intermittent fluctuation in the level of significance observed for some K-map coefficients.
(Figure 4 here)
The estimates of the mean equation (9)’s parameters are reported Table 8. As
observed, the tests for evidence of non-linearities in the return-generating process are
confirmed by the statistically significant coefficient estimates for at least one an (where n = 2,
3 and 4) estimates for 12 of the 15 markets. The three exceptions are Singapore (weekly
returns), Singapore (daily returns), and Australia (hedged daily returns) where none of the
non-linear coefficients is statistically significant. Compared with other countries, it appears
8 However, Liang et al. (1996) also point out that although there is a connection between the hedged-equity REIT return index and the Russell-NCREIF index, the notion of the hedged REIT returns being more representative for real estate returns than the raw REIT data is not universally accepted. Accordingly, caution should be exercised in interpreting the results associated with the hedged real estate index.

------------------------------------------------------------------------------------------------------------------------------------------------------ Are international real estate markets integrated? Evidence from chaotic dynamics
21
that the Hong Kong real estate market has the strongest K-map components. Its weekly
hedged, daily, and daily hedged real estate series have two significant non-linearity
coefficients each. Similarly the Japanese and world real estate series (weekly) also have two
significant K-map terms each. The estimates for the Z-map component (MSCI) also confirm
that all the original series (weekly and daily) are strongly correlated with the MSCI
(coefficient d) thereby indicating close integration of the public real estate markets with the
world stock market. Hence, there is some evidence both the K-map and Z-map terms
influence the real estate markets. On the contrary, the Z-map term is statistically insignificant
in 2 of the 3 hedged real estate series that are influenced by the K-map terms. Hence, if the
hedged real estate series is regarded as a better proxy for the unsecuritized real estate market,
the results indicate that the real estate markets are more sensitive to the country-specific
factors (as indicated by the K-map terms) and less (/not) influenced by the global factors
(proxied by the Z-map term), a finding that is in broad agreement with Ling and Naranjo
(2002). 9 Consistent with expectations, a significant and negative Asian financial crisis
coefficient (c) for the Japan, Singapore, Hong Kong, and the World real estate market is also
found. Except for the UK (weekly), Hong Kong (weekly hedged) and world real estate
(daily) markets, no significant statistical relationship between the expected return and
conditional volatility (b) for the remaining real estate return series is found.
(Table 8 here)
With respect to the estimates for the TGARCH conditional variance equation (10),
the GARCH parameter estimates (e2) are all statistically significant and are all much larger
than the ARCH coefficient estimates (e1), implying that the prediction of the volatility is
dominated by the AR component. The volatility persistence, measured by (e1 + e2) is high,
but always less than 1 for all series. Except for five series (weekly: US, AUS, and World;
daily: UK; and daily hedged: Hong Kong), the hypothesis of no asymmetric effect (e3 = 0) is
statistically rejected for the remaining 9 series. Moreover a positive e3 (13 cases) implies that
9 Ling and Naranjo (2002) find evidence of a strong world-wide factor in international securitized real estate returns. Moreover an orthogonalized country-specific factor is also highly significant.

------------------------------------------------------------------------------------------------------------------------------------------------------ Are international real estate markets integrated? Evidence from chaotic dynamics
22
a negative shock increases the conditional volatility in these markets. This finding is in
agreement with Liow (2006), who finds asymmetry in the 12 country conditional volatilities
international real estate securities markets.
Finally, Table 9 summarizes the results of the forecasts for the 12 non-linear real
estate series on a post sample from 2004:6 to 2006:6. For three cases (Japan and worth
weekly series and Singapore hedged weekly index), the non-linear model outperforms the
linear model in every criterion in both the static and dynamic forecasts. On the contrary, the
linear model appears to be a better predictor than its non-linear counterpart for the AUS
weekly index and HK hedged weekly real estate index. Additionally, there is mixed evidence
on the forecasting performance for the remaining seven non-linear series. For static forecast,
the average RMSE, MAE, MAPE, and Thail’s coefficients are 0.0142, 0.0111, 201.03 and
0.6766 for the non-linear model, as opposed to 0.0148, 0.0115, 207.51, and 06906 for the
linear model. These represent a 3.63, 3.75, 3.22, and 2.06 percent reduction in the four
forecast errors with the non-linear model. For the dynamic forecast, the average values show
that there is also a 2.68 percent (RMSE), 2.52 percent (MAE), and 2.00 percent (Thail’s
coefficient) reduction in the forecast errors with the non-linear model. However, there is a
6.67 percent increase in the MAPE forecast error with the non-linear model. In all, the
comparisons of the two models’ forecasting accuracy show that incorporating the K-map
components in the TGARCH model appear to improve the forecasting performance over the
conventional linear TGARCH model. However, this finding is at best inconclusive due to the
mixed results obtained for some individual series.
(Table 9 here)
6. ADDITIONAL INVESTMENT IMPLICATIONS
Our results have additional implications for global investors. The popular Johansen
cointegration test is built on the basis of linear autoregressive model and implicitly assumes
that underlying dynamics are in linear form or can be made linear by a simple

------------------------------------------------------------------------------------------------------------------------------------------------------ Are international real estate markets integrated? Evidence from chaotic dynamics
23
transformation.10 In addressing the issue of long-run relationships among real estate markets,
the presence of non-linear “chaotic” processes in some real estate markets’ returns means that
the standard Johansen- linear cointegration test could be misleading since the true nature of
the adjustment process is non-linear and the speed of adjustment varies with the magnitude of
the disequilibrium (Bierens, 1997). The results of Li (2006) indicate that it is possible that
much more evidence of market integration could emerge from nonlinear, rather than linear
cointegration analysis, suggesting that comovements among national stock markets may well
take nonlinear forms. Hence, when nonlinear cointegration among national real estate markets
is also allowed for, real estate assets available to global investors would become even less
than when only linear cointegration is allowed. Thus, global investors should be cautious in
formulating their diversification strategies if real estate markets are, in fact, chaotic, gains
from diversification may not occur in the long-run.11
7 CONCLUSIONS
In this study a logistic model of chaos is used to analyze the temporal variation of real
estate market returns on six real estate series and a hedged index. The tests were undertaken
in an examination of market integration that included how common factors (Z-maps) and
country specific factors (K-maps) influence international real estate returns. There is
evidence in some of the real estate series of non-linear dependencies. These non-linearities
could arise from a representation of the time series as a non-linear function of past
observations. Furthermore, evidence of varying levels of market integration is detected for
these series. The implication is that the past same country market’s returns (both linear and
non-linear) combined with other markets’ returns or with the MSCI world stock market
returns help determine the future evolution of the same country real estate market’s return.
10 To this end, the Johansen cointegration analysis tests empirically the EMH in an international context. 11 It is beyond the scope of this study to examine non-linear cointegration among the national real estate markets. Future research can employ the non-parametric cointegration test proposed by Bierens (1997) and Breitung (2002).

------------------------------------------------------------------------------------------------------------------------------------------------------ Are international real estate markets integrated? Evidence from chaotic dynamics
24
The analyses also suggest a need to account for non-linear chaotic behavior in forecasting
models in order to obtain potentially more accurate real estate return forecasts.
Overall, important contributions of this study are the findings of statistically
significant evidence of nonlinearity and low deterministic chaotic behavior in some real estate
market returns. These results are important because knowing that real estate market returns
exhibit chaotic behavior can help understand the evolution of real estate market returns better
and find ways of predicting them. In this respect the results also have practical implications,
because they suggest that international integration models for real estate market returns
should include some nonlinear terms.
Of course, whether or not the direct real estate market is chaotic cannot be fully
resolved without rigorous empirical evidence. One obvious reservation is that inferences
based on indirect property (or even the hedged indices) as a proxy for direct property are
definitely subject to qualification, and criticism. Specifically, whether the non-linear chaotic
structures in real estate security performance for some countries are inherited by the direct
property market cannot be answered at this stage. Second, we have not addressed the
methodological issue regarding the role played by outliers (extreme observations) in testing
for chaos; i.e. are they the results of large exogenous shocks or are they inherently related to
the dynamic behavior of the model. Another question is whether the findings are useful from
a practicing professional’s standpoint. For example, if real estate markets are chaotic, can this
be used to implement a more effective trading strategy or risk measurement/management
approach?
Nevertheless, this study indicates the possible existence of chaos in major securitized
real estate markets and suggests that a technical, non-linear lagged return structure capable of
irregular and violent behavior is capable of explaining and forecasting the specific return-
generating processes. Furthermore, the possible presence of chaotic processes in some real
estate markets indicates that different portfolio management practices may be appropriate for
global investors.

------------------------------------------------------------------------------------------------------------------------------------------------------ Are international real estate markets integrated? Evidence from chaotic dynamics
25
REFERENCES Ambrose, B. W., E. Ancel and M. D. Griffiths (1992), “The fractal structure of real estate investment trust returns: the search for evidence of market segmentation and non-linear dependency” Journal of the American Real Estate and Urban Economics Association 20(1), 25-54. Appiah-Kusi, J. and K. Menyah (2003), “Return predictability in African stock markets”, Review of Financial Economics 12: 247-270. Antoniou, A., N. Ergul and P. Holmes (1997), “Market efficiency, thin trading and non-linear behavior: evidence from an emerging market” European Financial Management 3(2): 175-190. Bierens, H.J. (1997), “Nonparametric cointegration analysis” Journal of Econometrics 77: 339-404 Breitung, J. (2002), “Nonparametric tests for unit roots and cointegration” Journal of Econometrics 108: 343-363. Brock, W., Derchert, W.D. and J. Scheinkman (1986), A test for independence based on the correlation dimension, Working paper, University of Wisconsin. Conover, M., Friday, S. and S. Sirmans (2002), “Diversification benefits from foreign real estate investment” Journal of Real Estate Portfolio Management 8(1): 17-26. Chu, P. (2003), “Study on the non-random and chaotic behavior of Chinese equities markets” Review of Pacific Basin Financial Markets and Policies 6(2): 199-222. Gilmore, C.G. (1993), “A new approach to testing for chaos, with applications in finance and economics” International Journal of Bifurcation and Chaos 3(3): 583-587. Hsieh, D. (1991), “Chaos and non-linear dynamics: application to financial markets” Journal of Finance XLVL (5): 1839-1877. Kallberg, J.G., C.H. Liu, and P. Pasquariello (2002), “Regime shifts in Asian equity and real estate markets” Real Estate Economics, 30(2) 262-92. Larrain, M. (1991), “Testing chaos and non-linearities in T-bill rates” Financial Analysts Journal, September/October: 51-62 Li, X-M (2006), “A revisit of international stock market linkages: new evidence from rank tests for non-linear cointegration” Scottish Journal of Political Economy 53(2): 174-196 Liang, Y., A. Chatrath and J. Webb (1996), “Hedged REIT indices”, Journal of Real Estate Literature 4: 175-184. Ling, D.C. and A. Naranjo (2002), “Commercial real estate return performance: a cross-country analysis” Journal of Real Estate Finance and Economics 24(1/2): 119-142. Liow, K.H., “The dynamics of return volatility and systematic risk in international real estate security markets” Journal of Property Research, forthcoming

------------------------------------------------------------------------------------------------------------------------------------------------------ Are international real estate markets integrated? Evidence from chaotic dynamics
26
Liow, K.H. (2006), “Uncovering long memory in international real estate security markets” Working paper, Department of Real Estate, National University of Singapore Liow, K.H. and J.R. Webb (2006), “Common Factors in International Securitized Returns” Working paper, Department of Real Estate, National University of Singapore and Department of Finance, Cleveland State University. Opong, K., G. Mulholland, A. Fox and K. Farahmand (1999), “The behavior of some UK equities indices: an application of Hurst and BDS tests” Journal of Empirical Finance 6: 267-282. Newell G., M. Peat and M. Stevenson (1996), “Testing for evidence of non-linear structure in Australian real estate market returns” Working paper, University of Western Sydney and University of Technology Sydney, Australia. Newell, G. and G. Matysiak (1997), “An empirical investigation into the presence of chaotic behaviour in UK Property Market” Research report, The Royal Institute of Chartered Surveyors Savit, R. (1989), “Non-linearities and chaos effects in option prices” Journal of Future Markets 9(6): 507. Scheinkman, J. and B. LeBaron (1989), “Non-linear dynamics in stock returns” Journal of Business 62(3): 311-337. Sewell, S.P., S.R. Stansell, I. Lee and S.D. Below (1996), “Using chaos measures to examine international capital market integration” Applied Financial Economics 6: 91-101. Wiley, T. (1992), “Testing for non-linear dependence in daily stock indices” Journal of Economics and Business 44(1): 63-76 Worzala, E. and C.F. Sirmans (2003), “Investing in international real estate stocks: a review of the literature” Urban Studies 40 (5/6), 1115-1149.
------------------------------------------------------------------------------------------------------------------------------------------------------ Are international real estate markets integrated? Evidence from chaotic dynamics
27
Table 1 Descriptive statistics of real estate market returns
AUS HK JP SG UK US WRE MSCIW Mean 0.0026 0.0022 0.0000 0.0008 0.0017 0.0030 0.0017 0.0010
Std. Dev. 0.0205 0.0438 0.0491 0.0510 0.0243 0.0183 0.0193 0.0191 Skewness -0.2734 -0.4932 0.4325 -0.8689 0.0090 -0.4067 -0.4514 -0.2369 Kurtosis 3.4463 7.4182 4.5373 22.1310 4.5658 6.1242 4.9458 4.9996
Jarque-Bera 17.87 735.19 111.62 13238.39 87.97 373.90 165.07 151.49
Mean 0.0021 0.0009 0.0015 0.0007 0.0016 0.0028 0.0016 0.0013 Std. Dev. 0.0137 0.0169 0.0296 0.0282 0.0200 0.0160 0.0143 0.0186 Skewness -0.2597 0.3245 0.2125 -0.1261 0.1060 -0.1543 -0.2725 -0.2839 Kurtosis 3.6066 7.2418 4.1394 6.3680 4.7040 5.6525 5.1156 5.2234
Jarque-Bera 21.49 620.70 49.85 384.52 99.39 240.37 160.89 177.51
Mean 0.0005 0.0004 0.0000 0.0002 0.0003 0.0006 0.0003 0.0002 Std. Dev. 0.0096 0.0184 0.0217 0.0204 0.0101 0.0073 0.0076 0.0080 Skewness -0.0459 0.1709 0.5618 0.6383 0.1140 -0.4128 -0.2905 -0.1128 Kurtosis 4.5482 12.0760 7.5228 14.9425 7.7276 8.4640 7.1374 6.3049
Jarque-Bera 431.38 14793.14 3894.79 25869.24 4017.40 5476.23 3130.43 1967.89
Mean 0.0004 0.0002 0.0002 0.0001 0.0003 0.0006 0.0003 0.0003 Std. Dev. 0.0069 0.0071 0.0148 0.0137 0.0089 0.0063 0.0062 0.0079 Skewness -0.1103 0.5035 0.2633 0.1256 0.3385 -0.3522 -0.3929 -0.1360 Kurtosis 4.9793 8.2795 7.6286 6.7347 7.8634 8.6251 5.8174 6.4851
Jarque-Bera 668.30 4867.54 3656.70 2360.87 4062.70 5415.21 1441.58 2059.09
Panel A: Unhedged weekly real estate security returns: Jan90 - Jun05
Panel B: Hedged weekly real estate security returns: Jan91 - Jun05
Panel C: Unhedged daily real estate security returns: Jan90 - Jun05
Panel D: Hedged daily real estate security returns: Jan91 - Jun05

------------------------------------------------------------------------------------------------------------------------------------------------------ Are international real estate markets integrated? Evidence from chaotic dynamics
28
Table 2
BDS statistics on the null of independent and identical distribution (i i d) using holding period returns filtered with AR (p) and GARCH (1, 1) models for the weekly real estate return series:
January 1990 – June 2006
Notes: 1. The lag length p is selected based on the Minimum Akaike Information Criterion (MAICE). The results are 1(AUS), 1 (JP), 1(UK), 2 (HK), 2 (US), 2(WD)
and 5 (SG) 2. Embedding dimension (m) limited to n/200 or 5, where n =861 3. Pairs can be no further apart than this distance, which is 0.5, 1.0, 1.5 or 2 times the standard deviation of the series 4. *, - indicates that the BDS statistic is not significant at the 5 percent level, hence the null hypothesis of i.i.d cannot be rejected
m US UK AUS JP HK SG WD US UK AUS JP HK SG WD0.5 2 3.747 2.253 3.181 4.022 4.755 5.898 3.749 4.341 1.701* 3.411 4.329 4.454 6.565 3.9360.5 3 4.365 3.031 4.619 4.122 5.579 7.958 4.413 4.915 2.583 4.915 4.442 6.378 8.492 4.8420.5 4 5.762 3.576 5.051 5.193 7.574 8.862 4.398 6.367 3.516 5.448 5.792 8.327 9.382 4.7580.5 5 6.876 3.963 5.547 6.063 9.311 10.966 4.516 7.819 4.117 5.928 7.039 9.936 11.303 4.3021 2 4.199 1.862* 3.054 4.571 4.919 7.181 3.757 4.573 1.879* 3.374 4.867 4.786 7.493 3.8851 3 4.438 2.955 4.719 4.984 5.939 9.008 4.324 4.861 2.904 4.913 5.283 6.293 9.119 4.5471 4 5.109 3.296 5.168 6.047 6.897 9.963 4.704 5.527 3.354 5.289 6.337 7.245 9.986 4.9681 5 6.272 3.043 5.935 6.721 7.923 11.389 4.835 6.697 3.087 6.103 6.992 8.129 11.025 5.077
1.5 2 5.046 1.366* 3.346 5.138 5.012 7.987 3.914 5.366 1.486* 3.855 5.509 5.084 8.682 3.9411.5 3 5.244 2.611 4.797 5.456 5.905 9.537 4.706 5.469 2.519 5.088 5.932 6.535 10.096 4.9121.5 4 5.452 3.005 5.207 6.293 6.438 10.387 5.111 5.688 2.991 5.366 6.779 7.122 10.672 5.4671.5 5 6.146 2.687 5.827 6.609 7.117 11.161 5.238 6.412 2.653 6.001 7.055 7.672 11.106 5.5982 2 5.824 1.203* 3.399 5.649 5.286 8.631 4.028 5.955 1.079* 4.109 5.919 5.715 9.099 4.0212 3 6.045 2.535 4.593 5.959 6.078 9.905 5.211 6.073 2.251 5.109 6.351 6.921 10.623 5.3162 4 5.893 3.119 4.932 6.661 6.209 10.641 5.558 5.898 2.964 5.205 7.057 7.068 11.236 5.8122 5 6.069 2.746 5.281 6.798 6.656 11.081 5.703 6.111 2.611 5.588 7.162 7.373 11.451 6.001
AR-Filtered GARCH - Filtered

------------------------------------------------------------------------------------------------------------------------------------------------------ Are international real estate markets integrated? Evidence from chaotic dynamics
29
Table 3 BDS statistics on the null of independent and identical distribution (i i d) using holding period returns filtered with AR (p) and GARCH (1, 1) models for the weekly hedged real estate return
series: January 1991 – June 2006
m US UK AUS JP HK SG WD US UK AUS JP HK SG WD0.5 2 4.823 0.408* 1.703* 7.305 1.701* 3.983 1.765* 4.823 0.408* 2.444 7.237 2.075 5.377 1.263*0.5 3 4.869 0.861* 2.746 9.910 2.924 6.024 2.152 4.870 0.860* 2.973 9.869 3.848 7.245 2.0650.5 4 6.296 1.949* 3.251 11.562 3.836 7.207 2.029 6.296 1.950* 3.970 11.604 5.259 8.394 2.5020.5 5 7.411 1.736* 3.835 13.333 4.870 7.913 2.225 7.411 1.736* 4.592 13.510 6.618 8.552 3.4561 2 4.628 0.730* 1.961* 6.992 1.614* 4.423 2.549 4.628 0.730* 2.752 6.829 1.973* 5.905 2.1711 3 5.201 1.352* 2.775 9.389 2.684 6.269 2.821 5.201 1.352* 3.219 9.493 3.272 7.673 2.8021 4 6.175 2.095 3.492 11.174 3.566 7.160 2.945 6.175 2.095 3.946 11.354 4.335 8.621 3.1341 5 7.709 2.109 4.147 12.944 4.352 7.895 3.005 7.079 2.109 4.676 12.963 5.135 9.305 3.353
1.5 2 5.099 1.227* 2.111 6.358 2.576 4.167 2.617 5.099 1.227* 2.848 6.316 2.847 5.342 2.3281.5 3 5.488 1.728* 2.715 8.054 3.154 5.618 2.673 5.490 1.728* 3.137 8.193 3.676 6.773 2.6851.5 4 5.903 2.406 3.339 9.369 3.891 6.409 2.908 5.903 2.405 3.670 9.573 4.519 7.505 3.0611.5 5 6.197 2.434 3.759 10.430 4.395 7.322 2.937 6.197 2.434 4.117 10.594 5.041 8.229 3.1752 2 5.019 1.724* 1.674* 5.949 3.719 3.432 2.522 5.020 1.724* 2.443 5.548 3.861 4.650 2.2422 3 5.414 2.324 2.169 7.224 3.784 4.272 2.465 5.414 2.325 2.652 6.972 4.248 5.456 2.3282 4 5.632 2.887 2.707 8.183 4.735 4.766 2.609 5.632 2.887 3.020 8.059 5.277 5.832 2.5252 5 5.609 2.859 2.759 8.735 5.339 5.481 2.571 5.609 2.859 3.095 8.639 5.858 6.278 2.549
AR-Filtered GARCH - Filteredσ
ε
Notes: 1. The lag length p is selected based on the Minimum Akaike Information Criterion (MAICE). The results are 0 (US), 0 (UK), 1 (AUS), 1(JP), 1 (SG), 2 (WD)
and 2(HK) 2. Embedding dimension (m) limited to n/200 or 5, where n =811 3. Pairs can be no further apart than this distance, which is 0.5, 1.0, 1.5 or 2 times the standard deviation of the series 4. *, - indicates that the BDS statistic is not significant at the 5 percent level, hence the null hypothesis of iid cannot be rejected

------------------------------------------------------------------------------------------------------------------------------------------------------ Are international real estate markets integrated? Evidence from chaotic dynamics
30
Table 4 BDS statistics on the null of independent and identical
distribution (i i d) using holding period returns filtered with AR (p) and GARCH (1, 1) models for the daily real estate return series:
January 1990 – June 2006
m US UK AUS JP HK SG WD US UK AUS JP HK SG WD0.5 2 4.804 2.253 3.645 4.188 4.681 6.078 11.235 17.794 7.247 6.151 10.579 11.379 16.212 12.8990.5 3 5.097 3.031 4.817 4.392 5.646 8.336 13.197 22.498 9.711 6.536 14.281 13.603 21.136 14.8220.5 4 6.246 3.576 5.316 5.708 7.527 9.562 15.016 27.468 11.540 7.558 16.994 16.176 25.469 16.5950.5 5 7.586 3.963 5.794 7.197 9.035 11.772 16.309 33.530 13.760 8.963 20.347 18.957 30.310 17.9920.5 6 8.676 4.110 5.705 8.196 12.147 13.990 17.694 42.463 16.131 10.669 24.383 22.094 36.305 19.3760.5 7 10.521 3.544 4.893 10.219 16.023 16.842 19.628 53.475 18.984 12.466 28.935 25.407 44.206 21.7940.5 8 10.766 1.129* 2.843 12.819 21.577 20.323 21.187 69.322 22.989 13.602 34.963 29.636 55.064 23.8020.5 9 10.116 0.441* 5.774 15.777 23.741 25.898 22.196 91.727 28.022 14.335 40.738 35.420 68.564 26.2710.5 10 9.299 -0.491* 5.167 23.580 30.687 32.867 22.361 124.283 35.447 16.781 48.558 42.396 88.442 27.7671 2 4.901 1.862* 3.389 4.660 5.037 7.009 12.865 18.912 8.269 6.459 11.163 13.660 17.516 13.8681 3 4.938 2.955 4.661 5.111 6.015 9.163 15.359 23.174 10.503 7.105 14.702 16.106 21.954 16.3661 4 5.529 3.296 4.891 6.201 6.911 10.282 17.445 26.778 11.758 8.004 17.006 18.858 24.859 18.2061 5 6.595 3.043 5.721 6.887 7.891 11.702 18.975 30.112 13.340 8.953 19.077 21.487 27.840 19.6251 6 7.481 3.203 6.302 7.640 9.235 12.949 20.469 34.103 14.836 9.837 21.065 24.167 31.342 21.0251 7 8.568 3.588 6.906 8.859 10.716 14.372 21.971 38.513 16.627 10.855 23.233 26.831 36.375 22.6261 8 9.396 4.068 7.295 9.793 12.372 15.773 23.533 43.667 18.460 11.843 25.968 29.706 40.246 24.1991 9 10.153 4.738 8.136 11.438 14.620 17.632 24.875 49.643 20.693 12.665 29.280 33.055 45.797 25.6251 10 11.308 4.921 8.423 13.406 17.226 19.540 26.223 56.874 23.216 13.624 33.276 36.969 52.563 27.058
1.5 2 5.543 1.366* 4.090 5.373 5.372 7.923 14.261 18.117 9.328 6.559 11.593 14.770 17.989 14.5991.5 3 5.460 2.611 5.110 5.730 6.203 10.011 17.187 21.412 11.157 7.227 15.161 18.706 21.816 17.5341.5 4 5.623 3.005 5.206 6.551 6.696 10.912 18.343 24.014 12.090 8.040 17.293 18.783 23.831 19.4911.5 5 6.261 2.687 5.762 6.814 7.308 11.632 20.579 25.742 13.135 8.822 18.817 20.689 25.527 20.6991.5 6 6.741 2.975 6.134 7.088 8.080 12.176 21.792 27.489 14.028 9.500 20.055 22.430 27.235 21.8181.5 7 7.236 3.094 6.394 7.555 8.850 12.770 22.854 29.357 15.082 10.127 21.274 23.961 28.939 22.8741.5 8 7.690 3.159 6.418 7.789 9.484 13.316 23.863 31.304 16.163 10.850 22.639 25.522 30.769 23.8681.5 9 8.005 3.580 6.811 8.487 10.354 14.064 24.691 33.326 17.331 11.474 24.099 27.127 32.627 24.6761.5 10 8.501 3.728 7.018 9.293 11.326 14.797 25.453 35.515 18.449 12.163 25.711 28.785 34.591 25.4462 2 5.933 1.203* 4.680 5.807 5.807 8.602 14.891 17.188 9.672 6.692 11.947 15.813 18.256 14.5242 3 5.918 2.535 5.411 6.204 6.482 10.673 17.979 19.751 11.296 7.246 15.488 17.265 21.799 17.4932 4 5.725 3.119 5.262 6.909 6.582 11.423 20.101 21.901 12.083 8.075 17.705 18.766 23.399 19.4472 5 5.862 2.746 5.478 7.010 6.960 11.859 21.068 22.958 12.673 8.748 18.678 19.918 24.473 20.4882 6 6.082 3.054 5.679 7.058 7.363 12.143 22.072 23.832 13.246 9.231 19.602 20.857 25.387 21.4392 7 6.217 3.029 5.809 7.237 7.676 12.329 22.821 24.608 13.821 9.623 20.373 21.568 26.139 22.1612 8 6.405 2.814 5.572 7.210 7.876 12.444 23.439 25.378 14.447 10.160 21.114 22.271 26.883 22.7982 9 6.385 3.187 5.934 7.476 8.184 12.729 23.881 26.119 15.040 10.576 21.767 22.909 27.592 23.2182 10 6.587 3.203 6.099 7.902 8.512 12.977 24.285 26.874 15.562 11.017 22.383 23.498 28.206 23.618
AR-Filtered GARCH - Filteredσε
Notes: 1. The lag length p is selected based on the Minimum Akaike Information Criterion (MAICE). The
results are 1 (UK), 1 (WD), 2 (JP), 2 (HK), 3 (SG), 4 (US) and 5 (AUS) 2. Embedding dimension (m) limited to n/200 or 10, where n = 4304 3. Pairs can be no further apart than this distance, which is 0.5, 1.0, 1.5 or 2 times the standard
deviation of the series 4. *, - indicates that the BDS statistic is not significant at the 5 percent level, hence the null hypothesis
of iid cannot be rejected

------------------------------------------------------------------------------------------------------------------------------------------------------ Are international real estate markets integrated? Evidence from chaotic dynamics
31
Table 5 BDS statistics on the null of independent and identical
distribution (i i d) using holding period returns filtered with AR (p) and GARCH (1, 1) models for the daily hedged real estate series:
January 1991 – June 2006
m US UK AUS JP HK SG WD US UK AUS JP HK SG WD0.5 2 14.615 7.785 7.865 10.840 13.386 12.268 7.459 15.608 7.734 7.995 10.839 12.643 11.859 7.6270.5 3 18.605 10.250 8.824 15.677 15.236 14.679 9.419 19.467 10.128 8.454 15.808 14.386 14.528 9.6290.5 4 22.727 11.641 8.268 19.744 16.651 17.406 11.666 23.901 11.534 8.599 19.988 15.749 17.424 11.7860.5 5 27.594 12.625 9.870 24.746 18.814 19.923 14.476 29.174 12.606 10.022 24.964 17.824 19.933 14.3460.5 6 33.963 12.591 11.319 30.506 21.511 23.417 17.104 35.894 12.649 11.527 30.582 20.268 23.366 16.7650.5 7 41.523 12.050 13.322 37.817 25.127 27.732 19.252 43.609 12.136 13.419 37.727 23.225 27.797 18.8940.5 8 51.665 12.453 15.061 48.803 29.113 32.819 22.218 54.025 12.531 14.871 48.377 26.584 32.641 21.4860.5 9 66.519 12.913 17.288 64.238 34.678 39.213 24.438 69.078 13.480 16.306 63.673 31.616 39.155 23.6210.5 10 68.236 11.828 18.850 86.286 40.901 46.541 27.321 91.862 13.214 17.217 85.764 37.352 45.858 25.5741 2 15.494 8.480 7.729 11.272 13.740 13.494 8.079 17.136 8.379 7.777 11.115 13.582 13.209 8.2321 3 19.270 10.627 8.202 15.047 15.795 16.078 10.116 20.803 10.480 8.345 15.162 15.525 16.017 10.1951 4 22.285 11.806 8.246 17.553 17.260 18.748 11.966 23.860 11.654 8.433 17.746 16.950 18.819 12.0331 5 25.154 12.635 9.197 20.484 18.948 21.281 13.897 26.850 12.486 9.349 20.691 18.592 21.358 13.9511 6 28.371 13.154 10.086 23.315 20.622 24.183 15.829 30.283 13.002 10.252 23.493 20.257 24.253 15.8481 7 32.061 13.591 11.094 26.640 22.859 27.436 17.565 34.167 13.446 11.219 26.800 22.386 27.581 17.5961 8 36.300 14.343 12.099 30.692 25.246 31.049 19.252 38.673 14.244 12.178 30.900 24.709 31.306 19.3251 9 41.315 15.285 13.313 35.789 27.868 35.328 21.134 44.053 15.211 13.328 36.102 27.252 35.714 21.2061 10 47.687 16.212 14.417 42.240 31.072 40.297 23.434 50.915 16.172 14.362 42.666 30.331 40.846 23.478
1.5 2 15.890 8.888 7.621 11.598 14.451 14.139 8.669 17.231 8.788 7.796 11.385 14.732 13.961 8.7751.5 3 19.063 10.936 8.282 14.707 16.713 16.319 10.573 20.296 10.819 8.525 14.811 16.921 16.390 10.6431.5 4 21.217 12.074 8.383 16.348 17.837 18.531 12.001 22.364 11.958 8.619 16.632 18.001 18.677 12.0451.5 5 22.920 12.741 9.143 18.161 19.140 20.464 13.209 23.993 12.627 9.328 18.439 19.209 20.573 13.2591.5 6 24.513 13.232 9.812 19.571 20.300 22.399 14.462 25.579 13.106 10.030 19.809 20.331 22.478 14.5171.5 7 26.210 13.609 10.526 21.083 21.655 24.294 15.496 27.240 13.477 10.724 21.281 21.619 24.382 15.5611.5 8 27.904 14.164 11.171 22.801 23.068 26.311 16.423 28.934 14.039 11.361 22.971 22.969 26.421 16.4921.5 9 29.547 14.793 11.913 24.643 24.381 28.499 17.284 30.601 14.680 12.072 24.810 24.227 26.620 17.3431.5 10 31.380 15.423 12.589 26.669 25.920 30.942 18.304 32.445 15.319 12.762 26.826 25.683 31.073 18.3442 2 16.176 9.152 7.940 11.404 14.496 15.417 9.443 16.823 9.043 8.236 11.209 15.033 15.423 9.4792 3 18.785 11.066 8.695 14.394 16.648 16.926 11.245 19.124 10.979 9.013 14.450 17.122 17.224 11.2492 4 20.337 12.196 8.823 15.731 17.469 18.582 12.246 20.699 12.161 9.062 15.968 17.885 18.925 12.2332 5 21.265 12.622 9.442 17.053 18.409 19.748 12.989 21.524 12.608 9.616 17.319 18.722 20.038 12.9812 6 21.912 12.996 9.961 18.087 19.260 20.920 13.802 22.178 12.974 10.131 18.317 19.495 21.160 13.7952 7 22.611 13.270 10.444 19.008 20.078 21.912 14.382 22.825 13.241 10.591 19.188 20.232 22.146 14.3652 8 23.235 13.676 10.880 20.049 20.921 22.997 14.871 23.458 13.638 11.014 20.172 21.004 23.231 14.8532 9 23.783 14.034 11.311 20.980 21.603 24.149 15.283 24.000 13.987 11.412 21.099 21.670 24.367 15.2562 10 24.332 14.398 11.677 21.859 22.362 25.336 15.791 24.524 14.343 11.764 21.975 22.381 25.535 15.754
AR-Filtered GARCH - Filteredσε
Notes: 1. The lag length p is selected based on the Minimum Akaike Information Criterion (MAICE). The
results are 1 (AUS), 1 (HK), 1 (US), 2 (JP), 2 (SG), 2 (WD) and 3 (UK) 2. Embedding dimension (m) limited to n/200 or 10, where n = 4044 3. Pairs can be no further apart than this distance, which is 0.5, 1.0, 1.5 or 2 times the standard
deviation of the series
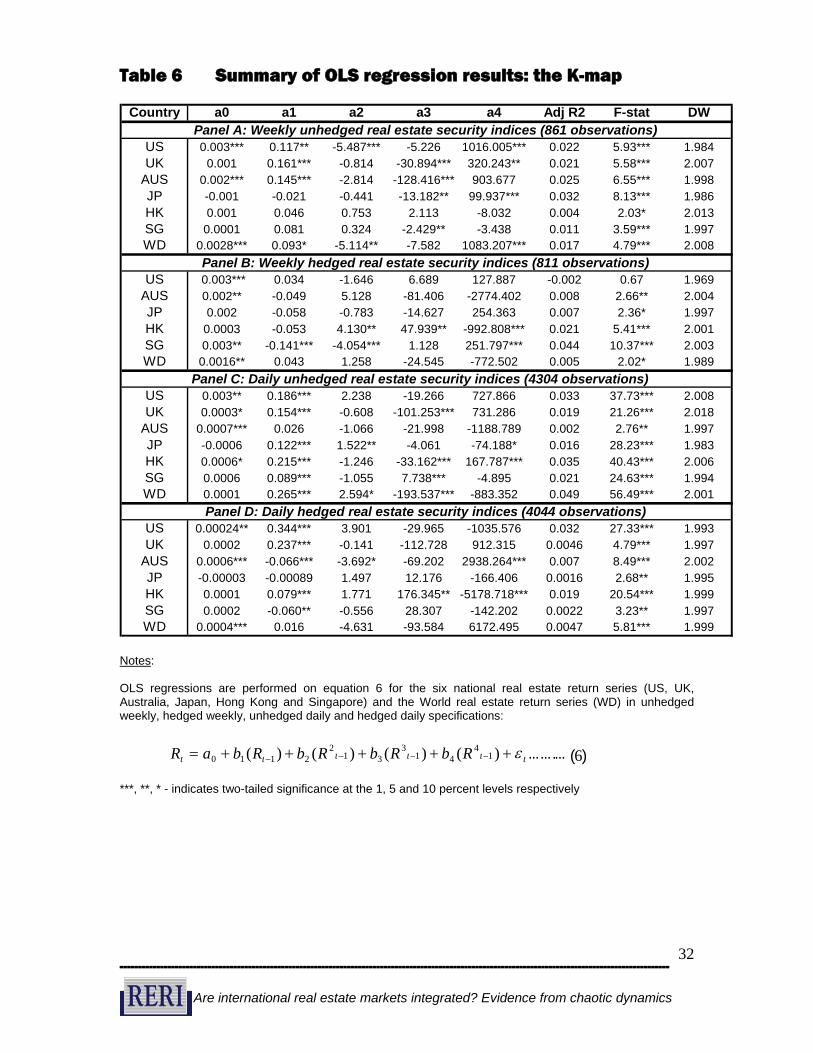
------------------------------------------------------------------------------------------------------------------------------------------------------ Are international real estate markets integrated? Evidence from chaotic dynamics
32
Table 6 Summary of OLS regression results: the K-map
Country a0 a1 a2 a3 a4 Adj R2 F-stat DW
US 0.003*** 0.117** -5.487*** -5.226 1016.005*** 0.022 5.93*** 1.984UK 0.001 0.161*** -0.814 -30.894*** 320.243** 0.021 5.58*** 2.007
AUS 0.002*** 0.145*** -2.814 -128.416*** 903.677 0.025 6.55*** 1.998JP -0.001 -0.021 -0.441 -13.182** 99.937*** 0.032 8.13*** 1.986HK 0.001 0.046 0.753 2.113 -8.032 0.004 2.03* 2.013SG 0.0001 0.081 0.324 -2.429** -3.438 0.011 3.59*** 1.997WD 0.0028*** 0.093* -5.114** -7.582 1083.207*** 0.017 4.79*** 2.008
US 0.003*** 0.034 -1.646 6.689 127.887 -0.002 0.67 1.969AUS 0.002** -0.049 5.128 -81.406 -2774.402 0.008 2.66** 2.004JP 0.002 -0.058 -0.783 -14.627 254.363 0.007 2.36* 1.997HK 0.0003 -0.053 4.130** 47.939** -992.808*** 0.021 5.41*** 2.001SG 0.003** -0.141*** -4.054*** 1.128 251.797*** 0.044 10.37*** 2.003WD 0.0016** 0.043 1.258 -24.545 -772.502 0.005 2.02* 1.989
US 0.003** 0.186*** 2.238 -19.266 727.866 0.033 37.73*** 2.008UK 0.0003* 0.154*** -0.608 -101.253*** 731.286 0.019 21.26*** 2.018
AUS 0.0007*** 0.026 -1.066 -21.998 -1188.789 0.002 2.76** 1.997JP -0.0006 0.122*** 1.522** -4.061 -74.188* 0.016 28.23*** 1.983HK 0.0006* 0.215*** -1.246 -33.162*** 167.787*** 0.035 40.43*** 2.006SG 0.0006 0.089*** -1.055 7.738*** -4.895 0.021 24.63*** 1.994WD 0.0001 0.265*** 2.594* -193.537*** -883.352 0.049 56.49*** 2.001
US 0.00024** 0.344*** 3.901 -29.965 -1035.576 0.032 27.33*** 1.993UK 0.0002 0.237*** -0.141 -112.728 912.315 0.0046 4.79*** 1.997
AUS 0.0006*** -0.066*** -3.692* -69.202 2938.264*** 0.007 8.49*** 2.002JP -0.00003 -0.00089 1.497 12.176 -166.406 0.0016 2.68** 1.995HK 0.0001 0.079*** 1.771 176.345** -5178.718*** 0.019 20.54*** 1.999SG 0.0002 -0.060** -0.556 28.307 -142.202 0.0022 3.23** 1.997WD 0.0004*** 0.016 -4.631 -93.584 6172.495 0.0047 5.81*** 1.999
Panel A: Weekly unhedged real estate security indices (861 observations)
Panel B: Weekly hedged real estate security indices (811 observations)
Panel C: Daily unhedged real estate security indices (4304 observations)
Panel D: Daily hedged real estate security indices (4044 observations)
Notes: OLS regressions are performed on equation 6 for the six national real estate return series (US, UK, Australia, Japan, Hong Kong and Singapore) and the World real estate return series (WD) in unhedged weekly, hedged weekly, unhedged daily and hedged daily specifications:
***, **, * - indicates two-tailed significance at the 1, 5 and 10 percent levels respectively
ttttt t RbRbRb Rb a R ε+++++= −−−− )()()()( 14
413
312
2 1 10 …….… (6 )

------------------------------------------------------------------------------------------------------------------------------------------------------ Are international real estate markets integrated? Evidence from chaotic dynamics
33
Table 7 Summary of OLS regression results for real estate return series: the K-map and Z-map
Country c0 c1 c2 c3 c4 c5(US) c6(UK) c7(AUS) c8(JP) c9(HK) c10(SG) Adj R2 DW
US 0.0035*** 0.0840** -5.9283*** na 931.459*** na 0.1245*** 0.1109*** -0.0041 0.0189 0.0597*** 0.136 1.991UK -0.000009 0.1064 na -23.381** 149.791** 0.2063*** na 0.2317*** 0.0732*** 0.0442** 0.0318 0.179 2.023
AUS 0.0016*** 0.0806* na -103.709*** na 0.1428*** 0.1641*** na 0.0309** 0.0856*** 0.0019 0.171 2.061JP -0.0024 -0.0402 na -11.078* 71.423*** -0.0391 0.3241*** 0.1881* na 0.0652 0.1525*** 0.127 1.975SG -0.0017 0.1166** na -1.0928*** na 0.2839*** 0.1094* -0.0389 0.1086*** 0.6182*** na 0.385 2.004
HK -0.0001 -0.0691 4.6447** 60.395*** -1135.37*** 0.0109 0.0243 0.0865*** 0.0291 na 0.0798** 0.044 2.016SG 0.0026** -0.1403*** -3.9293*** na 247.92*** 0.0324 0.0204 -0.0389 0.0704* 0.2132** na 0.063 2.021
UK 0.0001 0.1088*** na -67.954*** na 0.1452*** na 0.1329*** 0.0454*** 0.0320*** 0.0267*** 0.083 2.014JP -0.0007** 0.1032*** 1.3362** na -92.005*** 0.0117 0.2080*** 0.2315*** na 0.1392*** 0.1309*** 0.101 1.996HK 0.00006 0.1148*** na -19.653*** 52.652** 0.1326*** 0.0794*** 0.2183*** 0.0801*** na 0.3867*** 0.294 2.057SG -0.0002 0.0498** na 2.6418** na 0.1022** 0.0951*** 0.1289*** 0.0920*** 0.4887*** na 0.273 2.037
HK 0.0002* 0.0818*** na 159.396** -4378.10*** -0.0065 0.0053 0.0131 0.0132* na 0.0428*** 0.028 1.998AUS 0.0005*** -0.0833*** -3.3451* na 2689.62 0.0390** 0.0330** na 0.0002 0.0099 0.0009 0.011 2.006
Panel A: weekly (unhedged) real estate secuirty indices (861 observations)
Panel B: weekly (hedged) real estate security indices (809 observations)
Panel C: Daily (unhedged) real estate secuirty indices (4304 observations)
Panel D: Daily (hedged) real estate security indices (4044 observations)
Notes: The equation is:
***, **, * - indicates two-tailed significance at the 1, 5 and 10 percent levels respectively
.).()()()()()()()()(
9876
514
413
312
2 1 1 0
tt t t
tttt t t
HKRbSGR b AUR b UKR b USRbJPRbJPRbJPR b JPR b a JPR
++++
+++++= −−−−

------------------------------------------------------------------------------------------------------------------------------------------------------ Are international real estate markets integrated? Evidence from chaotic dynamics
34
Table 8 Non-linear TAR - GARCH (1, 1)-M estimates for real estate return series: 1990 - 2006
US UK AUS SG# JP WD HK SG UK JP HK WD SG# HK AUS#
a0 0.0029** 0.0618*** 0.0034 0.0019 -0.0030 0.0016 -0.0403*** 0.0044* 0.00038 -0.0010** 0.00067** -0.000099 0.000476 0.00011 0.0011***a1 0.1267*** 0.1456*** 0.3190*** 0.0256 0.0714 0.1523*** -0.1785*** -0.1256*** 0.0979*** 0.0710*** 0.1359*** 0.3120*** 0.0746*** 0.0596*** -0.0714***a2 -4.6856** na na na na -5.2539*** -5.5652** -4.0625*** na 1.2919** na -0.9691 na na -2.6324a3 na -25.257* -110.843** -1.1262 -7.7887* na 15.4467 na -64.8420*** na -28.9525***-139.445*** 1.1416 129.3291* naa4 na 35.117 na na 44.714** 766.202** -772.278*** 259.005 na -74.026 116.166*** na na -3408.061*** 2937.538b 722.035 0.0079*** -5.2309 -0.0762 0.5564 6.5018 194.575*** -0.0529 1.8476 0.1886 -0.9845 14.0419*** -1.3123 0.6984 -11.7561c na na na -0.0260*** -0.0138** -0.0065*** -0.0504*** -0.0073* na -0.0030** -0.0030** -0.0014*** -0.0046*** -0.00063* nad 0.4024*** 0.5390*** 0.3439*** 0.8565*** 1.2170*** 0.6972*** 0.0509*** -0.0316 0.3180*** 0.9632*** 0.5490*** 0.5102*** 0.4954*** 0.0068 0.0400***
e0 0.00002**0.000015** 0.00002** 0.00002** 0.00002 0.00001* -4.183*** 0.000002***0.000002**0.000006***0.00006***0.000002***0.000005***0.000001*** 0.00005***e1 0.1187* 0.0248* 0.0855** 0.0075 0.0268* 0.0648** 0.1428*** -0.0152 0.0497*** 0.0533*** 0.0593*** 0.0719*** 0.0716*** 0.0864*** 0.0431***e2 0.0206 0.0646*** -0.0393 0.0329* 0.0527** -0.0139 0.0441*** 0.0114*** 0.0079 0.0597*** 0.0526*** 0.0451** 0.0498*** 0.0177 -0.0226**e3 0.8090* 0.9612*** 0.8701*** 0.9632*** 0.9405*** 0.9096*** 0.5161*** 0.9981*** 0.9291*** 0.9066*** 0.8960*** 0.8346*** 0.8927*** 0.8776*** 0.9574***e4 na na na 0.00015** 0.000096 0.000003 0.3754*** 0.000046*** na 0.000011* 0.000012** 0.000001* 0.000023** 0.000002* na
Log-L 2390.40 2090.26 2206.15 1628.44 1514.69 2493.51 2221.82 1848.89 14227.3 11185.60 12077.70 16246.98 11784.69 14722.26 14568.69Adj R2 0.223 0.184 0.141 0.201 0.196 0.479 0.046 0.038 0.108 0.139 0.121 0.394 0.078 0.016 0.008
Mean equation
Variance equation
Weekly (hedged)Weekly returns (unhedged) Daily returns (unhedged) Daily(hedged)
Notes: The non-linear TAR-GARCH (1, 1) - M model comprises:
tttttttt dMSCIDummycbRaRaRaRaaR εσ ++++++++= −−−− )(2443322110 ;
)(412
132
122
1102 DummyeIeeee ttttt ++++= −−−− σσεσ ;
a2 – a4 are the coefficients for the K-map terms; d is the coefficient for the Z-map (MSCI) term # None of the K-map coefficients is statistically significant ***, **, * - indicates two-tailed significance at the 1, 5 and 10 percent levels respectively
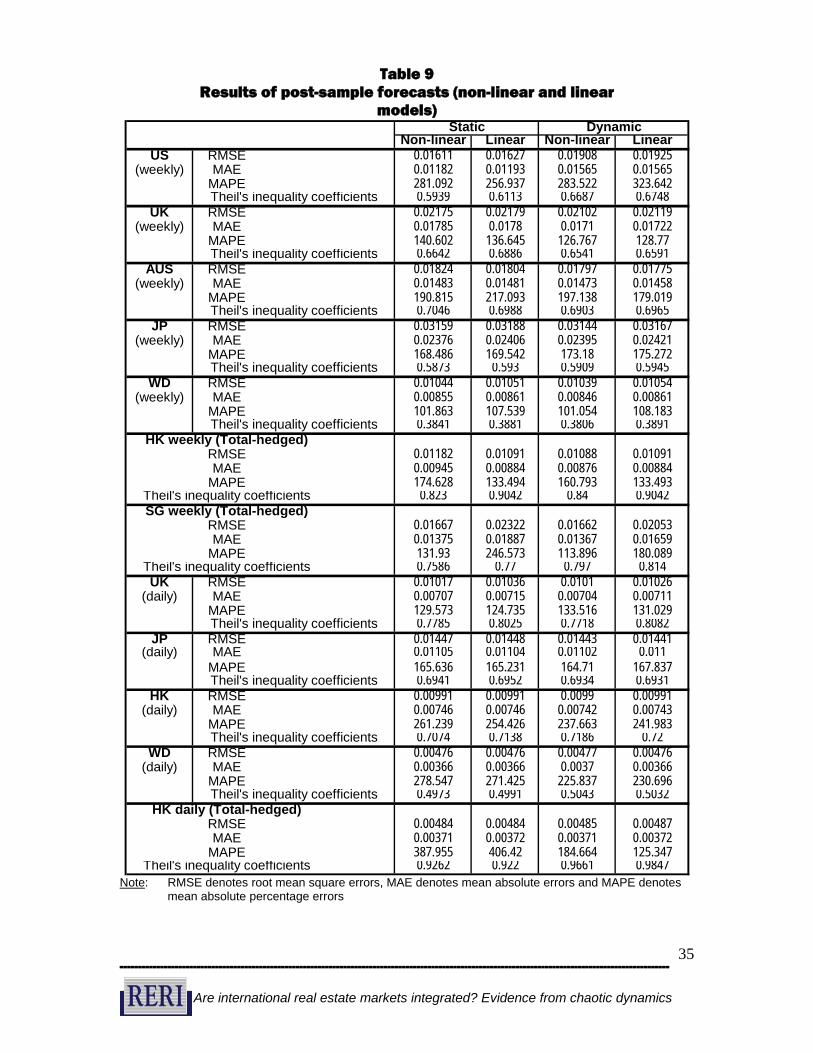
------------------------------------------------------------------------------------------------------------------------------------------------------ Are international real estate markets integrated? Evidence from chaotic dynamics
35
Table 9 Results of post-sample forecasts (non-linear and linear
models)
Non-linear Linear Non-linear LinearUS RMSE 0.01611 0.01627 0.01908 0.01925
(weekly) MAE 0.01182 0.01193 0.01565 0.01565MAPE 281.092 256.937 283.522 323.642
0.5939 0.6113 0.6687 0.6748UK RMSE 0.02175 0.02179 0.02102 0.02119
(weekly) MAE 0.01785 0.0178 0.0171 0.01722MAPE 140.602 136.645 126.767 128.77
0.6642 0.6886 0.6541 0.6591AUS RMSE 0.01824 0.01804 0.01797 0.01775
(weekly) MAE 0.01483 0.01481 0.01473 0.01458MAPE 190.815 217.093 197.138 179.019
0.7046 0.6988 0.6903 0.6965JP RMSE 0.03159 0.03188 0.03144 0.03167
(weekly) MAE 0.02376 0.02406 0.02395 0.02421MAPE 168.486 169.542 173.18 175.272
0.5873 0.593 0.5909 0.5945WD RMSE 0.01044 0.01051 0.01039 0.01054
(weekly) MAE 0.00855 0.00861 0.00846 0.00861MAPE 101.863 107.539 101.054 108.183
0.3841 0.3881 0.3806 0.3891
RMSE 0.01182 0.01091 0.01088 0.01091MAE 0.00945 0.00884 0.00876 0.00884
MAPE 174.628 133.494 160.793 133.493Theil's inequality coefficients 0.823 0.9042 0.84 0.9042
RMSE 0.01667 0.02322 0.01662 0.02053MAE 0.01375 0.01887 0.01367 0.01659
MAPE 131.93 246.573 113.896 180.089Theil's inequality coefficients 0.7586 0.77 0.797 0.814UK RMSE 0.01017 0.01036 0.0101 0.01026
(daily) MAE 0.00707 0.00715 0.00704 0.00711MAPE 129.573 124.735 133.516 131.029
0.7785 0.8025 0.7718 0.8082JP RMSE 0.01447 0.01448 0.01443 0.01441
(daily) MAE 0.01105 0.01104 0.01102 0.011MAPE 165.636 165.231 164.71 167.837
0.6941 0.6952 0.6934 0.6931HK RMSE 0.00991 0.00991 0.0099 0.00991
(daily) MAE 0.00746 0.00746 0.00742 0.00743MAPE 261.239 254.426 237.663 241.983
0.7074 0.7138 0.7186 0.72WD RMSE 0.00476 0.00476 0.00477 0.00476
(daily) MAE 0.00366 0.00366 0.0037 0.00366MAPE 278.547 271.425 225.837 230.696
0.4973 0.4991 0.5043 0.5032
RMSE 0.00484 0.00484 0.00485 0.00487MAE 0.00371 0.00372 0.00371 0.00372
MAPE 387.955 406.42 184.664 125.347Theil's inequality coefficients 0.9262 0.922 0.9661 0.9847
Static Dynamic
Theil's inequality coefficients
Theil's inequality coefficients
HK weekly (Total-hedged)
SG weekly (Total-hedged)
Theil's inequality coefficients
Theil's inequality coefficients
Theil's inequality coefficients
Theil's inequality coefficients
HK daily (Total-hedged)
Theil's inequality coefficients
Theil's inequality coefficients
Theil's inequality coefficients
Note: RMSE denotes root mean square errors, MAE denotes mean absolute errors and MAPE denotes mean absolute percentage errors

------------------------------------------------------------------------------------------------------------------------------------------------------ Are international real estate markets integrated? Evidence from chaotic dynamics
36
Figure 1 Weekly real estate indices and MSCI (USD$)
0
500
1000
1500
2000
2500
3000
3500
12/29/1989 12/27/1991 12/24/1993 12/22/1995 12/19/1997 12/17/1999 12/14/2001 12/12/2003 12/9/2005
Period
Inde
x le
vel (
USD
$)
0
500
1000
1500
2000
2500
3000
3500
4000
Hong Kong Australia World real estate MSCI Japan Singapore UK US
Figure 2: Weeky hedge ratio (1991-2006)
0
0.2
0.4
0.6
0.8
1
1.2
1.4
1/4/19
91
1/3/19
92
1/1/19
93
12/31/
1993
12/30/
1994
12/29/
1995
12/27/
1996
12/26/
1997
12/25/
1998
12/24/
1999
12/22/
2000
12/21/
2001
12/20/
2002
12/19/
2003
12/17/
2004
12/16/
2005
week
ratio
0
0.2
0.4
0.6
0.8
1
1.2
1.4
1.6
1.8
UK USA Singapore World real estate Australia Hong Kong Japan

------------------------------------------------------------------------------------------------------------------------------------------------------ Are international real estate markets integrated? Evidence from chaotic dynamics
37
Figure 3: Daily hedge ratio (1991-2006)
0
0.2
0.4
0.6
0.8
1
1.2
1.4
1/1/19
91
12/31/
1991
12/29/
1992
12/28/
1993
12/27/
1994
12/26/
1995
12/24/
1996
12/23/
1997
12/22/
1998
12/21/
1999
12/19/
2000
12/18/
2001
12/17/
2002
12/16/
2003
12/14/
2004
12/13/
2005
Day
ratio
0
0.1
0.2
0.3
0.4
0.5
0.6
0.7
0.8
0.9
1
Hong Kong Australia US World real estate Japan Singapore UK

------------------------------------------------------------------------------------------------------------------------------------------------------ Are international real estate markets integrated? Evidence from chaotic dynamics
38
US – (R2 t-1) – weekly unhedged
1995 2000 2005
-4
-3
-2
-1
0
1t: US2_1
US – (R4 t-1) – weekly unhedged
1995 2000 2005
-1
0
1
2
3
4
t: US4_1
UK – (R3 t-1) – weekly unhedged
1995 2000 2005
-2.0
-1.5
-1.0
-0.5
0.0
0.5
1.0t: UK3_1
AUS – (R3t-1) – weekly unhedged
1995 2000 2005-4.0
-3.5
-3.0
-2.5
-2.0
-1.5
-1.0
-0.5t: AUS3_1
JP – (R4 t-1) – weekly unhedged
1995 2000 2005
0.0
0.5
1.0
1.5
2.0
2.5
3.0
3.5
4.0
4.5t: JP4_1
JP - (R3 t-1) – weekly unhedged
1995 2000 2005
-2.5
-2.0
-1.5
-1.0
-0.5
0.0
0.5t: JP3_1
Figure 4 Recursive t-statistics for the K-map variables in the logistic map

------------------------------------------------------------------------------------------------------------------------------------------------------ Are international real estate markets integrated? Evidence from chaotic dynamics
39
HK – (R3 t-1) – weekly hedged
1995 2000 2005
-1
0
1
2
3 t: HKHG3_1
HK – (R4 t-1) – weekly hedged
1995 2000 2005
-4
-3
-2
-1
0
1 t: HKHG4_1
SG – (R2 t-1) – weekly hedged
1995 2000 2005
-3.5
-3.0
-2.5
-2.0
-1.5
-1.0
-0.5
0.0 t: SGHG2_1
UK – (R4 t-1) – weekly unhedged
1995 2000 20051.25
1.50
1.75
2.00
2.25
2.50
2.75
t: UK4_1
SG - (R3 t-1) – weekly unhedged
1995 2000 2005
-4.0
-3.5
-3.0
-2.5
-2.0
-1.5
-1.0
t: SG3_1
HK – (R2 t-1) – weekly hedged
1995 2000 2005
-0.5
0.0
0.5
1.0
1.5
2.0
2.5
3.0
3.5t: HKHG2_1

------------------------------------------------------------------------------------------------------------------------------------------------------ Are international real estate markets integrated? Evidence from chaotic dynamics
40
SG – (R4 t-1) – weekly hedged
1995 2000 2005
0
1
2
3
4
t: SGHG4_1
JP – (R2 t-1) – daily unhedged
1995 2000 2005
0.5
1.0
1.5
2.0
2.5
3.0
3.5
4.0
4.5 t: JP2_1
JP – (R4 t-1) – daily unhedged
1995 2000 2005
-5
-4
-3
-2
-1
0
t: JP4_1
HK – (R3 t-1) – daily unhedged
1995 2000 2005
-8
-7
-6
-5
-4
-3
-2t: HK3_1
HK – (R4 t-1) – daily unhedged
1995 2000 2005
-1
0
1
2
3
4t: HK4_1
SG – (R3 t-1) – daily unhedged
1995 2000 2005
-1
0
1
2
3
4
5t: SG3_1
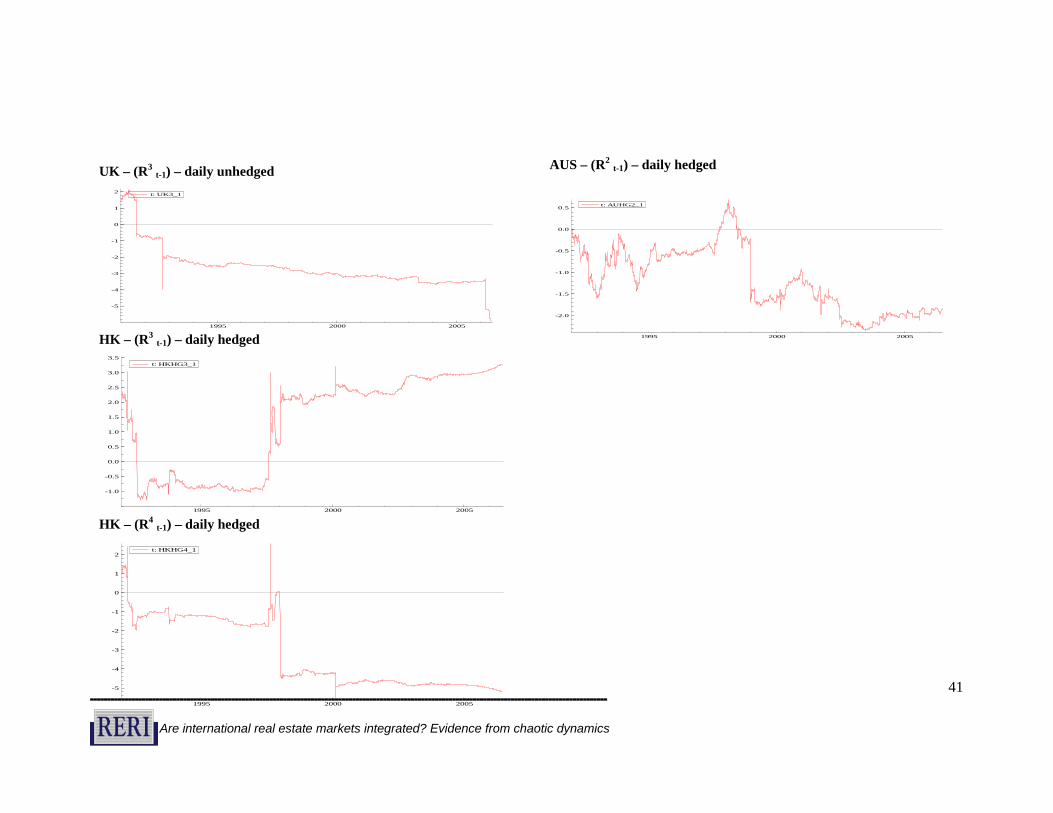
------------------------------------------------------------------------------------------------------------------------------------------------------ Are international real estate markets integrated? Evidence from chaotic dynamics
41
UK – (R3 t-1) – daily unhedged
1995 2000 2005
-5
-4
-3
-2
-1
0
1
2 t: UK3_1
HK – (R3 t-1) – daily hedged
1995 2000 2005
-1.0
-0.5
0.0
0.5
1.0
1.5
2.0
2.5
3.0
3.5t: HKHG3_1
HK – (R4 t-1) – daily hedged
1995 2000 2005
-5
-4
-3
-2
-1
0
1
2t: HKHG4_1
AUS – (R2 t-1) – daily hedged
1995 2000 2005
-2.0
-1.5
-1.0
-0.5
0.0
0.5 t: AUHG2_1