Are International Banks...
44
Policy Research Working Paper 8286 Are International Banks Different? Evidence on Bank Performance and Strategy Ata Can Bertay Asli Demirgüç-Kunt Harry Huizinga Development Research Group Finance and Private Sector Development Team December 2017 WPS8286 Public Disclosure Authorized Public Disclosure Authorized Public Disclosure Authorized Public Disclosure Authorized
Transcript of Are International Banks...

Policy Research Working Paper 8286
Are International Banks Different?
Evidence on Bank Performance and Strategy
Ata Can BertayAsli Demirgüç-Kunt
Harry Huizinga
Development Research GroupFinance and Private Sector Development TeamDecember 2017
WPS8286P
ublic
Dis
clos
ure
Aut
horiz
edP
ublic
Dis
clos
ure
Aut
horiz
edP
ublic
Dis
clos
ure
Aut
horiz
edP
ublic
Dis
clos
ure
Aut
horiz
ed

Produced by the Research Support Team
Abstract
The Policy Research Working Paper Series disseminates the findings of work in progress to encourage the exchange of ideas about development issues. An objective of the series is to get the findings out quickly, even if the presentations are less than fully polished. The papers carry the names of the authors and should be cited accordingly. The findings, interpretations, and conclusions expressed in this paper are entirely those of the authors. They do not necessarily represent the views of the International Bank for Reconstruction and Development/World Bank and its affiliated organizations, or those of the Executive Directors of the World Bank or the governments they represent.
Policy Research Working Paper 8286
This paper is a product of the Finance and Private Sector Development Team, Development Research Group. It is part of a larger effort by the World Bank to provide open access to its research and make a contribution to development policy discussions around the world. Policy Research Working Papers are also posted on the Web at http://econ.worldbank.org. The authors may be contacted at [email protected].
This paper provides evidence on how bank performance and strategies vary with the degree of bank international-ization, using data for 113 countries over 2000–15. The paper investigates whether international banks head-quartered in developing countries behave and perform differently from those headquartered in high-income countries. The results show that, compared with domes-tic banks, international banks have lower valuations and achieve lower returns on equity in general. This suggests that, on average, bank internationalization has progressed beyond the point where it is in the interest of bank share-holders, potentially because of corporate governance failures
and too-big-to-fail subsidies that accrue to large and com-plex banks. In contrast, developing country international banks seem to have benefited from internationalization compared with their high-income counterparts. Further-more, for international banks headquartered in developing countries, bank internationalization reduces the cyclicality of their domestic credit growth with respect to domestic gross domestic product growth, smoothing local down-turns. In contrast, if the international bank is from a high-income country investing in a developing country, its lending is relatively procyclical, which can be destabilizing.

Are International Banks Different? Evidence on Bank Performance and Strategy1
Ata Can Bertay World Bank
Asli Demirgüç-Kunt World Bank
Harry Huizinga Tilburg University and CEPR
Keywords: Bank internationalization, south-south banking, risk-taking, procyclicality JEL Classification: F36, G21, G28
1 Bertay: World Bank ([email protected]); Demirgüç-Kunt: World Bank ([email protected]); Huizinga: Tilburg University and CEPR ([email protected]). We thank Leila Aghabarari and Nan Zhou for excellent research assistance. This paper’s findings, interpretations, and conclusions are entirely those of the authors and do not necessarily represent the views of the World Bank, its Executive Directors, or the countries they represent.
2
1. Introduction
Historically, banks have increased their geographical reach following their customers
abroad in search of new profit opportunities. The decade before the 2007–09 global financial
crisis was characterized by a significant increase in financial globalization, particularly for
banking institutions, that coincided with increases in bank size to unprecedented levels. These
changes were manifested in both a rise in cross-border lending and further internationalization of
the banks themselves.
This globalization trend has been partially reversed by a recent retrenchment of
international banks that are headquartered in high-income countries. Going against this trend,
however, many developing country banks have expanded internationally, in part to fill the gaps
left by high-income country international banks (World Bank, 2018).2
In this paper, we examine the implications of bank internationalization for the banks
themselves, and for their credit provision. We use bank-level information from Bankscope, for
113 countries over the 2000-2015 period. Specifically, we consider how bank
internationalization is related to a set of bank-level variables that are indicative of bank
valuation, risk, and return, and also to a range of variables that reflect the business model and
funding strategies of banks. In addition, we consider how bank internationalization affects the
cyclicality of an international bank’s credit provision in its home country as well as in any
foreign country where it has a subsidiary. Importantly, given the recent expansion of
international banks from developing countries, we also examine whether these banks behave and
2 Alade (2014) reports that by the end of 2008 more than half of domestically owned Nigerian banks owned at least one foreign subsidiary – mostly in Africa – compared to two in 2002.

3
perform differently compared to those international banks headquartered in high-income
countries.
We measure bank internationalization in two alternative ways: by the share of a bank’s
overall liabilities contracted by its foreign subsidiaries, or by the number of foreign host
countries where the bank operates at least one subsidiary. Our sample of banks contains 2,793
banks in total, of which 325 banks are international with at least one foreign subsidiary. As seen
in Figure 1, the average asset growth rate of international banks was relatively high compared to
domestic banks in the years 2005-2008 leading up to the global financial crisis, while it has been
comparable to that of domestic banks since the crisis. The figures for 2015 capture the
significant retrenchment of international banks relative to domestic banks.
We find that bank internationalization generally has been associated with lower bank
valuation as measured by Tobin’s Q and the market-to-book value of equity for the 2000-2013
period, in part reflecting a lower return on equity. Nevertheless, the performance of international
banks in terms of bank valuation and non-performing loans improved after the financial crisis,
potentially reflecting regulatory measures to increase capitalization and asset composition, as
well as market’s valuation of their revealed too-big-to-fail subsidies.
Our results suggest developing country international banks benefited relatively more
from internationalization in terms of a higher valuation, lower risk, and a higher return on equity.
This likely reflects the different business strategies followed by these banks and their focus on
comparative expertise in terms of the countries in which they choose to operate.
Overall, we find that international banks are relatively undercapitalized, potentially
shifting the risk to taxpayers through their greater reliance on the safety net, due to their size and
difficulty of winding down. In general, international banks also fund themselves to a lesser

4
extent with customer deposits, indicating they often invest less in retail business models in their
international business. Furthermore, they accumulate relatively few off-balance sheet exposures
and receive relatively little non-interest income. The net effect of these differences between
international and domestic banks on financial fragility is unclear, as lower capitalization and
deposit funding could increase bank riskiness, while lower off-balance sheet exposures and a
lower share of non-interest income could reduce risk.
Going beyond the implications of bank internationalization for the banks themselves, we
also examine how this affects the cyclicality of credit growth with respect to GDP growth. We
see that bank internationalization reduces the cyclicality of domestic credit growth with respect
to domestic GDP growth, potentially because international banks repatriate some funding to their
home country during economic downturns to be able to continue lending domestically. This
stabilizing effect is particularly strong for international banks headquartered in developing
countries. A different pattern emerges when we investigate the cyclicality of the international
bank lending in the foreign subsidiary countries. We find that developing country lending of
international banks headquartered in high-income countries is relatively procyclical, although
this effect is not significant if the international bank is also headquartered in a developing
country. This enhanced procyclicality of credit growth in developing countries suggests that
high-income international bank operations can be potentially destabilizing, while this is not true
for South-South bank lending, i.e., developing country international banks doing business in
other developing countries.
In this paper, we investigate the performance and impact of international banks using
consolidated bank data. Using consolidated data in analyzing the performance of international
banks is important because a bank’s consolidated income statement is impervious to potential
5
misrepresentation at the subsidiary level on account of international profit shifting motivated by
international tax rate differences, which is common in the banking sector (see for example
Huizinga et al., 2014, and Merz and Overesch, 2016). Furthermore, international banks tend to
be evaluated by capital markets at the consolidated level, and they primarily fail at the
consolidated level (Anginer et al., 2017).
Nevertheless, a voluminous literature investigates international banks by focusing on the
performance of foreign-owned banks that typically are subsidiaries of multinational banks.
Claessens and Van Horen (2012) provide an overview of 35 studies in this area in their Table 1,
demonstrating how the results of various empirical studies differ -mostly depending on the
sample of banks and the data that are used. In their own analysis, they find that the performance
of foreign banks in the pre-crisis period compared to domestic banks depends on a range of
factors including the particular home country, host-country regulations, and language similarity.
A separate approach is to investigate the impact of foreign bank presence, i.e., the share of
foreign banking in total banking, on local banking markets.3 An early contribution in this area is
Claessens, Demirgüç-Kunt, and Huizinga (2001) who consider the impact of foreign bank
presence on several key performance indicators of the local banking market such as the return on
assets and overhead relative to assets. A recent contribution along these lines is Claessens and
Van Horen (2014) who examine the impact of foreign bank presence on private credit growth
and again document the relevance of host country and banks’ characteristics.
However, there is a relatively small literature investigating the performance and impact
of international banks using data at the consolidated level. Garcia-Herrero and Vazquez (2013)
document higher risk-adjusted returns for international banks located in eight high-income
3 See Cull and Martinez Peria (2010) for a survey of the literature on the drivers and consequences of foreign bank participation in developing countries.
6
countries mainly on account of their subsidiaries in developing countries. More recently,
analyzing pre-crisis data for 56 countries, Gulamhussen et al. (2017) find that international
diversification creates excess shareholder value, especially for banks expanding towards less
developed countries. Using U.S. data, Berger et al. (2016) find that international banks tend to be
riskier – confirming earlier findings by Gulamhussen et al. (2014) for an international sample of
banks in the period preceding the global financial crisis. Buch et al. (2013) show that higher
internationalization at the extensive margin (asset holdings in more countries) is associated with
lower domestic market power, whereas higher internationalization at the intensive margin (a
higher foreign assets share) is positively associated with market power. Buch et al. (2011, 2014)
analyze the drivers of German banks’ internationalization, showing the importance of bank
characteristics such as productivity and risk aversion. Using the same German data, Galema et al.
(2013) conclude that cost advantages are driving bank internationalization through foreign
branches, but not in the case of foreign subsidiaries. Using data for 84 countries, Bertay,
Demirgüç-Kunt, and Huizinga (2016) find that bank internationalization is positively associated
with a bank’s average funding cost, possibly reflecting creditors’ fears of not being repaid in case
of a bank failure.
De Haas and Van Lelyveld (2014) compare the credit growth responses of domestic
banks and multinational unconsolidated parent banks (but not the multinational consolidated
parent banks) to the global financial crisis, taking into account the share of a multinational
bank’s assets located at foreign subsidiaries.4 They show that during the global financial crisis
subsidiaries in foreign host countries could rely less on parent banks compared to earlier crises,
4 Their data set contains 48 large multinational banking groups almost entirely from high-income countries (there are only two developing country banks from Brazil).

7
and that parent banks reduced their lending less in the home country compared to their domestic
counterparts -thanks to their liquid foreign subsidiaries.
Our paper adds to this literature on the operation of international banks at the
consolidated level. Importantly, by compiling a large data set covering both high-income and
developing countries, we are able to document the implications of bank internationalization for
bank performance, bank strategy, and credit cycles separately for banks headquartered in
developing countries as compared to high-income countries. The potential differences between
international banks from developing and high-income countries came to the fore in policy
discussions with the rise of international banks from developing countries after the global
financial crisis (World Bank, 2018). The pros and cons of this development are starting to be
debated in academic and policy circles alike. Our analysis hopes to start shedding light on these
critical questions.
Section 2 presents the data and discusses the empirical methodology used in this study.
Section 3 presents the empirical results. Consecutive subsections address how bank
internationalization is related to measures of bank valuation, risk, and return, indices of bank
business models and funding strategies, and the cyclicality of credit growth. Section 4 concludes.
2. Data and methodology
2.1 Data
In this paper, we examine how a bank’s degree of internationalization is related to a range
of bank performance and strategy variables. Using Bankscope, we construct a sample of
domestic as well as international banks headquartered in 113 countries during the 2000-2015
period. This data source provides us with income and balance sheet information on these banks,

8
and also with information on their ownership relationships. In the case of international banks,
this information enables us to ascertain the number, sizes and country locations of the bank’s
foreign subsidiaries.
Using the ownership data, we construct two alternative indices of bank
internationalization. First, we consider the extent to which a bank’s overall funding is obtained
through its foreign subsidiaries. Specifically, following Bertay, Demirgüç-Kunt, Huizinga (2016)
we construct Foreign liabilities as the ratio of the sum of all foreign subsidiaries’ liabilities
(weighted by the parent bank’s ownership share) to the consolidated liabilities of the parent
bank.5 From Table 1, we see that the average Foreign liabilities ratio is 2.6% for the overall
sample, while it is 14.5% for the sample of international banks that have at least one foreign
subsidiary. As can be seen in Figure 2, the Foreign liabilities ratio for the average international
bank has been fluctuating, falling from pre-crisis peak of 16.2% in 2006 to below 14% in 2010,
only to increase to 16.4% in 2012, before subsequently falling back to 13.4% with retrenchment
in 2015.
As an alternative internationalization measure, we consider the number of an international
bank’s foreign host countries (in the empirical work we use the variable Countries, which is the
log of this number). The average bank operates in 0.9 foreign host countries, while the average
international bank is present in 4.6 foreign countries. Figure 3 shows that the average number of
foreign host countries doubled from 5.1 in 2009 to 11.1 in 2015.
We relate the two measures of bank internationalization to a range of bank performance
variables that represent a bank’s valuation, risk and return. To start, Tobin’s Q is a proxy for the
market value of the bank’s assets relative to their book value. It is constructed as the sum of the
5 The correlation between Foreign liabilities and Foreign assets is very high at 0.99.

9
market value of common equity plus the book value of preferred equity and liabilities, divided by
the book value of total assets. Tobin’s Q has a mean value of 1.03. Figure 4 shows the time
trends of Tobin’s Q separately for domestic and international banks. We see that the average
Tobin’s Q of domestic banks is relatively high compared to international banks during 2001-
2006, while it is lower for domestic banks than international banks from 2007 onwards. This
suggests that the financial crisis has led to a revaluation of international banks compared to
domestic banks, potentially because international banks received relatively generous bail-outs
during the crisis.
As an alternative valuation variable, the market-to-book ratio is computed as the market
value of common equity divided by its book value, with a mean value of 1.30. Figure 5 shows
qualitatively similar patterns of the market-to-book ratios of domestic and international banks as
for Tobin’s Q in Figure 4.
We also consider two indices of bank risk. First, the Z-score is constructed as the log of
the sum of the mean return on assets and the mean ratio of equity to assets divided by the
standard deviation of the return on assets to measure bank solvency. The Z-score indicates the
number of standard deviations that a bank’s return on assets can decline before the bank reaches
insolvency. A higher Z-score indicates a lower probability of bank failure. In Figure 6, we see
that the average Z-score of international banks has been lower compared to domestic banks
throughout the 2000-2015 period, indicating a higher probability of insolvency for international
banks. As a second proxy for bank risk, we construct the NPL variable as the log of the ratio of
nonperforming loans to gross loans + 1. Figure 7 displays the raw NPL ratio, showing that
international banks have tended to have higher NPL ratios than domestic banks, which suggests
that they make riskier loans on average.

10
To measure bank profitability, we use ROA, the return on assets computed as pre-tax
profits divided by total assets, with a mean of 1.0%. In Figure 8, we see that international banks
have achieved a lower average ROA than domestic banks recently in 2014 and 2015.
Alternatively, ROE is the return on equity, which is constructed as the ratio of pre-tax profits to
equity. Figure 9 shows that the return on equity has tended to be higher for international banks
than for domestic banks, but it was lower during 2015.
Differences in bank performance between domestic and international banks can reflect
variation in business models and strategic behavior. In the empirical work, we consider 6
variables that are indices of a bank’s funding and income strategies. First, on the funding side
Equity is constructed as the ratio of equity to total assets with a mean of 10.0%. As a second
funding variable, Deposit and short-term funding is the share of customer deposit and other
short-term funding in total liabilities, proxying for the extent to which a bank attracts short-term
funding from its customers as well as the market. The Deposit and short-term funding variable
has a mean of 83.2%. Third, to reflect the bank’s asset allocation, Off-balance sheet items is the
value of the assets that the bank does not control, but where it may have some exposure to losses,
relative to total assets. Off-balance sheet items reflect a risky bank allocation strategy if they are
not fully reflected in a bank’s risk-weighted assets as used for capital regulatory purposes. The
Off-balance sheet items variable has a mean of 15.0%. Fourth, to reflect the bank’s income
strategy, Net interest margin is constructed as net interest income divided by total assets with a
mean value of 3.2%. A relatively low interest margin, among other things, can reflect that a bank
focuses on providing credits to relatively large customers that tend to negotiate lower interest
rates. Fifth, Non-interest income is the share of a bank’s non-interest income, comprising fee
income and trading income, in total operating income. Demirgüç-Kunt and Huizinga (2010) find
11
that banks that focus more on generating non-interest income tend to be riskier. The average non-
interest income share is 33.1%. As a final behavioral variable, Overhead is computed as non-
interest expenses divided by total assets, with a mean value of 3.0%. The overhead variable
reflects the composition of a bank’s activities as well as its efficiency.
Credit provision is a key aspect of a bank’s overall activities that is potentially affected
by its degree of internationalization. To examine this, we construct the Loan growth,
consolidated variable as the rate of credit growth of the consolidated parent bank, reflecting loan
growth at the parent firm itself as well as at all its domestic and foreign subsidiaries. Loan
growth-consolidated has a mean of 9%. In contrast, Loan growth, unconsolidated is the rate of
credit growth at the unconsolidated parent bank. This variable should mostly reflect domestic
credit growth (although it could reflect growth in cross-border loans). Loan growth,
unconsolidated has a mean of 8.6%. Loan growth subsidiary, consolidated in turn is the rate of
loan growth at a subsidiary (domestic or foreign) based on the subsidiary’s consolidated balance
sheet with a mean value of 6.9%. Finally, Loan growth subsidiary, unconsolidated, is the rate of
loan growth at a subsidiary as reflected in the subsidiary’s unconsolidated balance sheet with a
mean value of 6.7%.
The analysis includes several additional variables as controls variables. Assets, denoting
the log of total assets, is a bank-level control variable. Furthermore, Loans is a bank’s gross
loans divided by total assets with a mean of 58.8%. Finally, there are three macroeconomic
control variables: the rate of consumer price inflation, the rate of real GDP growth, and per
capita GDP.
2.2 Methodology
12
Empirically, we relate bank performance, strategy and credit growth variables to the two
alternative indices of bank internationalization. The basic estimating relationship between a bank
performance or strategy variable and an index of bank internationalization is as follows:
Yijt = αi + γt + β1Interijt + β2 Bankijt + β3Macrojt + εijt (1)
where the subscripts i, j, and t denote the bank, the country, and the year. Yijt is a bank
performance or strategy variable. Interijt is a bank internationalization variable (either Foreign
liabilities or Countries). Bankijt denotes lagged bank-level control variables, and Macrojt
represents macroeconomic control variables. Finally, αi and γt are bank and year fixed effects.
Ex-ante, internationalized banks may display different performance and adopt different
strategies as they face different business opportunities and operate in different institutional
environments. Internationalization, for instance, may provide banks with additional asset and
income diversification opportunities that improve their risk-and-return tradeoff. If so, bank
internationalization is expected to be positively associated with bank valuation (Tobin’s Q and
Market-to-book), negatively associated with bank risk (i.e., positively related to Z-score and
negatively related to NPL), and positively associated with bank return (ROA and ROE). Also,
internationalized banks may have the advantage that they are too complex to wind down, which
could provide them with a funding advantage (Bertay, Demirgüç-Kunt, and Huizinga, 2016) and
could enable them to operate with relatively little equity. Conversely, international banks may
face information barriers in foreign banking markets, and they may be confronted by a lack of
trust in these markets, which could restrict their ability to raise deposits locally or to engage in

13
information-intensive activities such as accumulating off-balance sheet exposures or engaging in
non-interest income generating activities.
The relationships between bank performance and strategy variables, on the one hand, and
bank internationalization, on the other, could vary with the level of economic development of the
bank’s parent country, and they could vary over time. To investigate this, we estimate the
following specification:
Yijt = αi + γt + β1Interijt + β2Interijt x Developingj + β3Interijt x After 2006t +
β4Interijt x Developingj x After 2006t + β5Developingj x After 2006t +
β6 Bankijt + β7Macrojt + εijt (2)
where Developingj is a dummy variable signaling that a bank is located in a low-income or
middle-income country, and After 2006t is a dummy variable for the years after 2006
(comprising the financial crisis and its aftermath).
The internationalization strategies of banks located in developing countries may differ in
that they expand more into countries with similar levels of development that are in relatively
close proximity. If so, internationalization may improve the performance of developing country
banks relatively more compared to banks located in high-income countries. Furthermore,
international banks may perform relatively well following the financial crisis, as their
capitalization and asset composition may have improved responding to regulatory changes and
their market capitalization may reflect their too-big-to-fail subsidies as revealed by their ability
to draw on the financial safety net during the crisis.

14
Finally, we examine whether the cyclicality of a bank’s loan growth is affected by its
degree of internationalization. To this end, we estimate the following relationship:
Loan growthijt = αi + γt + β1Interijt + β2Interijt x GDP growthjt +
β3 Bankijt + β4Macrojt + εijt (3)
where GDP growthjt is the rate of GDP growth of the bank’s parent country. Less cyclicality of a
multinational’s loan growth in the parent country with respective to parent-country GDP growth
is consistent with finding β2 < 0, and vice versa. Credit growth in the bank’s parent country may
be less cyclical with respect to parent-country GDP growth, if lower parent-country GDP growth
(resulting in higher losses on the domestic loan portfolio) enables the bank to continue lending
domestically by relocating funding from its foreign subsidiaries to the parent bank. We examine
these relationships for developing and high-income country international banks, investing in
other developing or high-income countries, looking for potentially different patterns of
association.
3. Empirical results
3.1 Bank performance and internationalization
Table 2 shows evidence on how the bank valuation, risk, and return variables vary with
bank internationalization from estimating specification 1 in section 2.2. The regressions in
columns 1-6 and 7-12 include the foreign liabilities ratio variable and the countries variable,
respectively. In the Tobin’s Q regression 1, the foreign liabilities variable obtains a negative
coefficient of -0.064 that is significant at 10%, while in the Market-to-book regression 2 this

15
variable obtains a negative coefficient of -0.535 that is significant at 1%. These results suggest
bank internationalization on average is associated with lower bank valuation. In the ROE
regression 6, Foreign liabilities enters with a negative coefficient of -0.039 that is significant at
10%. Similarly, in the ROE regression 12 the countries variable is estimated with a negative
coefficient of -0.041 that is significant at 5%. Overall, the evidence of Table 2 indicates that
internationalization has tended to reduce bank valuation in part on account of a lower return on
equity.
These results suggest that overall, bank internationalization has progressed beyond the
point where it is in the interest of bank shareholders, potentially because of corporate governance
failures influencing manager incentives and too-big-to-fail subsidies (see Anginer et al.,
forthcoming).
Next, we consider whether the relationships between bank performance variables and
bank internationalization are different for banks headquartered in developing countries, and
whether these relationships have been affected by the financial crisis in line with specification 2
in section 2.2. The regressions reported in Panel A of Table 3 include the foreign liabilities ratio
variable, while the regressions in Panel B include the countries variable.
In the Tobin’s Q regression 2 of Panel A, the interaction Foreign liabilities * After 2006
is estimated to be positive and significant at 1%, which suggests that internationalization reduces
bank valuation less following the financial crisis, perhaps because of regulatory-induced
improvements after the crisis, as well as too-big-to-fail subsidies which were revealed by the
ability of international banks to draw on the financial safety net during the crisis. In the market-
to-book regression 4, similarly the interaction Foreign liabilities * After 2006 is estimated with a
positive and significant coefficient. In this regression, the variable Foreign liabilities *

16
Developing receives a positive and significant coefficient of 2.551 while the triple interaction
Foreign liabilities * Developing * After 2006 receives a negative and significant coefficient of -
2.615. This suggests that internationalization added relatively more to the valuation of
developing country banks, but that this advantage was lost following the crisis. In the NPL
regression 8, the interaction Foreign liabilities * After 2006 is estimated with a negative and
significant coefficient of -0.010, which suggests that internationalized banks had relatively low
NPL ratios following the crisis, perhaps because they held relatively well-diversified loan
portfolios. Overall, the results of Panel A of Table 3 suggest that internationalized banks suffered
relatively little from the crisis in terms of their valuation as well as their NPL ratio.
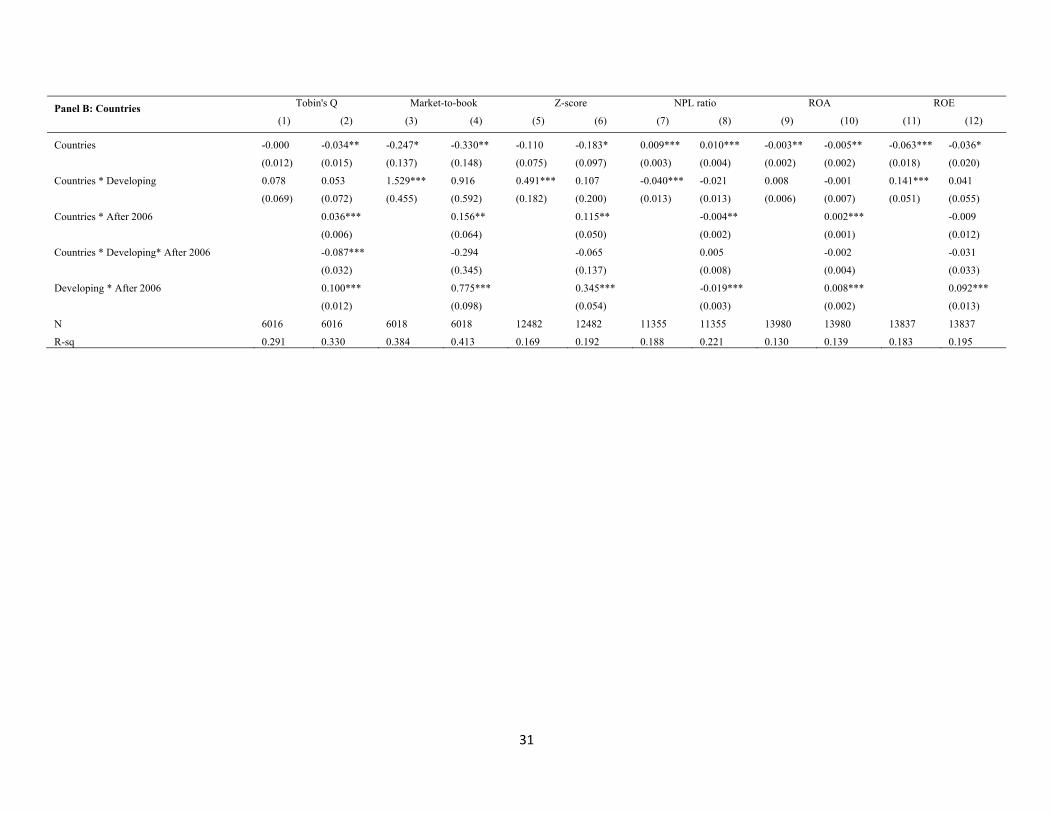
In Panel B of Table 3, we see that the interaction Countries *Developing enters with
positive and significant coefficients in the Market-to-book ratio regression 3, the Z-score
regression 5, and the ROE regression 11, while it enters with a negative and significant
coefficient in the NPL ratio regression 7. Together these results suggest that internationalization
creates benefits for especially banks headquartered in developing countries in terms of higher
valuation and ROE, and lower bank risk (as measured by both the Z-score and the NPL ratio).
The interaction variable Countries * After 2006, in turn, is positive and significant in the Tobin’s
Q regression 2, the Market-to-book regression 4, the Z-score regression 6, the ROA regression
10, and it is negative and significant in the NPL ratio regression 8. The picture that emerges from
these results is that internationalization served banks relatively well following the crisis in terms
of valuation, their ROA as well as their risk (as measured by both the Z-score and the NPL ratio).
Overall, the results of Table 3 show that bank internationalization has conferred
performance benefits to banks especially if headquartered in developing countries and following
the crisis. International banks can not only be distinguished by whether their headquarters are

17
located in a developing country or not, but also by whether their foreign activities take place in
developing countries. To take the location of an international bank’s activities into account, we
split the Foreign liabilities variable into two separate variables reflecting liabilities contracted in
high-income and developing countries, respectively. Similarly, we constructed two separate
countries variables as the logs of the numbers of a bank’s foreign host countries among high-
income vs. developing countries. In unreported regressions analogous to Table 3, we find that
banks located in high-income countries had lower (higher) valuations if their foreign activities
took place in high-income (developing) countries (whether measured by foreign liabilities or
countries variables). The tendency for high-income country international banks with foreign
activities in other high-income countries to receive lower valuations, however, was mitigated
following the crisis.6
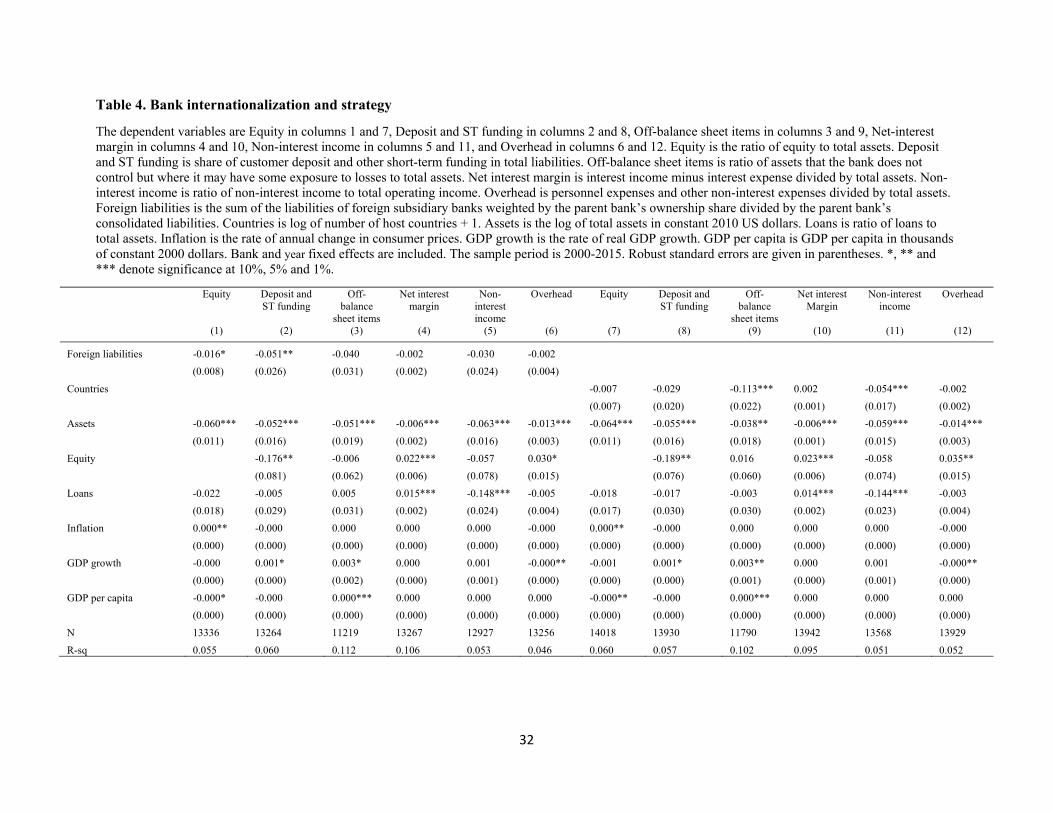
3.2 Bank strategies and internationalization
In this subsection, we analyze how bank internationalization is associated with a range of
variables that are indicative of bank funding and income strategies. In Table 4, regressions 1-6
relate these variables to the foreign liabilities ratio, while regressions 7-12 relate them to the
countries variable.
Regression 1 of Table 4 shows that the equity varies negatively and significantly with
foreign liabilities, providing evidence that internationalized banks tend to be less well
capitalized. This could reflect a greater expectation on the part of internationalized banks of
being bailed out in case of distress. In regression 2, the deposit and short-term funding ratio is
shown to be significantly lower for banks with higher foreign liabilities, perhaps because
international banks find it more difficult to raise deposits in foreign banking markets. The
6 In contrast, for developing country banks we did not find a clear differential valuation effect depending on whether they operate in foreign high-income countries or foreign developing countries.

18
relatively low deposit share in international banks’ funding could make their funding less stable.
In regressions 9 and 11, we see that the off-balance sheet items and the non-interest income share
variables are negatively and significantly related to the countries variable. Internationalized
banks may acquire fewer off-balance sheet exposures and engage less in non-interest income
generating activities on account of their informational disadvantages in conducting non-standard
banking activities, which may reduce their riskiness.
Overall, the lower capitalization and deposit funding of internationalized banks suggest
they have relatively risky business models, while the lower off-balance sheet items and non-
interest income share point in the opposite direction.
In Table 5 we examine how the differential strategies of international banks depend on
the location of the parent bank and on the time period. In the equity regression 2 of Panel A, the
Foreign liabilities * Developing variable enters negatively and significantly, suggesting that the
lower capitalization of internationalized banks is a developing country phenomenon. In the
deposits share regression 4, Foreign liabilities * After 2006 and Foreign liabilities * Developing
* After 2006 obtain significant coefficients of -0.057 and 0.143, respectively, suggesting that
internationalized banks started to have a relatively low deposit funding share following the crisis,
but not in developing countries. From regressions 6 and 10, we see that the lower off-balance
sheet exposures and non-interest income share of internationalized banks can be attributed to the
crisis period and its aftermath.
In Panel B, the negative and estimated coefficients for the Countries * After 2006
coefficients in the deposit and short-term funding regression 4, the off-balance sheet items
regression 6, and the non-interest income regression 10 suggest internationalized banks started to
have lower values of these respective variables following the crisis. Positive and significant

19
coefficients for the Countries * Developing * After 2006 variables in regressions 4 and 6,
however, suggest that banks in high-income countries, rather than developing countries, started
to adopt different deposit funding shares and off-balance sheet exposures compared to domestic
banks following the crisis.
3.3 The cyclicality of credit and internationalization
A potential benefit of bank internationalization is that it reduces the cyclicality of credit
in individual countries to their respective business cycles. In this subsection, we consider the
relationship between bank internationalization and the cyclicality of bank loans following
specification 3 in section 2.2. In turn, we consider the cyclicality of loans at the level of the
parent bank with respect to parent-country GDP growth, and the cyclicality of loans at subsidiary
banks with respect to GDP growth in subsidiary countries.
Regressions 1 and 2 of Table 6, the dependent variable is the credit growth rate of the
parent bank at the consolidated level. In regression 2, the triple interaction Foreign liabilities *
GDP growth * Developing receives a negative and significant coefficient of -0.048, which
suggests that greater internationalization of banks located in developing countries reduces the
sensitivity of loans to their countries’ GDP growth rate. In regressions 3-4, the dependent
variable is parent-bank loan growth at the unconsolidated level, excluding domestic and foreign
subsidiaries. This variable is a more direct measure of the growth rate of a bank’s credit
domestically. In regression 3, the negative and significant coefficient for the Foreign liabilities *
GDP growth variable of -0.022 suggests that the sensitivity of a bank’s loan growth at the
unconsolidated level to parent-country GDP growth declines with its degree of
internationalization. The negative and significant coefficient for the triple interaction Foreign
liabilities * GDP growth * Developing in regression 4 suggests that this is especially the case for

20
developing country banks. The negative and significant coefficients for the triple interactions
terms involving the countries variable in regressions 6 and 8 are consistent with this. Overall,
Table 6 provides evidence that bank internationalization of banks tends to make loan provision in
their home countries less sensitive to home-country GDP growth. This could reflect that
domestic GDP growth has a relatively small impact on firm-wide loan losses, and hence
capitalization, for internationalized banks, which would mitigate the impact of domestic loan
losses on international banks’ abilities to provide new loans domestically.
The estimated coefficients of regression 6 in Table 6 can be used to illustrate the credit
growth impact associated with a 1% higher GDP growth rate depending on the bank’s degree of
internationalization and its location. In particular, we compare credit growth at a domestic bank
to credit growth at an average international bank that has a log number countries, in which the
bank is active, variable equal to its mean. Both of these banks are taken to be located either in a
developing country or a high-income country. As seen in Figure 10, a higher GDP growth rate of
1% has impacts of 0.60% and 0.90% on the credit growth rates of domestic and international
banks, respectively, if they are located in a high-income country. In contrast, the calculated credit
growth rate of a domestic bank (1.50%) is substantially higher than for an international bank
(0.32%), if both banks are located in a developing country. These results confirm a lower
procyclicality of credit provision by international banks headquartered in developing countries.
To conclude this section, we address the cyclicality of loan growth to local GDP growth
from the perspective of the banks’ host countries. Analogously to Table 6, we consider loan
growth of subsidiary banks both at the consolidated and unconsolidated levels in Table 7.7 In
addition, we consider a sample split between subsidiaries located in high-income host countries
7 Subsidiary bank loan growth at the unconsolidated level should be a relatively good measure of loan growth in the host country.

21
(in regressions 1 and 2), and subsidiaries located in developing host countries (in regressions 3
and 4). In regressions 3 and 4 (concerning loan growth at the consolidated and unconsolidated
levels, respectively, for subsidiaries located in developing countries), we find positive and
significant coefficients for interaction variables of host country GDP growth and a dummy
variable signaling that the bank’s home country is a high-income country.8 Thus, host-country
credit growth is relatively procyclical with respect to host-country GDP growth for banks located
in developing countries, if their parent bank is headquartered in a high-income country. Such an
enhanced procyclicality of credit provision by international banks in developing countries can
come about if a higher GDP growth rate in a developing country causes the high-income parent
bank to channel additional funds to the developing country to meet the greater loan demand. This
is potentially destabilizing for the economy of the developing country.
4. Conclusion
This paper adds to a relatively small literature that considers the performance of
international banks at the consolidated level. We use consolidated bank-level data in 113
countries to investigate if international banks headquartered in developing countries behave and
perform differently compared to those headquartered in high-income countries. These
differences became important with the rise of international banks from developing countries after
the global financial crisis, and the pros and cons of this expansion are starting to be debated in
academic and policy circles.
Our empirical results suggest that bank valuation has varied negatively with a bank’s
degree of internationalization in general. Hence, on average, bank internationalization has
8 Bertay, Demirgüç-Kunt, and Huizinga (2015) find that the credit growth of foreign subsidiaries is more procyclical with local GDP growth than the credit growth of domestic banks.

22
progressed beyond the point where it is in the interests of bank shareholders, potentially because
of corporate governance failures that have enabled bank managers to engage in international
bank empire building, also to take advantage of perceived too-big-to-fail subsidies that accrue to
large and complex banks.
In contrast, developing country international banks seem to have benefited from
internationalization compared to international banks headquartered in high-income countries.
This could reflect that developing country banks have tended to expand into countries in the
same region and with a similar level of economic development where they would have a true
comparative advantage.
The implications of bank internationalization also vary over time. In particular, we find
that international banks experienced some revaluation after 2006 following the financial crisis,
potentially because of recapitalization and changes in their asset composition, as well as
revaluation of their too-big-to-fail subsidies which were revealed to be large based on their
ability to draw on the financial safety net during the crisis.
Furthermore, international banks are also relatively undercapitalized, rely less on deposit
funding and do not engage as much in off-balance sheet or non-interest income generating
activities. The net effect of these differences between international and domestic banks on
financial fragility is unclear, as lower capitalization and customer funding could increase bank
risk, while lower off-balance sheet exposures and a lower share of non-interest income could
reduce risk.
Finally, we see that international banks headquartered in developing countries reduce the
cyclicality of domestic credit growth with respect to domestic GDP growth, potentially
cushioning local economic downturns. In contrast, international banks from high-income

23
countries can amplify the cyclicality of credit growth in developing countries when they invest
there. In summary, for developing countries, internationalization of their banks can be a
stabilizing force for their overall economy. However, international banks coming from high-
income countries can be destabilizing for developing countries, since their lending tends to be
procyclical.
24
References
Alade, S. (2014). Cross-border expansion of Nigerian banks: Has it improved the continent's regulatory and supervisory frameworks?. BIS Paper No 76.
Anginer, D., Cerutti, E., and Martinez Peria, M. S. (2017). Foreign bank subsidiaries' default risk during the global crisis: What factors help insulate affiliates from their parents?. Journal of Financial Intermediation 29, 19-31.
Anginer, D. Demirguc-Kunt, A., Huizinga, H. and Ma, K. Forthcoming. Corporate Governance of Banks and Financial Stability. Journal of Financial Economics.
Berger, A. N., Ghoul, S. E., Guedhami, O., and Roman, R. A. (2016). Internationalization and bank risk. Management Science 63, 2283-2301.
Bertay, A. C., Demirgüç-Kunt, A., and Huizinga, H. (2015). Bank ownership and credit over the business cycle: Is lending by state banks less procyclical?. Journal of Banking and Finance 50, 326-339.
Bertay, A. C., Demirgüç-Kunt, A., and Huizinga, H. (2016). Should cross-border banking benefit from the financial safety net?. Journal of Financial Intermediation 27, 51-67.
Buch, C. M., Koch, C. T., and Koetter, M. (2011). Size, productivity, and international banking. Journal of International Economics 85, 329-334.
Buch, C. M., Koch, C. T., and Koetter, M. (2013). Do banks benefit from internationalization? Revisiting the market power–risk nexus. Review of Finance 17, 1401-1435.
Buch, C. M., Koch, C. T., and Koetter, M. (2014). Should I stay or should I go? Bank productivity and internationalization decisions. Journal of Banking and Finance 42, 266-282.
Claessens, S., Demirgüç-Kunt, A., and Huizinga, H. (2001). How does foreign entry affect domestic banking markets?. Journal of Banking and Finance 25, 891-911.
Claessens, S., and Van Horen, N. (2012). Being a foreigner among domestic banks: Asset or liability?. Journal of Banking and Finance 36, 1276-1290.
Claessens, S., and Van Horen, N. (2014). Foreign banks: Trends and impact. Journal of Money, Credit and Banking 46(s1), 295-326.
Cull, R., and Martinez Peria, M. S. (2010). Foreign bank participation in developing countries: what do we know about the drivers and consequences of this phenomenon?. World Bank Policy Research Working Paper Series 5398.
De Haas, R., and Lelyveld, I. (2014). Multinational banks and the global financial crisis: Weathering the perfect storm?. Journal of Money, Credit and Banking 46(s1), 333-364.

25
Demirgüç-Kunt, A., and Huizinga, H. (2010), Bank activity and funding strategies: The impact on risk and returns, Journal of Financial Economics 98, 626-650.
Galema, R., Koetter, M., and Liesegang, C. (2013). Cost leadership and bank internationalization, Discussion Paper No. 57/2013, Deutsche Bundesbank.
García-Herrero, A., and Vázquez, F. (2013). International diversification gains and home bias in banking. Journal of Banking and Finance 37, 2560-2571.
Gulamhussen, M., Pinheiro, C., and Pozzolo, A. F. (2014). International diversification and risk of multinational banks: Evidence from the pre-crisis period. Journal of Financial Stability 13, 30-43.
Gulamhussen, M., Pinheiro, C. M., and Pozzolo, A. F. (2017). Do multinational banks create or destroy shareholder value? A cross-country analysis. Financial Markets, Institutions and Instruments 26, 295-313.
Huizinga, H., Voget, J., and Wagner, W. (2014). International taxation and cross border banking, American Economic Journal: Economic Policy 6, 94-125.
International Monetary Fund (2015). Global Financial Stability Report, Washington, April.
Merz, J., and Overesch, M. (2016). Profit shifting and tax response of multinational banks. Journal of Banking and Finance, 68, 57-68.
World Bank (2018). Global Financial Development Report 2017/2018: Bankers without Borders. Washington, DC: World Bank.

26
A. Data Appendix
Variable definitions and data sources
Variable Description Sources Foreign liabilities Sum of the liabilities of foreign subsidiary banks weighted by the parent bank’s ownership share divided
by the parent bank’s consolidated liabilities Bankscope
Countries Log of (number of host countries +1) Bankscope Tobin’s Q Sum of market value of common equity, preferred equity, and total liabilities divided by total assets Bankscope and Datastream Market-to-book Ratio of market value of equity to book value of equity Bankscope and Datastream Z-score Log of Z-score which is calculated as (ROA+CAR)/stddev(ROA), where ROA is return on assets, CAR
is the ratio of capital to assets, and stddev(ROA) is the standard deviation of return on assets. It is calculated for 4-years rolling windows, normalized by total assets, and lagged one period
Bankscope
NPL ratio Log of ratio of non-performing loans to gross loans + 1 Bankscope ROA Ratio of pre-tax profits to total assets Bankscope ROE Ratio of pre-tax profits to equity Bankscope Equity Ratio of equity to total assets Bankscope Deposit and ST funding Share of customer deposit and other short-term funding in total liabilities Bankscope Off-balance sheet items Ratio of assets that the bank does not control but where it may have some exposure to losses to total
assets Bankscope
Net interest margin Interest income minus interest expense divided by total assets Bankscope Non-interest income Ratio of non-interest income to total operating income Bankscope Overhead Personnel expenses and other non-interest expenses divided by total assets Bankscope Loan growth, consolidated Growth rate of loans from the parent bank’s consolidated balance sheet Bankscope Loan growth, unconsolidated Growth rate of loans from the parent bank’s unconsolidated balance sheet Bankscope Loan growth subsidiary, consolidated
Growth rate of loans from a subsidiary bank’s consolidated balance sheet Bankscope
Loan growth subsidiary, unconsolidated
Growth rate of loans from a subsidiary bank’s unconsolidated balance sheet Bankscope
Assets Log of total assets in constant 2010 dollars Bankscope Loans Ratio of loans to total assets Bankscope Inflation Rate of annual change in consumer prices Bankscope Developing Dummy variable that is one for a bank located in a low-income or middle-income country according to
World Bank classification, and zero otherwise. Bankscope
Inflation Consumer price inflation rate WDI GDP growth Rate of real per capita GDP growth WDI GDP per capita GDP per capita in thousands of constant 2000 dollars WDI

27
Construction of the bank sample
We construct the data set by combining three modules from Bankscope. The Financials module discloses balance sheet information, and has been applied frequently in past empirical literature. The Ownership and Subsidiary modules provide information on the equity structure of banks, their subsidiaries, and participatory affiliates. In constructed the data set, we had to meet three major challenges.
First, to ensure entities at every level are coded properly, we used identifiers including Bureau van Dijk ID (bvdid), the Bankscope index, and the bank name jointly to organize financial and ownership statements. The primary purposes of bvdid and the index are to track banks and related financial statements at different consolidation levels. However, over the period of 2000-2015 the published identifiers have exhibited changes that confound direct identification. Exploiting the fact that multiple bvdids can refer to one banking entity through the same financial statement index number (and vice versa), we conducted a pre-identification network analysis to connect groups of bvdids sharing any indices in any year, and adjusted for bank name overlaps to create standardized identifiers for analysis. This exercise groups the 50,987 bank bvdids into 33,723 entities, which represent ultimate owners (UOs), intermediate entities, and lower-level subsidiaries.
Second, we adopt a systematic approach to harmonize entity links from the two connection modules as an ownership transfer may not be recorded in unison. Treating total and direct ownership link-years separately (respectively 4.4 million and 2.5 million), we first retain the set of link-years that appear in the most up-to-date record. Next, we give precedence to Subsidiary module information in case of conflicts so as to maximize comparability from the shareholder perspective. For very limited remaining cases, the largest recorded shareholding value is applied to break ties. At this stage, 1.8 million total and 847,000 direct ownership link-years remain. As Bureau van Dijk retains ownership records until a change is reported, we carry forward values from the latest year previously available, applying this principle to bridge any gaps in the panel dimension for every entity pair. This restores the number of link-years to 2.2 million and 905,000 for total and direct ownership links, respectively.
Third, using the total shareholding positions as the basis to identify a bank’s UOs, we augment it with results of a recursive algorithm that traces consecutive direct shareholding positions to UOs such as parent banks or holding companies. For each year in 2000-15, the algorithm arranges fractional direct shareholding positions into a matrix, with rows representing immediate subsidiaries and columns shareholders that have been standardized in the network analysis. To identify foreign ownership, we assume any unreported ownership is retained domestically by the entity, replacing diagonal entries with residuals so each matrix row sums up to 1. Ruling out circular ownership, each step of right-multiplication consolidates one layer of the shareholding structure. The computation attained the multiplicative limit after 8 steps, suggesting the longest ownership chain involves 9 entities.
From the pool of UO-subsidiary pairs we retained those with controlling (as opposed to participatory) ownership by banking entities, re-applied the gap connection routine to smoothen series, and attached information from the Financials module to aggregate the balance sheets of majority-owned subsidiaries in foreign jurisdictions. We use consolidated statements at the UO level and unconsolidated at subsidiary level wherever possible. The end result is 466,000 link-years of 4,674 UOs, among which 25,777 links originate from 678 international UOs.
28
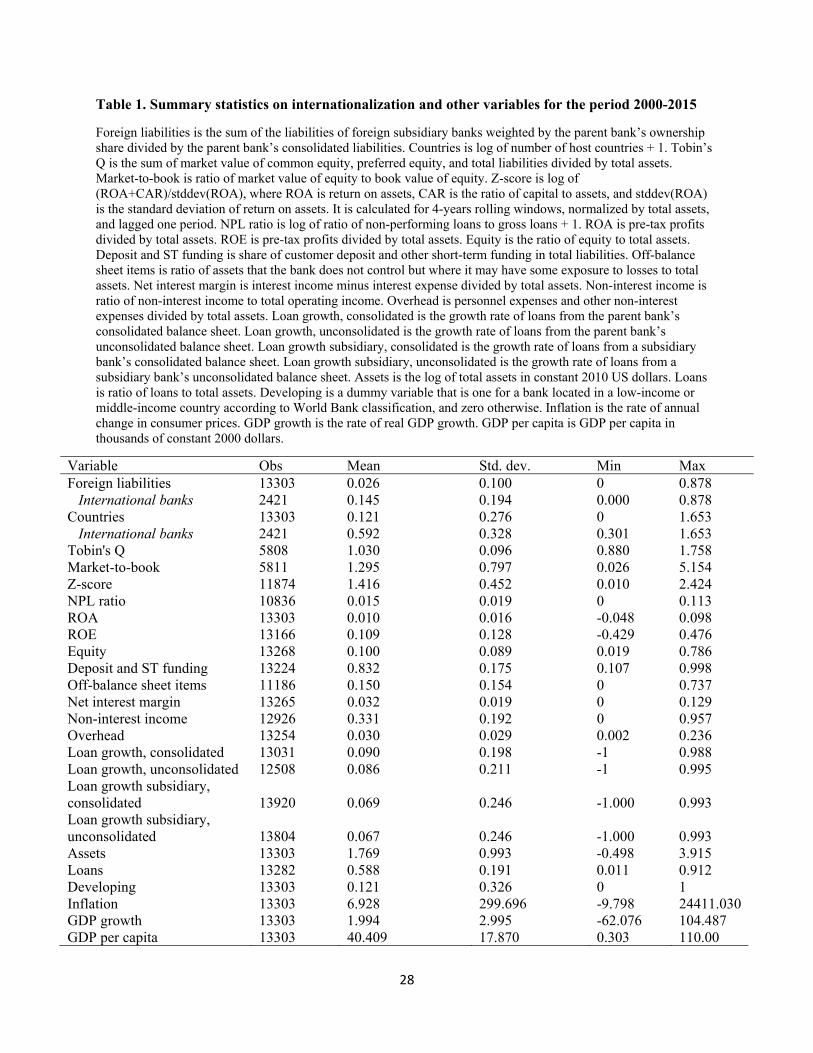
Table 1. Summary statistics on internationalization and other variables for the period 2000-2015
Foreign liabilities is the sum of the liabilities of foreign subsidiary banks weighted by the parent bank’s ownership share divided by the parent bank’s consolidated liabilities. Countries is log of number of host countries + 1. Tobin’s Q is the sum of market value of common equity, preferred equity, and total liabilities divided by total assets. Market-to-book is ratio of market value of equity to book value of equity. Z-score is log of (ROA+CAR)/stddev(ROA), where ROA is return on assets, CAR is the ratio of capital to assets, and stddev(ROA) is the standard deviation of return on assets. It is calculated for 4-years rolling windows, normalized by total assets, and lagged one period. NPL ratio is log of ratio of non-performing loans to gross loans + 1. ROA is pre-tax profits divided by total assets. ROE is pre-tax profits divided by total assets. Equity is the ratio of equity to total assets. Deposit and ST funding is share of customer deposit and other short-term funding in total liabilities. Off-balance sheet items is ratio of assets that the bank does not control but where it may have some exposure to losses to total assets. Net interest margin is interest income minus interest expense divided by total assets. Non-interest income is ratio of non-interest income to total operating income. Overhead is personnel expenses and other non-interest expenses divided by total assets. Loan growth, consolidated is the growth rate of loans from the parent bank’s consolidated balance sheet. Loan growth, unconsolidated is the growth rate of loans from the parent bank’s unconsolidated balance sheet. Loan growth subsidiary, consolidated is the growth rate of loans from a subsidiary bank’s consolidated balance sheet. Loan growth subsidiary, unconsolidated is the growth rate of loans from a subsidiary bank’s unconsolidated balance sheet. Assets is the log of total assets in constant 2010 US dollars. Loans is ratio of loans to total assets. Developing is a dummy variable that is one for a bank located in a low-income or middle-income country according to World Bank classification, and zero otherwise. Inflation is the rate of annual change in consumer prices. GDP growth is the rate of real GDP growth. GDP per capita is GDP per capita in thousands of constant 2000 dollars.
Variable Obs Mean Std. dev. Min Max Foreign liabilities 13303 0.026 0.100 0 0.878 International banks 2421 0.145 0.194 0.000 0.878 Countries 13303 0.121 0.276 0 1.653 International banks 2421 0.592 0.328 0.301 1.653 Tobin's Q 5808 1.030 0.096 0.880 1.758 Market-to-book 5811 1.295 0.797 0.026 5.154 Z-score 11874 1.416 0.452 0.010 2.424 NPL ratio 10836 0.015 0.019 0 0.113 ROA 13303 0.010 0.016 -0.048 0.098 ROE 13166 0.109 0.128 -0.429 0.476 Equity 13268 0.100 0.089 0.019 0.786 Deposit and ST funding 13224 0.832 0.175 0.107 0.998 Off-balance sheet items 11186 0.150 0.154 0 0.737 Net interest margin 13265 0.032 0.019 0 0.129 Non-interest income 12926 0.331 0.192 0 0.957 Overhead 13254 0.030 0.029 0.002 0.236 Loan growth, consolidated 13031 0.090 0.198 -1 0.988 Loan growth, unconsolidated 12508 0.086 0.211 -1 0.995 Loan growth subsidiary, consolidated 13920 0.069 0.246 -1.000 0.993 Loan growth subsidiary, unconsolidated 13804 0.067 0.246 -1.000 0.993 Assets 13303 1.769 0.993 -0.498 3.915 Loans 13282 0.588 0.191 0.011 0.912 Developing 13303 0.121 0.326 0 1 Inflation 13303 6.928 299.696 -9.798 24411.030 GDP growth 13303 1.994 2.995 -62.076 104.487 GDP per capita 13303 40.409 17.870 0.303 110.00

29
Table 2. Bank internationalization and performance
The dependent variables are Tobin’s Q in columns 1 and 7, Market-to-book in columns 2 and 8, Z-score in columns 3 and 9, NPL ratio in columns 4 and 10, ROA in columns 5 and 11, and ROE in columns 6 and 12. Tobin’s Q is the sum of market value of common equity, preferred equity, and total liabilities divided by total assets. Market-to-book is ratio of market value of equity to book value of equity. Z-score is log of (ROA+CAR)/stddev(ROA), where ROA is return on assets, CAR is the ratio of capital to assets, and stddev(ROA) is the standard deviation of return on assets. It is calculated for 4-years rolling windows, normalized by total assets, and lagged one period. NPL ratio is log of ratio of non-performing loans to gross loans + 1. ROA is pre-tax profits divided by total assets. ROE is pre-tax profits divided by total assets. Foreign liabilities is the sum of the liabilities of foreign subsidiary banks weighted by the parent bank’s ownership share divided by the parent bank’s consolidated liabilities. Countries is log of number of host countries + 1. Assets is the log of total assets in constant 2010 US dollars. Loans is ratio of loans to total assets. Inflation is the rate of annual change in consumer prices. GDP growth is the rate of real GDP growth. GDP per capita is GDP per capita in thousands of constant 2000 dollars. Bank and year fixed effects are included. The sample period is 2000-2015. Robust standard errors are given in parentheses. *, ** and *** denote significance at 10%, 5% and 1%.
Tobin's Q Market-to-
book Z-score NPL ratio ROA ROE Tobin's Q Market-to-
book Z-score NPL ratio ROA ROE
(1) (2) (3) (4) (5) (6) (7) (8) (9) (10) (11) (12)
Foreign liabilities -0.064* -0.535*** -0.052 0.007 -0.004 -0.039*
(0.036) (0.136) (0.083) (0.007) (0.003) (0.023) Countries 0.010 -0.040 -0.032 0.003 -0.002 -0.041**
(0.015) (0.150) (0.073) (0.003) (0.002) (0.017)
Assets 0.023 0.320*** 0.169*** -0.008*** -0.004** -0.024* 0.024* 0.352*** 0.158*** -0.009*** -0.003 -0.018
(0.014) (0.120) (0.059) (0.003) (0.002) (0.015) (0.014) (0.116) (0.058) (0.003) (0.002) (0.014)
Equity 0.158 0.046 1.336*** -0.052*** 0.019** -0.086 0.092 -0.016 1.358*** -0.053*** 0.020** -0.090*
(0.098) (0.513) (0.200) (0.018) (0.008) (0.055) (0.116) (0.481) (0.203) (0.018) (0.008) (0.052)
Loans 0.009 0.183 0.526*** -0.010** 0.006* 0.034 0.020 0.236 0.495*** -0.009** 0.005 0.025
(0.026) (0.249) (0.090) (0.004) (0.003) (0.027) (0.025) (0.237) (0.088) (0.004) (0.003) (0.026)
Inflation 0.000* -0.000*** 0.000 -0.000 0.000*** 0.000*** 0.000** -0.000*** 0.000 -0.000 0.000*** 0.000***
(0.000) (0.000) (0.000) (0.000) (0.000) (0.000) (0.000) (0.000) (0.000) (0.000) (0.000) (0.000)
GDP growth 0.005*** 0.044*** 0.004 -0.000 0.000** 0.003** 0.006*** 0.047*** 0.004 -0.000* 0.000** 0.004**
(0.001) (0.009) (0.003) (0.000) (0.000) (0.001) (0.001) (0.009) (0.003) (0.000) (0.000) (0.001)
GDP per capita -0.000 0.000 0.000*** -0.000*** 0.000*** 0.000*** -0.000 0.000 0.000*** -0.000*** 0.000*** 0.000***
(0.000) (0.000) (0.000) (0.000) (0.000) (0.000) (0.000) (0.000) (0.000) (0.000) (0.000) (0.000)
N 5820 5822 11874 10849 13303 13166 6016 6018 12482 11355 13980 13837
R-sq 0.308 0.391 0.178 0.192 0.142 0.187 0.289 0.377 0.166 0.179 0.129 0.181

30
Table 3. Bank internationalization and performance: developing country banks and the financial crisis
The dependent variables are risk Tobin’s Q in columns 1 and 7, Market-to-book in columns 2 and 8, Z-score in columns 3 and 9, NPL ratio in columns 4 and 10, ROA in columns 5 and 11, and ROE in columns 6 and 12. Tobin’s Q is the sum of market value of common equity, preferred equity, and total liabilities divided by total assets. Market-to-book is ratio of market value of equity to book value of equity. Z-score is log of (ROA+CAR)/stddev(ROA), where ROA is return on assets, CAR is the ratio of capital to assets, and stddev(ROA) is the standard deviation of return on assets. It is calculated for 4-years rolling windows, normalized by total assets, and lagged one period. NPL ratio is log of ratio of non-performing loans to gross loans + 1. ROA is pre-tax profits divided by total assets. ROE is pre-tax profits divided by total assets. Foreign liabilities is the sum of the liabilities of foreign subsidiary banks weighted by the parent bank’s ownership share divided by the parent bank’s consolidated liabilities. Developing is a dummy variable that is one for a bank located in a low-income or middle-income country according to World Bank classification, and zero otherwise. After 2006 is a dummy variable that is one for years after 2006, and zero otherwise. Countries is log of number of host countries + 1. Assets is the log of total assets in constant 2010 US dollars. Loans is ratio of loans to total assets. Inflation is the rate of annual change in consumer prices. GDP growth is the rate of real GDP growth. GDP per capita is GDP per capita in thousands of constant 2000 dollars. Assets, Loans, Inflation, GDP growth, and GDP per capita are included, but not reported. Panel A reports regressions that include foreign liabilities, and Panel B reports regressions that include Countries. Bank and year fixed effects are included. The sample period is 2000-2015. Robust standard errors are given in parentheses. *, ** and *** denote significance at 10%, 5% and 1%.
Panel A: Foreign liabilities Tobin's Q Market-to-book Z-score NPL ratio ROA ROE
(1) (2) (3) (4) (5) (6) (7) (8) (9) (10) (11) (12)
Foreign liabilities -0.067* -0.128*** -0.599*** -0.916*** -0.042 -0.110 0.007 0.013 -0.004 -0.005 -0.050** -0.024
(0.038) (0.034) (0.137) (0.150) (0.092) (0.159) (0.006) (0.008) (0.003) (0.003) (0.025) (0.033)
Foreign liabilities * Developing 0.047 0.086 1.000 2.551*** -0.050 0.193 0.001 0.008 0.000 0.002 0.059 0.073
(0.097) (0.125) (0.695) (0.949) (0.218) (0.281) (0.020) (0.021) (0.008) (0.012) (0.055) (0.079)
Foreign liabilities * After 2006 0.086*** 0.477*** 0.125 -0.010** 0.003 -0.025
(0.016) (0.128) (0.172) (0.005) (0.003) (0.031)
Foreign liabilities * Developing *After 2006 -0.070 -2.615** -0.367 -0.010 -0.004 -0.038
(0.224) (1.258) (0.265) (0.016) (0.011) (0.077)
Developing * After 2006 0.084*** 0.802*** 0.359*** -0.018*** 0.008*** 0.086***
(0.013) (0.103) (0.045) (0.003) (0.001) (0.011)
N 5820 5820 5822 5822 11874 11874 10849 10849 13303 13303 13166 13166
R-sq 0.308 0.343 0.391 0.422 0.178 0.201 0.192 0.230 0.142 0.151 0.187 0.200
31
Panel B: Countries Tobin's Q Market-to-book Z-score NPL ratio ROA ROE
(1) (2) (3) (4) (5) (6) (7) (8) (9) (10) (11) (12)
Countries -0.000 -0.034** -0.247* -0.330** -0.110 -0.183* 0.009*** 0.010*** -0.003** -0.005** -0.063*** -0.036*
(0.012) (0.015) (0.137) (0.148) (0.075) (0.097) (0.003) (0.004) (0.002) (0.002) (0.018) (0.020)
Countries * Developing 0.078 0.053 1.529*** 0.916 0.491*** 0.107 -0.040*** -0.021 0.008 -0.001 0.141*** 0.041
(0.069) (0.072) (0.455) (0.592) (0.182) (0.200) (0.013) (0.013) (0.006) (0.007) (0.051) (0.055)
Countries * After 2006 0.036*** 0.156** 0.115** -0.004** 0.002*** -0.009
(0.006) (0.064) (0.050) (0.002) (0.001) (0.012)
Countries * Developing* After 2006 -0.087*** -0.294 -0.065 0.005 -0.002 -0.031
(0.032) (0.345) (0.137) (0.008) (0.004) (0.033)
Developing * After 2006 0.100*** 0.775*** 0.345*** -0.019*** 0.008*** 0.092***
(0.012) (0.098) (0.054) (0.003) (0.002) (0.013)
N 6016 6016 6018 6018 12482 12482 11355 11355 13980 13980 13837 13837
R-sq 0.291 0.330 0.384 0.413 0.169 0.192 0.188 0.221 0.130 0.139 0.183 0.195
32
Table 4. Bank internationalization and strategy
The dependent variables are Equity in columns 1 and 7, Deposit and ST funding in columns 2 and 8, Off-balance sheet items in columns 3 and 9, Net-interest margin in columns 4 and 10, Non-interest income in columns 5 and 11, and Overhead in columns 6 and 12. Equity is the ratio of equity to total assets. Deposit and ST funding is share of customer deposit and other short-term funding in total liabilities. Off-balance sheet items is ratio of assets that the bank does not control but where it may have some exposure to losses to total assets. Net interest margin is interest income minus interest expense divided by total assets. Non-interest income is ratio of non-interest income to total operating income. Overhead is personnel expenses and other non-interest expenses divided by total assets. Foreign liabilities is the sum of the liabilities of foreign subsidiary banks weighted by the parent bank’s ownership share divided by the parent bank’s consolidated liabilities. Countries is log of number of host countries + 1. Assets is the log of total assets in constant 2010 US dollars. Loans is ratio of loans to total assets. Inflation is the rate of annual change in consumer prices. GDP growth is the rate of real GDP growth. GDP per capita is GDP per capita in thousands of constant 2000 dollars. Bank and year fixed effects are included. The sample period is 2000-2015. Robust standard errors are given in parentheses. *, ** and *** denote significance at 10%, 5% and 1%.
Equity Deposit and
ST funding Off-
balance sheet items
Net interest margin
Non-interest income
Overhead Equity Deposit and ST funding
Off-balance
sheet items
Net interest Margin
Non-interest income
Overhead
(1) (2) (3) (4) (5) (6) (7) (8) (9) (10) (11) (12)
Foreign liabilities -0.016* -0.051** -0.040 -0.002 -0.030 -0.002
(0.008) (0.026) (0.031) (0.002) (0.024) (0.004)
Countries -0.007 -0.029 -0.113*** 0.002 -0.054*** -0.002
(0.007) (0.020) (0.022) (0.001) (0.017) (0.002)
Assets -0.060*** -0.052*** -0.051*** -0.006*** -0.063*** -0.013*** -0.064*** -0.055*** -0.038** -0.006*** -0.059*** -0.014***
(0.011) (0.016) (0.019) (0.002) (0.016) (0.003) (0.011) (0.016) (0.018) (0.001) (0.015) (0.003)
Equity -0.176** -0.006 0.022*** -0.057 0.030* -0.189** 0.016 0.023*** -0.058 0.035**
(0.081) (0.062) (0.006) (0.078) (0.015) (0.076) (0.060) (0.006) (0.074) (0.015)
Loans -0.022 -0.005 0.005 0.015*** -0.148*** -0.005 -0.018 -0.017 -0.003 0.014*** -0.144*** -0.003
(0.018) (0.029) (0.031) (0.002) (0.024) (0.004) (0.017) (0.030) (0.030) (0.002) (0.023) (0.004)
Inflation 0.000** -0.000 0.000 0.000 0.000 -0.000 0.000** -0.000 0.000 0.000 0.000 -0.000
(0.000) (0.000) (0.000) (0.000) (0.000) (0.000) (0.000) (0.000) (0.000) (0.000) (0.000) (0.000)
GDP growth -0.000 0.001* 0.003* 0.000 0.001 -0.000** -0.001 0.001* 0.003** 0.000 0.001 -0.000**
(0.000) (0.000) (0.002) (0.000) (0.001) (0.000) (0.000) (0.000) (0.001) (0.000) (0.001) (0.000)
GDP per capita -0.000* -0.000 0.000*** 0.000 0.000 0.000 -0.000** -0.000 0.000*** 0.000 0.000 0.000
(0.000) (0.000) (0.000) (0.000) (0.000) (0.000) (0.000) (0.000) (0.000) (0.000) (0.000) (0.000)
N 13336 13264 11219 13267 12927 13256 14018 13930 11790 13942 13568 13929
R-sq 0.055 0.060 0.112 0.106 0.053 0.046 0.060 0.057 0.102 0.095 0.051 0.052

33
Table 5. Bank internationalization and strategy: developing country banks and the financial crisis
The dependent variables are Equity in columns 1 and 2, Deposit and ST funding in columns 3 and 4, Off-balance sheet items in columns 5 and 6, Net-interest margin in columns 7 and 8, Non-interest income in columns 9 and 10, and Overhead in columns 11 and 12. Equity is the ratio of equity to total assets. Deposit and ST funding is share of customer deposit and other short-term funding in total liabilities. Off-balance sheet items is ratio of assets that the bank does not control but where it may have some exposure to losses to total assets. Net interest margin is interest income minus interest expense divided by total assets. Non-interest income is ratio of non-interest income to total operating income. Overhead is personnel expenses and other non-interest expenses divided by total assets. Foreign liabilities is the sum of the liabilities of foreign subsidiary banks weighted by the parent bank’s ownership share divided by the parent bank’s consolidated liabilities. Developing is a dummy variable that is one for a bank located in a low-income or middle-income country according to World Bank classification, and zero otherwise. After 2006 is a dummy variable that is one for years after 2006, and zero otherwise. Assets is the log of total assets in constant 2010 US dollars. Loans is ratio of loans to total assets. Inflation is the rate of annual change in consumer prices. GDP growth is the rate of real GDP growth. GDP per capita is GDP per capita in thousands of constant 2000 dollars. Countries is log of number of host countries + 1. Assets, Loans, Inflation, GDP growth, and GDP per capita are included, but not reported. Panel A reports regressions that include foreign liabilities, and Panel B reports regressions that include countries. Bank and year fixed effects are included. The sample period is 2000-2015. Robust standard errors are given in parentheses. *, ** and *** denote significance at 10%, 5% and 1%.
Panel A: Foreign liabilities Equity Deposit and ST funding Off-balance sheet items Net interest margin Non-interest income Overhead
(1) (2) (3) (4) (5) (6) (7) (8) (9) (10) (11) (12)
Foreign liabilities -0.011 -0.008 -0.063** -0.019 -0.027 0.120* -0.002 -0.004 -0.037 0.030 -0.002 -0.007
(0.009) (0.012) (0.031) (0.033) (0.034) (0.062) (0.002) (0.003) (0.027) (0.037) (0.004) (0.006)
Foreign liabilities * Developing -0.025 -0.042* 0.062 -0.033 -0.065 -0.180* -0.003 -0.010 0.036 0.035 -0.001 0.001
(0.022) (0.022) (0.045) (0.055) (0.075) (0.101) (0.008) (0.013) (0.061) (0.101) (0.010) (0.010)
Foreign liabilities * After 2006 -0.003 -0.057** -0.200*** 0.003 -0.093** 0.006
(0.010) (0.026) (0.075) (0.003) (0.045) (0.008)
Foreign liabilities * Developing *After 2006 0.027 0.143*** 0.144 0.012 -0.020 -0.001
(0.021) (0.053) (0.103) (0.012) (0.104) (0.012)
Developing *After 2006 0.009* 0.003 -0.015 0.003* -0.029** -0.004***
(0.005) (0.010) (0.015) (0.002) (0.013) (0.001)
N 13336 13336 13264 13264 11219 11219 13267 13267 12927 12927 13256 13256
R-sq 0.055 0.056 0.060 0.062 0.112 0.118 0.106 0.112 0.053 0.058 0.046 0.049

34
Panel B: Countries Equity Deposit and ST funding Off-balance sheet items Net interest margin Non-interest income Overhead
(1) (2) (3) (4) (5) (6) (7) (8) (9) (10) (11) (12)
Countries -0.006 -0.001 -0.044** 0.003 -0.141*** -0.003 0.001 -0.001 -0.057*** 0.011 -0.001 -0.000
(0.006) (0.007) (0.021) (0.022) (0.024) (0.026) (0.001) (0.002) (0.018) (0.017) (0.002) (0.002)
Countries * Developing -0.009 -0.046 0.096* 0.043 0.155*** 0.048 0.004 0.002 0.019 -0.006 -0.006 -0.004
(0.032) (0.032) (0.050) (0.053) (0.057) (0.062) (0.005) (0.005) (0.053) (0.047) (0.007) (0.008)
Countries * After 2006 -0.001 -0.040*** -0.121*** 0.003*** -0.063*** -0.001
(0.003) (0.011) (0.015) (0.001) (0.014) (0.001)
Countries * Developing* After 2006 0.025* 0.053** 0.116*** -0.003 0.055 0.002
(0.013) (0.026) (0.040) (0.004) (0.038) (0.004)
Developing * After 2006 0.009 -0.010 -0.035** 0.004** -0.038*** -0.003*
(0.007) (0.011) (0.017) (0.002) (0.014) (0.002)
N 14018 14018 13930 13930 11790 11790 13942 13942 13568 13568 13929 13929
R-sq 0.060 0.063 0.059 0.063 0.104 0.121 0.095 0.102 0.052 0.062 0.052 0.053

35
Table 6. Bank internationalization and the cyclicality of lending
The dependent variable is Loan growth, consolidated in columns 1-2 and 5-6, and Loan growth, unconsolidated in columns 3-4 and 7-8. Loan growth, consolidated is the growth rate of loans from the bank’s consolidated balance sheet. Loan growth, unconsolidated is the growth rate of loans from the bank’s unconsolidated balance sheet. Foreign liabilities is the sum of the liabilities of foreign subsidiary banks weighted by the parent bank’s ownership share divided by the parent bank’s consolidated liabilities. GDP growth is the rate of real GDP growth. Developing is a dummy variable that is one for a bank located in a low-income or middle-income country according to World Bank classification, and zero otherwise. Countries is the log of number of host countries + 1. Assets is the log of total assets in constant 2010 US dollars. Equity is the ratio of equity to total assets. Loans is ratio of loans to total assets. Inflation is the rate of annual change in consumer prices. GDP per capita is GDP per capita in thousands of constant 2000 dollars. Bank and year fixed effects are included. The sample period is 2000-2015. Robust standard errors are given in parentheses. *, ** and *** denote significance at 10%, 5% and 1%.
Loan growth, consolidated
Loan growth, unconsolidated
Loan growth, consolidated
Loan growth, unconsolidated
(1) (2) (3) (4) (5) (6) (7) (8) Foreign liabilities -0.007 -0.045 0.007 -0.046 (0.046) (0.047) (0.085) (0.106) Foreign liabilities * GDP growth -0.012 0.003 -0.022* -0.004 (0.010) (0.009) (0.012) (0.014) Foreign liabilities * Developing 0.227 0.297*
(0.156) (0.172) Foreign liabilities * GDP growth * Developing -0.048** -0.056**
(0.022) (0.022) Countries -0.045 -0.093*** -0.000 -0.024
(0.029) (0.029) (0.039) (0.042) Countries * GDP growth -0.005 0.005* -0.007 0.004
(0.005) (0.003) (0.005) (0.004) Countries * Developing 0.328*** 0.170*
(0.088) (0.096) Countries * GDP growth * Developing -0.025*** -0.023***
(0.005) (0.006) GDP growth * Developing 0.003 0.004 0.009*** 0.009**
(0.003) (0.003) (0.003) (0.004) GDP growth 0.006** 0.007*** 0.007*** 0.007*** 0.008*** 0.006*** 0.008*** 0.007***
(0.002) (0.002) (0.002) (0.002) (0.002) (0.002) (0.002) (0.002) Assets -0.247*** -0.243*** -0.218*** -0.214*** -0.234*** -0.233*** -0.213*** -0.209*** (0.023) (0.023) (0.024) (0.024) (0.024) (0.024) (0.025) (0.025) Equity 0.103 0.102 0.163 0.162 0.077 0.082 0.127 0.133 (0.137) (0.135) (0.143) (0.142) (0.128) (0.126) (0.131) (0.130) Loans -0.303*** -0.300*** -0.313*** -0.309*** -0.309*** -0.313*** -0.304*** -0.301***

36
(0.038) (0.038) (0.039) (0.039) (0.038) (0.038) (0.039) (0.039) Inflation 0.000*** 0.000*** -0.000*** -0.000*** 0.000*** 0.000*** -0.000*** -0.000*** (0.000) (0.000) (0.000) (0.000) (0.000) (0.000) (0.000) (0.000) GDP per capita 0.000*** 0.000*** 0.000*** 0.000*** 0.000*** 0.000*** 0.000*** 0.000*** (0.000) (0.000) (0.000) (0.000) (0.000) (0.000) (0.000) (0.000) N 13072 13072 12549 12549 13709 13709 13162 13162 R-sq 0.205 0.207 0.165 0.166 0.205 0.210 0.163 0.166
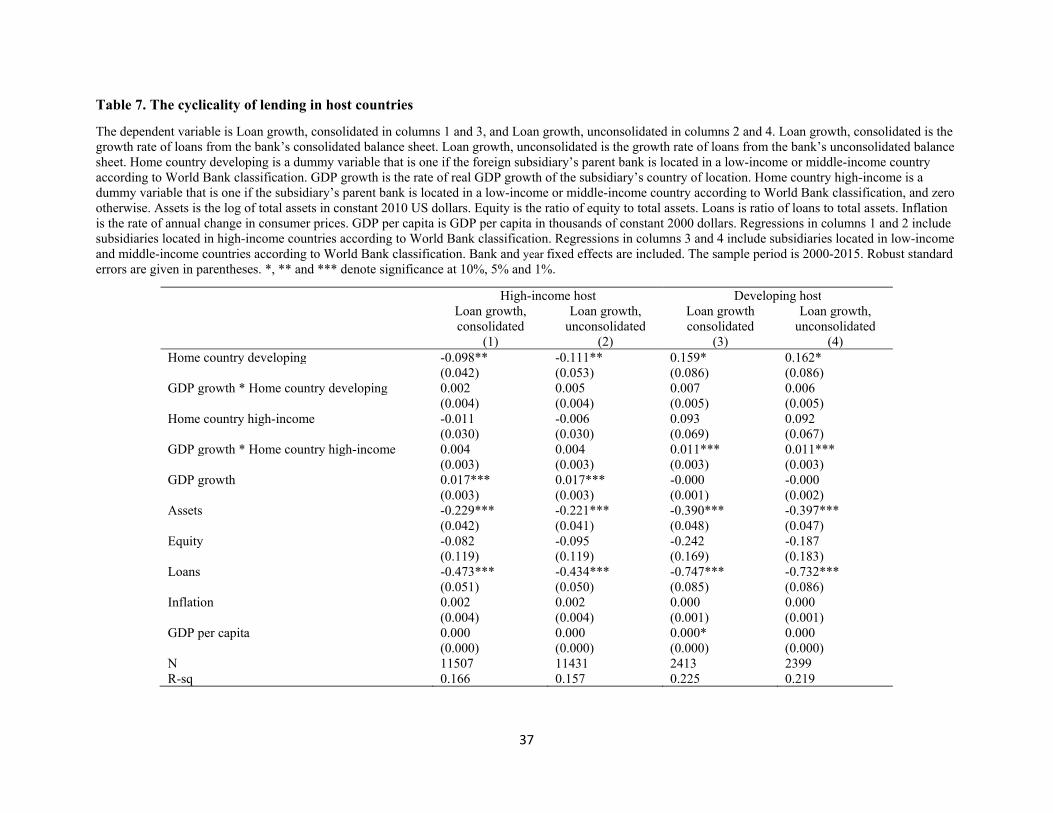
37
Table 7. The cyclicality of lending in host countries
The dependent variable is Loan growth, consolidated in columns 1 and 3, and Loan growth, unconsolidated in columns 2 and 4. Loan growth, consolidated is the growth rate of loans from the bank’s consolidated balance sheet. Loan growth, unconsolidated is the growth rate of loans from the bank’s unconsolidated balance sheet. Home country developing is a dummy variable that is one if the foreign subsidiary’s parent bank is located in a low-income or middle-income country according to World Bank classification. GDP growth is the rate of real GDP growth of the subsidiary’s country of location. Home country high-income is a dummy variable that is one if the subsidiary’s parent bank is located in a low-income or middle-income country according to World Bank classification, and zero otherwise. Assets is the log of total assets in constant 2010 US dollars. Equity is the ratio of equity to total assets. Loans is ratio of loans to total assets. Inflation is the rate of annual change in consumer prices. GDP per capita is GDP per capita in thousands of constant 2000 dollars. Regressions in columns 1 and 2 include subsidiaries located in high-income countries according to World Bank classification. Regressions in columns 3 and 4 include subsidiaries located in low-income and middle-income countries according to World Bank classification. Bank and year fixed effects are included. The sample period is 2000-2015. Robust standard errors are given in parentheses. *, ** and *** denote significance at 10%, 5% and 1%.
High-income host Developing host
Loan growth, consolidated
Loan growth, unconsolidated
Loan growth consolidated
Loan growth, unconsolidated
(1) (2) (3) (4) Home country developing -0.098** -0.111** 0.159* 0.162* (0.042) (0.053) (0.086) (0.086) GDP growth * Home country developing 0.002 0.005 0.007 0.006
(0.004) (0.004) (0.005) (0.005) Home country high-income -0.011 -0.006 0.093 0.092 (0.030) (0.030) (0.069) (0.067) GDP growth * Home country high-income 0.004 0.004 0.011*** 0.011*** (0.003) (0.003) (0.003) (0.003) GDP growth 0.017*** 0.017*** -0.000 -0.000 (0.003) (0.003) (0.001) (0.002) Assets -0.229*** -0.221*** -0.390*** -0.397*** (0.042) (0.041) (0.048) (0.047) Equity -0.082 -0.095 -0.242 -0.187 (0.119) (0.119) (0.169) (0.183) Loans -0.473*** -0.434*** -0.747*** -0.732*** (0.051) (0.050) (0.085) (0.086) Inflation 0.002 0.002 0.000 0.000 (0.004) (0.004) (0.001) (0.001) GDP per capita 0.000 0.000 0.000* 0.000 (0.000) (0.000) (0.000) (0.000) N 11507 11431 2413 2399 R-sq 0.166 0.157 0.225 0.219

38
Figure 1. Growth rate of total assets for international and domestic banks
Note: This figure displays yearly means of the growth rate of assets during 2000-2015 for international banks and domestic banks by blue and red lines, respectively.
Figure 2. Foreign liabilities of international banks
Note: This figure displays yearly means of the foreign liabilities variable during 2000-2015 for international banks. Foreign liabilities is the sum of the liabilities of foreign subsidiary banks weighted by the parent bank’s ownership share divided by the parent bank’s consolidated liabilities.
05
10
15
Gro
wth
of
as
se
ts
2000 2005 2010 2015Year
international domestic
.13
.14
.15
.16
.17
We
igh
ted
lia
bil
ity
ra
tio
2000 2005 2010 2015Year

39
Figure 3. The number of foreign host countries of international banks
Note: This figure displays yearly means of the number of foreign host countries variable during 2000-2015 for international banks.
Figure 4. Tobin’s Q for international and domestic banks
Note: This figure displays yearly means of Tobin’s Q during 2000-2013 for international banks and domestic banks by blue and red lines, respectively. Tobin’s Q is the sum of market value of common equity, preferred equity, and total liabilities divided by total assets. Market-to-book is ratio of market value of equity to book value of equity.
24
68
10
12
Nu
mb
er
of
ho
sts
2000 2005 2010 2015Year
.98
11
.02
1.0
41
.06
1.0
8T
ob
in's
Q
2000 2005 2010 2015Year
international domestic

40
Figure 5. Market-to-book for international and domestic banks
Note: This figure displays yearly means of the market-to-book variable during 2000-2013 for international banks and domestic banks by blue and red lines, respectively. Market-to-book is ratio of market value of equity to book value of equity.
Figure 6. Z-score for international and domestic banks
Note: This figure displays yearly means of the Z-score during 2000-2015 for international banks and domestic banks by blue and red lines, respectively Z-score is log of (ROA+CAR)/stddev(ROA), where ROA is return on assets, CAR is the ratio of capital to assets, and stddev(ROA) is the standard deviation of return on assets. It is calculated for 4-years rolling windows, normalized by total assets, and lagged one period.
.51
1.5
2M
ark
et
to b
oo
k v
alu
e o
f e
qu
ity
2000 2005 2010 2015Year
international domestic
1.2
1.3
1.4
1.5
1.6
Ba
nk
z-s
co
re
2000 2005 2010 2015Year
international domestic

41
Figure 7. NPL ratio for international and domestic banks
Note: This figure displays yearly means of the NPL ratio during 2000-2015 for international banks and domestic banks by blue and red lines, respectively. NPL ratio is log of ratio of non-performing loans to gross loans + 1
Figure 8. ROA for international and domestic banks
Note: This figure displays yearly means of ROA during 2000-2015 for international banks and domestic banks by blue and red lines, respectively ROA is the return on average assets.
.00
5.0
1.0
15
.02
.02
5Im
pa
ire
d l
oa
ns
to
gro
ss
lo
an
s
2000 2005 2010 2015Year
international domestic
0.0
05
.01
.01
5R
etu
rn o
n a
ss
ets
2000 2005 2010 2015Year
international domestic

42
Figure 9. ROE for international and domestic banks
Note: This figure displays yearly means of ROE for international banks and domestic banks during 2000-2015 by blue and red lines, respectively ROE is ratio of equity to total assets
Figure 10. Change in bank lending associated with a 1% increase in GDP growth
Note: The figure shows marginal effects from regression 6 in Table 7 of bank lending on GDP per capita growth and a number of control variables and bank fixed effects. International bank values are evaluated at the average level of internationalization, here log of the number of countries in which the international bank is active. The coefficients are significant at the 10 percent significance level or better.
0.0
5.1
.15
.2R
etu
rn o
n e
qu
ity
2000 2005 2010 2015Year
international domestic