ARE CANADIAN KIDS TOO TIRED TO MOVE? · Clearly, as children and youth move more and more...
76
2016 The ParticipACTION Report Card on Physical Activity for Children and Youth ARE CANADIAN KIDS TOO TIRED TO MOVE?
Transcript of ARE CANADIAN KIDS TOO TIRED TO MOVE? · Clearly, as children and youth move more and more...
2016The ParticipACTION Report Card on Physical Activity for Children and Youth
ARE CANADIAN KIDS TOO TIRED TO MOVE?

The ParticipACTION Report Card on Physical Activity for Children and Youth is the mostcomprehensive assessment of child and youth physical activity in Canada. The Report Card synthesizes data from multiple sources, including the best available peer-reviewed research, to assign evidence-informed grades across 12 indicators. Over the years, the Report Card has been replicated in numerous cities, provinces and countries, where it has served as a blueprint for collecting and sharing knowledge about the physical activity of young people around the world.
This Report Card includes new Canadian 24-Hour Movement Guidelines for Children and Youth: An Integration of Physical Activity, Sedentary Behaviour, and Sleep – the first of their kind in the world – and, for the first time, assigns a Sleep grade.
ParticipACTION’s strategic partner, the Healthy Active Living and Obesity Research Group at the Children’s Hospital of Eastern Ontario Research Institute (HALO-CHEO), played a critical role in the research and development of the 2016 Report Card:
Production of the Report Card is possible through funding from:
Additional support is provided by provincial and territorial governments through the Interprovincial Sport and Recreation Council (ISRC).
The 2016 Report Card is available for reproduction provided the following copyright acknowledgement is included:
Information has been provided from The 2016 ParticipACTION Report Card on Physical Activity for Children and Youth with permission from ParticipACTION.
Please use the following citation:
ParticipACTION. Are Canadian kids too tired to move? The 2016 ParticipACTION Report Card on Physical Activity for Children and Youth. Toronto: ParticipACTION; 2016.
The 2016 Report Card and a summary of its findings (the Highlight Report) are available online at www.participACTION.com/reportcard.
Help Us Do Our Job BetterThe Report Card is based on the best available physical activity data (for the most part from the previous calendar year, and from earlier years where appropriate). If you have data that could inform future grades for one or more indicators, please contact ParticipACTION ([email protected]).
The 2016 ParticipACTION Report Card on Physical Activity for Children and Youth
ParticipACTION Report Card on Physical Activity for Children and Youth 2

Contents4 Report Card Development Team 5 Indicators & Grades 6 Why is Physical Activity Important? 7 It’s Time for a Wake-up Call 9 Canadian 24-Hour Movement Guidelines for Children and Youth:
An Integration of Physical Activity, Sedentary Behaviour, and Sleep
11 Indicators: Daily Behaviours12 Overall Physical Activity 16 Organized Sport & Physical Activity Participation 20 Active Play 24 Active Transportation 29 Physical Literacy 33 Sleep 37 Sedentary Behaviours
42 Indicators: Settings & Sources of Influence43 Family & Peers 48 School 53 Community & Environment
58 Indicators: Strategies & Investments59 Government 65 Non-Government
69 Abbreviations 70 Summary of Indicators 71 Methodology & Data Sources 72 Partners 72 References
ParticipACTION Report Card on Physical Activity for Children and Youth 3

Report Card Development TeamDate of PublicationJune 16, 2016
Report Card Chief Scientific OfficerDr. Mark Tremblay
Research Manager and Lead AuthorJoel Barnes
Highlight Report WriterKatherine Janson
Project ManagementDr. Allana LeBlancBrett Bartlett
Marketing and CommunicationsRebecca Jones
Design and ProductionHambly & Woolley Inc.
Public RelationsKatherine JansonHill + Knowlton Strategies
Copy EditingRuth HanleyDr. Geneviève Leduc
Translation ServicesJohanne Tousignant(Stratégie Rédaction)
Report Card Research CommitteeDr. Christine CameronDr. Valerie CarsonDr. Jean-Philippe ChaputDr. Guy FaulknerDr. Ian JanssenRoger KramersDr. John C. SpenceDr. Brian Timmons
Research and Content Development TeamStacey Alpous Salomé AubertBrett BartlettKevin BelangerDr. Jean-Philippe ChaputCaroline DutilDr. Zach FerraroKimberly GrattanDr. Katie GunnellJustin LangDr. Richard LaroucheDr. Allana LeBlancDr. Geneviève LeducTaru ManyangaDr. Veronica PoitrasGreg TraversyDarcie Valois
ParticipACTION Report Card on Physical Activity for Children and Youth 4

Letter grades are based on an examination of current data for each indicator against a benchmark along with an assessment of trends over time, and the presence of disparities (e.g., age, gender, disability, ethnicity, socioeconomic status). Together, the indicators provide a complete and robust assessment of how we are doing as a country in promoting and facilitating physical activity among Canadian children and youth.
Indicators & GradesGrades are common to every report card. The 2016 Report Card assigns letter grades to 12 different indicators that are grouped into three categories (Figure 1): Strategies & Investments (Government, Non-Government), Settings & Sources of Influence (Family & Peers, School, Community & Environment), and the Daily Behaviours (Overall Physical Activity, Organized Sport & Physical Activity Participation, Active Play, Active Transportation, Sleep, Sedentary Behaviours).
A CHILD’S OVERALL PHYSICAL ACTIVITY IS LINKED TO PHYSICAL AND MENTAL HEALTH, MAINTENANCE OF A HEALTHY BODY WEIGHT, ACADEMIC PERFORMANCE, MOTOR SKILL DEVELOPMENT & PHYSICAL LITERACY, AMONG OTHER BENEFITS.
Strategies & Investments
Settings & Sources of Influence
Daily Behaviours
SchoolFamily & Peers Community & Environment
Government Non-Government
Figure 1. Summary of the 2016 Report Card indicators.
Active Transportation
Behaviours that contribute to overall physical activity
Active Play Physical Activity
Sleep
Sedentary Behaviour
Organized Sport
ParticipACTION Report Card on Physical Activity for Children and Youth 5

Why is Physical Activity Important?For health benefits, it is recommended that children and youth get at least 60 minutes of moderate- to vigorous-intensity physical activity (MVPA) every day.1 On at least three days of each week, physical activity should include muscle- and bone-strengthening activities.1 As the Report Card has shown year over year since 2011, very few children and youth in Canada meet this recommendation.2 This continues to push researchers to explore the importance of all movement behaviours in order to better understand the benefits of physical activity, and the health risks and consequences of physical inactivity.
An example of recent research that continues to highlight the health benefits of physical activity is an international study of more than 6,000 children from 12 different countries, including both developed and developing countries. This study showed that 9- to 11-year-olds who get at least 55 minutes of MVPA per day are less likely to have obesity than their less active peers.3 The study also reveals that the odds of having obesity increase substantially in both boys and girls for every 25-minute decrease in daily MVPA.4 Other recent research has reported similar results.5,6
The benefits of physical activity for mental health also continue to be understood and recognized. Research shows a link between higher levels of physical activity in children and youth and lower levels of anxiety and depression.7-9 A recent study of older youth and adults from 15 countries in Europe reveals that as self-reported physical activity increases, levels of self-reported happiness also increase.10 As well, a positive link between physical activity and academic performance continues to be seen.11 Students in grades 4 to 6 from 18 schools in rural Nova Scotia who had lower levels of physical activity were more likely to have lower scores in mathematics and English language arts.12 See The Effect of Physical Activity and Sedentary Behaviour on Brain Health and Development on page 14 for a more detailed look at the importance of physical activity to brain health.
Clearly, as children and youth move more and more throughout the day, health benefits increase.13 Given the current low levels of physical activity in Canadian children and youth, thoughtful and consistent physical activity promotion efforts are needed. Where successful, these efforts will most likely be met with numerous physical and mental health benefits for our children and youth.
ParticipACTION Report Card on Physical Activity for Children and Youth 6

Canadian kids are inactive and they may be losing sleep over it.If you think kids can get a little physical activity and then play video games into the wee hours, yet remain healthy, you’re in for a rude awakening. Emerging research, which spurred Canada to develop the world’s first 24-Hour Movement Guidelines, shows that physical activity, sedentary behaviour – and sleep – are closely interrelated.
Kids who are tired out from running around sleep better, and those who have slept well have more energy to run around.27 And society is starting to pay attention to the fact that the reverse is also true and troubling: kids aren’t moving enough to be tired, and they may also be too tired to move. A groundswell of interest in the connection between these behaviours is highlighting the fact that sleep deprivation is a problem in Canadian kids:
� Only 9% of Canadian kids aged 5 to 17 get the 60 minutes of heart-pumping activity they need each day.2012-13 CHMS
� Only 24% of 5- to 17-year-olds meet the Canadian Sedentary Behaviour Guidelines recommendation of no more than 2 hours of recreational screen time per day.2012-13 CHMS
� In recent decades, children’s sleep duration has decreased by about 30 to 60 minutes.14,15
� Every hour kids spend in sedentary activities delays their bedtime by 3 minutes.16 And the average 5- to 17-year-old Canadian spends 8.5 hours being sedentary each day at least some of the time.2012-13 CHMS
� 33% of Canadian children aged 5 to 13, and 45% of youth aged 14 to 17, have trouble falling asleep or staying asleep at least some of the time.2012-13 CHMS
� 36% of 14- to 17-year-olds find it difficult to stay awake during the day at least sometimes.2012-13 CHMS
� 31% of school-aged kids and 26% of adolescents in Canada are sleep-deprived.17
Even kids who are meeting the minimum requirements for sleep duration are not necessarily getting good sleep. Increased screen time and packed schedules mean that kids are getting poor or inconsistent sleep – for instance, staying up late to do homework during the week, or watching TV in their bedrooms until midnight and then playing catch-up on the weekends.
� 43% of 16- to 17-year-old Canadians are not getting enough sleep on weekdays.17
The perils of a sleep-deprived generation are not limited to kids being tired and cranky; they show their fatigue in different ways.18 Some effects of sleep deprivation in kids are obvious and some are not so obvious:
� Too little sleep can cause hyperactivity, impulsiveness and a short attention span.19,20
� Children with reduced sleep are more likely to struggle with verbal creativity and problem solving, and generally score lower on IQ tests.20,21
� A short sleep duration produces adverse hormonal changes like those associated with increased risks of obesity, diabetes and hypertension.20
IT’S TIME FOR A WAKE-UP CALL
ParticipACTION Report Card on Physical Activity for Children and Youth 7

� Chronic sleep loss is linked to higher rates of depression and suicidal thoughts.22,23
And it’s a vicious cycle: a study of Toronto kids aged 10 to 12 years showed that those who slept the least on school nights were significantly less active and more sedentary than those who slept the most.24
The good news is that regular, heart-pumping physical activity might just be the best sleep aid there is:
� Grade 5 students with higher physical activity levels are less likely to be sleepy during the daytime.25
� Active transportation (e.g., walking or biking) and outdoor play increase exposure to sunlight, which helps regulate sleep patterns.18
� Physical activity helps kids fall asleep faster.26
� High school students who get at least 60 minutes of physical activity each day are 41% more likely to get sufficient sleep than those who don’t.27
Our tendency may be to cram more into each day to wear kids out, but more activities don’t necessarily equal more physical activity. Plus, overscheduling can impact sleep by getting kids excited and pushing back dinnertime, homework time and bedtime.28 As stated in the new Canadian 24-Hour Movement Guidelines for Children and Youth (page 9), a healthy childhood requires a balance of physical activity, sedentary behaviour and sleep. The health benefits that come with heart-pumping physical activity are reduced if children have poor sleep habits or engage in excessive sedentary behaviour. And well-rested children are not healthy if they are not getting enough activity.
To stem the creeping “sleepidemic,” kids need to get off the couch, get outdoors and get their hearts pumping regularly. It’s time for a wake-up call. If Canadian kids sit less and move more, we will all sleep better.
ParticipACTION Report Card on Physical Activity for Children and Youth 8

CANADIAN 24-HOUR MOVEMENT GUIDELINES FOR CHILDREN AND YOUTH:An Integration of Physical Activity, Sedentary Behaviour, and Sleep
PREAMBLEThese guidelines are relevant to apparently healthy children and youth (aged 5–17 years) irrespective of
gender, race, ethnicity, or the socio-economic status of the family. Children and youth are encouraged to live
an active lifestyle with a daily balance of sleep, sedentary behaviours, and physical activities that supports their
healthy development.
Children and youth should practice healthy sleep hygiene (habits and practices that are conducive to sleeping
well), limit sedentary behaviours (especially screen time), and participate in a range of physical activities in a
variety of environments (e.g., home/school/community; indoors/outdoors; land/water; summer/winter) and
contexts (e.g., play, recreation, sport, active transportation, hobbies, and chores).
For those not currently meeting these 24-hour movement guidelines, a progressive adjustment toward them
is recommended. Following these guidelines is associated with better body composition, cardiorespiratory
and musculoskeletal fitness, academic achievement and cognition, emotional regulation, pro-social behaviours,
cardiovascular and metabolic health, and overall quality of life. The benefits of following these guidelines far
exceed potential risks.
These guidelines may be appropriate for children and youth with a disability or medical condition; however, a
health professional should be consulted for additional guidance.
The specific guidelines and more details on the background research informing them, their interpretation,
guidance on how to achieve them, and recommendations for research and surveillance are available at
www.csep.ca/guidelines.
ParticipACTION Report Card on Physical Activity for Children and Youth 9

MODERATE TO VIGOROUS PHYSICAL ACTIVITY
An accumulation of at least 60 minutes per day of moderate to vigorous physical activity involving a variety of aerobic activities. Vigorous physical activities, and muscle and bone strengthening activities should each be incorporated at least 3 days per week;
GUIDELINESFor optimal health benefits, children and youth (aged 5–17 years) should achieve high levels of physical activity, low levels of sedentary behaviour, and sufficient sleep each day.
A healthy 24 hours includes:
Preserving sufficient sleep, trading indoor time for outdoor time, and replacing sedentary behaviours and light physical activity with additional moderate to vigorous physical activity can provide greater health benefits.
SWEATLIGHT PHYSICAL ACTIVITY
Several hours of a variety of structured and unstructured light physical activities;
STEPSLEEP
Uninterrupted 9 to 11 hours of sleep per night for those aged 5–13 years and 8 to 10 hours per night for those aged 14–17 years, with consistent bed and wake-up times;
SLEEPSEDENTARY BEHAVIOUR
No more than 2 hours per day of recreational screen time;
Limited sitting for extended periods.
SIT
Figure 2. Canadian 24-Hour Movement Guidelines for Children and Youth: An Integration of Physical Activity, Sedentary Behaviour, and Sleep.
ParticipACTION Report Card on Physical Activity for Children and Youth 10

INDICATORS:Daily Behaviours
9% of 5- to 17-year-olds accumulate at least 60 minutes of moderate- to vigorous- intensity physical activity per day.2012-13 CHMS
ParticipACTION Report Card on Physical Activity for Children and Youth 11

D-Overall Physical ActivityThis year’s grade remains a D- for the fourth year in a row. The grade reflects the balance between one age group that is doing well (3- to 4-year-olds) and two age groups that are doing poorly (5- to 11-year-olds and 12- to 17-year-olds). Most school-aged children and youth in Canada are not meeting the moderate- to vigorous-intensity physical activity (MVPA) recommendation within the Canadian 24-Hour Movement Guidelines for Children and Youth. Conversely, most preschool-aged children in Canada (3- to 4-year-olds) are meeting the physical activity recommendations for this age group, which recommend 180 minutes of daily activity at any intensity.
YEAR 2005 2006 2007 2008 2009 2010 2011 2012 2013 2014 2015 2016
D D F F F F F F D- D- D- D-GRADE
BENCHMARK A 81-100% B 61-80% C 41-60% D 21-40% F 0-20%
� Percentage of children and youth who meet the MVPA recommendation within the Canadian 24-Hour Movement Guidelines for Children and Youth (at least 60 minutes of daily MVPA).
� Percentage of preschoolers who meet the Canadian Physical Activity Guidelines for the Early Years (at least 180 minutes of physical activity at any intensity every day).
ParticipACTION Report Card on Physical Activity for Children and Youth 12

Overall Physical Activity
Key Findings� Approximately 7% of 5- to 19-year-olds in
Canada take at least 12,000 steps on every day of the week, which approximates the physical activity recommendations in the Canadian 24-Hour Movement Guidelines for Children and Youth, which recommend at least 60 minutes of MVPA per day (2012-14 Canadian Physical Activity Levels Among Youth study [CANPLAY], Canadian Fitness and Lifestyle Research Institute [CFLRI]).
� 20% of 11- to 15-year-olds in Canada report at least 60 minutes of MVPA on all seven days of the week (2013-14 Health Behaviour in School-Aged Children [HBSC]).
� 8% of 8- to 12-year-olds in Canada take at least 12,000 steps on every day of the week, which approximates the physical activity recommendations in the Canadian 24-Hour Movement Guidelines for Children and Youth (2011-16 Canadian Assessment of Physical Literacy, Healthy Active Living and Obesity Research Group). Among this sample of children, 31% report at least 60 minutes of MVPA on all seven days of the week.
� 70% of 3- to 4-year-olds meet the daily recommendation of at least 180 minutes of physical activity at any intensity (2012-13 Canadian Health Measures Survey [CHMS], Statistics Canada).
� 9% of 5- to 17-year-olds (14% of 5- to 11-year-olds and 5% of 12- to 17-year-olds) accumulate at least 60 minutes of MVPA (2012-13 CHMS, Statistics Canada) on at least six days of the week. This percentage has remained stable since the 2007-09 CHMS, when 7% of 5- to 17-year-olds met the daily recommendation.29
� 65% of 12- to 17-year-old First Nations youth in on-reserve and northern communities in Canada report a daily average of at least 60 minutes of MVPA (2008-10 First Nations Regional Health Survey).30
Note: These findings should be interpreted with caution due to the self-report nature of the data. As suggested by the authors of the study, “Until [physical activity] is measured objectively in [First Nations] youth, true levels of daily [physical activity] will remain uncertain.”30
Research Gaps� More research is needed to determine what
impact there will be on behaviours of children and youth as the move is made to implement the 24-hour integrated movement guidelines.
� Interventions that will increase physical activity among children and youth need to be both effective and sustainable. Research is needed to ascertain which interventions would be most appropriate.
� Surveillance and national-level descriptive data based on adherence to the new 24-Hour Movement Guidelines are needed.
Recommendations� Widely disseminate the new 24-Hour Movement
Guidelines, and provide support for their implementation in different sectors and settings.
� Support children and youth in adding bouts of physical activity throughout their day – before, during and after school; in the evenings; and on the weekend. The majority of Canadian children and youth still need to make important changes in their routine physical activity patterns.
� Remove barriers for low-income families by ensuring there are simple and dignified ways to access programs (e.g., no proof of income needed, decrease in complicated paperwork).
ParticipACTION Report Card on Physical Activity for Children and Youth 13

Overall Physical Activity
In a recent review of more than 200 studies, some of which included children and youth, increasing physical activity was found to benefit brain health on three separate levels:38
Cellular level: Physical activity is associated with the development of new blood vessels and neurons, and with an increase in growth factors in the brain that help with the nervous system’s development, maintenance and plasticity (ability to change and adapt).
System level: Physical activity helps regulate stress responses in which the brain is involved. Physical activity also increases the size of parts of the brain that are important for learning and memory, and helps activate neural networks that are turned on during cognitive activities such as reading and processing math calculations.
Behavioural level: Physical activity is associated with improvements in IQ, academic achievement, executive function (e.g., remembering information, focusing, multi-tasking) and attention. Increased physical activity and reduced sedentary behaviour are associated with less depression, anxiety and psychological distress.
Overall, having a favourable movement profile – increasing physical activity and limiting sedentary time – offers many benefits that improve brain health and development. As little as 45 minutes of MVPA per week appears to be beneficial to brain health.40
Literature SynthesisThe data that inform the grade for this indicator relate to preschoolers and school-aged children. Research is also becoming available on the proportion of toddlers who meet the Canadian Physical Activity Guidelines for the Early Years, which recommend at least 180 minutes per day of physical activity at any intensity. In one small study in Toronto, 23% of toddlers (< 18 months of age) met the recommendations.31 Two other recent studies in Ontario and Alberta found that toddlers are getting very little MVPA: less than five minutes per waking hour.32,33 In one of these studies,33 MVPA was between one and four minutes per waking hour depending on the accelerometer cut-point or rule used to classify their movement. While one cut-point might classify movement within a 15-second period as light-intensity physical activity, another cut- point might classify the same movement as sedentary behaviour. This highlights one of the current challenges when measuring physical activity in children and youth.
The Effect of Physical Activity and Sedentary Behaviour on Brain Health and DevelopmentEmerging research highlights the importance of physical activity for healthy brain development, which can lead to improved learning and academic outcomes. For example, researchers have shown that children who are physically active for as little as 20 minutes daily have more active brains,34 better standardized test scores,35 and improved attention in the classroom.34 Additionally, grades 2 and 3 students who participated in math and spelling lessons that involved physical activity for two years made greater gains in mathematics and spelling compared to their peers who did not participate in physically active academic lessons.36 Preliminary evidence also suggests that physical activity may benefit cognitive development in early childhood (birth to 5 years of age).37 As well, researchers are beginning to recognize that excessive sedentary time negatively influences brain health and may even counteract the benefits of activity.38 Preliminary evidence from a recent systematic review suggests that reading is beneficial to cognitive development in early childhood (birth to 5 years of age), while screen time is not beneficial and may even be detrimental.39 These findings stress the importance of sufficient physical activity and limited sedentary time for healthy brain development.
ParticipACTION Report Card on Physical Activity for Children and Youth 14

Overall Physical Activity
Contributing Factors and DisparitiesThe CANPLAY study reveals that age- and gender-related disparities in physical activity among Canadian children and youth have not disappeared over the past eight years. From 2014 to 2015, average daily steps decreased with increasing age (12,303 steps per day in 5- to 10-year-olds vs. 10,762 steps per day in 11- to 14-year-olds vs. 9,667 steps per day in 15- to 19-year-olds). The difference between the younger and older age groups has been consistent year over year since the CANPLAY study began in 2005.
When considering gender-related disparities, a similar trend is evident. Boys generally take more daily steps than girls. From 2014 to 2015, boys took an average of 11,862 steps per day vs. 10,536 steps per day for girls (Figure 3). A national study by Statistics Canada lends further evidence to this gender disparity: in 5- to 17-year-olds in Canada, 13% of boys vs. 6% of girls get at least 60 minutes of daily MVPA on average.47 This disparity is also seen abroad.48 An international study of almost 30,000 children and youth from 10 different countries found that boys are more physically active at all ages.49
Physical Activity and Children/Youth Living with DisabilitiesResearch generally shows that children and youth with disabilities participate in recreational and leisure activities at lower rates than their peers without disabilities,41-44 and that these participation rates are lower with increasing age.41 A study of children with autism spectrum disorder, for example, found that only 12% were physically active, pursuing mostly solitary forms of play.45 However, in a recent study of preschoolers with congenital heart disease, their physical activity levels were comparable to preschoolers without cardiac disease.46 Physical activity programs and opportunities tailored to the age and specific needs/preferences of children and youth with disabilities are needed.
In 2015, the Canadian Disability Participation Project released the Physical Activity, Active Living, and Sport Resource Catalogue, which provides online resources for Canadians living with disabilities. The catalogue is intended to be a living document where people and organizations can submit resources. The catalogue can be downloaded at cdpp.ca/resources-and-publications/physical-activity-active-living-and-sport-resource-catalogue. To learn how to have a resource added to the catalogue, please contact Robert Shaw ([email protected]).
0%2005-06 2006-07 2007-08 2009-102008-09 2010-11 2011-12 2012-14 2014-15
5%
10%
15%
20%
25%
Boys
Girls
Figure 3. Proportion of 5- to 19-year-olds in Canada with daily step counts that approximate the Canadian Physical Activity Guidelines, which recommend at least 60 minutes of MVPA per day, by year and gender (source: 2005-15 CANPLAY, CFLRI).
ParticipACTION Report Card on Physical Activity for Children and Youth 15

BOrganized Sport & Physical Activity ParticipationThis year’s grade is a slight improvement over last year’s grade due to new data that show an increase in sport participation by several percentage points, and which is significantly higher than the participation rate 10 years earlier.
YEAR 2005 2006 2007 2008 2009 2010 2011 2012 2013 2014 2015 2016
C+ C- C C C C C C C C+ B- B
BENCHMARK A 81-100% B 61-80% C 41-60% D 21-40% F 0-20%
� Percentage of children and youth who participate in organized sport and/or physical activity programs.
GRADE
ParticipACTION Report Card on Physical Activity for Children and Youth 16

Organized Sport & Physical Activity Participation
Key Findings� 76% of 11- to 15-year-olds in Canada report
that they currently participate in organized sports (2013-14 HBSC).
� According to parents, 77% of 5- to 19-year-olds in Canada participate in organized physical activities or sports (2014-15 CANPLAY, CFLRI). Participation rates in organized physical activities or sports are slightly higher compared to the earliest years of the CANPLAY study (2005 to 2007).
� According to parents, 47% of 5- to 19-year-olds in Canada participate in organized physical activities or sports during the afterschool period (2014-15 CANPLAY, CFLRI).
� 75% of families that have a child with a disability report that their child participates in organized sports (2014 CIBC – KidSportTM Report, CIBC and KidSportTM).50
� Just under 30% of 3- to 21-year-olds in Canada with severe developmental disabilities (e.g., moderate to severe intellectual disabilities, autism spectrum disorders, dual diagnosis, physical disabilities, genetic syndromes) play team sports.51
Research Gaps� Evidence suggests that children and youth
generally take 2 to 4 weeks to recover from sport-related concussions.52 Youth appear to require more time to become symptom free than do children.52 More research is needed on how to manage sport-related concussions in children and youth in order to facilitate complete recovery.53
� More effective monitoring of sport participation, across all levels of performance, is needed in Canadian children and youth.
� There is a need to better understand the physical activity participation of children with disabilities. The participation rates appear to be quite high, but this does not mean these children are doing the same volume as kids without disabilities.
Recommendations� Educate parents, coaches, officials and
participants on the principles of fair play according to the True Sport Principles (www.truesportpur.ca/true-sport-principles) and Canadian Sport 4 Life (www.canadiansportforlife.ca).
� Encourage program providers to develop strategies to counter the dropout rate in organized sport and physical activities among youth.
� Encourage program providers to make the development of physical literacy a priority within their program.
ParticipACTION Report Card on Physical Activity for Children and Youth 17

Literature SynthesisResearch continues to show many associated benefits with participation in organized sports. In a Montreal-based study that tracked youth sport participation throughout secondary school, those who consistently reported participating in school sports were more likely to report lower levels of depression and perceived stress, and higher self-rated mental health in early adulthood.54 Evidence also suggests that those who participate in organized sports spend more time in MVPA and are more likely to meet physical activity recommendations (≥ 60 minutes of daily MVPA).55
The relationship between organized sport participation and physical activity may vary depending on the sport and the frequency of participation. For example, in a recent study of children from Denmark, those who participated in sports got between five and 20 more minutes of daily MVPA when compared to those who did not participate in organized sports, and were between three and 15 times more likely to meet physical activity recommendations depending on the type of sport and frequency of participation;56 those who participated in soccer at least once per week accumulated more daily MVPA and were more likely to meet physical activity recommendations than those who did not participate in organized sports. However, children who participated in handball had increased levels of daily MVPA only if they participated in at least two sessions per week. Further, they had to participate in handball at least three times per week to be more likely to meet physical activity recommendations compared to children who did not participate in organized sports. Children participating in gymnastics, basketball or volleyball were not more likely to meet physical activity recommendations.56
Organized Sport & Physical Activity Participation
Tracking Sport Participation from Childhood into AdulthoodA couple of longitudinal studies that tracked sport participation from childhood through to adulthood have been published recently. One of the studies, which was based in the United States, tracked children between ages 5 and 19 years (1998 to 2013).57 Over the years, those who consistently did not participate in sports were never classified as being consistently physically active (approximately 45 minutes of daily MVPA). Further, those who were consistently involved in sports, or who had been involved in sports but dropped out, were never classified over the years as consistently inactive.57 The other study, out of Great Britain, revealed that children who reported frequent participation in sports at 10 years of age were more likely to be physically active and to participate in sports at 42 years of age.58 These results provide some evidence that sport participation in childhood may protect against a physically inactive lifestyle and may put children on a trajectory that is associated with more physical activity in adulthood.
Figure 4. Prevalence of participation in organized sports among 11- to 15-year-olds in Canada who participate in organized sport, by sport type (source: 2013-14 HBSC).
Team sport only
Individual sport only
Team and individual sport
46% 36%
18%
ParticipACTION Report Card on Physical Activity for Children and Youth 18

Organized Sport & Physical Activity Participation
Contributing Factors and Disparities Based on new data from the 2014-15 CANPLAY study, age and socioeconomic factors continue to explain some differences in participation rates for organized physical activities or sports. For example, in Canada 15- to 19-year-olds are least likely to participate in organized physical activities or sports compared to 5- to 10-year-olds and 11- to 14-year-olds. Higher participation rates are also seen in children and youth who have parents with the highest incomes or with a post-secondary education.59 Studies outside of Canada confirm these disparities.60,61
ParticipACTION Report Card on Physical Activity for Children and Youth 19

Active PlayThis year’s grade is a D+. New data that match the benchmarks for this indicator have allowed us to grade this indicator for the first time since 2012. These new data reveal that about a third of children and youth are playing outdoors for several hours per day. It should be noted that the target of several hours of active play per day is relatively arbitrary and further research is required to establish a benchmark that is linked to health outcomes.
YEAR 2005 2006 2007 2008 2009 2010 2011 2012 2013 2014 2015 2016
- - - INC INC F F F INC INC INC D+
BENCHMARKS A 81-100% B 61-80% C 41-60% D 21-40% F 0-20%
� Percentage of children and youth who engage in unstructured/unorganized active play for several hours a day.
� Percentage of children and youth who report being outdoors for several hours a day.
D+
GRADE
ParticipACTION Report Card on Physical Activity for Children and Youth 20

Active Play
Key Findings� 37% of 11- to 15-year-olds in Canada report playing
outdoors for several hours a day (> 2 hours) outside of school hours (2013-14 HBSC).
� 11- to 15-year-olds in Canada spend an average of 37 minutes per day playing active video games. This is far less than the average of 2 hours and 24 minutes per day they spend playing sedentary video games (2013-14 HBSC).
� According to parents, 75% of 5- to 19-year-olds in Canada participate in unorganized physical activities or sports during the afterschool period (2014-15 CANPLAY, CFLRI).
� According to parents, 63% of 5- to 19-year-olds in Canada participate in outdoor play during the afterschool period (2014-15 CANPLAY, CFLRI).
� Canadian children and youth who participate in unorganized physical activities or sports during the afterschool period take approximately 2,200 more daily steps than those who do not participate (2014-15 CANPLAY, CFLRI). Those who play outdoors during the afterschool period take approximately 2,500 more daily steps on average than those who do not (2014-15 CANPLAY, CFLRI).
Research Gaps� More observational studies on play are
needed in order to understand what children and youth are doing, and how they are spending their time after school.
� Further research is required to identify an evidence-based benchmark for daily active play.
� There is a need for objective measures of active play to get a better sense of how much kids are actually doing. This sporadic and unorganized activity is more difficult to report on a questionnaire than other physical activity indicators.
� More research is needed on the relationship between active play and health to get a better understanding of how much active play is needed for good health.
Recommendations� Increase parents’ and caregivers’ awareness
and understanding of the benefits versus the risks of outdoor play.
� Encourage parents to ensure a balance between scheduled activities and free time during which children can engage in active play.
� Challenge municipal by-laws and school policies that restrict opportunities for active outdoor play.
ParticipACTION Report Card on Physical Activity for Children and Youth 21

Active Play
Are Parental Safety Concerns Reshaping Play?In a new cycle of the IKEA Play Report, parents from 12 countries around the world shared their memories of play when they were children. Some of their happiest memories involved active outdoor play (e.g., playing in the woods near home, running around with friends until sunset, playing hide and seek with friends).70 What is concerning, however, is that modern parental safety concerns may be reshaping play in a way that is harmful to children and youth. For example, 51% of parents with 0- to 18-year-olds say they would like their children to be able to play more outdoors but are too worried about their safety.70 This represents an increase from 39% in the 2009 cycle of the IKEA Play Report.70 39% of parents agree they are “fearful of strangers and this stops [them from] letting [their] children go out to play/hang out with their friends,” which is an increase from 30% in 2009.70 Screens and gaming consoles may also be reshaping play into more sedentary forms given that 7- to 12-year-olds and 13- to 18-year-olds have, on average, access to 1.5 and 2.2 media devices respectively.70 Further, approximately half of parents believe that play can include tablets, smartphones or computers.70 The proportion of children and youth who agree with this is a little less than half.70 For more information on parental safety concerns and screen time, see Sedentary Behaviours on page 37 and Community & Environment on page 53.
Literature SynthesisAlthough there is no universally accepted definition of play due to its complexity,62 active play is often described as a pursuit that has no defined outcome or purpose but that provides children with numerous learning opportunities and a context to be physically active while having fun.63 When children are engaged in active play, they are generally moving at an intensity that is above resting and sedentary levels, and they are doing so freely and often without the direct guidance or supervision of adults.64 An additional 49 calories can be expended per day by replacing a single hour of screen time with active play.65 Canadian children and youth who play outdoors during the afterschool period take approximately 2,500 more daily steps on average than those who do not play outdoors (2014-15 CANPLAY, CFLRI).
The benefits of active play extend beyond the positive impact on energy expenditure.66 For example, outdoor play has been linked to improved social relationships (e.g., ability to develop and sustain friendships, to co-operate, to lead and to follow) and emotional well-being (e.g., minimized anxiety, depression and aggression; increased happiness).67 Further, natural play spaces and natural elements in children’s play spaces can provide physical and cognitive challenges that are important for health and development, such as helping children develop motor skills and learn about their own potential, how to navigate the environment, and how to problem-solve and manage risks in other settings.66 Accordingly, active play can contribute to improved physical, emotional, social and cognitive development.68,69
Figure 5. Proportion of 11- to 15-year-olds in Canada who report meeting various cut-points for active outdoor play, overall and by gender (source: 2013-14 HBSC).
Boys
Girls
Total
≥ 1 Hour/day ≥ 2 Hour/day ≥ 3 Hour/day ≥ 4 Hour/day
62%
42%
25%
15%
66%
47%
29%
19%
59%
38%
21%
12%
ParticipACTION Report Card on Physical Activity for Children and Youth 22

Active Play
Contributing Factors and DisparitiesAmong Canadian children and youth, the proportion participating in unorganized physical activities or sports during the afterschool period is greater in boys than girls (78% vs. 72%) and generally decreases with age (87% of 5- to 10-year-olds vs. 60% of 15- to 19-year-olds) (2014-15 CANPLAY, CFLRI). The same trend is seen in outdoor play during the afterschool period (2014-15 CANPLAY, CFLRI). A couple of recent studies abroad also identify lower levels of active outdoor play among children of ethnic minorities, those from lower socioeconomic households and those from neighbourhoods with lower perceptions of social cohesion (connectedness to other groups).61,75
Supreme Court of British Columbia Rules That Permitting Kids to Play Grounders is Not Negligence The game “grounders” is a well-known version of tag that is frequently played by children on the playground.71 In the summer of 2009, an 11-year-old girl in British Columbia was attending a middle school day camp with other children her age. During free playtime, the children decided to play a game of grounders while supervised by a program assistant. During the game, the girl fell backwards from the play equipment and struck her head. Her mother sued the school district, arguing that it was negligent in permitting children to play this inherently dangerous game. The case went to the Supreme Court of British Columbia.72
In October 2015, the Supreme Court ruled that the school was not negligent in allowing children to play grounders because there is nothing inherently dangerous about the game. Although the judge sympathized with the parent, it was clear that the child’s injury was simply an unfortunate event because there was no evidence that she was pushed or touched prior to the fall. The girl admitted she had simply lost her footing while trying to evade the child who was “it.”
This ruling is encouraging and consistent with the Position Statement on Active Outdoor Play, which advises parents and guardians to recognize the difference between danger and risk, and to encourage risky outdoor play among kids without promoting activities where the risk is unreason-able or involves courting danger (e.g., skating on a half-frozen lake).73 For more information on the Position Statement, visit www.haloresearch.ca/outdoorplay.
2017 INTERNATIONAL PLAY CONFERENCE IN CALGARY
The City of Calgary will be hosting the International Play Conference in 2017, a meeting that takes place every three years.74 The conference is organized by the International Play Association (IPA), which is a non-governmental organization founded in 1961. The IPA’s purpose is to protect, preserve and promote the child’s right to play as a fundamental human right. The conference will bring together delegates from more than 50 countries to exchange ideas and inspire action about children’s play across many disciplines and sectors.
To learn more about the IPA and the upcoming conference, please visit ipaworld.org/conferences/ipas-20th-triennial-conference-in-canada.
ParticipACTION Report Card on Physical Activity for Children and Youth 23

Active TransportationThis year’s grade remains a D. New data continue to show that a low proportion of children and youth use active transportation to get to/from school.
YEAR 2005 2006 2007 2008 2009 2010 2011 2012 2013 2014 2015 2016
- D - D D D D D+ D D D D
BENCHMARK A 81-100% B 61-80% C 41-60% D 21-40% F 0-20%
� Percentage of children and youth who use active transportation to get to and from places (e.g., school, park, mall, friend’s house).
D
GRADE
ParticipACTION Report Card on Physical Activity for Children and Youth 24

Key Findings� 26% of 11- to 15-year-olds in Canada report using
active modes of transportation (24% walking, 2% biking) on the main part of their trip to school (2013-14 HBSC).
� Based on self-report data in 5- to 17-year-olds in Canada, 25% typically use active modes of transportation (e.g., walk, bike), 58% primarily use inactive modes (e.g., car, bus), and 17% use a combination of active and inactive modes of transportation to/from school (subsample of 2014-2015 Physical Activity Monitor [PAM], CFLRI).
Research Gaps� Research is needed on active transportation to/
from a broader range of destinations (e.g., parks, shops, sport fields).
� The factors associated with walking and biking need to be examined separately. Due to low bicycling rates in Canada (Figure 6), current studies tell us little about what might encourage more kids to cycle.76
� Further investigation is needed on how to increase children’s independent mobility as a strategy to promote active transportation and physical activity. Exploring how independent mobility also supports opportunities for active play is also recommended.
Recommendations� Implement traffic-calming measures, such as
speed bumps and narrower intersections, which can reduce vehicle speed and injury risk, and may facilitate active transportation.77-79 Such measures are particularly needed in low-income areas where more children walk or wheel to/from school.80,81
� Develop greater funding and multi-sectoral collaboration to support active school travel interventions such as walking school buses and school travel planning interventions.
� Develop bullying prevention efforts that address the school trip.82
� Employ more crossing guards.79,83
� Lower speed limits in school areas.84
� Consider the feasibility of active transportation when deciding where to build new schools.85
Active Transportation
ParticipACTION Report Card on Physical Activity for Children and Youth 25

Literature SynthesisAlthough a low proportion (25%) of Canadian children and youth actively commute to/from school, it is important to note that this proportion varies considerably when distance from school is taken into account. For example, most children (72%) who live within 1.6 km of their school walk to school.86 For more information on factors that influence the proportion of children and youth who actively commute to/from school, see Contributing Factors and Disparities below.
24% 25% 24%
21%
2%2%2%2%
28%
Active Transportation
Walking
Biking
Figure 6. Proportion of 11- to 15-year-olds in Canada who report using active transportation on the main part of their trip to school, by active transportation mode and grade (source: 2013-14 HBSC).
Grade 6 Grade 7 Grade 8 Grade 10Grade 9
4%
ParticipACTION Report Card on Physical Activity for Children and Youth 26

Active Transportation
Active Transportation InterventionsWalking school buses – where children walk in groups supervised by an adult – can increase active transportation and physical activity.96,97 However, their sustainability is often compromised by the reliance on parent volunteers.96 In Ottawa, the regularity and sustainability of walking school buses was increased by hiring adult leaders who are trained, insured and paid – just like school bus drivers and crossing guards (see www.ottawaschoolbus.ca/wsb).
Another promising intervention that is being carried out in a growing number of Canadian schools is school travel planning (see www.saferoutestoschool.ca), where a multidisciplinary committee is established to identify and implement strategies to promote active transportation based on the local school context. Large-scale studies show that school travel plans lead to an increase in active transportation,98-100 and a large decrease in pedestrian injuries has been found in New York City.101
TROTTIBUS
The Trottibus Walking School Bus of the Canadian Cancer Society (CCS) is a pedestrian bus that makes it possible for elementary school children to walk to school from home. The Trottibus Walking School Bus is safe and supervised. It uses trained volunteers to accompany the children; and there is a regular, planned route and scheduled stops.
The CCS offers free guidance to schools that want to put in place a Trottibus Walking School Bus. The CCS’s main role is to train people responsible for the project, provide them with all the tools necessary, and help them recruit volunteers (as needed). The materials required for the safety of the participants (vest for volunteers) are free. Some promotional tools and logistics can be ordered at a nominal cost.
For more information, visit www.trottibus.ca/en.
Benefits of Active TransportationActive travelers are more physically active than kids who are driven to school, not just during the trip to/from school but over the course of the entire day.86-92 Active travelers get as much as 45 additional minutes of MVPA per day.88 There is also evidence that kids who bike to/from school have greater cardiovascular fitness than those driven to/from school. A study of Canadian adolescents found that those who biked at least one hour per week had higher cardiovascular fitness, lower body mass index, lower waist circumference and a more favourable cholesterol profile than those who did not bike.89
Other benefits that active transportation may offer include the following:
� Children and parents who walk or wheel to/from school report more positive emotions during the school trip than those who travel by car.93
� Active travelers, especially girls, may have higher grades in school.94
� Reducing car trips can decrease emissions of exhaust gases, which increase the risk of cardiovascular and lung diseases.95
ParticipACTION Report Card on Physical Activity for Children and Youth 27
Active Transportation
INJURIES AND ACTIVE TRANSPORTATION
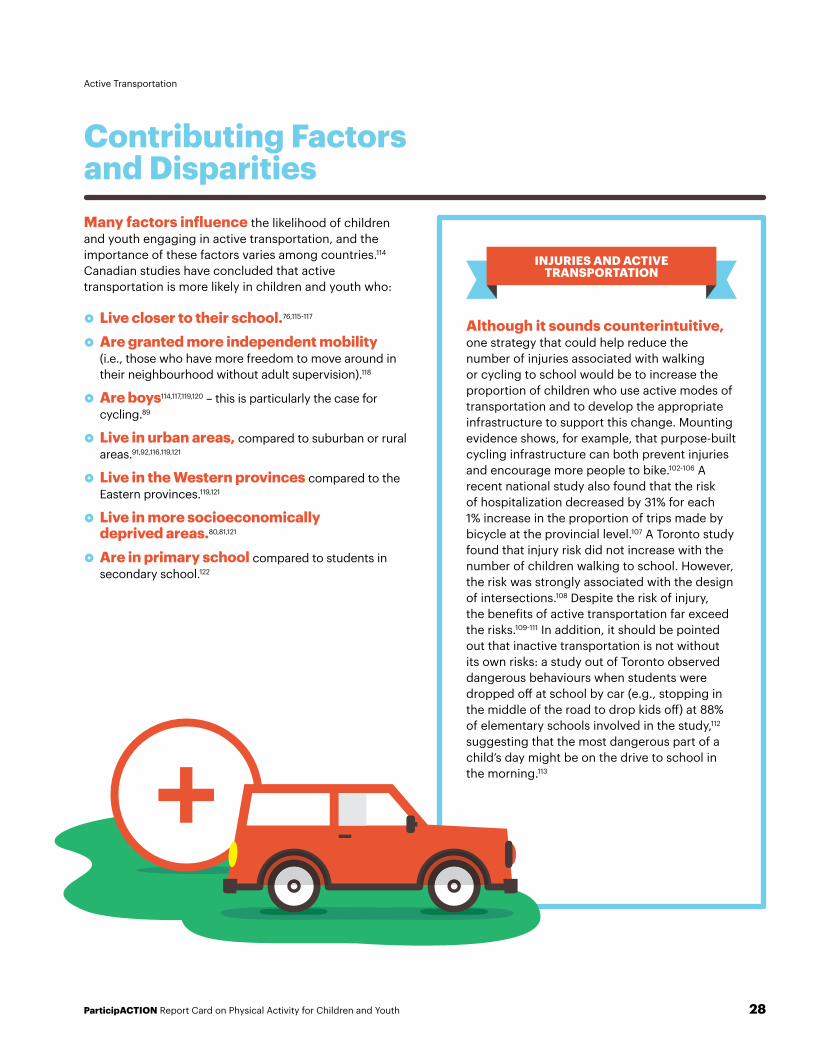
Although it sounds counterintuitive, one strategy that could help reduce the number of injuries associated with walking or cycling to school would be to increase the proportion of children who use active modes of transportation and to develop the appropriate infrastructure to support this change. Mounting evidence shows, for example, that purpose-built cycling infrastructure can both prevent injuries and encourage more people to bike.102-106 A recent national study also found that the risk of hospitalization decreased by 31% for each 1% increase in the proportion of trips made by bicycle at the provincial level.107 A Toronto study found that injury risk did not increase with the number of children walking to school. However, the risk was strongly associated with the design of intersections.108 Despite the risk of injury, the benefits of active transportation far exceed the risks.109-111 In addition, it should be pointed out that inactive transportation is not without its own risks: a study out of Toronto observed dangerous behaviours when students were dropped off at school by car (e.g., stopping in the middle of the road to drop kids off) at 88% of elementary schools involved in the study,112 suggesting that the most dangerous part of a child’s day might be on the drive to school in the morning.113
Contributing Factors and DisparitiesMany factors influence the likelihood of children and youth engaging in active transportation, and the importance of these factors varies among countries.114 Canadian studies have concluded that active transportation is more likely in children and youth who:
� Live closer to their school.76,115-117
� Are granted more independent mobility (i.e., those who have more freedom to move around in their neighbourhood without adult supervision).118
� Are boys114,117,119,120 – this is particularly the case for cycling.89
� Live in urban areas, compared to suburban or rural areas.91,92,116,119,121
� Live in the Western provinces compared to the Eastern provinces.119,121
� Live in more socioeconomically deprived areas.80,81,121
� Are in primary school compared to students in secondary school.122
ParticipACTION Report Card on Physical Activity for Children and Youth 28

Physical LiteracyThis is the first year the Physical Literacy indicator is being graded. The grade is a D+ because the available data suggest that slightly less than half of children in Canada are meeting the recommended levels for physical literacy. The presence of a gender disparity prevents the grade from entering the C range.
YEAR 2005 2006 2007 2008 2009 2010 2011 2012 2013 2014 2015 2016
- - - - - - - - - - INC D+
BENCHMARK A 81-100% B 61-80% C 41-60% D 21-40% F 0-20%
� Percentage of children and youth who meet the recommended levels of physical competence, knowledge, motivation and daily behaviours needed for a physically active lifestyle.
D+
GRADE
ParticipACTION Report Card on Physical Activity for Children and Youth 29

Physical Literacy
Key Findings� 44% of 8- to 12-year-old Canadians assessed by
the Canadian Assessment of Physical Literacy (CAPL) meet or exceed the minimum level recommended for physical literacy (2011-16 CAPL [CAPL], Healthy Active Living and Obesity Research Group [HALO]).
� 28% of 8- to 12-year-old Canadians assessed by the CAPL meet or exceed the minimum level recommended for the physical competence domain of physical literacy (2011-16 CAPL, HALO).
� 44% of 8- to 12-year-old Canadians assessed by the CAPL meet or exceed the minimum level recommended for the daily behaviour domain of physical literacy (2011-16 CAPL, HALO).
� 37% of 8- to 12-year-old Canadians assessed by the CAPL meet or exceed the minimum level recommended for the motivation and confidence domain of physical literacy (2011-15 CAPL, HALO).
� 62% of 8- to 12-year-old Canadians assessed by the CAPL meet or exceed the minimum level recommended for the knowledge and understanding domain of physical literacy (2011-16 CAPL, HALO).
Note: Due to limited availability of other datasets, only CAPL data was used to inform the grade. We will continue to work with other physical literacy assessment tool providers to include additional data in future Report Cards. If readers have access to physical literacy data that would inform this grade, please forward to ParticipACTION ([email protected]).
Research Gaps� More research is needed to determine how
to integrate different monitoring methods and/or underlying components to assess progress in physical literacy.123
� There is a need for research on the benefits associated with increased levels of physical literacy.123
� We need to learn more about the consequences of the growth of interest in physical literacy for physical education.
Recommendations� Widely communicate the commonly accepted
definition of physical literacy, in order to enhance the overall understanding of physical literacy and each of its elements.
� Based on the definition, create key messages written in plain language that describe physical literacy in the context of each sector and in a way that makes it understandable to leaders and the general public.
� Identify and share initiatives and strategies that develop all elements of physical literacy, not just fundamental movement skills.
ParticipACTION Report Card on Physical Activity for Children and Youth 30

Physical Literacy
� The Canadian Assessment for Physical Literacy (CAPL) (www.capl-ecsfp.ca), by the Healthy Active Living and Obesity Research Group, is a validated and reliable physical literacy assessment for 8- to 12-year-olds.126-128 The CAPL assessment examines the four components of physical literacy through daily behaviour (daily average step count, self-reported physical activity and sedentary time), physical competence (cardiovascular endurance, handgrip strength, flexibility, core strength, motor skills, body mass index percentile and waist circumference), knowledge and understanding, and motivation and confidence.
� The Fundamental Movement Skills (FMS) Assessment Tool (www.60minkidsclub.org), by 60 Minute Kids’ Club, is a tool that has resources to assess, show, teach and activate children’s fundamental movement skills.
The wide variety of physical literacy assessments shows the importance being placed on increasing children’s physical literacy in Canada. Increased physical literacy – or having the skills, behaviours, confidence and motivation, as well as the knowledge and understanding necessary to be physically active – can help place children in a better position to receive the many benefits of physical activity (see Why is Physical Activity Important? on page 6).124
Behaviours Linked with Increased Physical LiteracyA recently published study of 9- to 11-year-olds in Ottawa reveals a positive link between time spent outdoors on weekends and physical literacy scores as assessed by the CAPL.129 Active transportation to school is also related to higher physical literacy scores.129 The results are not conclusive, but provide some evidence that increasing outdoor time and active school transportation might be an effective strategy for increasing physical literacy in children.
Literature SynthesisPhysical literacy describes the skills that are necessary for a child to be physically active in multiple environments. It extends beyond an individual’s physical abilities to include their motivation, confidence, and knowledge and understanding toward physical activity.124,125 Physical literacy is important because it provides children with the building blocks to be physically active. For example, if children know how to throw a ball, they can play baseball; if they know how to kick a soccer ball, they can play soccer.
Physical Literacy Assessment ToolsAlong with a commonly accepted definition that is now being used to describe physical literacy in Canada (see Canada’s Physical Literacy Consensus Statement below), the following four assessment tools exist for assessing physical literacy and are widely used in Canada:
� Passport for Life (www.passportforlife.ca), by Physical Health and Education Canada, is an assessment that looks at the four components of physical literacy through active participation (self-reported physical activity), living skills (confidence and competence), fitness skills (cardiovascular endurance, core strength and dynamic balance) and movement skills (locomotor skills, upper limb movement, lower limb movement and balance).
� Physical Literacy Assessment for Youth (PLAY) (play.physicalliteracy.ca), by Canadian Sport for Life, is a series of assessment tools that can be used separately or in combination to determine the level of an individual’s physical literacy. The suite of PLAY tools include: PLAYfun (running, locomotor, object control–upper body, object control–lower body, balance, stability and body control), PLAYself (self-evaluation of environment, physical literacy self-description, relative ranking of literacies, and fitness), PLAYcoach (physical literacy visual analog scale, cognitive domain, environment, motor competence and fitness), PLAYparent (physical literacy visual analog scale, cognitive domain, environment, motor competence and fitness) and PLAYinventory (leisure-time activities that child has regularly participated in throughout the past year).
ParticipACTION Report Card on Physical Activity for Children and Youth 31

Physical Literacy
CANADA’S PHYSICAL LITERACY CONSENSUS STATEMENT
The current physical inactivity crisis in Canada highlights the need not only to promote physical activity but to teach children the basic skills needed to live a healthy active lifestyle. In an effort to address these basic movement skills, the concept of physical literacy has emerged and gained substantial popularity in Canada and around the world, leading to several differing definitions that have contributed to confusion around the meaning of the term. Consultation with stakeholders in Canada has revealed the need for a common definition with consistent language to facilitate the development of policy, practice and research related to physical literacy.
In 2014, a steering committee consisting of 10 physical literacy experts from seven organizations was tasked with harmonizing a Canadian definition of physical literacy. The result of this meeting was to adopt the International Physical Literacy Association’s definition, which was the result of a rigorous and systematic process involving stakeholders from around the world:130 “Physical literacy is the motivation, confidence, physical competence, knowledge and understanding to value and take responsibility for engagement in physical activities for life.”131
The steering committee also harmonized five core principles of physical literacy, and definitions for the four essential and interconnected elements of physical literacy: motivation and confidence; physical competence; knowledge and understanding; and engagement in physical activities for life. The resulting two-page consensus statement was sent out to stakeholders across Canada for feedback, and more than 1,300 responses were received. The final consensus statement was released at the Vancouver International Physical Literacy Conference in June 2015.132 View the Physical Literacy Consensus Statement at www.participaction.com/canadas-physical- literacy-consensus-statement.
RBC Learn to Play ProgramsIn 2014, the RBC Learn to Play Project provided 107 community action grants to support programming and 29 leadership grants to develop community level capacity. The grants supported collaborative efforts of over 450 organizations across Canada. Based on grantee reports received, 91% of grantees agreed that collaboration increased, 325 new partnerships were developed, 2,286 people were trained in program development/delivery, 8,878.5 hours of programming was delivered, and 61,401 children and youth participated. After attending training 88% of trainees had very high to excellent understanding of physical literacy (72% reported an increase) and 96% of trainees intended to apply what they learned. Before and after program surveys revealed significant improvements in competence and motivation among participants 2-24 years old and in confidence among participants 6-12 years old. Additionally, after programs, 77% of parents reported increased awareness of physical literacy. This represents two surveys, before and after program participation, that assesses self-report (parent or child respondent) confidence, competence, and motivation based on scales within the CS4L Play Tools, and a yes/no question asking parent respondents whether their awareness of physical literacy increased. Before and after data was not linked by respondent.
Contributing Factors and DisparitiesBased on data from more than 5,700 children aged 8 to 12 years from six provinces across Canada, a slightly higher proportion of boys (47%) meet the recommended levels for physical literacy compared to girls (41%) (2011-16 CAPL, HALO). When broken down by physical literacy domain, this gender disparity persists for physical competence (32% of boys vs. 23% of girls meet the recommended levels), daily behaviour (47% of boys vs. 41% of girls), and motivation and confidence (41% of boys vs. 32% of girls). For knowledge and understanding, however, the gender disparity is reversed: 64% of girls meet the recommended levels vs. 60% of boys.
ParticipACTION Report Card on Physical Activity for Children and Youth 32

SleepThe grade for this new indicator in the Report Card is a B because well over half of children and youth in Canada meet the new sleep recommendations in the Canadian 24-Hour Movement Guidelines for Children and Youth.
YEAR 2005 2006 2007 2008 2009 2010 2011 2012 2013 2014 2015 2016
- - - - - - - - - - - B
BENCHMARK A 81-100% B 61-80% C 41-60% D 21-40% F 0-20%
� Percentage of children and youth who meet the sleep recommendations in the Canadian 24-Hour Movement Guidelines (5- to 13-year-olds: 9-11 hours per night; 14- to 17-year-olds: 8-10 hours per night).133,134
B
GRADE
ParticipACTION Report Card on Physical Activity for Children and Youth 33

Sleep
Research Gaps� To better inform sleep recommendations,
there is a need for research involving sleep restriction/extension interventions that examine the changes in different outcome measures against various amounts of sleep. These studies will give a better sense of the dose-response relationship between sleep and different outcomes.
� More epidemiologic studies need to use an objective assessment of sleep (e.g., accelerometry/actigraphy) because time in bed does not necessarily reflect sleep duration.
� Beyond sleep quantity, more studies need to report on other important dimensions of sleep including quality, timing, consistency and continuity.
Recommendations� Encourage families to develop household
bedtime rules.
� Remove screens and media devices (e.g., cellphones, computers, TVs) from bedrooms.
� Delay school start times for adolescents – even by as little as 30 minutes – as a countermeasure to chronic sleep deprivation.
� We should all take sleep more seriously in our busy, work-obsessed society instead of viewing it as a waste of time.
Key Findings� 68% of 10- to 13-year-olds in Canada meet the
sleep recommendations for school-aged children (2013-14 HBSC).
� 72% of 14- to 17-year-olds in Canada meet the sleep recommendations for adolescents (2013-14 HBSC).
� 79% of 5- to 13-year-olds in Canada meet the sleep recommendations for school-aged children, which recommend sleeping between 9 and 11 hours per night (2012-13 CHMS, Statistics Canada).
� 68% of 14- to 17-year-olds in Canada meet the sleep recommendations for adolescents, which recommend sleeping between 8 and 10 hours per night (2012-13 CHMS, Statistics Canada).
� 43% of grades 9 to 12 students aged 17 years and younger in Ontario and Alberta meet the sleep recommendations for adolescents (2012-13 Cohort Study for Obesity, Marijuana Use, Physical Activity, Alcohol Use, Smoking and Sedentary Behaviour [COMPASS]).
� 33% and 45% of 5- to 13-year-olds and 14- to 17-year-olds in Canada, respectively, have trouble going to sleep or staying asleep at least some of the time (2012-13 CHMS, Statistics Canada).
� 96% and 83% of 6- to 13-year-olds and 14- to 17-year-olds in Canada, respectively, find their sleep refreshing at least some of the time (2012-13 CHMS, Statistics Canada).
� 12% of 5- to 13-year-olds and 36% of 14- to 17-year-olds in Canada, respectively, find it difficult to stay awake during their normal waking hours when they want to at least some of the time (2012-13 CHMS, Statistics Canada).
ParticipACTION Report Card on Physical Activity for Children and Youth 34

Sleep
Literature SynthesisSleep is an essential component of healthy development and is required for physical and mental health. Unfortunately, sleep deprivation has become common in contemporary societies with 24/7 availability of commodities and technologies. Children and youth generally sleep less now compared with decades ago;14,15 factors responsible for this decline in sleep duration over time are generally ascribed to the modern way of living (e.g., late-night screen time, caffeine use, no bedtime rules in the household). A growing body of evidence shows that chronic sleep deprivation poses a serious threat to the academic success, health and safety of children and youth, and is an important public health issue to that needs to be addressed.135,136 A recent systematic review including 592,215 children and youth from 40 different countries reported that short sleep duration was associated with excess body weight, poorer emotional regulation and academic achievement, and lower quality of life/well-being.137
In 2016, Canadian sleep duration recommendations have been issued for the first time.133 They recommend that to maximize overall health and well-being, school-aged children (aged 5-13 years) should sleep between 9-11 hours each night and that adolescents (ages 14-17 years) should sleep between 8-10 hours each night. Although the ideal amount of sleep per night may vary from one person to another, sleep duration recommendations play an important role in informing public policies, interventions, and parents and their children/youth of healthy sleep behaviours. It is, therefore, critical to continue promoting the importance of a good night’s sleep for the overall health of Canadian children and youth, and to take sleep more seriously.
It is also important to remember that sleep interacts with physical activity and sedentary behaviour; these three behaviours are not independent of each other. For example, being physically active on a regular basis can promote a good night’s sleep.138 Screen time has been shown to disrupt sleep139 and can displace physical activity for some people.140 Finally, insufficient sleep can reduce physical activity levels141 and is associated with more screen time in children.142 As a result of this, the Canadian 24-Hour Movement Guidelines for Children and Youth have been developed and released (see page 9). Public health messages should target all movement behaviours synergistically to optimize health of children and youth around the world.
ParticipACTION Report Card on Physical Activity for Children and Youth 35

Sleep
Contributing Factors and DisparitiesBased on CHMS and HBSC data, there is no significant difference in the proportion of boys and girls who meet the sleep recommendations. As it relates to trends over time, data from the United States reveal that declines in sleep duration over the past several years have been more pronounced in girls, racial/ethnic minorities and those from low socioeconomic backgrounds.14 Whether this is also the case in Canada is currently unclear.
Table 1. Sleep duration recommendations (source: Hirshkowitz et al.134).
AGE RECOMMENDATION (HOURS/NIGHT)
Newborns (0-3 months) 14 to 17
Infants (4-11 months) 12 to 15
Toddlers (1-2 years) 11 to 14
Preschoolers (3-4 years) 10 to 13
School-aged children (5-13 years) 9 to 11
Adolescents (14-17 years) 8 to 10
Go to bed and wake up at the same time every day (even on the weekends!)
Avoid caffeine consumption (e.g., coffee, soft drinks, chocolate) starting in the late afternoon
Expose yourself to bright light in the morning – sunlight helps the biological clock to reset itself each day
Make sure your bedroom is conducive to sleep – it should be dark, quiet, comfortable, and cool
Sleep on a comfortable mattress and pillow
Don’t go to bed feeling hungry, but also don’t eat a heavy meal right before bed
Develop a relaxing routine before bedtime – ideas include bathing, music, and reading
Reserve your bedroom for sleeping only – keep cell phones, computers, televisions and video games out of your bedroom
Exercise regularly during the day
Don’t have pets in your bedroom
GENERAL TIPS FOR HAVING HEALTHY SLEEP HYGIENE142
ParticipACTION Report Card on Physical Activity for Children and Youth 36

Sedentary BehavioursThis year’s grade returns to an F due to new data, which show that very few children and youth at any age are meeting the sedentary behaviour recommendations in the Canadian 24-Hour Movement Guidelines for Children and Youth.
YEAR 2005 2006 2007 2008 2009 2010 2011 2012 2013 2014 2015 2016
C- D- D- D F F F/INC*F/INC* F F D- F
BENCHMARK A 81-100% B 61-80% C 41-60% D 21-40% F 0-20%
� Percentage of children and youth who meet the Canadian Sedentary Behaviour Guidelines (3- to 4-year-olds: less than one hour of screen time per day; 5- to 17-year-olds: no more than two hours of screen time per day).
Note: The Guidelines currently provide a time limit recommendation for screen-related pursuits, but not for non-screen-related pursuits.
* In 2011 and 2012, there were two separate indicators: Screen-Based Sedentary Behaviours and Non-Screen Sedentary Behaviours. Following 2012, these indicators were collapsed into a single indicator.
F
GRADE
ParticipACTION Report Card on Physical Activity for Children and Youth 37

Sedentary Behaviours
Key Findings� 10% of 11- to 15-year-olds in Canada meet the
sedentary behaviour recommendations in the Canadian 24-Hour Movement Guidelines for Children and Youth, which recommend an average daily screen time of no more than 2 hours (2013-14 HBSC).
� 76% of 5- to 19-year-olds in Canada report watching television, playing computer or video games, or reading during the afterschool period (based on a subsample of the 2014-15 CANPLAY, CFLRI).
� 3% of students in grades 9 to 12 in Canada meet the sedentary behaviour recommendations in the Canadian 24-Hour Movement Guidelines for Children and Youth (2012-13 COMPASS study).143
� Students in grades 9 to 12 in Canada spend an average of 8.2 hours per day (494 minutes) in screen-based sedentary behaviour (2012-13 COMPASS study).143
� 15% of 3- to 4-year-olds in Canada meet the Canadian Sedentary Behaviour Guidelines for the Early Years, which recommend that daily screen time (i.e., use of computers, television, etc.) be limited to less than one hour (2012-13 CHMS, Statistics Canada).
� 24% of 5- to 17-year-olds in Canada (24% of 5- to 11-year-olds and 24% of 12- to 17-year-olds) meet the sedentary behaviour recommendations in the Canadian 24-Hour Movement Guidelines for Children and Youth, which recommend daily screen time of no more than 2 hours (2012-13 CHMS, Statistics Canada).
� According to parents in Ontario, boys and girls get 3.2 hours (193 minutes) and 2.6 hours (158 minutes) of daily screen time respectively (Public Health Ontario, 2015).144
Research Gaps� Research needs to better differentiate the
effects of screen-based vs. non-screen sedentary behaviours and their influence on health indicators.
� To better understand the impact of total sedentary time on health relative to the proportion of time spent in physical activity and sleep, novel analyses (such as compositional analyses) should be used.
� Monitors that capture posture should be used in research that is objectively measuring sedentary time to minimize misclassification between light physical activity and sedentary behaviour.
� Research on new screen time devices, such as tablets and smartphones, is needed to understand whether these devices are used primarily while seated and how the use of these new devices impact physical, social and mental health.
� Future research should account for multitasking of different types of sedentary behaviour.
Recommendations� Encourage families to develop household
rules around screen time.� Turn off the internet in the home at children’s
bedtime (or even earlier) from evening to morning.
� Remove screens and media devices (e.g., cellphones, computers, TVs) from bedrooms.
� Modeling is important – parents should set limits around their own screen time use and their children’s screen time use, and stick to it.
ParticipACTION Report Card on Physical Activity for Children and Youth 38
Sedentary Behaviours
Factors Associated with Greater Sedentary TimeIn light of new data that continue to reveal excessive amounts of daily sedentary time (> 8 hours per day) among children and youth both in Canada and abroad,143,149 it is important to understand the behaviours and other factors that are linked to sedentary time, if strategies that lead to their reduction are to be successful. Recent research suggests that having a screen in the bedroom (e.g., television, computer), not meeting physical activity recommendations of at least 60 minutes of daily MVPA, and being heavier are all associated with more daily sedentary time.149 However, the relationship between body weight and sedentary time may be more complex and nuanced than this. A recent comparison of normal-weight children and youth in Canada with their obese peers, for example, did not find any differences in sedentary time, which highlights the importance of targeting all children and youth –not just those with obesity – when implementing strategies to reduce sedentary behaviours.150 Another behaviour linked to sedentary time is sleep.151 Children who get less than 9 hours of sleep per night have greater daily sedentary time than children who get recommended amounts of sleep (9 to 11 hours per night).152 A similar link between sleep and sedentary time may also apply to 2- to 5-year-olds.153 For more information on sleep, read about our new Sleep indicator on page 33.
Literature SynthesisSedentary behaviours are not simply the lack of physical activity; they are separate and distinct from physical activity and refer to pursuits during waking hours that involve low energy expenditure and a sitting or reclining posture.145 Common sedentary behaviours include prolonged sitting – usually when engaged in screen-based pursuits (e.g., watching television, browsing the Internet, playing video games, staying connected via social media, doing homework on a computer) or while at school, reading a book, colouring, doing homework and traveling to/from school in a motorized vehicle. In recent years, there has been much research on sedentary behaviour research in children and youth, since sedentary behaviour is believed to be a potential risk factor for cardiometabolic diseases such as type 2 diabetes and coronary heart disease.146 Recent research is also uncovering a link between screen time and anxiety147 and depression15,148 in children and youth.
DON’T WALK IN THE HALLWAY!
In an effort to break up sedentary time and introduce more physical activity into the school day, Elm Street School in Medicine Hat, Alberta, has placed coloured squares on the floor of its main hallway as part of a pilot project through the YMCA to encourage students to engage in different movement behaviours (e.g., hopping, skipping, jumping) throughout the school day. To learn more about this pilot program, visit medicinehatnews.com/news/local-news/2016/ 01/06/pilot-program-at-elm-street-school- aims-to-pair-hallway-time-with-physical-activity.
ParticipACTION Report Card on Physical Activity for Children and Youth 39

Sedentary Behaviours
DOES STROLLER USE INCREASE SEDENTARY BEHAVIOUR IN
YOUNG CHILDREN?
A new study has found that the main reasons parents report using strollers include transportation, storage, leisure, supervision/confinement, parental physical activity and sleep.154 Three key benefits of stroller use, according to parents, are convenience, timeliness and the ability to travel a distance that would not otherwise be feasible.154 In some cases, parents view stroller use as facilitating sedentary time because the child would otherwise be walking or crawling if not immobilized in a stroller.154 In other instances, however, parents view stroller use as serving to decrease sedentary time and increase physical activity because the stroller is being used as a vehicle to take their child to a park for play, a destination the parent wouldn’t necessarily feel safe walking to without a stroller (e.g., due to busy streets or the lack of a sidewalk).154 This is a relatively new area of research and seems to suggest that stroller use is not straightforward. It is important to note, however, that the Canadian Sedentary Behaviour Guidelines for the Early Years recommend limiting prolonged sitting or restraint (e.g., strollers).155
ParticipACTION Report Card on Physical Activity for Children and Youth 40
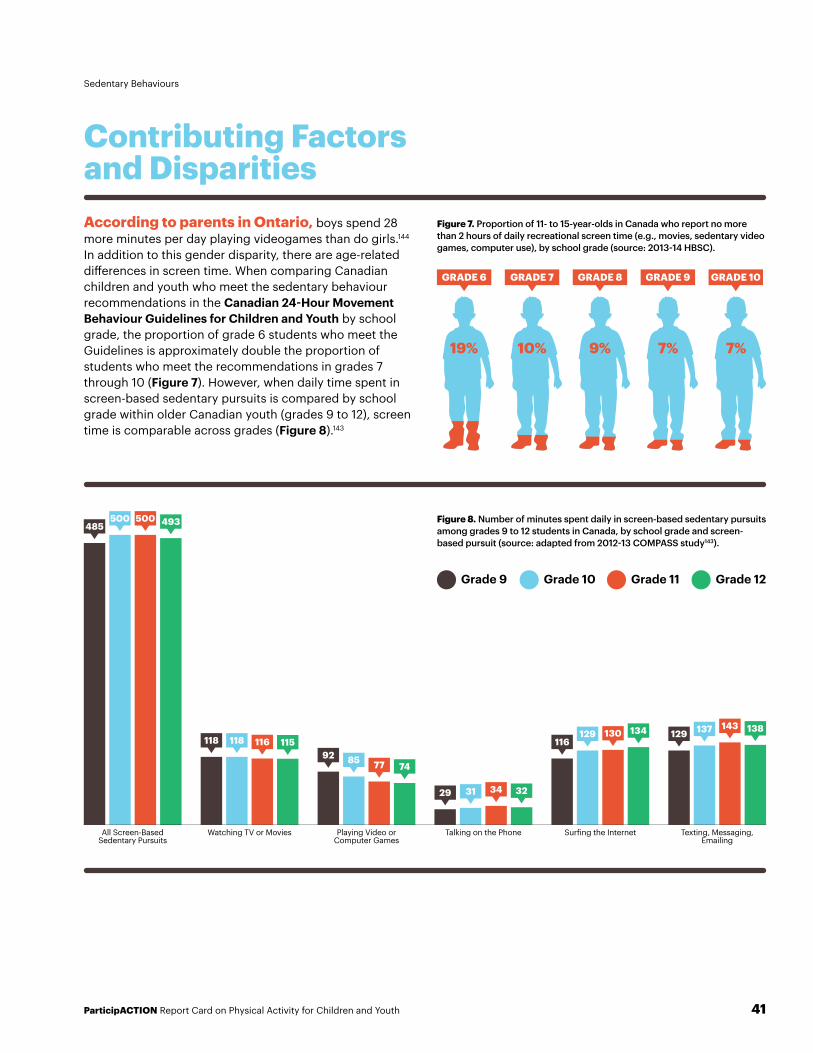
Sedentary Behaviours
Contributing Factors and DisparitiesAccording to parents in Ontario, boys spend 28 more minutes per day playing videogames than do girls.144 In addition to this gender disparity, there are age-related differences in screen time. When comparing Canadian children and youth who meet the sedentary behaviour recommendations in the Canadian 24-Hour Movement Behaviour Guidelines for Children and Youth by school grade, the proportion of grade 6 students who meet the Guidelines is approximately double the proportion of students who meet the recommendations in grades 7 through 10 (Figure 7). However, when daily time spent in screen-based sedentary pursuits is compared by school grade within older Canadian youth (grades 9 to 12), screen time is comparable across grades (Figure 8).143
Figure 7. Proportion of 11- to 15-year-olds in Canada who report no more than 2 hours of daily recreational screen time (e.g., movies, sedentary video games, computer use), by school grade (source: 2013-14 HBSC).
Figure 8. Number of minutes spent daily in screen-based sedentary pursuits among grades 9 to 12 students in Canada, by school grade and screen-based pursuit (source: adapted from 2012-13 COMPASS study143).
19%
GRADE 6
10%
GRADE 7
9%
GRADE 8
7%
GRADE 9
7%
GRADE 10
Grade 10 Grade 11 Grade 12Grade 9
All Screen-Based Sedentary Pursuits
Watching TV or Movies Playing Video or Computer Games
Talking on the Phone Surfing the Internet Texting, Messaging, Emailing
118 118 116 11592 85 77 74
29 31 34 32
116129 130 134 129 137 143 138
485500 500 493
ParticipACTION Report Card on Physical Activity for Children and Youth 41

INDICATORS:Settings & Sources of Influence
3/4
of schools in Canada report using a physical education (PE) specialist to teach PE in their school.2015 OPASS
ParticipACTION Report Card on Physical Activity for Children and Youth 42

C+Family & PeersThe benchmarks for this indicator relate to family physical activity and peer influence. Since a lack of gradable data continues for peer influence, the grade is informed by family physical activity data. This year’s grade is a C+ for the second year in a row and reflects new data revealing that parents understand the importance of physical activity for children and youth.
YEAR 2005 2006 2007 2008 2009 2010 2011 2012 2013 2014 2015 2016
D/C-* D-/ D/D/*
D D/B* C+ D D+ D+ C
- - - - INC INC INC INC INC
Family Physical Activity Grade
Peer Influence Grade
C+C C+
BENCHMARK A 81-100% B 61-80% C 41-60% D 21-40% F 0-20%
� Percentage of parents who facilitate physical activity and sport opportunities for their children (e.g., volunteering, coaching, driving, paying for membership fees and equipment).
� Percentage of parents who meet the Canadian Physical Activity Guidelines for Adults.
� Percentage of parents who are physically active with their kids.
� Percentage of children and youth with friends and peers who encourage and support them to be physically active.
� Percentage of children and youth who encourage and support their friends and peers to be physically active.
* In 2005, there were two separate indicators: Family Physical Activity and Ensuring Kids are Active. In 2006, there were three separate indicators: Family Physical Activity, Ensuring Kids are Active and Parent Perspectives on Activity. In 2008, there were again two separate indicators: Family Perceptions & Roles Regarding Physical Activity and Ensuring Kids are Active.
ParticipACTION Report Card on Physical Activity for Children and Youth 43

Family & Peers
Key Findings� 36% of parents in Canada with 5- to 17-year-olds
report playing active games with them (based on a subsample of the PAM 2014-2015, CFLRI).
� A majority of parents in Ontario report facilitating physical activity and sport opportunities for their children (Public Health Ontario, 2015156):
80% are physically active with their child. 82% enroll their child in sports, clubs or
community programs.
86% encourage their child to walk or bike to destinations that are reasonably close.
87% watch their child play sports or engage in other physical activities.
91% encourage their child to use resources in the community.
94% take their child to places where they can be physically active.
97% encourage their child to be physical active outdoors with others.
� 32% of 18- to 39-year-olds and 18% of 40- to 59-year-olds in Canada meet the Canadian Physical Activity Guidelines for Adults, which recommend at least 150 minutes of weekly MVPA (2012-13 CHMS, Statistics Canada).157
� A majority of mothers in Canada with a 5- to 12-year-old child intend to support their child’s physical activity, but less than half follow through with their intention.158
� 78% of parents in Ontario report that they enforce rules relating to their child’s screen time (Public Health Ontario, 2015).144
Research Gaps� Although peer-based physical activity
interventions have shown potential, they need to be better studied and evaluated.
� Further research examining the disconnect between parents intentions to facilitate their children being active and their actual behaviour is required.
Recommendations� When developing interventions aimed at
increasing physical activity and decreasing screen time, target the entire family to maximize impact.
� Continue to provide opportunities for children and their parents to engage in physical activity together in their communities.
� Encourage parents to regularly plan for physical activities for their children and family on evenings, weekends and holidays.
ParticipACTION Report Card on Physical Activity for Children and Youth 44

Family & Peers
According to a recent meta-analysis of 115 studies, relationships exist between parental modeling and their child’s physical activity, and between parental support (e.g., parent-child co-activity, encouragement, praise, transportation) and their child’s physical activity.161 However, the relationship between parental support and physical activity was much stronger than the relationship between parental modeling and physical activity. Interestingly, the relationship between fathers’ modeling of physical activity and the physical activity of their sons was significantly stronger than the relationship between mothers’ modeling of physical activity and their sons’ physical activity. Finally, no relationship was found between parental modeling and the physical activity levels of their daughters. The link between parental support and child physical activity appears to apply to preschoolers as well. In a recent study out of Alberta, every unit increase in parental supported physical activity, as measured by a questionnaire, was associated with an additional 48.5 minutes of physical activity per week among young children (19- to 60-month-old) in the autumn and an additional 52.5 minutes of physical activity per week in the summer.162
Literature SynthesisFamily Physical ActivityResearch continues to show that parents can have an influence on the physical activity levels of their kids. In a recent study in Ontario, when an equal proportion of parents were placed in one of four groups based on their physical activity levels, parents in the group with the lowest physical activity were almost three times as likely to have children who were also in the group of children with the lowest physical activity.159 This relationship was stronger in two-parent homes vs. single-parent homes.159 Evidence from a Québec study also suggests that parents who report higher levels of co-participation in physical activity – doing activities as a family – also appear to have more physically active children.160 This may be due to the fact that co-participation acts as an opportunity for more physical activity, but also allows parents to display positive modeling.
Figure 9. Proportion of Ontario parents who report facilitating their child’s physical activity and sport opportunities, in various ways (source: Public Health Ontario, 2015156).
Take part in physical activites with child
Enroll child in sports teams, clubs, or community programs
Watch child play sports or do other activities
Take child to place where he/she can be active
Encourage child to walk/cycle to places if reasonably close
Encourage child to use resources in community
Encourage child to be active outdoors with others
80% 82% 86% 87% 91% 94% 97%
ParticipACTION Report Card on Physical Activity for Children and Youth 45

Family & Peers
Peer InfluenceParents believe their children’s friends have a stronger influence on their structured physical activity (e.g., sport participation) while siblings are believed to have a greater influence on informal and spontaneous forms of physical activity (e.g., active play).163 In a recent study out of Saskatoon, children who reported higher levels of active transportation with their peers were also more likely to get more daily MVPA.164
Three recent Canadian intervention studies used peer-based approaches to try and increase physical activity levels in children. Go Girls! paired girls with peers of similar age, gender and grade, in a program designed to have them encourage and learn from one another in terms of active living, and to improve each other’s attitudes toward physical activity.165 The pairs of girls met every week for seven weeks and after the program ended, the girls had higher levels of physical activity and confidence
in their abilities to engage in physical activity.165 The Heart Healthy Kids program paired grades 4 to 6 children with peer mentors (children from the same age group, classes and school, who volunteered to promote active play whenever possible with their peers).166 A separate group of schools served as a control. Children in schools with the Heart Healthy Kids program had higher levels of physical activity after the program than before, and also had higher levels of physical activity after the program compared to children from schools that did not take part in the program.166 An evaluation of a peer-mentoring intervention to prevent weight gain in First Nations children living on reserves (the Aboriginal Youth Mentorship Program) found lower rates of weight gain and improved healthy living knowledge and confidence in grade 4 students from a remote isolated community in Manitoba who participated in the peer-mentoring program for five months compared to their peers.167 These studies provide some evidence that peer mentorship programs may be an effective approach to promoting physical activity in children.
ParticipACTION Report Card on Physical Activity for Children and Youth 46
Physical activity is influenced by many things, including a combination of perceived capability, opportunity and motivation on the part of the individual.168,169 For children, this is particularly true because they may have yet to develop the skills to participate in a specific activity or sport (i.e., physical literacy) and have limited control over when and how they can access organized activities (i.e., parents are the gatekeepers). Perhaps most important, motivation is influenced by the extent to which children have a choice about what they do, experience competence and challenge, and feel a sense of relatedness. To the extent that these three needs are satisfied by participating in an activity (e.g., play, sport, swimming lessons), children are more likely to keep engaging in it. To encourage continued participation, youth should be asked what activities they personally find fun, and should be given the opportunity and choice to try different activities. Parents should avoid pressuring youth or making them feel guilty for being inactive, because this tends to undermine sustained motivation.
Goals can also be helpful in regulating behaviours. Think about setting some SMART goals (Specific, Measurable, Adjustable, Realistic and Timely).170 Also, think about the orientation of the goal and ensure the focus of the goal is related to tasks (e.g., “I want to improve the form of my free throw shot”) rather than on outcomes (e.g., “I want to win the game” or “I want to get a basket”). Children and youth with task-oriented goals are more likely to continue with an activity and have positive moods as a result.171
Children and youth should also be encouraged to engage in physical activities with people they care about172 – for example, plan family physical activities or invite their friends for a game of hockey on the local outdoor rink.172 Children and youth also learn from watching other people,173 so parents and siblings should try to make sure they set a good example, and incorporate more physical activity and less sitting into their own day.
The bottom line is that children and youth will be more physically active when they are in environments that are supportive, nurturing and focused on tasks rather than outcomes, and when they have a say in choosing the activities. Encourage exploration and use some of these strategies to try to support children and youth to be more physically active.
Family & Peers
HOW PARENTS CAN ENCOURAGE THEIR CHILDREN TO BE PHYSICALLY ACTIVE
ParticipACTION Report Card on Physical Activity for Children and Youth 47

BSchoolThe benchmarks for this indicator relate to physical education and physical activity opportunities at school and in childcare settings, school policy and programming, and school infrastructure and programming. This year’s grade improves to a B due to new data showing progress in the areas of physical education and school infrastructure.
YEAR 2005 2006 2007 2008 2009 2010 2011 2012 2013 2014 2015 2016
F/INC*
-/INC*
-/C*
-/C-*
C-/B-*
C-/C*
C-/B*
C/B*
C
- - - INC B B B B+ B+
-/INC**
-/INC**
-/C-**
-/C-**
C/B-**
C/C**
C/B**
C-/B**
C
Physical Education & Physical Activity Participation at School & in Childcare Settings
School Infrastructure & Equipment Grade
School Policy & Programming Grade C+C+ B
BENCHMARK A 81-100% B 61-80% C 41-60% D 21-40% F 0-20%
� Percentage of schools with active school policies (e.g., daily physical education [PE], daily physical activity, recess, “everyone plays” approach, bike racks at school, traffic calming on school property, outdoor time).
� Percentage of schools where the majority (≥ 80%) of students are taught by a PE specialist.
� Percentage of schools where the majority (≥ 80%) of students are offered at least 150 minutes of PE per week.
� Percentage of schools that offer physical activity opportunities (excluding PE) to the majority (≥ 80%) of their students.
� Percentage of parents who report their children and youth have access to physical activity opportunities at school in addition to PE classes.
� Percentage of schools with students who have regular access to facilities and equipment that support physical activity (e.g., gymnasium, outdoor playgrounds, sporting fields, multipurpose space for physical activity, equipment in good condition).
* From 2005 to 2012, there were two separate indicators: Physical Education and Sport & Physical Activity Opportunities at School. In 2013, these indicators were collapsed into a single indicator.
** From 2009 to 2012, there were two separate indicators: School Policy and Sport & Physical Activity Opportunities at School. In 2013, these indicators were collapsed into a single indicator.
ParticipACTION Report Card on Physical Activity for Children and Youth 48

School
Key Findings� Three quarters of schools in Canada report that
they use a Physical Education (PE) specialist to teach PE in their school. 43% indicate that they use a teacher with at least one elective credit in PE (2015 Opportunities for Physical Activity at School Study [OPASS], CFLRI).
� Of those who indicate that their school uses a PE specialist, 15% indicate that less than half of students receive PE directly from this individual, 18% of schools indicate that many or most of their students receive PE from this specialist and 68% indicate that almost all students receive PE instruction from a specialist (2015 OPASS, CFLRI).
� The following proportion of schools/school boards/ministries in Canada report that they have fully or partially implemented policies related to physical activity:
77% provide age- and stage-appropriate developmental physical activity and sport programs.
73% provide a range of physical activities for students.
69% have a policy providing daily PE to all students.
69% have a policy providing mandated physical activity to all students.
62% hire teachers with university qualifications to teach PE or activity.
59% ensure ongoing funding for adequate equipment for student needs.
28% ensure National Coaching Certification Program qualifications for coaches.
25% provide opportunities for active transportation of students to and from school (2015 OPASS, CFLRI).
� Below are the proportion of schools/school boards in Canada that report having agreements with:
Municipalities: 81% regarding shared use of school or municipal facilities, 48% regarding shared resources and programming.
Sport organizations or physical activity clubs: 82% regarding use of school facilities, 53% regarding shared resources and programming (2015 OPASS, CFLRI).
� School administrators in Canada report that a number of facilities are available on-site at school including equipment for physical activity (97%), gymnasiums (94%), playing fields (88%), other green spaces or play areas (88%), paved areas used for active games (80%), outdoor basketball hoops (78%) and areas with playground equipment (71%) (2015 OPASS, CFLRI).
� School administrators in Canada report that:
Their students have access to bicycle racks (80%) and change rooms (74%) during school hours.
A number of facilities are available off-site near school including other green spaces (89%), playing fields (84%), skating rinks (82%), areas with playground equipment (78%), baseball diamonds (75%) and walking/bicycling trails (74%).
The indoor facilities (76%) and outdoor facilities (65%) for physical education and extracurricular physical activity programs located on school grounds meet the needs of students quite or very well.
The indoor facilities (46%) and outdoor facilities (59%) for other types of physical activity and play located on school grounds meet the needs of students quite or very well (2015 OPASS, CFLRI).
ParticipACTION Report Card on Physical Activity for Children and Youth 49

School
Research Gaps� More research is needed on the quality of physical
activity at school (e.g., physical literacy) and especially in childcare settings.
� Information is needed on the investment required to ensure each Canadian child is exposed to daily PE and is taught or supported by PE specialists.
� Research is needed on factors at the student-, school- and community-level that influence participation in physical activity at school.
Recommendations� Gear physical activity opportunities and PE toward
fun and participation as opposed to competition to make sure these activities are inclusive.
� All schools in Canada should either employ, or be supported by, PE specialists.
� When developing sport and physical activity policies and programs, ensure that all children have the opportunity to participate on schools teams, in intramural programs and in recess and lunchtime games, depending on their interest.
ParticipACTION Report Card on Physical Activity for Children and Youth 50

School
Reducing Sitting Time at SchoolIn addition to increasing school-based physical activity, reducing school-based sedentary time is also important given that children and youth spend between 50% and 70% of their time at school sitting.175 A global review of studies that used different “anti-sitting” approaches (e.g., standing desks, exercise balls) to reduce sitting time at school found resulting decreases in sedentary time (between 44 to 60 minutes per day) and increases in standing time (between 18 to 55 minutes per day) during classes.175 Another review of studies involving only standing desks to reduce sedentary time found a similar result, with decreases in daily sitting time at school ranging between 59 to 64 minutes.176 Interestingly, a grade 1 teacher in Saskatchewan made headlines when he adopted one of those anti-sitting approaches by raising the height of the desks in his classroom so that students could stand at their desks.177 He was motivated by research showing that excessive sitting is linked with health problems in adulthood. Anecdotal evidence of the benefits of this teacher’s anti-sitting approach included improved attention and posture in some of the students, and even improved sleep at nighttime.177
Literature Synthesis
Physical Activity at SchoolThe school environment is an important setting for physical activity promotion in children and youth, since they spend much of their time on weekdays in school with many contexts for physical activity (Table 2). A recent review identified a number of factors that are necessary in order to increase physical activity levels at school, including:174
� Policies (e.g., a policy around the quantity and quality of PE per week).
� Organizational factors (e.g., leadership around and accountability for physical activity policies).
� Student factors (e.g., options for physical activity at school based on age, gender, race/ethnicity, prior experiences and interests may be met with more success).
� Family factors (e.g., parents who become champions of physical activity and either initiate or volunteer for programs such as a walking school bus may also lead to increased school-based physical activity).
Many of the challenges to increasing school-based physical activity in children and youth often relate to factors such as competing academic priorities and lack of buy-in (which make policy implementation more difficult), and heterogeneity in the student body (which makes it difficult to offer physical activity opportunities that are enticing for everyone in the study body).174
Table 2. Contexts for school-based physical activity (source: adapted from Hatfield and Chomitz, 2015174).
BEFORE SCHOOL DURING SCHOOL AFTER SCHOOL
� Active transportation to school� Physical activity clubs
and programs
� Physical education � Recess � In-classroom activity breaks
� Intramural and inter-school physical activities and sports
� Active transportation from school
ParticipACTION Report Card on Physical Activity for Children and Youth 51

School
Contributing Factors and DisparitiesBased on the 2015 OPASS study, schools with the largest student populations are generally more likely to have certain on-site facilities such as gymnasiums and other rooms, fitness centres, playing fields, tennis courts and running tracks. These schools are also more likely to have some physical activity-related policies such as ongoing funding of equipment and hiring teachers with qualifications in physical education or physical activity.
ParticipACTION Report Card on Physical Activity for Children and Youth 52

A-Community & EnvironmentThe benchmarks for this indicator relate to community policy and programming, availability of infrastructure (e.g., parks and playgrounds), neighbourhood safety and the natural environment. This year’s grade has improved slightly to an A- due to new data that show improvements in community policy and perceptions of neighbourhood safety.
YEAR 2005 2006 2007 2008 2009 2010 2011 2012 2013 2014 2015 2016
-/-* -/-* -/-* D/-* D/B+* D/B+* D/B+* D/B+* B
- B - - B B B B B
C C C** B+ B B A- A- A-
- - - - - - INC***INC***INC***
Community Policy & Programming Grade
Neighbourhood Safety Grade
Natural Environment Grade
Availability of Facilities, Programs, Parks & Playgrounds Grade
BENCHMARK A 81-100% B 61-80% C 41-60% D 21-40% F 0-20%
� Percentage of children or parents who perceive their community/municipality is doing a good job at promoting physical activity (e.g., variety, location, cost, quality).
� Percentage of communities/municipalities that report they have policies promoting physical activity.
� Percentage of communities/municipalities that report they have infrastructure (e.g., sidewalks, trails, paths, bike lanes) specifically geared toward promoting physical activity.
� Percentage of children or parents who report having facilities, programs, parks and playgrounds available to them in their community.
B+B+ A-
� Percentage of children or parents who report living in a safe neighbourhood where they can be physically active.
� Percentage of children or parents who report having well-maintained facilities, parks and playgrounds in their community that are safe to use.
* In the years prior to 2013, there were two separate indicators: Municipal Policies & Regulations and Community Programming. In 2013, these indicators were collapsed into a single indicator: Community Policy & Programming.
** In 2005 and 2006, this indicator was called Proximity & Availability of Facilities, Programs, Parks & Playgrounds. The 2007 grade reflects both availability and usage. In all other years, availability was graded on its own.
*** This indicator has been in the Report Card since 2011 and was called Nature & the Outdoors until this year.
ParticipACTION Report Card on Physical Activity for Children and Youth 53

Community & Environment
� The total rate of sexual violations against children in Canada in 2014 (12.53 per 100,000) is 13% higher than in 2011 (11.08 per 100,000) (2011-14 Uniform Crime Reporting Survey, Statistics Canada).178
According to Statistics Canada, the recent increase over time in total sexual violations against children is primarily due to increasing incidents of child-luring via a computer.179 The rate of luring a child via a computer in 2014 (3.35 per 100,000) is 103% higher than in 2011 (1.65 per 100,000) (2011-14 Uniform Crime Reporting Survey, Statistics Canada).178
Note: “It is important to note that for the violations included in ‘sexual violations against children,’ differences in police-reported statistics between geographic areas or across time may be influenced by levels of reporting to police, as well as by single incidents that include several victims. In addition, certain police services dedicate special units to investigate these types of crime, which can also impact differences by geographic areas or changes over time. Similar to sexual assaults in general, the number of sexual violations against children is also expected to be an underestimate due to compounding factors that are likely to impact reporting, such as reliance on an adult to bring the incident to the attention of police.”179
� The child abduction rate (by non-parents/non-guardians) in Canada in 2014 for children and youth under 14 years of age (0.32 per 100,000) is 27% lower than in 2011 (0.44 per 100,000) (2011-14 Uniform Crime Reporting Survey, Statistics Canada).178
Key Findings� Among municipalities in Canada with more than
1,000 residents:
35% have a formal strategy for physical activity and sport. Slightly more than half consider sport (55%) and physical activity (56%) a moderately high or very high priority in relation to certain other health considerations.
81% and 52% have shared use agreements with school boards in relation to facilities and resources/programming, respectively.
88% and 64% have shared use agreements with sport organizations/physical activity clubs in relation to facilities and resources/programming, respectively.
The following proportion of municipal recreation departments work with various groups when developing facilities, programs and services: 94% (not-for-profit organizations), 86% (schools and school boards), 75% (provincial government or agencies), 71% (business or private sector), 67% (local public health department), 61% (local planning department), 61% (provincial sport organizations), 35% (federal government or national agencies) and 32% (local transportation department) (2015 Physical Activity Opportunities in Canadian Communities survey, CFLRI).
� Less than 20% of parents report that crime, safety or poorly maintained sidewalks are an issue in their neighbourhood (based on a subsample of the 2014-2015 PAM, CFLRI).
� The homicide rate in Canada in 2014 for all ages (1.45 per 100,000) is 17% lower than in 2011 (1.74 per 100,000) (2011-14 Uniform Crime Reporting Survey, Statistics Canada).178
ParticipACTION Report Card on Physical Activity for Children and Youth 54

Community & Environment
Research Gaps� Research is needed to test the effectiveness of new
technology (e.g., GPS for geocaching) in increasing active outdoor play and connection with nature.
� More information is required on patterns of physical activity and sedentary behaviour in rural and remote regions and/or communities.
� Evaluations are required of the Health Background Study Framework, which is a tool developed by Peel Public Health and Toronto Public Health that helps identify minimum standards for built environment core elements (e.g., density, service provision, land-use mix, street connectivity, streetscape characteristics, parking) that developers should address in their applications.180
� It would be useful to evaluate the extent to which programs such as the Young Hunters Program in Nunavut and Take a Kid Trapping in the Northwest Territories encourage physical activity among youth in northern and remote regions.
Recommendations� Encourage the development of protected bicycle
paths and lanes, which are required to reduce safety concerns and increase active commuting.
� Create and promote the development of natural playgrounds to supplement or replace traditional playgrounds in order to help engage children in outdoor play and enhance their connection with nature. Natural playgrounds are areas where children can play with natural elements such as sand, water, wood and living plants.
� Ensure that children and youth with disabilities are always included and integrated into community programs by providing appropriate training to recreation leaders.
ParticipACTION Report Card on Physical Activity for Children and Youth 55

Community & Environment
Literature SynthesisTargeted Physical Activity Programming or SchedulingThe last time the Report Card presented Canadian municipal survey data was in 2012.63 Figure 10 provides fresh insight into targeted physical activity programming in Canadian communities of different sizes.
Parental Safety Concerns as a Barrier to Children’s Physical ActivityChildren of parents who feel comfortable letting them actively travel to school within the neighbourhood are more likely to actively commute to school.181 Studies have also found that children are more physically active in general when parents perceive their neighbourhood to be safe.182,183 This highlights the influence that parents’ perceptions of safety can have on the physical activity levels of their kids. Not surprising, then, is the fact that the primary barrier to children’s active play is parental concerns about safety.184 These concerns include stranger danger, bullies and teenagers, and traffic.184 However, as identified in the Position Statement on Active Outdoor Play,73 which was informed by two comprehensive systematic reviews,68,185 “access to active play in nature and outdoors – with its risks – is essential for healthy child development,”73 and the potential benefits far exceed the risk of harms. For example, most injuries associated with outdoor play are minor,186 and cases of stranger abduction or assault are extremely rare.73
Environmental health risks may also be a parental concern that limits children’s physical activity. Due to their unique physiology, children are more susceptible to heat stress and heat stroke than adults are.187 Children also experience the negative impacts of air pollution at lower concentrations compared to adults.187 At younger ages, children lack the knowledge or ability to modify their behaviour to compensate for environmental conditions without adult intervention.187 Extreme heat, dehydration, fatigue and air pollution can limit cognitive ability, as well as increase aggression and irritability, and in extreme cases can result in illness.187 However, when parents take appropriate precautions – such as encouraging play in shaded areas and/or on natural surfaces (e.g., grass, dirt) and providing water to maintain hydration – these environmental health risks can be mitigated.187
Figure 10. Targeted physical activity programming or scheduling that is operated by both municipalities and non-municipal groups, by municipality size (source: 2015 Physical Activity Opportunities in Canadian Communities survey, CFLRI).
Municipalities with > 1,000 Residents
Municipalities with � 1,000 Residents
Children
Families
Youth Beginners
Under-represented Groups
64%
24%
53%
20%
48%
14%
27%
8%
ParticipACTION Report Card on Physical Activity for Children and Youth 56

Community & Environment
The Importance of the Natural Environment for Physical ActivityParticular elements of the natural environment are instrumental in affording the benefits associated with active outdoor play (see Active Play on page 20). For example, a recent study found that the physical activity levels of 11- to 13-year-olds was directly related to the amount of space devoted to trees in their home neighbourhood: each additional increase in the proportion of neighborhood land covered by treed areas was met with a corresponding increase in free-time physical activity outside of school hours.188 Interestingly, physical activity was not associated with other forms of green space including meadows, developed parks or playgrounds.188
In Europe, two different types of playgrounds were compared: a contemporary playground, consisting of fixed and mono-functional equipment such as a slide and seesaw, and a nature-based playground that included indigenous vegetation, natural water areas, movable equipment and equipment made of natural materials such as wood and ropes.62 Results revealed that 5- and 6-year-olds played for significantly longer episodes on the natured-based playground, and their play was more complex and diverse.62 Evidence also suggests that play spaces where natural elements are installed solely for decorative purposes, or where children are prevented from engaging with the material, do not afford the same benefits.66
Contributing Factors and Disparities Local governments and communities represent the front line for facilities, and many programs and services.189 However, many local governments in rural communities face infrastructure challenges due to limited revenue and financial capacity.189 Northern and remote communities also face serious infrastructure challenges due to the high cost of living and limited construction season, among other factors.189 Although the majority of Canadians have reported access to facilities, programs, parks and playgrounds for many years,2 infrastructure and programming disparities exist in rural, northern and remote communities. For example, relatively fewer parents in the Northwest Territories and several of the Atlantic provinces report availability of public facilities, programs, parks and outdoor spaces compared to parents from other parts of Canada.190 These disparities require attention before the Community & Environment grade can see more improvement.
ParticipACTION Report Card on Physical Activity for Children and Youth 57

INDICATORS:Strategies & Investments
2015 federal government Ministerial Mandate letters call out priorities related to sport, recreation and physical activity for Ministers of Sport and Persons with a Disability, Infrastructure and Communities, and Environment and Climate Change.191-194
ParticipACTION Report Card on Physical Activity for Children and Youth 58

B-GovernmentThis year’s grade was informed by a comprehensive data-gathering process to identify the best available evidence from government officials including the Public Health Agency of Canada, Sport Canada and provincial/territorial ministerial offices. The improved grade in 2015 was based primarily on promises or projected work that has now come to fruition. This year’s grade remains a B- due to the lack of new activity to warrant further improvements in the grade.
YEAR 2005 2006 2007 2008 2009 2010 2011 2012 2013 2014 2015 2016
C- - C C+ C C+/F* C/F* D/F* C-
INC - C C+ C+ B+/ C-**
B+/ C-**
B+/ C-**
C
Federal Government Strategies & Investments Grade
Provincial/Territorial Government Strategies & Investments Grade
B-C B-
BENCHMARK A 81-100% B 61-80% C 41-60% D 21-40% F 0-20%
� Evidence of leadership and commitment in providing physical activity opportunities for all children and youth.
� Allocated funds and resources for the implementation of physical activity promotion strategies and initiatives for all children and youth.
� Demonstrated progress through the key stages of public policy making (i.e., policy agenda, policy formation, policy implementation, policy evaluation and decisions about the future).
* In years prior to 2010, there was one indicator: Federal Government Strategies & Investments. From 2010 to 2012, there were two separate indicators: Strategies and Investments. In 2013, these indicators were again collapsed into a single indicator.
** In years prior to 2010, there was one indicator: Provincial/Territorial Government Strategies & Investments. From 2010 to 2012, there were two separate indicators: Strategies and Investments. In 2013, these indicators were again collapsed into a single indicator.
ParticipACTION Report Card on Physical Activity for Children and Youth 59

Government
Key Findings� With the introduction of the new Liberal
government in October 2015, Prime Minister Justin Trudeau issued Ministerial Mandate letters, many of which had specific call-outs to physical activity, sport and recreation sectors:191
Minister of Sport and Persons with Disabilities: Promote healthier Canadians through sport and recreation, and ensure greater accessibility and opportunities for Canadians with disabilities.192
Minister of Infrastructure and Communities: Make efforts to improve facilities and infrastructure for physical activity.193
Minister of Environment and Climate Change: Develop Parks Canada programs and services so that more Canadians can experience our National Parks and learn more about our environment and heritage.194
� The Healthy Active Living and Obesity Research Group, the Canadian Society for Exercise Physiology (CSEP), ParticipACTION, and the Conference Board of Canada, with support from the Public Health Agency of Canada, led the development of the Canadian 24-Hour Movement Guidelines for Children and Youth: An Integration of Physical Activity, Sedentary Behaviour and Sleep.
� In 2015-16, Sport Canada maintained its annual contributions of approximately $16 million toward increasing sport opportunities for children and youth.
� Since 2013, the Public Health Agency of Canada has leveraged over $34 million in non-governmental funding through its Multi-sectoral Partnerships Approach to increase the impact of federal programs aimed at increasing physical activity and other related health behaviours.
� In its 2016 budget, the federal government unveiled plans to end the Children’s Fitness Tax Credit, which has recently been criticized for providing unequal access to physical activity and sport participation by favouring those who can afford to register their children in sport. It is unclear at this time whether or not this investment is being redirected to support child and youth physical activity in another area.
ParticipACTION Report Card on Physical Activity for Children and Youth 60

Government
British Columbia – Launched the BC Physical Activity Strategy: www.physicalactivitystrategy.ca/.
Alberta – Continued support for the Alberta Healthy School Community Wellness Fund, the Communities ChooseWell initiative and Ever Active Schools.
Yukon – Development and release of Yukon Sport Action Plan, 2015-2022: www.community.gov.yk.ca/pdf/Yukon_Action_Plan.pdf.
Northwest Territories – Through the Recreation and Sport Contributions, financial assistance is provided to eligible recreation and sport organizations in the development and delivery of sport and recreation activities: www.maca.gov.nt.ca/home/for-residents/sport-recreation/recreation-sport-contributions/.
Nunavut – The Government of Canada and the Government of Nunavut have signed a bilateral agreement that will allow Nunavut to expand the scope of its projects and programs related to sport participation: http://goo.gl/UQ9AS3.
Ontario – Released the Trails Action Plan, which establishes priorities for a three-year period under the Ontario Trails Strategy: http://goo.gl/vzMOaH.
Québec – Actively involved in supporting childcare facilities as they implement “Gazelle et Potiron,” a framework launched in 2014 that sets out 12 orientations to help stakeholders create environments that highlight healthy eating, active play and motor development at educational childcare facilities: www.mfa.gouv.qc.ca/fr/publication/Documents/guide_gazelle_potiron.pdf.
New Brunswick – Launched NB PLAYS! an after-school initiative for children and youth 5-19 years old.
Nova Scotia – Launched the Shared Strategy for Advancing Recreation in Nova Scotia: www.recreationns.ns.ca/advocacy/shared_strategy/.
Prince Edward Island – Expanded the Provincial Active Start program to Boys and Girls Clubs: www.sportpei.pe.ca/active_start.
Newfoundland and Labrador – Investment of $500,000 in physical activity initiatives for school-aged youth: www.releases.gov.nl.ca/releases/2015/exec/1026n02.aspx.
Saskatchewan – Continues to invest in Saskatchewan in motion, Mind Exercise Nutrition Do It (MEND), and Healthy Start.
Manitoba – Held its first physical literacy conference: Gateway to Active Participation.
Provincial Spotlights
ParticipACTION Report Card on Physical Activity for Children and Youth 61

Government
Spotlights
Canadian 24-Hour Movement Guidelines for Children and Youth: An Integration of Physical Activity, Sedentary Behaviour, and SleepThe Healthy Active Living and Obesity Research Group, the Canadian Society for Exercise Physiology, ParticipACTION and the Conference Board of Canada, with support from the Public Health Agency of Canada, led the development of the Canadian 24-Hour Movement Guidelines for Children and Youth: An Integration of Physical Activity, Sedentary Behaviour and Sleep. These integrated guidelines harmonize recommendations for physical activity, sedentary behaviour and sleep, and represent the first time these behaviours have been integrated as a single recommendation. The initiative included updating existing and performing new systematic reviews in school-aged children and youth (aged 5-17 years) to examine the relationship between different intensities (light, moderate, vigorous) of objectively measured physical activity and important health indicators; developing the guidelines by following established protocols for clinical practice guideline development, and use of the evidence from systematic reviews, findings from national health survey analyses and input from the co-applicants including knowledge users and international collaborators; and developing and disseminating the guidelines and their evaluation. The Public Health Agency of Canada is invested $443,000 to support the development of the guidelines and leveraging over $700,000 from project partners.
Research Gaps� Research is needed to gain a better understanding
of what is required in financial, human and program resources to reverse trends in physical activity and sedentary behaviour in Canadian children.
� There is an ongoing need to implement common tools and metrics for measuring all movement behaviours (physical activity, sedentary behaviour, and sleep) at the national level, and across each province and territory.
Recommendations� Invest in training around understanding the
importance of the natural and outdoor environment when it comes to play education.
� Proceed with the recommendations of Obesity in Canada: a Whole-of-Society Approach for a Healthier Canada (a report by the Standing Senate Committee on Social Affairs, Science and Technology), including the recommendation for the development and implementation of Active Canada 20/20.195
� Provide leadership development, training, and community capacity building for those living in rural or remote communities, for new Canadians and marginalized populations.
� Work with other organizations, such as the Conference Board of Canada, to understand the investment required to increase physical activity in Canada.
� Enhance capacity and consistency in childcare settings and schools to provide opportunities to develop physical literacy, and to increase physical activity and decrease sedentary time.
ParticipACTION Report Card on Physical Activity for Children and Youth 62

Government
Multi-Sectoral PartnershipsIn February 2013, the Public Health Agency of Canada launched the Multi-sectoral Partnerships to Promote Healthy Living and Prevent Chronic Disease approach, with annual contributions of approximately $20 million to promote healthy living and address chronic disease through an integrated approach to addressing common risk factors, including physical inactivity. The Multi-sectoral Partnerships approach advances innovative solutions to public health challenges by providing the co-investment needed to test and/or scale up the most promising primary prevention interventions. This partnership will reach more than one million Canadians through existing projects and is working with more than 100 new partners including organizations such as RBC, ParticipACTION, Canadian Tire, Reebok Canada, the Canadian Football League, the Boys and Girls Clubs of Canada, Sunlife Financial, Social Change Rewards, The Heart & Stroke Foundation, The Running Room, the Canadian Cancer Society, Maple Leafs Sports and Entertainment, and many others.
See www.phac-aspc.gc.ca/fo-fc/mspphl-pppmvs-eng.php for a list of currently funded projects.
Canada 150To mark the 150th anniversary of Confederation in 2017, the federal government is funding a variety of activities and infrastructure. A $210-million Canada 150 Fund will create opportunities for Canadians to participate in local, regional and national celebrations that encourage participants to give back to Canada through gifts of time and energy, including sport and active-living activities and events. One initiative to be funded is the ParticipACTION 150 Play List, a high-impact large-scale project that will encourage all Canadians to get active and cement our national identity as a physically active culture. Also, the Canada 150 Community Infrastructure Program will invest $150 million over two years to support projects that rehabilitate existing community facilities across Canada, including parks, recreational trails such as fitness trails, arenas, pools, fields and recreation centres.
Sport CanadaAccording to the Minister of Sport and Persons with Disabilities Mandate Letter,192 the Minister’s overarching goal is to promote healthier Canadians through sport and recreation, and to ensure greater accessibility and opportunities for Canadians with disabilities. The Government of Canada contributed approximately $500 million for sport infrastructure, legacy initiatives, a federal cultural strategy, preparation of Canadian teams (athletes, coaches and officials), and essential federal services that supported the overall staging, safety and security of the Toronto 2015 Pan and Parapan Am Games. This includes the federal investment of up to $377.1 million in infrastructure and related projects.
In 2015-16, Sport Canada provided $3.4 million to the 2017 Canada Summer Games Host Society (of a total multi-year contribution of up to $10.35 million), for a combination of operations and capital (infrastructure). The overall capital contribution for these Games is up to $3 million, to be used for two competition venues. A similar $3 million capital contribution was provided to the Prince George 2015 Canada Winter Games Host Society.
In 2015-16, Sport Canada maintained its annual contributions of approximately $16 million toward increasing sport opportunities for children and youth through organizations such as ParticipACTION, Motivate Canada, PHE Canada, Canadian Tire Jumpstart, KidSport, The Grand défi Pierre Lavoie, the Canadian Paralympic Committee, Special Olympics Canada and the Canadian Deaf Sport Association.
ParticipACTION Report Card on Physical Activity for Children and Youth 63

Between October 2014 and June 2015, the Standing Senate Committee on Social Affairs, Science and Technology held 22 meetings and heard from a broad range of experts on issues concerning obesity – specifically centred on diet, physical activity and best practices. In March 2016, the committee released Obesity in Canada: a Whole- of-Society Approach for a Healthier Canada, outlining causes, and recommendations to reduce the incidence of obesity in Canada. One of the causes that was outlined was overall lifestyle, including organized sport and exercise programs, active play and activities of daily living. As a way forward, the committee made a series of 21 recommendations, including five that were directly related to physical activity:
Recommendation 5: The committee further recommends that the federal government conduct assessments of the Children’s Fitness Tax Credit with a view to determining how fiscal measures could be used to help Canadians of lower socioeconomic status choose healthy lifestyle options.
Recommendation 14: The committee therefore recommends that the federal government increase funding to ParticipACTION to a level sufficient for the organization to:
� Proceed with Active Canada 20/20.
� Become the national voice for Canada’s physical activity messaging.
Recommendation 15: The committee further recommends that the Minister of Health and the Minister of Sport and Persons with Disabilities together use the recently established National Health and Fitness Day to promote the Canadian Physical Activity Guidelines.
Recommendation 17: The committee further recommends that the Minister of Health in discussion with provincial and territorial counterparts as well as non-governmental organizations already engaged in these initiatives:
� Encourage improved training for physicians regarding diet and physical activity;
� Promote the use of physician counselling, including the use of prescriptions for exercise;
� Bridge the gap between exercise professionals and the medical community by preparing and promoting qualified exercise professionals as a valuable part of the healthcare system and healthcare team;
� Address vulnerable populations, such as Canadians of lower socio-economic status including Canada’s Aboriginal population, and pregnant women;
� Advocate for childcare facility and school programs related to breakfast and lunch programs, improved physical education, physical activity and nutrition literacy courses; and,
� Engage provincial governments in discussions about infrastructure requirements for communities that encourage active transportation and active play.
Recommendation 18: The committee further recommends that the federal government provide funding under the New Building Canada Fund to communities for infrastructure that enables, facilitates and encourages an active lifestyle, both indoors and outdoors.
Recommendation 21: The committee further recommends that Health Canada and other relevant departments and agencies, together with existing expertise and trusted organizations, implement a comprehensive public awareness campaign on healthy active lifestyles.
For the committee’s full report, go to www.parl.gc.ca/Content/SEN/Committee/421/soci/RMS/01mar16/Report-e.htm#recs.
Government
OBESITY IN CANADA: A WHOLE-OF-SOCIETY APPROACH FOR A HEALTHIER CANADA
ParticipACTION Report Card on Physical Activity for Children and Youth 64

Non-GovernmentThis year’s grade remains an A- because available data around leadership and commitment, allocation of funds, and policy work signal neither an upgrade nor downgrade of the indicator. This year’s grade was informed, in part, by a survey of ParticipACTION’s network partners including non-government, non-profit and for-profit organizations. This survey provides a comprehensive snapshot about what has happened in the physical activity, recreation and sport sector over the past year.
YEAR 2005 2006 2007 2008 2009 2010 2011 2012 2013 2014 2015 2016
- - INC C+ B- C C A-/ INC*
B+ A- A- A-
BENCHMARK A 81-100% B 61-80% C 41-60% D 21-40% F 0-20%
� Evidence of leadership and commitment in providing physical activity opportunities for all children and youth.
� Allocation of funds and resources for the implementation of physical activity promotion strategies and initiatives for all children and youth.
� Demonstrated progress through the key stages of public policy making (i.e., policy agenda, policy formation, policy implementation, policy evaluation and decisions about the future).
* In years prior to 2012, there was one indicator: Non-Government Strategies & Investments. In 2012, there were two separate indicators: Strategies and Investments. In 2013, these indicators were again collapsed into a single indicator.
A-
GRADE
ParticipACTION Report Card on Physical Activity for Children and Youth 65

Non-Government
Key Findings� The majority of organizations surveyed said
that their level of investment to increase physical activity among children and youth has increased, or stayed the same.
� A variety of non-governmental organizations – including Canadian Tire Jumpstart, KidSport, PHE Canada, Arctic Inspiration Prize Tri-Territorial Recreation Training Project, The Sandbox Project and Active for Life – focus on increasing sport and physical activity opportunities for children and youth across Canada.
Research Gaps� There is a need to understand whether a focus on
multi-sectoral partnerships takes away funding from smaller grassroots organizations and shifts resources to those that are able to find corporate funding.
� The effectiveness of programs implemented by private-sector organizations through multi-sectoral partnerships should be evaluated against those implemented by non-governmental organizations.
� Study is needed to understand the balance between providing funding for new start-up projects and providing long-term sustainability for established and effective long-term projects and programs.
� Research should be done on the behaviour change implications associated with longer-term, population-based programming versus single-day events, and identify areas to focus resources.
Recommendations� Continue to work with corporate partners
to leverage funding for new and existing research programs and promote intersectoral partnerships.
� Non-government organizations, including private and philanthropic organizations, should maintain or increase funding for healthy active living across Canada. With this, a model should be developed for “best practices” for public-private partnerships in the field of physical activity, sport and recreation.
� Work with governments to implement a pan-Canadian physical activity framework (e.g., Active Canada 20/20).
� Hold government accountable for policies that put up barriers to increase physical activity and decrease sedentary behaviour among children and youth.
ParticipACTION Report Card on Physical Activity for Children and Youth 66

Non-Government
RBC Learn to PlayThe RBC Learn to Play Project provides grants to local organizations and communities across Canada in support of building the physical literacy of children and youth in Canada. In 2015, RBC, in partnership with ParticipACTION, Sport for Life, and the Public Health Agency of Canada, provided over $2,040,000 in grants (ranging from $1,000 to $25,000) to organizations across multiple sectors. An additional $150,000 in grants was awarded to system change pilot initiatives. RBC Learn to Play Community Grants ($1,000 to $10,000) were awarded to local organizations that teach new skills or sports to kids, and/or expose them to multiple sports or multiple skills such as swimming or skating lessons. RBC Learn to Play Leadership Grants ($10,001 to $25,000) were awarded to community groups that are developing or implementing action plans to transform the way sport and physical activities are planned and delivered, such as programs that makes sports available for new immigrant youth.
Active Play Position StatementThe 2015 ParticipACTION Report Card also included the Position Statement on Active Outdoor Play. This was the first time a knowledge product had been embedded directly in the Report Card and, together, they generated significant community-level action and impact across Canada. In addition to growing awareness and discussion about the importance of risky outdoor play, we have seen many examples of success in increasing children’s opportunities for self-directed play outdoors in all settings. For example, in September 2015, a court in Saanich, BC, dismissed a suit against the municipality for a play structure injury (see Supreme Court of British Columbia Rules That Permitting Kids to Play Grounders is Not Negligence on page 23). In his decision, the judge cited the ParticipACTION Report Card and its rallying cry that “adults should get out of the way and let kids play,” as evidence of the importance of valuing long-term physical health and development as much as safety. Also, the Ottawa-Carleton District School Board is using the 2015 Report Card and position statement as part of the evidence base to support its Outdoor Forest and Nature School kindergarten program.
SpotlightKidSportKidSport is a national not-for-profit organization that provides financial assistance for registration fees and equipment to kids aged 18 and under. KidSport is made up of a network across Canada including 11 provincial/territorial chapters and 178 community chapters. Since its creation in 1993, more than 530,000 kids across the country have been given the chance to play sport through KidSport grants and sport introduction programming. Their latest campaign generated over $85,000 to give children the gift of sport.
ParticipACTION Teen ChallengeThe ParticipACTION Teen Challenge, sponsored by Coca-Cola Canada, is a national program that inspires and supports Canadian teens aged 13-19 to get active. Grants of up to $500 are available to organizations to fund physical activity programs specifically for teens. In 2015 over 750 organizations joined the ParticipACTION Teen Challenge and 799 teen physical activity grants were distributed. Since its launch in 2008, the ParticipACTION Teen Challenge has enabled 400,000 teens to get active in more than 5,000 organizations across Canada, and has deployed more than 4,000 grants totaling $5.5 million to the sector. Research confirmed that micro-grants of just $250-$500 offered through the ParticipACTION Teen Challenge can help reduce financial barriers and empower adolescents to take an active role in identifying and hosting new and creative physical activity events within their communities.
ParticipACTION Report Card on Physical Activity for Children and Youth 67

Non-Government
standardized, 12-week, functional, fun-based fitness curriculum. The aim is to roll it out across all nine CFL team cities by 2019, where it is expected to reach approximately 45,000 elementary school children in 450 schools across the country. The Public Health Agency of Canada has also invested significantly in the evaluation of the program by partnering with the University of Waterloo’s Propel Centre, and is collaborating with US-based evaluators for the BOKS program, based in the National Institute for Out of School Time, who are conducting a BOKS longitudinal evaluation.
Boys and Girls Clubs of Canada – Get BUSYThe Boys and Girls Club of Canada, in partnership with Sun Life Financial ($300,000) and the Public Health Agency of Canada ($325,964), implemented the Get BUSY program. This youth leadership program provides a range of physical activity opportunities (e.g., rock climbing, yoga) and promotes healthy eating choices (e.g., nutritious cooking classes) among children and youth. The program will also identify and plan opportunities to create healthier and more active Club environments and communities (e.g., increasing active transportation to the Clubs) in participating locations. The Get BUSY program is in 22 communities across Canada.
The Play Exchange, Canada’s Active Living Challenge LIFT Philanthropy Partners, in partnership with Canadian Tire and the Public Health Agency of Canada ($826,460) developed the Play Exchange, Canada’s Active Living Challenge, to be delivered and launched in collaboration with project partners and the agency. The Challenge was a high-profile competition to seek out previously untested healthy living ideas from a host of divergent, non-traditional sectors. The competition solicited innovative project concepts to support healthy living interventions for Canadians. These project concepts focused on integrated approaches that promote healthy living, prevent chronic disease and address common chronic disease risk factors. The winner of the Challenge was Trottibus, a pedestrian bus service that gives elementary school children the chance to walk to school every weekday morning safely under adult supervision and to have fun at the same time. (See page 27 for more information about the Trottibus initiative.)
The Lawson FoundationThe Lawson Foundation launched its new Outdoor Play Strategy which included funding for the 2015 ParticipACTION Report Card and $2,290,000 for 14 community projects from diverse sectors undertaking a variety of approaches to supporting outdoor play. The projects will also work together as a cohort to share learning, and Social Research and Demonstration Corporation will lead an evaluation of the Strategy through a $230,000 grant (lawson.ca/outdoorplay). The Strategy includes five projects focused on developing community action models, seven to build practitioner capacity, and two to develop public policy tools. Examples of projects include:
� KidActive ($75,000) – This national project supports the ongoing efforts of the Canadian Outdoor Play Working Group. The project includes an environmental scan and network mapping initiative, the development of key messages about outdoor play, knowledge sharing and translation tools, and a Speaker’s Fund to continue dissemination of the Position Statement on Active Outdoor Play.
� Child and Nature Alliance of Canada ($225,000) – The national Forest School Canada program supports professional learning from coast to coast to early childhood educators and elementary school teachers through the Forest and Nature School Practitioners’ Course. The course dives into the pedagogy of play-based and emergent curriculum in nature, as well as the practical components of delivering Forest and Nature School in a variety of education settings.
� Canadian Public Health Association ($210,000) – This national project investigates the causes of risk aversion from a social and liability perspective and aims to develop a toolkit of policy options to address those concerns – from large cities to small rural areas. The project will be developed in collaboration with a wide range of partners from across Canada.
Build Our Kids Success (BOKS)The Public Health Agency of Canada continues to support the Build Our Kids Success (BOKS) project in collaboration with its project partners the Canadian Football League (CFL), Reebok Canada and the University of Waterloo’s Propel Centre for Population Health Impact. BOKS is a before-school program for elementary school children, aimed at optimizing children’s physical and mental health as well as their confidence, well-being and readiness to learn. The program is based on a
ParticipACTION Report Card on Physical Activity for Children and Youth 68

AbbreviationsCANPLAY Canadian Physical Activity Levels Among Youth study
CAPL Canadian Assessment of Physical Literacy
CCS Canadian Cancer Society
CFLRI Canadian Fitness and Lifestyle Research Institute
CHMS Canadian Health Measures Survey
COMPASS Cohort Study for Obesity, Marijuana Use, Physical Activity, Alcohol Use, Smoking and Sedentary Behaviour
CSEP Canadian Society for Exercise Physiology
HALO Healthy Active Living and Obesity Research Group
HBSC Health Behaviour in School-Aged Children study
IPA International Play Association
ISRC Interprovincial Sport and Recreation Council
MVPA Moderate- to vigorous-intensity physical activity
OPASS Opportunities for Physical Activity at School Study
PAM Physical Activity Monitor
PE Physical education
ParticipACTION Report Card on Physical Activity for Children and Youth 69

Summary of Indicators 2015 Report Card Grades
<21% 21-40% 41-60% 61-80% >80%
Category # Indicator Name Benchmark(s) F D C B AD
aily
Beh
avio
urs
1 Overall Physical Activity
% of children and youth who meet the MVPA recommendation within the Canadian 24-Hour Movement Guidelines for Children and Youth (at least 60 minutes of daily moderate- to vigorous-intensity physical activity).
% of preschoolers who meet the Canadian Physical Activity Guidelines for the Early Years (at least 180 minutes of physical activity at any intensity every day).
2 Organized Sport & Physical Activity Participation
% of children and youth who participate in organized sport and/or physical activity programs.
3 Active Play % of children and youth who engage in unstructured/unorganized active play for several hours a day.
% of children and youth who report being outdoors for several hours a day.
4 Active Transportation % of children and youth who use active transportation to get to and from places (e.g., school, park, mall, friend’s house).
5 Physical Literacy % of children and youth who meet the recommended levels of physical competence, knowledge, motivation and daily behaviours needed for a physically active lifestyle.
6 Sleep % of children and youth who meet the sleep recommendations in the Canadian 24-Hour Movement Guidelines (5- to 13-year-olds: 9-11 hours per night; 14- to 17-year-olds: 8-10 hours per night).
7 Sedentary Behaviours % of children and youth who meet the Canadian Sedentary Behaviour Guidelines (3- to 4-year-olds: less than one hour of screen time per day; 5- to 17-year-olds: no more than two hours of screen time per day). Note: the Guidelines currently provide a time limit recommen-dation for screen-related pursuits, but not for non-screen-related pursuits.
Sett
ings
& S
ourc
es o
f Inf
luen
ce
8 Family & Peers % of parents who facilitate physical activity and sport opportunities for their children (e.g., volunteering, coaching, driving, paying for membership fees and equipment).
% of parents who meet the Canadian Physical Activity Guidelines for Adults.
% of parents who are physically active with their kids.
% of children and youth with friends and peers who encourage and support them to be physically active.
% of children and youth who encourage and support their friends and peers to be physically active.
9 School % of schools with active school policies (e.g., daily PE, daily physical activity, recess, “everyone plays” approach, bike racks at school, traffic calming on school property, outdoor time).
% of schools where the majority (≥ 80%) of students are taught by a PE specialist.
% of schools where the majority (≥ 80%) of students are offered at least 150 minutes of PE per week.
% of schools that offer physical activity opportunities (excluding PE) to the majority (> 80%) of their students.
% of parents who report their children and youth have access to physical activity opportunities at school in addition to PE classes.
% of schools with students who have regular access to facilities and equipment that support physical activity (e.g., gymnasium, outdoor playgrounds, sporting fields, multi-purpose space for physical activity, equipment in good condition).
10 Community & Environment
% of children or parents who perceive their community/ municipality is doing a good job at promoting physical activity (e.g., variety, location, cost, quality).
% of communities/municipalities that report they have policies promoting physical activity.
% of communities/municipalities that report they have infrastructure (e.g., sidewalks, trails, paths, bike lanes) specifically geared toward promoting physical activity.
% of children or parents who report having facilities, programs, parks and playgrounds available to them in their community.
% of children or parents who report living in a safe neighbourhood where they can be physically active.
% of children or parents who report having well-maintained facilities, parks and playgrounds in their community that are safe to use.
Stra
tegi
es &
Inve
stm
ents
11 Government Evidence of leadership and commitment in providing physical activity opportunities for all children and youth.
Allocated funds and resources for the implementation of physical activity promotion strategies and initiatives for all children and youth.
Demonstrated progress through the key stages of public policy making (i.e., policy agenda, policy formation, policy implementation, policy evaluation and decisions about the future).
12 Non-Government Evidence of leadership and commitment in providing physical activity opportunities for all children and youth.
Allocated funds and resources for the implementation of physical activity promotion strategies and initiatives for all children and youth.
Demonstrated progress through the key stages of public policy making (i.e., policy agenda, policy formation, policy implementation, policy evaluation and decisions about the future).
ParticipACTION Report Card on Physical Activity for Children and Youth 70

Methodology & Data SourcesUnlike other report card publications, which often rely on a single data source, the ParticipACTION Report Card synthesizes data from multiple data sources and the research literature. The development of indicators and the assignment of grades involve an interdisciplinary Report Card Research Committee, including researchers from across Canada. An annual summary of research data and literature is prepared by staff at the Children’s Hospital of Eastern Ontario Research Institute to facilitate the review of the information. Grade assignments are determined based on examination of the current data and literature for each indicator against a benchmark or optimal scenario, assessing the indicator to be poor, adequate, good or excellent:
A = We are succeeding with a large majority of children and youth.B = We are succeeding with well over half of children and youth.C = We are succeeding with about half of children and youth.D = We are succeeding with less than half, but some, children and youth.F = We are succeeding with very few children and youth.
Key considerations include trends over time and the presence of disparities. Analysis of trends over time and international comparisons are conducted where possible, as this information is not always available for all indicators. National data take precedence over sub-national and regional data, and objectively measured data take precedence over subjectively measured data. Disparities are primarily based on disabilities, race/ethnicity, immigration status, geography (provincial/territorial comparisons), socioeconomic status, urban/rural setting, gender and age (e.g., adolescence). When evidence of disparities exists, grades are lowered to reflect that we are not reaching all children and youth who may benefit most from physical activity opportunities.
Some indicators are stand-alone, while others are comprised of several components. During the grade assignment meeting, each component of an indicator is assessed. Over the evolution of the Report Card, there has been an attempt to move toward indicators that are broad enough to contain various components in their assessment so that indicators can become more consistent from year to year.
The following are major data sources used in the 2016 Report Card:
Canadian Health Measures Survey (CHMS; goo.gl/dnZ41C): The Canadian Health Measures Survey, launched in 2007, is collecting key information relevant to the health of Canadians by means of direct physical measurements such as blood pressure, height, weight and physical fitness. As part of the CHMS, a clinical oral health examination helps to evaluate the association of oral health with major health concerns such as diabetes, and respiratory and cardiovascular diseases. In addition, the survey is collecting blood and urine samples to test for chronic and infectious diseases, as well as nutrition and environment markers. Through household interviews, the CHMS is gathering information related to nutrition, smoking habits, alcohol use, medical history, current health status, sexual behaviour, lifestyle and physical activity, the environment and housing characteristics, as well as demographic and socioeconomic variables.
Canadian Physical Activity Levels Among Youth Survey (CANPLAY; www.cflri.ca): The Canadian Fitness and Lifestyle Research Institute conducts a major national survey annually to examine physical activity levels of children and youth. CANPLAY studies the current fitness and physical activity patterns of young people in Canada. Approximately 10,000 children and youth (approximately 6,000 families) are randomly selected across Canada. The study has been conducted since 2005. Pedometers are used to measure the number of steps taken daily by each participant. CANPLAY is a joint venture of the Canadian Fitness and Lifestyle Research Institute and the Interprovincial Sport and Recreation Council.
Canadian Student Tobacco, Alcohol and Drugs Survey (CSTADS; uwaterloo.ca/canadian-student-tobacco-alcohol-drugs-survey): Formerly known as the Youth Smoking Survey, CSTADS is a repeated, biannual, cross-sectional survey of 50,000+ students in grades 6 to 12 from all provinces except New Brunswick. Funded by Health Canada, the CSTADS was created to study the factors that increase or diminish the likelihood of tobacco use among youth. The Propel Centre for Population Health Impact at the University of Waterloo coordinates the implementation of the CSTADS nationally, and provincial partners implement the CSTADS in each province. The CSTADS was first administered in 1994 and it has been the largest and most comprehensive survey on youth smoking behaviour since 1979. It was repeated in 2002, 2004-05, 2006-07, 2008-09, 2010-11 and most recently in 2012-13.
Health Behaviour in School-Aged Children Survey (HBSC; www.hbsc.org): Results are based on the Canadian data from the World Health Organization’s 2009-10 HBSC. The HBSC is a repeated cross-sectional survey conducted every four years. The survey consists of a classroom-based questionnaire. The sample was designed according to the international HBSC protocol in that a cluster design was used, with the school class being the basic cluster and the distribution of the students reflected in the distribution of Canadians in grades 6 to 10 (ages 10 to 16). Canadian schools were selected for this study using a weighted probability technique to ensure that the sample is representa-tive of regional geography and key demographic features such as religion, community size, school size and language of instruction. Schools from each province and territory, as well as urban and rural locations, are represented. A total of 26,078 youth from 436 schools across the country participated in the 2009-10 HBSC survey. The Canadian HBSC was approved by the Queen’s University General Research Ethics Board. Consent was obtained from the participating school boards, individual schools, parents and students. Student participation is voluntary. The HBSC includes three main components: 1) a questionnaire completed by students that asks about their health behaviours (such as physical activity and active transportation), lifestyle factors and demographics; 2) an administrator questionnaire distributed to each school principal that inquires about school demographics, policy, infrastructure and the school neighbourhood setting (completed for 411 of the 436 participating schools); and 3) geographic information systems (GIS) measures of built and social features in the school neighbourhoods.
Opportunities for Physical Activity at School Survey (OPASS; www.cflri.ca): The content of the 2015 OPASS is designed to explore the availability and composition of physical education programming at school, determine the availability and adequacy of facilities and opportunities for physical activity, explore the provision of extracurricularphysical activities, examine policies related to physical activity at school, and describe the broader physical and social environments at school. The survey consists of a self-completed questionnaire that was mailed to a total of 8,000 Canadian schools. The survey was conducted by the CFLRI with funding support from the Interprovincial Sport and Recreation Council, and in partnership with PHE Canada.
Physical Activity Monitor (PAM; www.cflri.ca): The PAM is a telephone survey conducted by the CFLRI that tracks changes in physical activity patterns, factors influencing participation, and life circumstances in Canada. As such, it tracks outcome indicators of the efforts to increase physical activity among Canadians. To date, 17 waves of PAM have been completed, with theme content cycled in and out across planned periods.
ParticipACTION Report Card on Physical Activity for Children and Youth 71

PartnersCanadian Pediatric SocietyCanadian Sleep SocietyCanadian Society for Exercise PhysiologyConference Board of CanadaPublic Health Agency of CanadaSedentary Behaviour Research Network
References1 Tremblay MS, Carson V, Chaput J-P, Dinh T, Duggan M, Faulkner G, Connor Gorber S,
Gray CE, Gruber R, Janson K, Janssen I, Katzmarzyk PT, Kho ME, Latimer-Cheung AE, LeBlanc C, Okely AD, Olds T, Pate RR, Phillips A, Poitras VJ, Rodenburg S, Saunders TJ, Sampson M, Stone J, Stratton G, Weiss SK, Zehr L. Canadian 24-Hour Movement Guidelines for Children and Youth: An Integration of Physical Activity, Sedentary Behaviour, and Sleep. Appl Physiol, Nutr Metab (in press).
2 ParticipACTION. Archived Report Cards. Toronto: ParticipACTION; 2016. URL: www.participACTION.com/reportcard.
3 Katzmarzyk PT, Barreira TV, Broyles ST, Champagne CM, Chaput JP, Fogelholm M, Hu G, Johnson WD, Kuriyan R, Kurpad A, Lambert EV, Maher C, Maia J, Matsudo V, Olds T, Onywera V, Sarmiento OL, Standage M, Tremblay MS, Tudor-Locke C, Zhao P, Church TS. Physical activity, sedentary time, and obesity in an international sample of children. Med Sci Sports Exerc. 2015;47(10):2062-2069.
4 Katzmarzyk PT, Barreira TV, Broyles ST, Champagne CM, Chaput JP, Fogelholm M, Hu G, Johnson WD, Kuriyan R, Kurpad A, Lambert EV, Maher C, Maia J, Matsudo V, Olds T, Onywera V, Sarmiento OL, Standage M, Tremblay MS, Tudor-Locke C, Zhao P, Church TS; ISCOLE Research Group. Relationship between lifestyle behaviors and obesity in children ages 9-11: results from a 12-country study. Obesity 2015;23(8):1696-1702.
5 Ferrari GL, Oliveira LC, Araujo TL, Matsudo V, Barreira TV, Tudor-Locke C, Katzmarzyk P. Moderate-to-vigorous physical activity and sedentary behavior: independent associations with body composition variables in Brazilian children. Pediatr Exerc Sci. 2015;27(3):380-389.
6 Herman KM, Chaput JP, Sabiston CM, Mathieu ME, Tremblay A, Paradis G. Combined physical activity/sedentary behaviour associations with indices of adiposity in 8- to 10-year-old children. J Phys Act Health. 2015;12(1):20-29.
7 Biddle SJ, Asare M. Physical activity and mental health in children and adolescents: a review of reviews. Br J Sports Med. 2011;45(11):886-895.
8 Larun L, Nordheim LV, Ekeland E, Hagen KB, Heian F. Exercise in prevention and treatment of anxiety and depression among children and young people. Cochrane Database Syst Rev. 2006;(3):CD004691.
9 McPhie ML, Rawana JS. The effect of physical activity on depression in adolescence and emerging adulthood: a growth-curve analysis. J Adolesc. 2015;40:83-92.
10 Richards J, Jiang X, Kelly P, Chau J, Bauman A, Ding D. Don’t worry, be happy: cross-sectional associations between physical activity and happiness in 15 European countries. BMC Public Health. 2015;15:53.
11 Domazet SL, Tarp J, Huang T, Gejl AK, Andersen LB, Froberg K, Bugge A. Associations of physical activity, sports participation and active commuting on mathematic performance and inhibitory control in adolescents. PLoS One. 2016 ;11(1):e0146319.
12 McIsaac JD, Kirk SF, Kuhle S. The association between health behaviours and academic performance in Canadian elementary school students: a cross-sectional study. Int J Environ Res Public Health. 2015;12(11):14857-14871.
13 Chaput JP, Carson V, Gray CE, Tremblay MS. Importance of all movement behaviors in a 24 hour period for overall health. Int J Environ Res Public Health. 2014;11(12):12575-12581.
14 Keyes KM, Maslowsky J, Hamilton A, Schulenberg J. The Great Sleep Recession: changes in sleep duration among US adolescents, 1991-2012. Pediatrics. 2015;135:460-468.
15 Matricciani L, Olds T, Petkov J. In search of lost sleep: secular trends in the sleep time of school-aged children and adolescents. Sleep Med Rev. 2012;16:203-211.
16 Nixon GM, Thompson JM, Han DY, Becroft DM, Clark PM, Robinson E, Waldie KE, Wild CJ, Black PN, Mitchell EA. Falling asleep: the determinants of sleep latency. Arch Dis Child. 2009;94(9):686-689.
17 Chaput JP, Janssen I. Sleep duration estimates of Canadian children and adolescents. J Sleep Res. 2016. [Epub ahead of print]
18 Weiss S. Sleep in Children. St. Catharines: Canadian Sleep Society; 2005.
19 Owens JA. The ADHD and sleep conundrum: a review. J Dev Behav Pediatr. 2005;26(4):312-322.
20 Gruber R. Sleep and children: the impact of lack of sleep on daily life. Montreal: Douglas Mental Health University Institute; 2015. URL: www.douglas.qc.ca/info/sleep-and-children-impact-of-lack-of-sleep-on-daily-life.
ParticipACTION Report Card on Physical Activity for Children and Youth 72
21 Wolfson AR, Carskadon MA. Sleep schedules and daytime functioning in adolescents. Child Dev. 1998;69(4):875-887.
22 Lahey J. Students aren’t getting enough sleep — School starts too early. Washington: The Atlantic; 2014. URL: www.theatlantic.com/education/archive/2014/08/surprise-students-arent-getting-enough-sleep/379020.
23 Sarchiapone M, Mandelli L, Carli V, Iosue M, Wasserman C, Hadlaczky G, Hoven CW, Apter A, Balazs J, Bobes J, Brunner R, Corcoran P, Cosman D, Haring C, Kaess M, Keeley H, Keresztény A, Kahn JP, Postuvan V, Mars U, Saiz PA, Varnik P, Sisask M, Wasserman D. Hours of sleep in adolescents and its association with anxiety, emotional concerns, and suicidal ideation. Sleep Med. 2014;15(2):248-254.
24 Stone MR, Stevens D, Faulkner GE. Maintaining recommended sleep throughout the week is associated with increased physical activity in children. Prev Med. 2013;56(2):112-117.
25 Khan MK, Chu YL, Kirk SF, Veugelers PJ. Are sleep duration and sleep quality associated with diet quality, physical activity, and body weight status? A population-based study of Canadian children. Can J Public Health. 2015;106(5):e277-282.
26 The Telegraph. Exercise helps children fall asleep faster, study indicates. London: The Telegraph; 2016. URL: http://goo.gl/9IgQta.
27 Foti KE, Eaton DK, Lowry R, McKnight-Ely LR. Sufficient sleep, physical activity, and sedentary behaviors. Am J Prev Med. 2011;41(6):596-602.
28 Owens JA, Mindell JA. Take charge of your child’s sleep: The all-in-one resource for solving sleep problems in kids and teens. Jackson: Da Capo Press; 2005.
29 Active Healthy Kids Canada. Don’t let this be the most physical activity our kids get after school. The 2011 Active Healthy Kids Canada Report Card on Physical Activity for Children and Youth. Toronto: Active Healthy Kids Canada; 2011. URL: www.participACTION.com/reportcard.
30 Lévesque L, Janssen I, Xu F. Correlates of physical activity in First Nations youth residing in First Nations and northern communities in Canada. Can J Public Health. 2015;106(2):e29-e35.
31 Borkhoff CM, Heale LD, Anderson LN, Tremblay MS, Maguire JL, Parkin PC, Birken CS; TARGet Kids! Collaboration. Objectively measured physical activity of young Canadian children using accelerometry. Appl Physiol Nutr Metab. 2015;9:1-7.
32 Kuzik N, Clark D, Ogden N, Harber V, Carson V. Physical activity and sedentary behaviour of toddlers and preschoolers in child care centres in Alberta, Canada. Can J Public Health. 2015;106(4):e178-e183.
33 Vanderloo LM, Tucker P. An objective assessment of toddlers’ physical activity and sedentary levels: a cross-sectional study. BMC Public Health. 2015;15(1):969.
34 Hillman CH, Pontifex MB, Raine LB, Castelli, DM, Hall EE, Kramer AF. The effect of acute treadmill walking on cognitive control and academic achievement in preadolescent children. Neuroscience. 2009;159(3):1044-1054.
35 Donnelly JE, Lambourne K. Classroom-based physical activity, cognition, and academic achievement. Prev Med. 2011;52 Suppl 1:S36-S42.
36 Mullender-Wijnsma MJ, Hartman E, de Greeff JW, Doolaard S, Bosker RJ, Visscher C. Physically active math and language lessons improve academic achievement: a cluster randomized controlled trial. Pediatrics. 2016;137(3):1-9.
37 Carson V, Hunter S, Kuzik N, Wiebe SA, Spence JC, Friedman A, Tremblay MS, Slater L, Hinkley T. Systematic review of physical activity and cognitive development in early childhood. J Sci Med Sport. 2015; pii:S1440-2440(15)00146-2.
38 Voss MW, Carr LJ, Clark R, Weng T. Revenge of the “sit” II: does lifestyle impact neuronal and cognitive health through distinct mechanisms associated with sedentary behavior and physical activity? Mental Health and Physical Activity. 2014;7(1): 9-24.
39 Carson V, Kuzik N, Hunter S, Wiebe SA, Spence JC, Friedman A, Tremblay MS, Slater LG, Hinkley T. Systematic review of sedentary behavior and cognitive development in early childhood. Prev Med. 2015;78:115-122.
40 Lees C, Hopkins J. Effect of aerobic exercise on cognition, academic achievement, and psychosocial function in children: a systematic review of randomized control trials. Prev Chronic Dis. 2013;10:E174.
41 Law M, King G, King S, Kertoy M, Hurley P, Rosenbaum P, Young N, Hanna S. Patterns of participation in recreational and leisure activities among children with complex physical disabilities. Dev Med Child Neurol. 2006;48(5):337-342.
42 Majnemer A, Shevell M, Law M, Birnbaum R, Chilingaryan G, Rosenbaum P, Poulin C. Participation and enjoyment of leisure activities in school-aged children with cerebral palsy. Dev Med Child Neurol. 2008;50(10):751-758.
43 Shikako-Thomas K, Shevell M, Lach L, Law M, Schmitz N, Poulin C, Majnemer A; QUALA group. Picture me playing – a portrait of participation and enjoyment of leisure activities in adolescents with cerebral palsy. Res Dev Disabil. 2013;34(3):1001-1010.
44 Cavallo S, April KT, Grandpierre V, Majnemer A, Feldman DE. Leisure in children and adolescents with juvenile idiopathic arthritis: a systematic review. PLoS One. 2014;9(10):e104642.
45 Memari AH, Panahi N, Ranjbar E, Moshayedi P, Shafiei M, Kordi R, Ziaee V. Children with autism spectrum disorder and patterns of participation in daily physical and play activities. Neurol Res Int. 2015;2015:531906.
46 Stone N, Obeid J, Dillenburg R, Milenkovic J, MacDonald MJ, Timmons BW. Objectively measured physical activity levels of young children with congenital heart disease. Cardiol Young. 2015;25(3):520-525.
47 Statistics Canada. Directly measured physical activity of children and youth, 2012 and 2013. Ottawa: Statistics Canada; 2015. URL: www.statcan.gc.ca/pub/82-625-x/ 2015001/article/14136-eng.htm.
48 Carson V, Staiano AE, Katzmarzyk PT. Physical activity, screen time, and sitting among U.S. adolescents. Pediatr Exerc Sci. 2015;27(1):151-159.
49 Cooper AR, Goodman A, Page AS, Sherar LB, Esliger DW, van Sluijs EM, Andersen LB, Anderssen S, Cardon G, Davey R, Froberg K, Hallal P, Janz KF, Kordas K, Kreimler S, Pate RR, Puder JJ, Reilly JJ, Salmon J, Sardinha LB, Timperio A, Ekelund U. Objectively measured physical activity and sedentary time in youth: the International children’s accelerometry database (ICAD). Int J Behav Nutr Phys Act. 2015;12:113.
50 CIBC – KidSport™. CIBC - KidSport™ report: helping our kids get off the sidelines. Toronto: KidSport™; 2014. URL: goo.gl/zLewi7.
51 Perry A, Weiss J. Canadian children with severe developmental disabilities: a survey of health, well-being and social inclusion. Toronto: York University; 2014. URL: goo.gl/T9m4T5.
52 Purcell L, Harvey J, Seabrook JA. Patterns of recovery following sport-related concussion in children and adolescents. Clin Pediatr (Phila). 2015. pii: 0009922815589915.
53 Carson JD, Lawrence DW, Kraft SA, Garel A, Snow CL, Chatterjee A, Libfeld P, MacKenzie HM, Thornton JS, Moineddin R, Frémont P. Premature return to play and return to learn after a sport-related concussion: physician’s chart review. Can Fam Physician. 2014;60(6):e310, e312-315.
54 Jewett R, Sabiston CM, Brunet J, O’Loughlin EK, Scarapicchia T, O’Loughlin J. School sport participation during adolescence and mental health in early adulthood. J Adolesc Health. 2014;55(5):640-644.
55 Marques A, Ekelund U, Sardinha LB. Associations between organized sports participation and objectively measured physical activity, sedentary time and weight status in youth. J Sci Med Sport. 2015;pii:S1440-2440(15)00051-1.
56 Hebert JJ, Møller NC, Andersen LB, Wedderkopp N. Organized sport participation Is associated with higher levels of overall health-related physical activity in children (CHAMPS Study-DK). PLoS One. 2015;10(8):e0134621.
57 Kwon S, Janz KF, Letuchy EM, Burns TL, Levy SM. Developmental trajectories of physical activity, sports, and television viewing during childhood to young adulthood: Iowa Bone Development Study. JAMA Pediatr. 2015;169(7):666-672.
58 Smith L, Gardner B, Aggio D, Hamer M. Association between participation in outdoor play and sport at 10 years old with physical activity in adulthood. Prev Med. 2015;74:31-35.
59 Canadian Fitness and Lifestyle Research Institute. 2015 Kids CANPLAY. Bulletin 2: Participation in organized physical activity and sport. Ottawa: Canadian Fitness and Lifestyle Research Institute; 2016. URL: www.cflri.ca/document/bulletin-2-participation-organized-physical-activity-and-sport-0.
60 Hatfield DP, Chomitz VR, Chui KK, Sacheck JM, Economos CD. Demographic, physiologic, and psychosocial correlates of physical activity in structured exercise and sports among low-income, overweight children. J Nutr Educ Behav. 2015;47(5):452-458.
61 Wijtzes AI, Jansen W, Bouthoorn SH, Pot N, Hofman A, Jaddoe VW, Raat H. Social inequalities in young children’s sports participation and outdoor play. Int J Behav Nutr Phys Act. 2014;11:155.
62 Luchs A, Fikus M. A comparative study of active play on differently designed playgrounds. J Adventure Educ Outdoor Learning. 2013;13(3):206-222.
63 Active Healthy Kids Canada. Is active play extinct? The 2012 Active Healthy Kids Canada Report Card on Physical Activity for Children and Youth. Toronto: Active Healthy Kids Canada; 2012. URL: www.participACTION.com/reportcard.
64 Working Group of the All-Party Parliamentary Group. Play – a report by the All-Party Parliamentary Group on a fit and healthy childhood. London: LeapFrog Toys; 2015. URL: goo.gl/9oyW8F.
65 Janssen I. Active play: an important physical activity strategy in the fight against childhood obesity. Can J Public Health. 2014;105(1):e22-e27.
References
ParticipACTION Report Card on Physical Activity for Children and Youth 73

References
66 Herrington S, Brussoni M. Beyond physical activity: the importance of play and nature-based play spaces for children’s health and development. Curr Obes Rep. 2015;4(4):477-483.
67 Burdette HL, Whitaker RC. Resurrecting free play in young children: looking beyond fitness and fatness to attention, affiliation, and affect. Arch Pediatr Adolesc Med. 2005;159(1):46-50.
68 Brussoni M, Gibbons R, Gray C, Ishikawa T, Sandseter EB, Bienenstock A, Chabot G, Fuselli P, Herrington S, Janssen I, Pickett W, Power M, Stanger N, Sampson M, Tremblay MS. What is the relationship between risky outdoor play and health in children? A systematic review. Int J Environ Res Public Health. 2015;12(6):6423-6454.
69 Woolley H, Lowe A. Exploring the relationship between design approach and play value of outdoor play spaces. Landscape Res. 2013;38:53-74.
70 Inter IKEA Systems. The Play Report 2015. Leiden: Inter IKEA Systems; 2015. URL: goo.gl/lsNHik.
71 BC Injury Law and ICBC Claims Blog. BC Supreme Court – nothing negligent about kids playing “grounders”. Victoria: MacIsaac & Company; 2015. URL: bc-injury-law.com/blog/bc-supreme-court-negligent-grounders.
72 The Courts of British Columbia. Thompson v. Corp. of the District of Saanich, 2015 BCSC 1750. Vancouver: the Courts of British Columbia; 2015. URL: www.courts.gov.bc.ca/jdb-txt/SC/15/17/2015BCSC1750.htm.
73 Tremblay MS, Gray C, Babcock S, Barnes J, Bradstreet CC, Carr D, Chabot G, Choquette L, Chorney D, Collyer C, Herrington S, Janson K, Janssen I, Larouche R, Pickett W, Power M, Sandseter EB, Simon B, Brussoni M. Position statement on active outdoor play. Int J Environ Res Public Health. 2015;12(6):6475-6505.
74 The City of Calgary. 2017 International Play Conference. Calgary: the City of Calgary; 2016. URL: www.calgary.ca/CSPS/Recreation/Pages/Events/International-Play-Conference.aspx.
75 Schoeppe S, Duncan MJ, Badland HM, Alley S, Williams S, Rebar AL, Vandelanotte C. Socio-demographic factors and neighbourhood social cohesion influence adults’ willingness to grant children greater independent mobility: a cross- sectional study. BMC Public Health. 2015;15:690.
76 Larouche R. Built environment features that promote cycling in school-aged children. Curr Obes Reps. 2015;4(4):494-503.
77 Rothman L, Buliung R, Macarthur C, To T, Howard A. Walking and child pedestrian injury: a systematic review of built environment correlates of safe walking. Inj Prev. 2014;20:41-49.
78 Rothman L, Macpherson A, Buliung R, Macarthur C, To T, Larsen K, Howard A. Installation of speed humps and pedestrian-motor vehicle collisions in Toronto, Canada: a quasi-experimental study. BMC Public Health. 2015;15(1):774.
79 Larouche R, Chaput J-P, Leduc G, Boyer C, Bélanger P, LeBlanc AG, Borghese MM, Tremblay MS. A cross-sectional examination of socio-demographic and school-level correlates of children’s school travel mode in Ottawa, Canada. BMC Public Health. 2014;14:497.
80 Cutumisu N, Bélanger-Gravel A, Laferté M, Lagarde F, Lemay J-F, Gauvin L. Influence of area deprivation and perceived neighbourhood safety on active transport to school among urban Québec preadolescents. Can J Public Health. 2014;105(5):e376-e382.
81 Pabayo R, Gauvin L, Barnett TA, Morency P, Nikiéma B, Séguin L. Understanding the determinants of active transportation to school among children: evidence of environmental injustice from the Québec Longitudinal Study of Child Development. Health Place. 2012;18(2):163-171.
82 Cozma I, Kukaswadia A, Janssen I, Craig W, Pickett W. Active transportation and bullying in Canadian schoolchildren: a cross-sectional study. BMC Public Health. 2015;15:99.
83 Rothman L, To T, Buliung R, Macarthur C, Howard A. Influence of social and built environment features on children walking to school: an observational study. Prev Med. 2014;60:10-15.
84 Grundy C, Steinbach R, Edwards P, Green J, Armstrong B, Wilkinson P. Effect of 20mph traffic speed zones on road injuries in London, 1986-2006: controlled interrupted time series analysis. BMJ. 2009;339:b4469.
85 Gilbert R, O’Brien C. Canadian child- and youth-friendly land-use and transport planning guidelines. Winnipeg: Centre for Sustainable Transportation; 2010. URL: goo.gl/B492j8.
86 Faulkner G, Stone M, Buliung R, Wong B, Mitra R. School travel and children’s physical activity: a cross-sectional study examining the influence of distance. BMC Public Health. 2013;13(1):1166.
87 Denstel KD, Broyles ST, Larouche R. Active school transport and weekday physical activity in 9-11 year old children from 12 countries. Int J Obes Suppl. 2015;5(Suppl 2):S100-S106.
88 Larouche R, Saunders TJ, Faulkner GEJ, Colley RC, Tremblay MS. Associations between active school transport and physical activity, body composition and cardiovascular fitness: a systematic review of 68 studies. J Phys Act Health. 2014;11(1):206-227.
89 Larouche R, Faulkner G, Fortier M, Tremblay MS. Active transportation and adolescents’ health: the Canadian Health Measures Survey. Am J Prev Med. 2014;46(5):507-515.
90 Morency C, Demers M. Active transportation as a way to increase physical activity among children. Child Care Health Dev. 2010;36(3):421-427.
91 Rainham DG, Bates CJ, Blanchard CM, Dummer TJ, Kirk SF, Shearer CL. Spatial classification of youth physical activity patterns. Am J Prev Med. 2012;42(5):e87-e96.
92 Pabayo R, Maximova K, Spence JC, van der Ploeg K, Wu B, Veugelers PG. The importance of active transportation to and from school for daily physical activity among children. Prev Med. 2012;55(3):196-200.
93 Ramanathan S, O’Brien C, Faulkner G, Stone M. Happiness in motion: emotions, well-being, and active school travel. J Sch Health. 2014;84:516-523.
94 Martinez-Gomez D, Ruiz JR, Gomez-Martinez S, Chillon P, Rey-Lopez JP, Diaz LE, Castillo R, Veiga OL, Marcos A; AVENA Study Group. Active commuting to school and cognitive performance in adolescents. Arch Pediatr Adolesc Med. 2011;165(4):300-305.
95 Brook RD, Rajagopalan S, Pope III CA, Brook JR, Bhatnagar A, Diez-Roux AV, Holguin F, Hong Y, Luepker RV, Mittleman MA, Peters A, Siscovick D, Smith SC Jr, Whitsel L, Kaufman JD; American Heart Association Council on Epidemiology and Prevention; Council on the Kidney in Cardiovascular Disease; and Council on Nutrition, Physical Activity and Metabolism. Particulate matter air pollution and cardio-vascular disease: an update to the scientific statement from the American Heart Association. Circulation. 2010;121:2331-2378.
96 Smith L, Norgate SH, Cherret T, Davies N, Winstanley C, Harding M. Walking school buses as a form of active transportation for children – a review of the evidence. J Sch Health. 2015;85(3):197-210.
97 Mendoza JA, Watson K, Baranowski T, Nicklas TA, Uscanga DK, Hanfling MJ. The walking school bus and children’s physical activity: a pilot cluster randomized controlled trial. Pediatrics. 2011;128(3):e537-e544.
98 Mammen G, Stone MR, Buliung R, Faulkner G. School travel planning in Canada: identifying child, family, and school characteristics associated with school travel mode shift from driving to active school travel. J Transp Health. 2014;1:288-294.
99 McDonald NC, Steiner RL, Lee C, Smith TR, Zhu X, Yang Y. Impact of the Safe Routes to School program on walking and bicycling. J Am Plann Assoc. 2014;80(2):153-167.
100 Hinckson EA, Garrett N, Duncan S. Active commuting to school in New Zealand children (2004-2008): a quantitative analysis. Prev Med. 2011;52(5):332-336.
101 Dimaggio C, Li G. Effectiveness of a Safe Routes to School program in preventing school-aged pedestrian injury. Pediatrics. 2013;131(2):290-296.
102 Reynolds CC, Harris MA, Teschke K, Cripton PA, Winters M. The impact of transportation infrastructure on bicycling injuries and crashes: a review of the literature. Environ Health. 2009;8:47.
103 Lusk AC, Furth PG, Morency P, Miranda-Moreno LF, Willett WC, Dennerlein JT. Risk of injury for bicycling on cycle tracks versus in the street. Inj Prev. 2011;17:131-135.
104 Teschke K, Harris MA, Reynolds CC, Winters M, Babul S, Chipman M, Cusimano MD, Brubacher JR, Hunte G, Friedman SM, Monro M, Shen H, Vernich L, Cripton PA. Route infrastructure and the risk of injury to bicyclists: a case-crossover study. Am J Public Health. 2012;102:2336-2343.
105 Dill J, Carr T. Bicycle commuting and facilities in major US cities: if you build them, commuters will use them. Transp Res Rec. 2003;1828:116-123.
106 Winters M, Teschke K. Route preferences among adults in the near market for cycling: findings from the Cycling in Cities Study. Am J Health Promot. 2010;25:40-47.
107 Teschke K, Koehoorn M, Shen H, Dennis J. Bicycling injury hospitalization rates in Canadian jurisdictions: analyses examining associations with helmet legislation and mode share. BMJ Open. 2015;5:e008052.
108 Rothman L, Macarthur C, To T, Buliung R, Howard A. Motor vehicle-pedestrian collisions and walking to school: the role of the built environment. Pediatrics. 2014;133(5):776-784.
109 de Hartog JJ, Boogaard H, Nijland H, Hoek G. Do the health benefits of cycling outweigh the risks? Environ Health Perspect. 2010;118(8):1109-1116.
110 Mueller N, Rojas-Rueda D, Cole-Hunter T, de Nazelle A, Dons E, Gerike R, Götschi T, Panis LI, Kahlmeier S, Nieuwenhuijsen MJ. Health impact assessment of active transportation: a systematic review. Prev Med. 2015;76:103-114.
ParticipACTION Report Card on Physical Activity for Children and Youth 74

References
111 Rojas-Rueda D, de Nazelle A, Tainio M, Nieuwenhuijsen MJ. The health risks and benefits of cycling in urban environments compared with car use: health impact assessment study. BMJ. 2011;343:d451.
112 Rothman L, Howard A, Buliung R, Macarthur C, Macpherson A. Dangerous student car drop-off behaviours and child pedestrian-motor vehicle collisions: an observational study. Traffic Inj Prev. 2016;Jan 13:0. [Epub ahead of print]
113 Rushowy K. Parents’ dangerous driving at drop-off areas puts students at risk, study finds. Toronto: Toronto Star; 2016. URL: www.thestar.com/yourtoronto/education/2016/01/20/parents-dangerous-driving-at-drop-off-areas-puts-students-at-risk-study-finds.html.
114 Larouche R, Sarmiento OL, Broyles ST, Denstel KD, Church TS, Barreira TV, Chaput JP, Fogelholm M, Hu G, Kuriyan R, Kurpad A, Lambert EV, Maher C, Maia J, Matsudo V, Olds T, Onywera V, Standage M, Tremblay MS, Tudor-Locke C, Zhao P, Katzmarzyk PT for the ISCOLE Research Group. Are the correlates of active school transport context-specific? Int J Obes Suppl. 2015;5:S89-S99.
115 Mammen G, Faulkner G, Buliung R, Lay J. Understanding the drive to escort: a cross-sectional analysis examining parental attitudes towards children’s school travel and independent mobility. BMC Public Health. 2012;12:862.
116 Mitra R, Buliung R, Faulkner G. Spacial clustering and the temporal mobility of walking school trips in the Greater Toronto Area. Health Place. 2010;16:646-650.
117 Mitra R, Buliung RN. Exploring differences in school travel mode choice behaviour between children and youth. Transp Policy. 2015;42:4-11.
118 Mitra R, Faulkner GEJ, Buliung RN, Stone MR. Do parental perceptions of the neighbourhood environment influence children’s independent mobility? Evidence from Toronto, Canada. Urban Studies. 2014;51(16):3401-3419.
119 Bookwala A, Elton-Marshall T, Leatherdale ST. Factors associated with active commuting among a nationally representative sample of Canadian youth. Can J Public Health. 2014;105(5):e348-e353.
120 Guliani A, Mitra R, Buliung RN, Larsen K, Faulkner GEJ. Gender-based differences in school travel mode choice behaviour: examining the relationship between the neighbourhood environment and perceived traffic safety. J Transp Health. 2015;2(4):502-511.
121 Gray C, Larouche R, Barnes JD, Colley RC, Tremblay MS, Cowie Bonne J, Arthur M, Cameron C, Chaput J-P, Faulkner G, Janssen I, Kolen AM, Manske S, Salmon A, Spence JC, Timmons B. Are we driving our kids to unhealthy habits? Results from the Active Healthy Kids Canada 2013 Report Card on Physical Activity for Children and Youth. Int J Environ Res Public Health. 2014;11(6):6009-6020.
122 Pabayo R, Gauvin L, Barnett TA. Longitudinal changes in active transportation to school in Canadian youth aged 6 through 16 years. Pediatrics. 2011;128(2):e404-e413.
123 Longmuir PE, Tremblay MS. Top 10 research questions related to physical literacy. Res Q Exerc Sport. 2016;87(1):28-35.
124 Whitehead M. Physical literacy throughout the lifecourse. London: Routledge Taylor & Francis Group; 2010.
125 Lloyd M, Colley RC, Tremblay MS. Advancing the debate on “fitness testing” for children: perhaps we’re riding the wrong animal. Pediatr Exerc Sci. 2010;22(2):176-182.
126 Longmuir PE. Understanding the physical literacy journey of children: the Canadian Assessment of Physical Literacy. International Council of Sport Science and Physical Education. 2013;Bulletin 65:276-282.
127 Francis CE, Longmuir PE, Boyer C, Andersen LB, Barnes JD, Boiarskaia E, Cairney J, Faigenbaum AD, Faulkner G, Hands BP, Hay JA, Janssen I, Katzmarzyk PT, Kemper HC, Knudson D, Lloyd M, McKenzie TL, Olds TS, Sacheck JM, Shephard RJ, Zhu W, Tremblay MS. The Canadian Assessment of Physical Literacy: development of a model of children’s capacity for a healthy, active lifestyle through a Delphi process. J Phys Act Health. 2016;3(2):214-222.
128 Longmuir PE, Boyer C, Lloyd M, Yang Y, Boiarskaia E, Zhu W, Tremblay MS. The Canadian Assessment of Physical Literacy: methods for children in grades 4 to 6 (8 to 12 years). BMC Public Health. 2015;15(1):767.
129 Lizotte C, Larouche R, LeBlanc AG, Longmuir PE, Tremblay MS, Chaput JP. Investigation of new correlates of physical literacy in children. Health Behav Policy Rev. 2016;3(2):110-122.
130 Sport for Life Society. Canada’s Physical Literacy Consensus Statement released! Victoria: Sport for Life Society; 2015. URL: goo.gl/DGH5TA.
131 International Physical Literacy Association. International Physical Literacy Association homepage. Plymouth: International Physical Literacy Association; 2016. URL: www.physical-literacy.org.uk.
132 Canada’s Physical Literacy Consensus Statement is the result of a collaborative process among ParticipACTION, Sport for Life Society, the Healthy Active Living and Obesity Research Group at the Children’s Hospital of Eastern Ontario Research Institute, Physical and Health Education Canada, Canadian Parks and Recreation Association, and the Ontario Society of Physical Activity Promoters in Public Health. Representatives from the International Physical Literacy Association also contributed in an advisory capacity. Canada’s Physical Literacy Consensus Statement. Vancouver: 2015. URL: goo.gl/YxXHsx.
133 Tremblay MS, Carson V, Chaput JP, Dinh T, Duggan M, Faulkner G, Connor Gorber S, Gray CE, Gruber R, Hartnell C, Janson K, Janssen I, Katzmarzyk PT, Kho ME, Latimer-Cheung A, LeBlanc C, Okely T, Olds T, Pate R, Phillips A, Poitras VJ, Rodenburg S, Rodin R, Saunders TJ, Sampson M, Stone J, Stratton G, Weiss SK, Zehr L. Canadian 24-Hour Movement Guidelines for Children and Youth: an integration of physical activity, sedentary behaviour and sleep. Appl Physiol Nutr Metab (submitted).
134 Hirshkowitz M, Whiton K, Albert SM, Alessi C, Bruni O, DonCarlos L, Hazen N, Herman J, Katz ES, Kheirandish-Gozal L, Neubauer DN, O’Donnell AE, Ohayon M, Peever J, Rawding R, Sachdeva RC, Setters B, Vitiello MV, Ware JC. National Sleep Foundation’s sleep time duration recommendations: methodology and results summary. Sleep Health. 2015;1:40-43.
135 Gruber R, Carrey N, Weiss SK, Frappier JY, Rourke L, Brouillette RT, Wise MS. Position statement on pediatric sleep for psychiatrists. J Can Acad Child Adolesc Psychiatry. 2014;23:174-195.
136 Owens J; Adolescent Sleep Working Group; Committee on Adolescence. Insufficient sleep in adolescents and young adults: an update on causes and consequences. Pediatrics. 2014;134:e921-e932.
137 Chaput JP, Gray CE, Poitras VJ, Carson V, Gruber R, Olds T, Weiss SK, Gorber SC, Kho ME, Sampson M, Belanger K, Eryuzlu S, Callender L, Tremblay MS. Systematic review of the relationships between sleep duration and health indicators in school-aged children and youth. Appl Physiol Nutr Metab. (in press).
138 Kjeldsen JS, Rosenkilde M, Nielsen SW, Reichkendler M, Auerbach P, Ploug T, Stallknecht B, Sjödin AM, Chaput JP. Effect of different doses of exercise on sleep duration, sleep efficiency and sleep quality in sedentary, overweight men. Bioenergetics. 2013;2:108.
139 Cain N, Gradisar M. Electronic media use and sleep in school-aged children and adolescents: a review. Sleep Med. 2010;11:735-742.
140 Pearson N, Braithwaite RE, Biddle SJ, van Sluijs EM, Atkin AJ. Associations between sedentary behaviour and physical activity in children and adolescents: a meta- analysis. Obes Rev. 2014;15:666-675.
141 Schmid SM, Hallschmid M, Jauch-Chara K, Wilms B, Benedict C, Lehnert H, Born J, Schultes B. Short-term sleep loss decreases physical activity under free-living conditions but does not increase food intake under time-deprived laboratory conditions in healthy men. Am J Clin Nutr. 2009;90:1476-1482.
142 Chaput JP. Is sleep deprivation a contributor to obesity in children? Eating Weight Disord. 2016;21(1):5-11.
143 Leatherdale ST, Harvey A. Examining communication- and media-based recreational sedentary behaviors among Canadian youth: results from the COMPASS study. Prev Med. 2015;74:74-80.
144 Ontario Agency for Health Protection and Promotion (Public Health Ontario), Pyper E, Harrington DW, Manson HM. Screen time: parental support for child health. Toronto: Queen’s Printer for Ontario; 2015. URL: www.publichealthontario.ca/ParentalSupport.
145 Sedentary Behaviour Research Network. Letter to the editor: standardized use of the terms “sedentary” and “sedentary behaviours”. Appl Physiol Nutr Metab. 2012 Jun;37(3):540-542.
146 Stierlin AS, De Lepeleere S, Cardon G, Dargent-Molina P, Hoffmann B, Murphy MH, Kennedy A, O’Donoghue G, Chastin SF, De Craemer M; DEDIPAC consortium. A systematic review of determinants of sedentary behaviour in youth: a DEDIPAC-study. Int J Behav Nutr Phys Act. 2015;12:133.
147 Maras D, Flament MF, Murray M, Buchholz A, Henderson KA, Obeid N, Goldfield GS. Screen time is associated with depression and anxiety in Canadian youth. Prev Med. 2015;73:133-138.
148 Liu M, Wu L, Yao S. Dose-response association of screen time-based sedentary behaviour in children and adolescents and depression: a meta-analysis of observational studies. Br J Sports Med. 2015. pii: bjsports-2015-095084.
149 LeBlanc AG, Katzmarzyk PT, Barreira TV, Broyles ST, Chaput JP, Church TS, Fogelholm M, Harrington DM, Hu G, Kuriyan R, Kurpad A, Lambert EV, Maher C, Maia J, Matsudo V, Olds T, Onywera V, Sarmiento OL, Standage M, Tudor-Locke C, Zhao P, Tremblay MS; ISCOLE Research Group. Correlates of total sedentary time and screen time in 9-11 year-old children around the world: the International Study of Childhood Obesity, Lifestyle and the Environment. PLoS One. 2015;10(6):e0129622.
ParticipACTION Report Card on Physical Activity for Children and Youth 75

References
150 Adamo KB, Colley RC, Hadjiyannakis S, Goldfield GS. Physical activity and sedentary behavior in obese youth. J Pediatr. 2015;166(5):1270-1275.
151 Gomes TN, dos Santos FK, Santos D, Pereira S, Chaves R, Katzmarzyk PT, Maia J. Correlates of sedentary time in children: a multilevel modelling approach. BMC Public Health. 2014;14:890.
152 McNeil J, Tremblay MS, Leduc G, Boyer C, Bélanger P, Leblanc AG, Borghese MM, Chaput JP. Objectively-measured sleep and its association with adiposity and physical activity in a sample of Canadian children. J Sleep Res. 2015;24(2):131-139.
153 Xu H, Wen LM, Rissel C. Associations of parental influences with physical activity and screen time among young children: a systematic review. J Obes. 2015;2015:546925.
154 Birken CS, Lichtblau B, Lenton-Brym T, Tucker P, Maguire JL, Parkin PC, Mahant S; TARGet Kids! Collaboration. Parents’ perception of stroller use in young children: a qualitative study. BMC Public Health. 2015;15:808.
155 Tremblay MS, Leblanc AG, Carson V, Choquette L, Connor Gorber S, Dillman C, Duggan M, Gordon MJ, Hicks A, Janssen I, Kho ME, Latimer-Cheung AE, Leblanc C, Murumets K, Okely AD, Reilly JJ, Stearns JA, Timmons BW, Spence JC; Canadian Society for Exercise Physiology. Canadian Sedentary Behaviour Guidelines for the Early Years (aged 0-4 years). Appl Physiol Nutr Metab. 2012;37(2):370-391.
156 Ontario Agency for Health Protection and Promotion (Public Health Ontario), Pyper E, Harrington DW, Manson HM. Physical activity: parental support for child health. Toronto: Queen’s Printer for Ontario; 2015. URL: www.publichealthontario.ca/ParentalSupport.
157 Statistics Canada. Directly measured physical activity of adults, 2012 and 2013. Ottawa: Statistics Canada; 2015. URL: goo.gl/oIDOIc.
158 Rhodes RE, Spence JC, Berry T, Deshpande S, Faulkner G, Latimer-Cheung AE, O’Reilly N, Tremblay MS. Understanding action control of parental support behavior for child physical activity. Health Psychol. 2016;35(2):131-140
159 Carson V, Stearns J, Janssen I. The relationship between parental physical activity and screen time behaviors and the behaviors of their young children. Pediatr Exerc Sci. 2015;27(3):390-395.
160 Bélanger-Gravel A, Gauvin L, Lagarde F, Laferté M. Correlates and moderators of physical activity in parent-tween dyads: a socio-ecological perspective. Public Health. 2015;129(9):1218-1223.
161 Yao CA, Rhodes RE. Parental correlates in child and adolescent physical activity: a meta-analysis. Int J Behav Nutr Phys Act. 2015;12:10.
162 Carson V. Cross-sectional and longitudinal associations between parental support and children’s physical activity in the early years. J Phys Act Health. 2015. [Epub ahead of print]
163 Edwards MJ, Jago R, Sebire SJ, Kesten JM, Pool L, Thompson JL. The influence of friends and siblings on the physical activity and screen viewing behaviours of children aged 5-6 years: a qualitative analysis of parent interviews. BMJ Open. 2015;5(5):e006593.
164 Katapally TR, Muhajarine N. Capturing the interrelationship between objectively measured physical activity and sedentary behaviour in children in the context of diverse environmental exposures. Int J Environ Res Public Health. 2015;12(9):10995-11011.
165 Dowd AJ, Chen MY, Jung ME, Beauchamp MR. “Go Girls!”: psychological and behavioral outcomes associated with a group-based healthy lifestyle program for adolescent girls. Transl Behav Med. 2015;5(1):77-86.
166 Spencer RA, Bower J, Kirk SF, Hancock Friesen C. Peer mentoring is associated with positive change in physical activity and aerobic fitness of grades 4, 5, and 6 students in the heart healthy kids program. Health Promot Pract. 2014 Nov;15(6):803-811.
167 Eskicioglu P, Halas J, Sénéchal M, Wood L, McKay E, Villeneuve S, Shen GX, Dean H, McGavock JM. Peer mentoring for type 2 diabetes prevention in First Nations children. Pediatrics. 2014;133(6):e1624-e1631.
168 Michie S, van Stralen MM, West R. The behaviour change wheel: a new method for characterising and designing behaviour change interventions. Implement Sci. 2011;23:6:42.
169 Spence JC, Dinh T. Moving ahead: Taking steps to reduce physical inactivity and sedentary behaviour. Ottawa: The Conference Board of Canada; 2015.
170 Healthy Families BC. Set S.M.A.R.T. goals. Victoria: Healthy Families BC; 2013. URL: www.healthyfamiliesbc.ca/home/articles/set-smart-goals.
171 Biddle S, Wang CJ, Kavussanu M, Spray C. Correlates of achievement goal orientations in physical activity: a systematic review of research. Eur J Sport Sci. 2003;3(5):1-20.
172 Ryan RM, Patrick H, Deci EL, Williams GC. Facilitating health behaviour change and its maintenance: interventions based on self-determination theory. Eur Health Psych. 2008;10(1):2-5.
173 Bandura A. Self-efficacy: The exercise of control. London: Macmillan; 1997.
174 Hatfield DP, Chomitz VR. Increasing children’s physical activity during the school day. Curr Obes Rep. 2015;4(2):147-156.
175 Hinckson E, Salmon J, Benden M, Clemes SA, Sudholz B, Barber SE, Aminian S, Ridgers ND. Standing classrooms: research and lessons learned from around the world. Sports Med. 2015. [Epub ahead of print]
176 Minges KE, Chao AM, Irwin ML, Owen N, Park C, Whittemore R, Salmon J. Classroom standing desks and sedentary behavior: a systematic review. Pediatrics. 2016. 2016;137(2):1-18.
177 CTV News. Grade 1 kids get standing desks in Saskatchewan town. Toronto: CTV News; 2015. URL: www.ctvnews.ca/health/grade-1-kids-get-standing-desks-in- saskatchewan-town-1.2234337.
178 Statistics Canada. Table 252-0051 – Incident-based crime statistics, by detailed violations, annual (number unless otherwise noted), CANSIM (database). Ottawa: Statistics Canada, 2016. URL: goo.gl/u4KTUo.
179 Boyce J. Police-reported crime statistics in Canada, 2014. Juristat. 2015;35(1). URL: www.statcan.gc.ca/pub/85-002-x/2015001/article/14211-eng.htm.
180 Moloughney BW, Bursey GE1, Neumann J, Leeming DH, Gutmann CE, Sivanand B, Mowat DL. Incorporating consideration of health impacts into land use development approval processes: development of a Health Background Study Framework. Can J Public Health. 2014;106(1 Suppl 1):eS33-eS42.
181 Cutumisu N, Bélanger-Gravel A, Laferté M, Lagarde F, Lemay JF, Gauvin L. Influence of area deprivation and perceived neighbourhood safety on active transport to school among urban Québec preadolescents. Can J Public Health. 2014;105(5):e376-e382.
182 D’Haese S, Van Dyck D, De Bourdeaudhuij I, Deforche B, Cardon G. The association between the parental perception of the physical neighborhood environment and children’s location-specific physical activity. BMC Public Health. 2015;15:565.
183 Holt NL, Lee H, Millara CA, Spence JC. “Eyes on where children play”: a retrospective study of active free play. Child Geogr. 2015;13(1):73-88.
184 Lee H, Tamminen KA, Clark AM, Slater L, Spence JC, Holt NL. A meta-study of qualitative research examining determinants of children’s independent active free play. Int J Behav Nutr Phys Act. 2015;12:5.
185 Gray C, Gibbons R, Larouche R, Sandseter EB, Bienenstock A, Brussoni M, Chabot G, Herrington S, Janssen I, Pickett W, Power M, Stanger N, Sampson M, Tremblay MS. What is the relationship between outdoor time and physical activity, sedentary behaviour, and physical fitness in children? A systematic review. Int J Environ Res Public Health. 2015;12(6):6455-6474.
186 Nauta J, Martin-Diener E, Martin BW, van Mechelen W, Verhagen E. Injury risk during different physical activity behaviours in children: a systematic review with bias assessment. Sports Med. 2015;45(3):327-336.
187 Vanos JK. Children’s health and vulnerability in outdoor microclimates: a comprehensive review. Environ Int. 2015;76:1-15.
188 Janssen I, Rosu A. Undeveloped green space and free-time physical activity in 11 to 13-year-old children. Int J Behav Nutr Phys Act. 2015;12:26.
189 Federation of Canadian Municipalities. Cities and communities: partners in Canada’s future. Ottawa: Federation of Canadian Municipalities; 2015. URL: goo.gl/4RS2gY.
190 Canadian Fitness and Lifestyle Research Institute. 2010-2011 Physical Activity Monitor. Bulletin 07: Availability of programs and places to be active in the community. Ottawa: Canadian Fitness and Lifestyle Research Institute; 2013. URL: goo.gl/HVumG7.
191 Prime Minister of Canada. Ministerial mandate letters. Ottawa: Prime Minister of Canada; 2015. URL: pm.gc.ca/eng/ministerial-mandate-letters.
192 Prime Minister of Canada. Minister of Sport and Persons with Disabilities mandate letter. Ottawa: Prime Minister of Canada; 2015. URL: pm.gc.ca/eng/minister-sport-and-persons-disabilities-mandate-letter.
193 Prime Minister of Canada. Minister of Infrastructure and Communities mandate letter. Ottawa: Prime Minister of Canada; 2015. URL: pm.gc.ca/eng/minister-infrastructure-and-communities-mandate-letter.
194 Prime Minister of Canada. Minister of Environment and Climate Change mandate letter. Ottawa: Prime Minister of Canada; 2015. URL: pm.gc.ca/eng/minister-environment-and-climate-change-mandate-letter.
195 The Standing Senate Committee on Social Affairs, Science and Technology. Obesity in Canada: A Whole-of-Society Approach for a Healthier Canada. Ottawa: Parliament of Canada; 2016. URL: www.parl.gc.ca/Content/SEN/Committee/421/soci/RMS/01mar16/Report-e.htm.
ParticipACTION Report Card on Physical Activity for Children and Youth 76