Are Barley Dwarfing Genes Important in Tolerance to ...aa amino acid(s) ABA abscisic acid APX...
200
Are Barley Dwarfing Genes Important in Tolerance to Abiotic Stress? Thomas Edward Moore A thesis submitted to the University of East Anglia for the degree of Doctor of Philosophy John Innes Centre February 2012 © This copy of the thesis has been supplied on condition that anyone who consults it is understood to recognise that its copyright rests with the author and that use of any information derived there from must be in accordance with current UK Copyright Law. In addition, any quotation or extract must include full attribution.
Transcript of Are Barley Dwarfing Genes Important in Tolerance to ...aa amino acid(s) ABA abscisic acid APX...

Are Barley Dwarfing Genes Important in Tolerance to Abiotic Stress?
Thomas Edward Moore
A thesis submitted to the University of East Anglia for the degree of Doctor of Philosophy
John Innes Centre
February 2012
© This copy of the thesis has been supplied on condition that anyone who consults it is understood to recognise that its copyright rests with the author and that use of any information derived there from must be in accordance with current UK Copyright Law. In addition, any quotation or extract must include full attribution.

Abstract
DELLA proteins are a highly conserved group of growth inhibitors, mutants of which were
integral to the semi-dwarf, high yielding wheat lines of the Green Revolution. In addition to
reducing plant growth, the gain of function (GoF) mutants in which DELLA protein is
stabilised were shown to confer resistance to salt stress in the model species Arabidopsis.
In order to determine whether these findings could be translated from Arabidopsis to
monocot crop species, GoF and loss of function (LoF) mutants of the barley DELLA
orthologue, Sln1, were characterised and growth and development assessed. By subjecting
DELLA wild-type and mutant barley plants to abiotic stress conditions (salt stress and heat
shock) it was established that the increased survival conferred by stabilised DELLA that was
reported in Arabidopsis was also applicable to barley, and that survival of the LoF barley
mutants was decreased. Further evidence for the importance of stabilised DELLA was
obtained when additional mutants in the GA signalling pathway (gse1a,j,n; Gse1, GA
receptor mutants) in which DELLA protein is predicted to accumulate, also showed increased
tolerance to abiotic stress. These data suggest DELLA protein function is conserved
between monocot (cereal) and dicot plants. Attempts to produce transgenic barley plants in
which Sln1 was silenced were inconclusive, likely underlining the essential nature of the
gene in growth, development and regeneration. The studies provide a basis for further work
to investigate the mechanisms underlying DELLA function in cereals.

Acknowledgements
I would like to thank my supervisors, Dr. Margaret Boulton and Dr. Wendy Harwood for their
advice and guidance, as well as Dr. David Laurie and Dr. Nadia Al-Kaff for their help during
the early stages of my PhD. The supervision and technical support provided by Dr. Andrey
Korolev has been invaluable, and I’m grateful for his help.
I wish to thank Mr. James Gallagher, Dr. Christopher Burt and Dr. Andreas Magusin for their
guidance on statistical analysis. I am also thankful to Dr. Graham McGrann, Dr. Robert
Saville, and Mrs. Elizabeth Orton for their instruction and patience in teaching me the
technicalities of qRT-PCR.
Further thanks go to Mr. Andrew Davis for photography, Mr. Damain Algar and the John
Innes Centre horticulture staff for their help with the plants, the staff of the John Innes
Centre media kitchen and the staff of The Genome Analysis Centre (TGAC) for their
sequencing work.
Finally I would to thank my friends and family for their unwavering encouragement and
support.

Contents
Abbreviations ............................................................................................................................ 9
Chapter 1: General Introduction ............................................................................................. 11
1.1 Dwarfing genes and the ‘Green Revolution’ ................................................................... 11
1.2 The GA signalling pathway .............................................................................................. 11
1.2.1 GA function ........................................................................................................ 11
1.3 GA biosynthesis ............................................................................................................... 12
1.3.1 The GA biosynthesis pathway ............................................................................ 12
1.3.2 Regulation of GA biosynthesis ........................................................................... 13
1.3.3 GA biosynthesis mutants ................................................................................... 14
1.3.4 Transgenic alteration of the GA biosynthesis pathway ..................................... 15
1.4 GA-DELLA signal transduction pathway .......................................................................... 17
1.4.1 DELLA proteins ................................................................................................... 17
1.4.2 Relief of DELLA growth restraint ........................................................................ 17
1.4.3 DELLAs as integrators of multiple signaling pathways....................................... 19
1.4.4 GA-DELLA signal transduction pathway mutants .............................................. 21
1.4.5 DELLA mutants ................................................................................................... 22
1.4.6 GID1 and GID2 mutants ..................................................................................... 24
1.5 Abiotic stress tolerance ................................................................................................... 25
1.5.1 Pressures on agriculture .................................................................................... 25
1.5.2 Reactive oxygen species (ROS) .......................................................................... 26
1.5.3 Salt stress ........................................................................................................... 26
1.5.4 Heat stress ......................................................................................................... 27
1.5.5 Abiotic stress perception ................................................................................... 28
1.5.6 Abiotic stress tolerance ..................................................................................... 30
1.5.6.1 General mechanisms of abiotic stress tolerance ............................................ 30
1.5.6.2 Salt stress tolerance ........................................................................................ 33
1.5.7 DELLA and abiotic stress tolerance .................................................................... 36
Chapter 2: Materials and Methods ................................................................................. 38
2.1 Plant materials and plant culture .................................................................................... 38

2.1.1 Seed origin ......................................................................................................... 38
2.1.2 Plant growth conditions ..................................................................................... 38
2.1.3 Plant culture ....................................................................................................... 39
2.1.3.1 Seed stratification ........................................................................................... 39
2.1.3.2 Growth in soil .................................................................................................. 39
2.1.3.3 Growth in hydroponic culture ........................................................................ 40
2.1.3.4 Growth media for transgenic plants ............................................................... 40
2.1.4 Isolation of plant nucleic acid ............................................................................ 40
2.1.4.1 Isolation of plant genomic DNA ...................................................................... 40
2.1.4.2 Isolation of plant RNA ..................................................................................... 41
2.2 Bacteria and bacterial culture ......................................................................................... 41
2.2.1 Bacterial strains.................................................................................................. 41
2.2.2 Restriction enzymes and antibiotics .................................................................. 42
2.2.3 Bacterial transformation .................................................................................... 42
2.2.4 Bacterial culture ................................................................................................. 43
2.2.5 Colony PCR ......................................................................................................... 43
2.2.6 Isolation of plasmids from E. coli ....................................................................... 43
2.3 Molecular biology materials and methods ..................................................................... 44
2.3.1 Precipitation and purification of nucleic acids................................................... 44
2.3.1.1 Precipitation and purification of DNA ............................................................. 44
2.3.1.2 Precipitation and purification of RNA ............................................................. 44
2.3.2 PCR amplification ............................................................................................... 45
2.3.3 Qualitative and quantitative analysis of nucleic acids ....................................... 45
2.3.4 DNA sequencing ................................................................................................. 46
2.4 Quantification of Sln1 expression ................................................................................... 46
2.4.1 DNase treatment ............................................................................................... 46
2.4.2 cDNA synthesis ................................................................................................... 47
2.4.3 Quantitative RT-PCR (qRT-PCR) ......................................................................... 48
2.5 Bioinformatic and statistical analysis .............................................................................. 48
Chapter 3: Characterisation of GA Signal Transduction Mutants ...................................... 49
3.1 Aims ................................................................................................................................. 49
3.2 Introduction .................................................................................................................... 49
3.2.1 GRAS protein family ................................................................................................ 49
3.2.2 Conserved GRAS domains and motifs..................................................................... 50
3.2.3 Motifs conserved in the DELLA proteins ................................................................. 52
3.3 Materials and methods ...................................................................................................... 56
3.3.1 Selection of barley mutant varieties ....................................................................... 56
3.3.2 Plant growth and phenotype observation .............................................................. 57
3.3.3 Bioinformatic analysis of Sln1 sequence................................................................. 58
3.3.4 Nucleic acid extraction ............................................................................................ 59
3.3.5 Amplification and sequencing of Sln1 ..................................................................... 59
3.3.6 Analysis of Sln1 transcript levels in the γ-1 (cv Triumph) mutant ......................... 61
3.4 Results ................................................................................................................................ 61
3.4.1 Phenotype analysis ................................................................................................. 61
3.4.1.1 Seed size, germination and segregation .............................................................. 61
3.4.1.2 Plant phenotype analysis ..................................................................................... 64
3.4.1.3 Root and shoot growth ........................................................................................ 67
3.4.2 Sequence analysis of wild-type and mutant Sln1 alleles ........................................ 69
3.4.2.1 Bioinformatic analysis .......................................................................................... 69
3.4.2.2 Sequencing and analysis ...................................................................................... 71
3.4.3 Comparison of Sln1 transcript levels in Triumph and Triumph γ-1 plants ............ 75
3.5 Discussion........................................................................................................................... 75
Chapter 4: The Importance of DELLA on Salt Stress Tolerance in Barley ........................... 81
4.1 Aims ................................................................................................................................. 81
4.2 Introduction .................................................................................................................... 81
4.2.1 Mechanisms of saline damage ................................................................................ 82
4.2.2 Salt stress reponse .................................................................................................. 82
4.3 Materials and methods ................................................................................................... 84
4.3.1 Plant material .......................................................................................................... 84
4.3.2 Plant growth and salt stress .................................................................................... 84
4.3.3 Assessment of plant growth ................................................................................... 86
4.3.4 Analysis of element accumulation .......................................................................... 87
4.4 Results ............................................................................................................................. 88
4.4.1 Preliminary experiment .......................................................................................... 88
4.4.2 Seedling survival ..................................................................................................... 89
4.4.3 Root and shoot mass .............................................................................................. 92

4.4.4 Root and shoot length ............................................................................................ 95
4.4.5 Leaf, root and tiller number .................................................................................... 99
4.4.6 Further observations of seedling phenotypes in response to salt ....................... 103
4.4.7 The effect of DELLA on ion element accumulation under salt stress ................... 107
4.5 Discussion ...................................................................................................................... 109
Chapter 5: The Effect of Transient Extreme Heat Stress on Sln1 Mutants ....................... 113
5.1 Aims ............................................................................................................................... 113
5.2 Introduction .................................................................................................................. 113
5.3 Materials and methods ................................................................................................. 116
5.3.1 Plant material ........................................................................................................ 116
5.3.2 Plant growth and heat shock ................................................................................ 116
5.3.3 Assessment of plant growth ................................................................................. 118
5.4 Results ........................................................................................................................... 119
5.4.1 Seedling survival ................................................................................................... 119
5.4.2 Shoot mass ............................................................................................................ 123
5.4.3 Shoot lengths ........................................................................................................ 125
5.5 Discussion ...................................................................................................................... 127
Chapter 6: Silencing Sln1 Expression ............................................................................. 131
6.1 Aims ............................................................................................................................... 131
6.2 Introduction .................................................................................................................. 131
6.2.1 Applications of transgene technology .................................................................. 131
6.2.2 Transgenic adaptation of the GA-DELLA signal transduction pathway ................ 132
6.2.3 Post-transcriptional gene silencing ....................................................................... 133
6.3 Materials and methods ................................................................................................. 135
6.3.1 Production and cloning of the Sln1 fragments ..................................................... 135
6.3.2 Sln1 plant gene silencing vector construction ...................................................... 136
6.3.3 Transformation of Agrobacterium tumefaciens ................................................... 138
6.3.4 Production of embryos for transformation .......................................................... 140
6.3.5 Barley transformation ........................................................................................... 141
6.3.6 Identifying homozygotes in T1 lines ...................................................................... 143
6.3.7 Assessing silencing levels in barley lines transformed with pBract207Sln1-SC1 .. 143
6.4 Results ........................................................................................................................... 144
6.4.1 Production of the silencing construct ................................................................... 144

6.4.1.1 Production of the Sln1 insert ............................................................................. 144
6.4.1.2 Assessment of the pCR®8 vector ....................................................................... 145
6.4.1.3 Assessment of the pBract207Sln1-SC1 construct .............................................. 146
6.4.2 Characterisation of T0 transformants ................................................................... 147
6.4.3 Characterisation of T1 transformants ................................................................... 153
6.4.4 Characterisation of T2 transformants ................................................................... 156
6.5 Discussion ...................................................................................................................... 158
Chapter 7: General Discussion ...................................................................................... 162
Bibliography ................................................................................................................ 167

9
Abbreviations
µL microlitre
µM micromolar
aa amino acid(s)
ABA abscisic acid
APX ascorbate peroxidase
AsA ascorbic acid
BCI barley callus induction
BLAST Basic Local Alignment Search Tool
bp base pair
BR barley regeneration
BT barley transition
cc cubic centimetre
cDNA complementary DNA
CER controlled environment room
cm centimetre
Ct threshold cycle
CTAB cetyl trimethylammonium bromide
cv cultivar
DEPC diethylpyrocarbonate
DNA deoxyribonucleic acid
GA gibberellin(s)
GAPDH glyceraldehyde 3-phosphate dehydrogenase
GID1 GA insensitive dwarf1
GoF gain of function
GP Golden Promise
GSH glutathione
h hour(s)
HQI hydrargyrum quartz iodide
HSP heat shock protein(s)
L litre
LEA late embryogenesis abundant
LiCl lithium chloride
LoF loss of function

10
LZ leucine zipper(s)
M molar
min minute(s)
mL millilitre
mM millimolar
mRNA messenger RNA
NCBI National Centre for Biotechnology Information
NLS nuclear localisation signals
PCD programmed cell death
PCR polymerase chain reaction
PEG polyethylene glycol
PIF phytochrome interacting factor
PIL phytochrome interacting factor 3-like
ppm parts per million
qRT‐PCR quantitative reverse transcription PCR
RCD radical-induced cell death
RNA ribonucleic acid
ROS reactive oxygen species
RT reverse transcription
rt room temperature
s second(s)
SC1 silencing construct 1
SLR1 slender-like rice1
SNP(s) single nucleotide polymorphism(s)
SOD superoxide dismutase
SOS salt overly sensitive
SPT spatula
TGW thousand grain weight
TSS transcription start site
UV ultraviolet
V volts
wk(s) week(s)
WT wild-type
Y2H yeast two-hybrid

11
Chapter 1: General Introduction
1.1 Dwarfing genes and the ‘Green Revolution’
The integration of dwarfing genes into agricultural populations was integral to achieving the
increase in crop yields witnessed during the ‘Green Revolution’ of the 1960’s and 70’s
(Hedden, 2003; Peng et al., 1999), with wheat and rice production doubling since the
introduction of the first high yield lines in 1961 and 1966 respectively (Gollin, 2006; Khush,
1999; Khush & Virk, 2002). High yields of these staple crops had previously been restricted
by the breakage of stems under the weight of grain, an effect termed ‘lodging’. Lodging is
particularly prevalent during periods of strong wind or heavy precipitation, which place
considerable physical stress upon the stem (Baker et al., 1998). Dwarf and semi-dwarf
cultivars reduce lodging, as the shorted stems are more robust than those of taller varieties.
Additionally, dwarfed cultivars have an increased harvest index, as assimilate, (production of
which is commonly encouraged by addition of nitrogen fertiliser), is invested in the grain
rather than the stem (Hedden, 2003). Characterisation of the Green Revolution dwarfing
alleles revealed dwarfing is due to mutations within the gibberellin (GA) signalling pathway,
with the rice dwarfing allele sd1 inhibiting GA biosynthesis, and wheat dwarf alleles Rht-B1b
and Rht-D1b, inhibiting GA signal transduction (Hedden, 2003). Thus, the identification and
characterisation of the GA signalling pathway has provided the basis for explaining dwarfing
phenotypes in wheat and rice, and established GA function as being integral to growth and
development (Hooley, 1994). The proliferation of dwarfed wheat and rice varieties has been
widespread. High yielding wheat dwarfing alleles Rht-B1b and Rht-D1b (also termed Rht1
and Rht2, Börner et al., 1996), derived from Norin 10 are present in over 70% of commercial
wheat cultivars worldwide (Hedden, 2003), and mutant dwarfing lines allelic to sd1 are
utilised in Japonica and Indica commercial varieties (Asano et al., 2007, 2011; Rutger, 2008).
1.2 The GA signalling pathway
1.2.1 GA function
GA are a tetracylic diterpenoid class of phytohormone that control growth and development
processes throughout the plant life cycle, including cell growth and division, vernalisation,
and flower, fruit and seed production (Hooley, 1994; Richards et al., 2001; Eckardt, 2002).

12
GA was first isolated from Gibberella fujikuroi, a causative agent of ‘foolish seedling’ disease
in rice, characterised by rapid growth, hypertrophy, chlorosis, limited grain development
(leading to reduced fertility), and susceptibility to lodging. The role of GA was subsequently
confirmed by the chemical identification of GA in higher plants, resulting from studies using
GA deficient mutants (Hedden & Phillips, 2000; Griffiths et al., 2006). Since its initial
isolation, over a hundred GA have been identified, but of these only GA1, GA3, GA4, and GA7
are biologically active (Richards et al., 2001). Furthermore, different GA isoforms are
synthesised as the plant develops, for example, in Arabidopsis and pumpkin, GA1 formation
is favoured in growing seedlings, while GA4 formation is favoured in adult plants (Pimenta
Lange & Lange, 2006).
1.3 GA biosynthesis
1.3.1 The GA biosynthesis pathway
The GA biosynthesis pathway has largely been elucidated from studies based on Arabidopsis
and pumpkin (Cucurbita maxima) models (Hedden & Phillips, 2000) with additional
information provided from plants such as maize and pea (Spray et al., 1996; Davidson et al.,
2005). GA biosynthesis in higher plants takes place in the chloroplast and cytoplasm of the
plant cell, and involves a large number of enzymes and biosynthetic intermediates
(Olszewski et al., 2002). Many of the enzymes are multi-functional and several of the
enzymes are encoded by multiple genes, each with different systems of regulation,
suggesting the GA biosynthesis pathway is under complex multifactorial control (Hedden &
Phillips, 2000). The pathway can be summarised into three key stages involving six core
enzymes (Figure 1.1). (1) In the proplastid, geranylgeranyl diphosphate (GGDP) is converted
to ent-kaurene with ent-copalyl diphosphate (CDP) as the intermediate, by the enzymes ent-
copalyl diphosphate synthase (CPS) and ent-kaurene synthase (KS). (2) Ent-kaurene is
converted to ent-kaurenoic acid via ent-kaurene oxidase (KO). Ent-kaurenoic acid oxidase
(KAO) catalyses the production of GA12 from ent-kaurenoic acid. GA12 can be converted
further to form GA53 by 13-hydroxylation catalysed by GA 13-oxidases (GA13ox). These
reactions reportedly occur within the ER membrane. (3) In the cytoplasm, GA12 and GA53 are
converted by a series of oxidation steps to form both bioactive (GA1, GA4), and inactive (GA8,
GA9, GA20, GA34) GA. The enzymes involved in these oxidation steps are GA 20-oxidases
(GA20ox), GA 3-oxidases (GA3ox), and GA 2-oxidases (GA2ox) (Olszewski et al., 2002).

13
Figure 1.1 Major GA biosynthetic and catabolic pathways in higher plants (modified from Olszewski et al., 2002) The biosynthesis of GA can be separated in three stages 1) biosynthesis of ent-kaurene in proplastids; 2) conversion of ent-kaurene to GA12; 3) formation of bioactive GA1 and GA4 and inactive GA34 and GA8 in the cytoplasm.
1.3.2 Regulation of GA biosynthesis
GA biosynthesis is regulated in response to environmental stimuli (e.g. light and
temperature), internal signals, or homeostatic response to changes in GA levels (Olszewski
et al., 2002; Hedden & Phillips, 2000). GA are not unique regulators of plant development
(Hooley, 1994). The GA signalling pathway closely interacts with other metabolic pathways
to regulate plant growth and development, with the degree of interaction likely to be
extremely complex (Olszewski et al., 2002; Eckardt, 2007). Auxin, cytokinins, ethylene,
brassinosteroid, calcium, and sugars have been shown to affect stem elongation, likely
through interaction with the GA signalling pathway (Eckardt, 2002). Auxin levels have been
shown to promote biosynthesis of GA1 in pea plants (Pisum sativum) by increasing
expression of PsGA3ox, encoding GA3-oxidase (Ross et al., 2000). A number of studies have
investigated the role of light in GA biosynthesis and downstream plant development. Studies
in Arabidopsis and other higher plants suggest that expression of genes encoding the GA
biosynthesis enzyme GA-20 oxidase is regulated by photoperiod (Hisamatsu et al., 2005; Xu
et al., 1995; Carrera et al., 2000; Kim et al., 2006). Furthermore, PHYTOCHROME
INTERACTING FACTOR 3-LIKE 5 (PIL5) inhibits seed germination by repressing expression of
genes encoding the GA biosynthesis enzyme GA3-oxidase, and activating the expression of
the genes encoding the GA catabolic enzyme, GA2-oxidase. PIL5 is degraded in response to
light stimulus, allowing GA biosynthesis and subsequent plant growth and development (Oh
et al., 2006). Low temperature contributes to Arabidopsis seed germination through

14
expression of the AtGA3ox1 and AtGA3ox2 genes encoding GA3-oxidase. Homeostatic
regulation of GA has been illustrated in pea where the application of exogenous GA resulted
in decreased levels of endogenous GA (Martin et al., 1996), and GA deficiency initiates
AtGA3ox1 expression (Yamauchi et al., 2004).
1.3.3 GA biosynthesis mutants
GA biosynthesis mutants have been identified in many plant species including Arabidopsis,
pea, maize, tomato and rice (Winkler & Helentjaris, 1995; Chasan, 1995). Dwarf mutants
with lesions in the GA biosynthesitic pathway are partially or fully recoverable to the wild-
type phenotype by the addition of exogenous GA, and addition of GA from cultures of G.
fujikuroi has been shown to stimulate growth in GA-deficient dwarf mutants of pea and
maize (Hedden & Phillips, 2000).
GA biosynthesis in Arabidopsis is regulated by the expression of genes at five loci, GA1, GA2,
GA3, GA4 and GA5. The enzymes involved in the early stages of GA biosynthesis CPS, KS and
KO are encoded by single copy genes GA1, GA2 and GA3 respectively (Yamaguchi et al.,
1998; Hedden & Phillips, 2000). Loss of function (LoF) mutations at these alleles results in a
severe dwarf phenotype. In ga1-3 deletion mutants, the ability to produce a functional
enzyme is lost, although small quantities of GA are still produced, most likely by a related
diterpene cyclase system that feeds into the biosynthesis pathway. The inability to
synthesise and utilise GA effectively affects reproductive viability, leading to sterility in
severely GA deficient or insensitive mutants, as with the ga1-3 mutant which is male sterile
due to abortive anther development. The enzymes involved in the later stages of GA
biosynthesis are encoded by small multigene families consisting of at least four genes for
GA20ox and GA3ox, and at least six in GA2ox with some database searches suggesting
additional copies (e.g. Dugardeyn et al., 2008). Plants with null mutations in AtGA3ox1 (GA4)
and AtGA20ox1 (GA5) exhibit a semi-dwarf phenotype due to the functional redundancy of
the isozymes (Hedden & Phillips, 2000). The tomato (Lycopersicon esculentum) mutant gib-1
is GA deficient as it has a reduced ability to convert geranylgeranyl pyrophosphate to copalyl
pyrophosphate, resulting in a dwarfed plant with limited seed germination and flowering.
The wild-type phenotype can be partially restored by application of exogenous GA (Jacobsen
& Olszewski, 1991). In maize, five GA biosynthesis mutants have been characterised. The d5
mutant is defective in the early stages of GA biosynthesis, due to the defective production of

15
the ent-kaurene synthase B enzyme which converts CPP (synonymous with: CDP) to ent-
kaurene (Hedden & Phinney, 1979). The d3 mutant is defective in the production of an
enzyme early in the GA biosynthesis pathway, most likely ent-kaurene oxidase, affecting the
conversion of ent-kaurene to ent-kaurenoic acid (Winkler & Helentjaris, 1995). The d1 dwarf
mutant was initially reported to be defective in the production of the enzyme GA3ox that
acts downstream in the GA biosynthesis pathway, and catalyses the conversion of GA20 to
GA1 by 3β–hydroxylation (Spray et al., 1984) but was more recently also shown to be
defective in steps converting GA20 to GA5, and GA5 to GA3 (Spray et al., 1996). The semi-
dwarf variety of rice integral to the success of the Green Revolution, IR8 (sd1), is unable to
efficiently convert GA53 to GA20, due to a mutation affecting the GA20ox enzyme. Rice
contains at least two GA20ox genes; GA20ox-1 and GA20ox-2. Of the two, only GA20ox-2 is
tightly associated with the SD1 locus. The two genes show tissue-specific expression;
GA20ox-1 is expressed in reproductive organs whilst GA20ox-2 is strongly expressed in the
leaf blade and stem. Thus, the sd1 mutant exhibits a dwarf plant height, yet is fully fertile
(Sasaki et al., 2002).
1.3.4 Transgenic alteration of the GA biosynthesis pathway
Alteration of plant growth and development via the GA pathway has focused on modifying
the levels of GA synthetic (GA20-oxidase and GA3-oxidase) and catabolic (GA2-oxidase)
enzymes that function in the later stages of the GA biosynthesis pathway. This approach has
been extensively explored in dicots but less so in the monocots because of their general
recalcitrance to transformation and regeneration.
Overexpression of GA20-oxidase
Overexpression of any of the three Arabidopsis GA20-oxidase genes (AtGA20ox1,
AtGA20ox2, AtGA20ox3) in transgenic Arabidopsis resulted in seedlings with elongated
hypocotyls, increased height at maturity, early flowering, and a two- to three-fold increase in
GA4 levels in vegetative rosettes compared to wild-type plants (Coles, 1999). A similar study
in transgenic potatoes (Solanum tuberosum) found overexpression of one of the three
potato GA20-oxidase genes (StGA20ox1) resulted in taller plants with elongated internodes
and decreased tuber dormancy compared to wild-type plants under short day conditions
(Carrera et al., 2000). Similarly, transgenic tobacco plants constitutively expressing AtGA20-
ox from the CaMV 35S promoter had the elongated hypocotyls and early flowering

16
phenotype observed in Arabidopsis overexpressing GA20-oxidase as well as paler leaves,
and increased biomass, thereby showing that the Arabidopsis gene could function similarly
in an unrelated plant species (Biemelt et al., 2004). These authors found an increased
number of lignified vessels in the transformed plants, results that were consistent with
overexpression of the same gene in hybrid aspen (Eriksson et al., 2000).
Silencing of GA20-oxidase
The effect of GA20-oxidase gene silencing has been investigated in Arabidopsis and potato
plants. Arabidopsis plants expressing antisense transcripts of AtGA20ox1 showed decreased
growth, shortened hypocotyls, late flowering and reduced rates of stem elongation.
Furthermore, GA4 levels in rosettes and shoot tips were lower than those in wild-type plants
(Coles, 1999). In potato, expression of antisense StGA20ox1 resulted in shorter stems with
decreased internode length, and early, high yield tuber production compared to control
plants. Furthermore, decreased endogenous GA1 and GA20 levels were detected in apex and
first leaf material of the StGA20ox1 silenced potato plants (Carrera et al., 2000).
GA2-oxidase overexpressors
Transgenic tobacco plants constitutively expressing the Arabidopsis GA catabolic enzyme
AtGA2-ox from the CaMV 35S promoter, exhibited reduced biomass, shoot growth and stem
height (16% that of wild-type plants) due to shortened internode length. Leaves on the
AtGA2-ox overexpressing tobacco plants were small and dark green, containing high levels of
chlorophyll, and flower development was delayed and seed formation reduced compared to
control plants (Biemelt et al., 2004). Unlike the tobacco plants overexpressing AtGA20-ox,
the AtGA2-ox expressing plants were responsive to the addition of exogenous GA3, which
restored stature to that of wild-type plants. Expression of the runner bean GA2-ox gene
(PcGA2ox1) in wheat resulted in plants with decreased level of bioactive GA and a range of
dwarfing severity. The dark green leaves and increased tillering seen in these plants was
similar to that seen in wild-type plants treated with paclobutrazol, a GA synthesis inhibitor
(Appleford et al., 2007). Following expression of OsGA2ox1 from the actin promoter in rice,
severely dwarfed plants were obtained that were unable to set grain, although when the
gene was expressed from the OsGA3ox2 promoter the plants were semi-dwarf and exhibited
normal flowering and seed development (Sakamoto et al., 2003).

17
Silencing of GA2-oxidase
Suppression of genes encoding GA2-ox enzymes would be expected to decrease GA levels. A
study (Gou et al., 2010) in which two GA2-ox genes predominantly expressed in roots were
silenced, showed that GA levels could be manipulated in specific tissues. Both GA1 and GA4
levels were decreased in roots of the transgenic poplar plants and these plants showed
decreased lateral root formation but no effect on aerial development. GA have previously
been implicated in root development, with plants having reduced GA levels exhibiting
stulated root development. The authors suggested that GA is important for stress tolerance
since smaller plants with lower demands on environmental resources, but with enhanced
root systems, are more likely to survive stress conditions.
1.4 GA-DELLA signal transduction pathway
1.4.1 DELLA proteins
GA signal transduction is dependent on GA-mediated degradation of nuclear localised DELLA
repressor proteins (Achard et al., 2006). The GA-DELLA signal transduction pathway is a
highly conserved mechanism in higher plants (Yasumura et al., 2007), regulating plant
growth by restricting cell proliferation and expansion in the absence of GA (Thomas & Sun,
2004; Zentella et al., 2007). DELLAs are a subfamily of GRAS regulatory proteins, with
domain analysis and expression studies suggesting DELLAs also control plant growth by
functioning as transcriptional regulators (Dill et al., 2004; Zentella et al., 2007).
1.4.2 Relief of DELLA growth restraint
GA is perceived by both soluble and membrane bound receptors (Ueguchi-Tanaka et al.,
2005), with the GA Insensitive Dwarf1 (GID1) proteins identified as one such class of soluble
GA receptor (Itoh et al., 2002; Achard et al., 2006). DELLA growth repression is relieved as
proposed by the “relief of restraint” model (Figure 1.2; Harberd, 2003). GA removes growth
inhibition by forming a GID1-GA complex that targets DELLA for degradation. It is likely that
the phosphorylated form of the DELLA protein is targeted by the 26S proteasome. Once
DELLA is present in the GA-GID1 complex it is stabilised, thereby enhancing DELLA
degradation (Eckardt, 2007; Ueguchi-Tanaka et al., 2007a,b). Targeted DELLA is recognised
by the GID2-SCF complex (GID2 is an F-box protein), leading to ubiquitination of DELLA and

18
subsequent degradation. The proteasomal targeting of the barley DELLA protein, SLN1, was
reported by Fu et al. (2002).
Figure 1.2 The DELLA ‘relief of restraint’ model (modified from Harberd, 2003) DELLA proteins inhibit growth. GA is perceived by the GA receptor GID1. The GA-GID1 complex leads to the phosphorylation of DELLA. The phosphorylated DELLA protein is recognised by the GID2-SCF complex which targets the DELLA protein for proteosomic degradation.
GID1
Identification of the soluble GA receptors (GID1) in rice and Arabidopsis was integral to
understanding the GA signal transduction pathway (Ueguchi-Tanaka et al., 2005; Griffiths et
al., 2006). The first indication that GID1 is directly involved in GA signalling was the
identification of a GA-dependent interaction between GID1 and the rice DELLA protein,
slender-like rice1 (SLR1) in a yeast two-hybrid (Y2H) assay, suggesting GID1 is a soluble GA
receptor that mediates GA signalling through DELLA interaction (Ueguchi-Tanaka et al.,
2005; Willige et al., 2007). Ueguchi-Tanaka et al. (2007a, b) tested the dose dependency of
GA-mediated GID1-SLR1 interaction in Y2H assays using four bioactive GA: GA1, GA2, GA3,
and GA4. GA4 had the highest affinity for GID1; suggesting GA4 is the most effective GA in
stimulating DELLA degradation. The GID1-SLR interaction was shown to occur also in planta
(Ueguchi-Tanaka et al., 2007b), with GA4 also being the most effective isoform. The
interaction between GA and the GID1-SLR1 complex appears to be highly isoform and dose
specific, with higher levels of GA resulting in increased levels of growth in wild-type plants
(Richards et al., 2001; Ueguchi-Tanaka et al., 2007a). GA4 is less stable than GA3, being

19
rapidly degraded in the presence of GA-inactivating enzymes, whilst GA3 remains active even
in their presence. This may explain why levels of GA3 can be significantly higher than that of
GA4 in growing plants (Ueguchi-Tanaka et al., 2007a). Whilst rice and barley possess only a
single GID1, Arabidopsis contains three homologues (Griffiths et al., 2006). The GID1 gene is
known as Gse1 in barley (Chandler et al., 2008).
GID2
GA-INSENSITIVE DWARF2 (GID2) is a putative F-box protein and is a subunit of the SCF-
ubiquitin ligase complex that is essential for GA-mediated DELLA protein degradation (Sasaki
et al., 2003). In wild-type rice plants, GID2 was found to be preferentially expressed in
organs actively synthesising GA (Gomi et al., 2004). However, recent work using gid2
mutants has shown that derepression of SLR1 activity does not require GID2 function
(Ueguchi-Tanaka et al., 2008), leading the authors to suggest that other unknown factors
might interact with SLR1 to induce its suppressive activity. Further work by Hirano et al.
(2010) has indicated the complexity of the degradation of SLR1, suggesting the F box
protein, rather than recognising a post-translational modification of SLR1, recognises the
GA-dependent SLR1-GID1 complex, with GRAS domain binding to GID1 serving as the
recognition signal. The GID2 protein is known as SLEEPY (SLY) in Arabidopsis (McGinnis et al.,
2003).
1.4.3 DELLAs as integrators of multiple signalling pathways
DELLAs are nuclear localised growth-repressors that integrate responses to independent
hormonal and environmental stimuli (Achard et al., 2003, 2006; Fu & Harberd, 2003; Itoh et
al., 2002). DELLA enhances and represses the expression of genes involved in growth and
development, whilst DELLA levels are in turn regulated by the actions of other signalling
pathways.
Signals affecting DELLA function and stability
DELLA and GA levels are regulated in a homeostatic manner, with high levels of DELLA
resulting in increased GA levels through expression of components of the GA signalling
pathway including GA biosynthesis enzymes, GA receptors and ubiquitinases. DELLA stability
can be regulated through the action of plant growth hormones other than GA. Using an
RGA-GFP reporter construct in transgenic plants, ethylene was shown to delay the
degradation of DELLA in Arabidopsis root cells, even in the presence of bioactive GA (Achard

20
et al., 2003). The authors found that root growth was inhibited in a DELLA-dependent
manner.
Auxin has been shown to promote the accumulation of bioactive GA. The effect of auxin on
GA-mediated DELLA degradation was observed by removal of auxin producing shoot apices
of pRGA:GFP-RGA seedlings and measurement of response to the application of exogenous
GA. Intact pRGA:GFP-RGA seedlings treated with exogenous GA showed rapid degradation
of GFP-RGA. Conversely GFP-RGA was still present in pRGA:GFP-RGA seedlings with apices
removed after 4 h treatment with GA, with degradation only restored upon addition of
exogenous auxin at the site of apex removal (Fu & Harberd, 2003). Inhibition of auxin efflux
in Arabidopsis by exogenous addition of the 1-N-Naphthylphthalamic acid to ga1-3 GA
biosynthesis mutants inhibited growth even after the addition of exogenous GA. ga1-3
mutants also lacking GAI and RGA function reverted to near normal growth on addition of
exogenous GA, suggesting interaction between auxin growth regulation and the GA-DELLA
signal transduction pathway. Ethylene therefore stabilises DELLA and slows growth by
inhibiting GA-mediated DELLA degradation, whilst auxin partly promotes growth by
enhancing DELLA degradation (Fu & Harberd, 2003). Although it has been generally thought
that DELLAs and auxin act together to increase GA levels, more recent work (O’Neill et al.,
2010) using a pea double mutant lacking both DELLA proteins, has shed more light on the
mechanisms involved. Synthesis of bioactive GA was promoted both by auxin and DELLAs,
and both were able to inhibit deactivation of GA. However, it was found that DELLA and
auxin independently regulated the GA pathway, although the extent to which DELLA was
able to counteract auxin regulation differed depending upon the target genes tested (GA20-
ox, GA3-ox and GA2-ox) with effects varying even between GA2ox genes. It is clear that
further work will be required to fully understand the mechanisms involved.
Downstream effects of DELLA function
DELLAs have been shown to exert their function through protein-protein interaction. For
example, DELLAs inhibit the action of phytochrome interacting factors PIF3 and PIF4. PIF3
and PIF4 are transcription factors involved in phytochrome-mediated signalling in response
to light. GA-mediated degradation of DELLA releases PIF3 and PIF4 inhibition, allowing the
promotion of expression of the PIF3 and PIF4 target genes as well as yet uncharacterised
growth promoting genes (Feng et al., 2008; De Lucus et al., 2008). A further three
transcription factors have been shown to interact with DELLA in Y2H assays: PIF1, SPATULA

21
(SPT), and phytochrome-interacting factor 3-like 2 (PIL2, Gallego-Bartolome et al., 2010).
PIF1, PIF3, SPT, and PIL2 contain basic helix loop helix (bHLH) structures, suggesting this
structure may be important for DELLA interaction.
DELLAs lack recognised DNA binding domains, suggesting they are unlikely to interact
directly with genomic DNA to elicit expression responses. Domain analysis, chromatin
immunoprecipitation (ChiP) and expression studies have shown DELLAs act as transcriptional
regulators, controlling plant development through repression of transcription factor action
and function (Dill et al., 2004; Zentella et al., 2007). It is suggested that DELLA promotes the
expression of genes encoding ubiquitin enzymes and abscisic acid (ABA). As ABA is
antagonistic to GA function, DELLA proteins are able to control GA-mediated growth via
manipulation of GA and ABA pathways (Zentella et al., 2007). DELLA mediates between GA
and ABA pathways via the XERICO gene, which upregulates ABA expression in response to
stress. Furthermore, using ChiP analysis Arabidopsis RGA has been shown to bind to the
promoters of eight GA response genes either individually or as part of a complex (Zentella et
al., 2007). Despite several approaches taken by several groups, the number of genes
targeted by DELLA remains unclear, and differential results obtained may reflect the fact
that DELLAS are likely to regulate different genes both temporally and spatially (Hartweck,
2008).
1.4.4 GA-DELLA signal transduction pathway mutants
Mutations in genes involved in the GA signalling pathway produce dwarf, semi-dwarf and
slender phenotypes (Hooley, 1994; Hedden, 2003). Dwarf varieties are classified as mutants
with a plant height less than 50% of that of the wild-type plant, and semi-dwarf as having a
height between 50% and 100% that of the wild-type (Hedden, 2003). The dwarf phenotype
is characterised by short stature, reduced internode length and short broad leaves (Harberd
& Freeling, 1989; Falk, 1994). Slender mutants have a phenotype similar to a wild-type plant
that has been treated repeatedly with exogenous GA (Hooley, 1994). Slender plants are
infertile, and have elongated epidermal cells, resulting in a tall, narrow whole plant
phenotype with elongated internodes (Schünmann et al., 1994). In cases where the slender
phenotype is not caused by the overproduction of GA, the plant is a GA constitutive
response mutant. The occurrence of these mutants is rare by comparison with dwarf and
semi-dwarf mutants (Hooley, 1994).

22
1.4.5 DELLA mutants
GA-DELLA signalling transduction mutants have been extensively characterised in crop and
model plants, with dominant or semi-dominant GA insensitive DELLA dwarf mutants found
in Arabidopsis, wheat, maize, rice and barley, as well as a smaller number of recessive LoF
mutants, discussed more fully in Chapter 3.
Arabidopsis DELLA mutants
Arabidopsis has five DELLA genes: RGA (REPRESSOR OF ga1-3), GAI (GA-INSENSITIVE), RGL1,
RGL2 and RGL3 (RGA-LIKE1, 2 and 3, respectively), (Wen & Chang, 2002; Zentella et al.,
2007). Arabidopsis DELLA mutants exhibit a cumulative effect on plant phenotype, although
the redundancy associated with the five homologous DELLA genes makes the effect of a
mutation at a single locus difficult to determine. This is illustrated by GAI and RGA, which are
highly homologous, and appear to have partially redundant or overlapping functions, with
plants containing single null mutations at these loci exhibiting a wild-type phenotype (Dill &
Sun, 2001; Peng et al., 1997; Silverstone et al., 1998; Willige et al., 2007). The gai-1 gain of
function (GoF) mutant results from a deletion within the conserved DELLA domain of the GAI
DELLA protein (Peng et al., 1997). gai-1 is unresponsive to the application of exogenous GA,
and exhibits phenotypic characteristics typical of dwarfed growth mutants, including
reduced height, dark green colour and late flowering (Willige et al., 2007). The Arabidopsis
“quadruple-DELLA mutant” lacks GAI, RGA, RGL1 and RGL2, four of the five Arabidopsis
DELLAs (Achard et al., 2006). These mutants bolt and flower earlier than wild-types, and are
significantly taller in comparison. The quadruple-DELLA mutant exhibits full petal and
stamen growth, and produces fertile flowers and seeds. The “global DELLA mutant” plants in
which all five genes are disrupted (Koini et al., 2009) have a similar phenotype but also
exhibit parthenocarpic fruit development.
Wheat DELLA mutants
The alleles that produced the increased yield and semi-dwarfing trait characterised by the
Green Revolution are the DELLA orthologues Rht-B1b (formerly Rht1) and Rht-D1b (formerly
Rht2) located on the 4B and 4D genome chromosomes respectively (Peng et al., 1999,
Muangprom et al., 2005). Wheat is hexaploid, with three homeologous sets of
chromosomes, referred to as the A, B and D genomes. The hexaploid nature of wheat makes
the study of GA signalling more problematic than in model diploid organisms such as barley
or rice. Both the Rht-B1b and Rht-D1b mutants have a mutation within the DELLA domain

23
(Peng et al., 1999) resulting in a GoF mutant that exhibits a semi-dwarf phenotype due to
reduced GA sensitivity, similar to that seen in the gai mutant. Each mutant allele produces a
similar effect on plant height, and their effect is additive (Hedden, 2003). Further Rht mutant
alleles have been identified. The Rht3 allele (RhtB1c, Pearce et al., 2011; Wu et al., 2011),
contains a 30 amino acid insertion within the DELLA domain causing a severe dwarf
phenotype. The extreme dwarfing seen in Rht10 (RhtD1c) plants is a result of overexpression
of the D1b allele caused by an increase in gene copy number (Pearce et al., 2011).
Rice DELLA mutants
Rice shares many similarities in the GA signalling pathway with Arabidopsis, however rice
contains a single DELLA gene, SLENDER RICE-1 (SLR1), in contrast to Arabidopsis which
contains five. The rice genome is small and has been entirely sequenced. These factors make
it a good candidate to link model plant work with crop applications. With its single DELLA
gene, rice produces either a strong or weak growth phenotype rather than a cumulative one,
making the effect of any mutation simpler to determine. The slr1 mutant protein was the
first mutant protein to be characterised that produced a slender, LoF phenotype (Ikeda et
al., 2001). The slr1-1 to slr-1-4 mutants result from mutations in the GRAS domain of the
DELLA gene, resulting in a slender phenotype similar to that of a constitutive expresser of
GA, whereas truncation of the DELLA motif in SLR1 (pSLRtr) produced a dwarf phenotype
(Ikeda et al., 2001).
Barley DELLA mutants
As with rice, both GoF and LoF DELLA mutants exist in barley. The mutant sln1d is a GoF
dwarf mutant orthologous to Rht-B1b and Rht-D1b mutants in wheat (Peng et al., 1999) and
gai1 and gai2 in Arabidopsis (Peng et al., 1997; Koorneef et al., 1985; Chandler et al., 2002).
The sln1d dominant dwarf phenotype results from a mutation in the DELLA domain,
encoding a DELLA protein which is stable even in the presence of GA. Conversely, the sln1c
recessive slender phenotype results from a mutation in the GRAS domain (Chandler et al.,
2002). Plants homozygous for the sln1c mutant allele have increased leaf extension rate and
long, attenuated light green leaves. Epidermal leaf cells are narrow and elongated compared
with those of the wild-type phenotype (Foster, 1977; Schünmann et al., 1994). Anthocyanin
pigmentation of the leaf sheaths and stem nodes is much more pronounced in the mutant
compared with that of the wild-type (Foster, 1977). In terms of aspects of growth, barley
slender plants exhibit many phenotypes similar to those of wild-type plants exposed to

24
exogenous (applied) GA, however, the endogenous concentrations of bioactive GA1 and GA3
in the mutant plants is much lower than those of wild-type varieties. This suggests that GA
overproduction is not linked to slender phenotype; rather the mutant is a GA response
mutant (Schünmann et al., 1994). The production of fertile seed by slender barley is
impaired due to male sterility (Schünmann et al., 1994). Barley mutants are described
further in Chapter 3.
1.4.6 GID1 and GID2 mutants
GID1 mutants
Arabidopsis contains three homologous GID1 genes: AtGID1a, AtGID1b and AtGID1c. Loss of
gene function of the three genes in a single plant produces an extreme GoF mutant,
characterised by an extreme dwarf phenotype and insensitivity to the addition of exogenous
GA (Griffiths et al., 2006; Willige et al., 2007).
GID1-GA recognition and GID1 function is integral to DELLA degradation via the GA-DELLA
signal transduction pathway. The GID1 receptor was first identified in rice along with the
mutant allele gid1 (Ueguchi-Tanaka et al., 2005), which exhibited an extreme dwarf
phenotype with wide dark-green leaves, and insensitivity to the addition of exogenous GA.
In wild-type plants, GA production is inhibited and catabolism promoted when bioactive GA
levels exceed a homeostatic threshold, however, this mechanism is absent in rice gid1
mutants (Ueguchi-Tanaka et al., 2005). Of eight gid1 mutants characterised, six were severe
dwarfs, one, a moderate dwarf and one had a mild dwarf phenotype with only the last
producing fertile seed (Ueguchi-Tanaka et al. 2007).
In barley, sixteen gse1 (orthologous to GID1) mutants (gse1a to gse1p) were generated from
a sodium azide treated population. Each mutant carried a unique single nucleotide
substitution resulting in a single amino acid (aa) change in each of the gse1 mutant proteins,
with the exception of one mutant that contained a substitution in the 5’ untranslated region
(UTR) close to the translation initiation site. All of the gse1 mutants exhibited reduced
sensitivity to exogenous addition of GA3, and had phenotypes ranging from mild to severe
dwarf. Although the severe dwarfs had reduced grain set all were fertile (Chandler et al.,
2008). Currently characterised GID1 alleles are shown in Table 1.1.

25
Table 1.1 GID1 genes of the GA-DELLA signalling pathway involved in growth regulation.
Species Allele Identified mutants Reference
Barley Gse1 gse1a to gse1p Chandler et al., 2008
Rice GID1 gid1-1 to gid1-4 Ueguchi-Tanaka et al., 2005
Arabidopsis AtGID1a to AtGID1c Atgid1a to Atgidc Griffiths et al., 2006
GID2 mutants
The rice gid2 mutants exhibit a similar phenotype to that of the gid1 mutants, being GA-
insensitive with wide, dark green leaves, and a severe dwarf phenotype. DELLA accumulates
in gid2 mutants, even after GA treatment, whilst DELLA in wild-type plants is rapidly
degraded (Sasaki et al., 2003). Similarly, the Arabidopsis sly1 mutant is a GA-insensitive
dwarf mutant, with a phenotype similar to other GA insensitive mutants, including increased
seed dormancy, dark green tissue colour, delayed flowering and reduced fertility (McGinnis
et al., 2003). Currently characterised GID2 alleles are shown in Table 1.2.
Table 1.2 GID2 genes of the GA-DELLA signalling pathway involved in growth regulation.
Species Allele Identified mutants Reference
Rice GID2 gid2 Sasaki et al., 2003
Arabidopsis SLY1 sly1 McGinnis et al., 2003
1.5 Abiotic stress tolerance
1.5.1 Pressures on agriculture
The increase in crop production seen during the Green Revolution is being matched by the
needs of an increasing world population (Khush & Virk, 2002). Global climate change is an
increasing threat to crop production, reducing yields through plant damage and reducing the
availability of agricultural land due to soil erosion, urbanisation and industrialisation (Khush,
1999; Vinocur & Altman, 2005; Ericsson & Nilsson, 2006). Environmental stress, especially
salinity and drought, are the primary cause of crop losses worldwide (Vinocur & Altman,
2005). A common feature of abiotic stress is limitation of water availability. Water has an
26
essential biological role as a transport medium for nutrients and plant metabolites, as an
electron donor in the Hill reaction of photosynthesis, and as an evaporative coolant (Bohnert
et al., 1995). Plants live in fixed locations and must survive adversity by responding to
diverse environmental signals (Achard et al., 2006). Understanding the mechanisms that
allow plants to survive such stresses whilst identifying key yield and quality genes and
assimilating them into agricultural populations is integral to meeting the needs of a growing
world population.
1.5.2 Reactive oxygen species (ROS)
ROS are produced by plants as a consequence of environmental stress, and at high levels,
their accumulation leads to plant damage. Initially believed to be solely deleterious to plant
health, reactive oxygen species (ROS) have latterly been identified as integral to plant
development, acting as signal transduction molecules controlling processes including
growth, development, response to biotic and abiotic environmental stimuli, and
programmed cell death (PCD) (Mittler, 2002; Bailey-Serres & Mittler, 2006). ROS are
generated as a consequence of aerobic metabolic processes such as respiration and
photosynthesis (Apel & Hirt, 2004). Under normal growth conditions ROS homeostasis is
maintained by the interplay between ROS producing and ROS scavenging mechanisms
(Mittler, 2002), however under stress conditions levels of ROS may increase to the point
whereby homeostasis cannot be maintained, resulting in membrane lipid peroxidation,
enzyme inhibition, and DNA and RNA damage (Mittler, 2002; Fridovich, 1986). Cell death
occurs through extensive oxidative damage, or through ROS-mediated activation of PCD
pathways (Mittler, 2002). Plants minimise oxidative stress by producing antioxidants and
ROS detoxifying enzymes, which interrupt cascades of uncontrolled oxidation (Noctor &
Foyer, 1998). The importance of ROS detoxifying enzyme activity is highlighted by the
Arabidopsis mutant, pst1, which has enhanced superoxide dismutase (SOD) and ascorbate
peroxidase (APX) activities, conferring significantly increased tolerance to salt induced
oxidative stress (post germination) compared to the wild-type (Tsugane et al., 1999).
1.5.3 Salt stress
Salt imposes a major constraint on global crop production (Botella et al., 2005), affecting an
estimated 20% of agricultural land and 40% of irrigated land worldwide, with a further 1000
27
km2 and 150 km2, respectively lost annually as a result of human activity and environmental
processes (World Health Organisation, 2005; Khan et al., 2006). Irrigation is the primary
manmade cause of salinisation, particularly on agricultural land reliant on groundwater
based irrigation systems, as excessive use causes the water table to rise, drawing
contaminated groundwater towards the topsoil (Utset & Borroto, 2001). Areas of high crop
productivity are disproportionally affected, as despite optimal day length and temperature,
irrigation is frequently used to compensate for limited rainfall (Aus der Beek et al., 2010).
Lesser causes of salinisation include the long term addition of livestock manure, run off from
neighbouring environments (e.g. road salt), land clearance and waterlogging (Abrol et al.,
1988; Chang et al., 1990). Coastal regions are prone to salinisation, due to the potential for
seawater contamination of groundwater, and by encroachment of seawater upon
agricultural land (Milnes & Renard, 2004). Salinisation also occurs through gradual natural
processes such as salt transportation and deposition by wind movement (Aeolian processes),
and soil erosion (Rengasamy, 2006). The dissociation of sodium chloride in aqueous soil
environments produces sodium ions (Na+), the accumulation of which leads to the
alkalinisation and sodification of soils which is problematic to agriculture (Van Breemen et
al., 1983).
The majority of modern grain crops are derived from plants lacking the genetic basis for salt
tolerance (Glenn & Brown, 1999; Munns et al., 2006). These plants, termed glycophytes,
comprise 99% of the world’s flora and are susceptible to even low levels of salinity (ECe <4
dS m-1) (Flowers & Colmer, 2008; Chinnusamy, et al. 2005). Glycophytes are able to adapt to
higher levels of salinity, provided the salinity is increased in moderate increments (Botella et
al., 2005). A high priority for plant biologists is the identification of naturally-occurring salt
tolerant varieties through laboratory and field assessment, coupled with genomic analysis
and the use of genetic modification to confer increased resistance (Gale, 2003).
1.5.4 Heat stress
Heat stress as a result of increases in ambient temperature threatens global crop production
(Hall, 2001). Although predictions as to the degree of climate change vary due to differences
in the climate models used, the Intergovernmental Panel on Climate Change (IPCC) predicts
an increase of ~0.2 °C per decade over the next two decades (Christensen et al., 2007).
Increases in climate change are widely believed to be the result of manmade activity, namely

28
the atmospheric release of the greenhouse gases: methane, carbon monoxide, nitrous
oxide, CFCs and carbon dioxide (Lashof & Ahuja, 1990). Heat stress commonly refers to high
temperature for sufficient time to cause irreversible damage to plant growth and
development, however lesser heat stress levels may also cause damage by increasing the
rate of reproductive development resulting in a reduction of the photosynthetic contribution
to seed production, thereby decreasing fruit or grain yields. Although the duration of the
heat stress is important, transitory high temperatures, especially at developmentally-
susceptible stages, can cause an array of morphological and physiological changes that
frequently result in decreased crop yields. One example of this is the sterility in wheat
caused by high temperature at anthesis (Ferris et al., 1998). Plant responses to heat stress
have been investigated extensively, with induction of heat shock proteins (HSP) and other
stress-related proteins, as well as the causes of ROS production receiving the most attention.
Plant response to heat stress has been reviewed by Wahid et al. (2007). High temperature
can also indirectly affect plants by reducing water content of soils through evaporation,
which increases solute concentration and soil salinity thereby exposing plants to drought
and salinity stress, which reduces seed germination. (Hillel, 1998; Lee & Zhu, 2010;
Khodarahmpour & Motamedi, 2011; Sharma et al., 2004)
1.5.5 Abiotic stress perception
Salt stress perception
Plants sense saline conditions primarily through ion specific signals (in the form of Na+ and
ROS), and signals resulting from changes in osmolarity (Chinnusamy et al., 2005; Mittler,
2002; Zhu, 2003). Na+ is sensed by external membrane receptors, internal membrane
proteins, or by cytosolic Na+ sensitive enzymes, e.g. SOS1 (Salt Overly Sensitive 1), (Zhu,
2003).
Changes in osmotic pressure affecting plasma membrane fluidity trigger cell stress
responses. Under hyperosmotic stress conditions, the cell membrane contracts, eventually
retracting from the cell wall (Lang-Pauluzzi, 2000). This retraction is sensed by
transmembrane protein kinases and stretch activated channels (Cosgrove & Hedrich, 1991;
Urao et al., 1999). Stretch activated channels have been identified which allow Cl-, K+, and
Ca2+ to permeate the cell (Cosgrove & Hedrich, 1991), allowing specific ion uptake to be
regulated under osmotic stress conditions.

29
Calcium functions as a major signalling molecule, mobilising plant response to generic
abiotic stress responses via the mitogen-activated protein kinases (MAPK), and Ca2+-
dependent protein kinase (CDPK) signalling cascades (Kader & Lindberg, 2010; Sung et al.,
2003). Increased calcium supply has been shown to reduce the effect of salt stress by
alleviating sodium toxicity via increased K+ and Ca2+ assimilation and reduction of cellular
levels of Na+ (Zhu, 2000). Cytosolic Ca2+ levels increase in response to salt stress as a result of
extracellular or intracellular perception by the cell membrane (Knight et al., 1999).
Membrane depolarisation and cytosolic Ca2+ accumulation signal downstream salt stress
responses, with Ca2+ likely to activate signalling pathways for K+ and Na+ transport, allowing
homeostatic maintenance of K+ and Na+ through influx, efflux and compartmentalisation
(Xiong & Zhu, 2002; Zhu, 2002).
Heat stress perception
Despite the characterisation of multiple plant responses to increases in temperature, the
actual mechanisms of heat stress perception and the identity of the early components of the
temperature signal transduction pathway are largely unknown (Penfield, 2008; Murata &
Los, 1997). Observations of temperature perception in microbial organisms form the basis of
understanding temperature perception in higher plants. It is proposed that membrane
fluidity is the primary mechanism of temperature perception (both high and low
temperature), with sensors capable of detecting physical phase transition located in the
microdomains of membranes, leading to conformational changes and/or
phosphorylation/dephosphorylation cycles (Plieth, 1999). The role of membrane fluidity in
temperature tolerance has been investigated using mutation analysis, and transgenic and
physiological studies (Sung et al., 2003). Mutants of Arabidopsis and soybean deficient in
fatty acid unsaturation exhibit increased tolerance to high temperature, (Alfonso et al.,
2001; Hugly et al., 1989), and increases in lipid saturation in tobacco caused by the silencing
of a ω-3 desaturase gene also conferred high temperature tolerance (Murakami et al.,
2000). Based on the expression profile of heat-shock genes, rigidification of the thylakoid
membrane and not the plasma membrane appears to trigger temperature stress response
(Horváth et al., 1998). The thylakoid membrane would be an appropriate sensor for
temperature change, as it is both temperature sensitive due to its unsaturated structure,
and is close to photosystems, which are particularly prone to damage by temperature
change (Sung et al., 2003).

30
As with salt tolerance, calcium plays a key role in temperature tolerance, Ca2+ influx rapidly
increases during the plant recovery phase after heat shock. The importance of high levels of
cytosolic Ca2+ is illustrated in Arabidopsis, where treatment with calcium channel blockers
and calmodulin inhibitors increased the degree of heat induced oxidative damage
(Larkindale & Knight, 2002). As with salt response, calcium activates the MAPK and CDPK
signalling pathways, activating generic abiotic stress response (Sung et al., 2003). The
expression of the Heat-Shock Factor (HSF) class of transcription factors increases in response
to heat shock stimulus. HSFs bind to conserved Heat-Shock Elements (HSEs) in the
promoters of genes which mitigate the effects of high temperature induced damage (Wu,
1995).
1.5.6 Abiotic stress tolerance
1.5.6.1 General mechanisms of abiotic stress tolerance
Mechanisms of plant defence against abiotic stress
Prolonged exposure to adverse environmental conditions prevents plants from attaining
their full potential (Boyer, 1982). For example, reduced access to water can lead to a decline
in plant function, and will ultimately result in plant death. Similarities in response shown by
both vascular and non vascular plants, and the conservation of common sets of genes and
proteins associated with stress tolerance, suggest plants have an encoded capability for
stress perception and response (Bohnert et al., 1995). Plant response to environmental
stress is coordinated by a complex series of cascade reactions that regulate molecular
networks (Cushman & Bohnert, 2000). These reactions activate stress response mechanisms
that re-establish homeostasis preventing further damage to the plant, and instigate
mechanisms to repair damage to proteins and membranes (Vinocur & Altman, 2005).
Antioxidant compounds
Antioxidants act both non-enzymatically and as substrates in enzyme catalysed ROS
detoxification reactions (Grene, 2002). Ascorbic acid (AsA), glutathione (GSH), and α-
tocopherol are well characterised antioxidants. Evidence for the role of antioxidants in
protecting plants from oxidative stress has emerged from observations of stress response
and localisation of antioxidants. Antioxidants have been found in high concentrations in
highly metabolically active organelles. AsA and GSH levels were found in high concentrations

31
in the chloroplasts of pea, spinach and barley species (5-20 mM AsA and 1-5 mM GSH),
suggesting a crucial role in preventing ROS and free radical accumulation (Noctor & Foyer,
1998). Antioxidant expression levels are closely related to the metabolic state of the cell and
changes in environmental conditions (Stöhr & Stremlau 2006; Mullineaux et al., 2006;
Ahmad et al., 2008). AsA directly scavenges 1O2, O2-∙ and ∙OH, regenerates tocopheroxyl from
the tocopheroxyl radical, and acts as a co-factor in enzymatic ROS detoxification reactions
(Smirnoff, 2000; Ahmad et al., 2008). Oxidative stress activates the expression of genes
responsible for the synthesis of tocopherols in higher plants, preventing lipid auto-oxidation
by free radicals (Wu et al., 2007; Ahmad et al., 2008). Anthocyanins accumulate in the
Arabidopsis leaves in response to salt stress, suggesting a role in mediation of abiotic stress
(Xiong & Zhu, 2002).
ROS detoxifying enzymes
ROS detoxifying enzymes are fundamental to the prevention of oxidative damage caused by
the build up of ROS. SOD, APX and catalase (CAT) activity maintain a homeostatic balance of
superoxide radicals and hydrogen peroxide. The difference in affinities of APX (µM range)
and CAT (mM range) for H2O2 suggest APX may control the fine modulation of ROS for
signalling, whilst CAT is responsible for the removal of ROS during periods of high stress. ROS
scavenging pathways are present in almost all cellular compartments, with the APX-
mediated ascorbate-glutathione cycle being the most ubiquitous, suggesting ROS is finely
controlled in most cellular compartments (Mittler, 2002). CAT is solely present in the
peroxisomes, which proliferate during periods of high stress (Lopez-Huertas et al., 2000).
SOD converts O2- to H2O2, preventing immediate oxidative damage, and allowing further
conversion by APX, glutathione peroxidise (GPX) and CAT to water and diatomic oxygen
(Mittler, 2002).
Physiological adaptations to counter abiotic stress
Anatomical adaptations such as leaf movement and curling, development of a refracting
epidermis and hiding of stomata in specialised structures allow plants to adjust to abiotic
stress and thereby avoid ROS production (Mittler, 2002).
Enhancement of abiotic stress resistance
Efforts to improve abiotic stress tolerance have had limited success due to the physiological
and genetic complexity of the trait (Flowers, 2004; Sung et al., 2003; Vij & Tyagi, 2007), with

32
the molecular networks involved in stress perception, signal transduction, and expression of
stress related genes and metabolites being both complex and interdependent (Vinocur &
Altman, 2005). Attempts to integrate stress tolerance into agricultural lines via traditional
breeding methods has had limited success due to the negative linkages that exist between
stress tolerance and yield (Flowers, 2004). Several genes encoding plant antioxidant
enzymes have been characterised and used in the construction of transgenic lines (Sarowar
et al., 2005). Plants with high levels of antioxidants, either through induction or constitutive
expression of these genes, have generally exhibited greater resistance to oxidative damage
than plants with lower levels (Bailey-Serres & Mittler, 2006). Arabidopsis genetically
engineered to over-produce reactive oxygen-scavenging osmolytes showed enhanced
tolerance to salt, cold and heat stresses (Hayashi et al., 1997), whilst the ozone-sensitive
Arabidopsis mutant, soz1 (now known as mutant vitamin c1; vtc1), exhibiting decreased
levels of AsA, was more sensitive to oxidative stress than the wild-type (Conklin et al., 1996).
Overexpression of the Arabidopsis gene nucleoside diphosphate kinase 2 (AtNDPK2),
encoding a protein that has ROS detoxifying function, enhanced tolerance to saline and
oxidative stress in transgenic Arabidopsis (Moon et al., 2003), whilst overexpression of the
antioxidant β-carotene hydroxylase produced increased tolerance to oxidative stress
induced by high light conditions (Davidson et al., 2002). Other studies found no benefit or
even a cost in over-expressing antioxidant compounds and enzymes. Over-expression of SOD
in tobacco chloroplasts provided no additional tolerance to oxidative stress, suggesting
other antioxidant mechanisms may be limiting (Allen, 1995), whilst enhanced GSH
biosynthesis in tobacco chloroplasts resulted in increased oxidative damage to cells, likely
due to alteration of the overall redox state of chloroplasts (Creissen et al., 1999). These
studies suggest that, if a genetic manipulation approach is taken, it may be important not to
search for the “best” gene, but to optimise the timing or strength of expression, for example
by using inducible promoters. Many target genes have been identified by changes in
expression under abiotic stress and one of the most studied group is the DREBs/CEBs
transcription factors (dehydration responsive element binding proteins/C-repeat binding
proteins). DREB expression is upregulated by water, cold and salt stress and the proteins
bind to drought, cold and salt stress responsive promoter elements, therefore playing a
central role in abiotic stress response (Liu et al., 1998). Constitutive over-expression of these
genes resulted in reduced barley yield in the absence of water stress (Morran et al., 2011)
However, when TaDREB2 or TaDREB3 were expressed from the maize Rab17 promoter in
wheat, there was little or no expression in well watered conditions, but high expression

33
when drought stress was applied. Expression levels rapidly returned to normal on watering,
with the result that plants grew normally when well watered. Trials of these plants are
underway in Australia to determine whether these lines will respond well under less defined
conditions (Lopato & Langridge, 2011).
1.5.6.2 Salt stress tolerance
Maintenance of osmotic homeostasis
Plant roots absorb water by exploiting the difference in osmotic potential between root
epidermal cells and the surrounding soil environment. Uptake of water from saline soils is
maintained through the controlled uptake of Na+ ions counterbalanced with negatively
charged ions, usually Cl-. Under normal or low salinity soil conditions, the solute
concentration within the root is higher than that of the surrounding soil, and water is drawn
into the root. In saline soils, this osmotic balance is disturbed, resulting in a decrease in
water intake into the roots. In extreme saline conditions, hyperosmolarity may occur,
whereby water is drawn out of the roots into the soil resulting in dehydration of the roots
and physiological drought effects (Botella et al., 2005; Xiong & Zhu, 2002). Drought increases
the salinity of the soil solution, as lower water availability increases salt concentration
(Moore, 2008). Root cells mediate changes in water potential by facilitating water
movement, controlling ion entry and efflux from the cytosol, sequestering ions once in the
cytosol, and by producing osmoprotectants to counteract osmotic imbalance. When water
availability is limited, plants restrict growth through hormone signals generated by the roots
(Munns, 2002), thereby increasing the likelihood of plant survival.
Root cells respond to external increases in solute concentration by synthesising
osomoregulatory compounds such as osmolytes (organic solutes) and late embryogenesis
abundant (LEA) proteins. Osmolytes, which include proline, glycine-betaine, trehalose, and
sugar alcohols such as mannitol and sorbitol, are abundantly produced in cells undergoing
salt stress and have a key role in reducing the water potential of the cytosol (Sahi et al.,
2006). Osmolytes may act as inert osmoprotectants which decrease osmotic potential
without disturbing metabolic functions, or may act as free radical scavengers and, in concert
with HSP, as stabilisers of membranes and proteins (Vinocur & Altman, 2005). Arabidopsis
transformed to express the bacterial codA gene encoding choline oxidase, which converts
choline to the osmolyte glycinebetaine, showed increased tolerance to salt stress during
34
germination and seedling growth phases (Hayashi et al., 1997). However, further attempts
to genetically engineer glycophytes to increase osmolyte expression resulted in only a
marginal increase in salt tolerance, suggesting osmolyte production is not a limiting factor
for salt tolerance. In contrast, Garg et al. (2002) reported that T4 generation rice plants
transformed with the E. coli trehalose biosynthetic genes otsA and otsB survived and grew
better under low temperature, salt and drought stress. These lines also maintained a higher
level of selectivity for K+ over Na+ uptake in the roots and Na+ exclusion in the shoots than
non-transformed controls and showed improved photosystem II function.
Sudden changes in soil salinity can cause osmotic shock due the sudden influx or efflux of
water across the cell membrane. Severe osmotic shock can disrupt substrate transport and
result in damage to the membrane. Aquaporins facilitate the rapid transport of water
between the cytosol and the external environment allowing water uptake or relieving
osmotic pressure (Tyerman et al., 1999). Aquaporins may aid the uptake of water by root
cells under drought or unfavourable osmotic conditions. Aquaporins may be gated through
interaction with Ca2+ and gating proteins, providing a further level of osmotic control (Azad
et al., 2004).
Detection of salinity by root cells upregulates the biosynthesis of the plant stress hormone
ABA. ABA is then translocated to the leaves where it regulates the osmotic potential of
stomatal guard cells, rapidly closing stomata to prevent water loss and the transpirational
pull of water from roots to the leaves, thus maintaining a favourable osmotic potential in
root cells. Furthermore, control of transpiration limits salt ions to the vacuoles in shoots,
minimising damage to areas of high metabolic activity (Apse et al., 1999). ABA responds to
salt stress by restricting growth and germination, maintaining ion and osmotic homeostasis,
and regulating stress damage control and repair (Koornneef et al., 1984; Zhu, 2002,
Chinnusamy et al., 2005). ABA contributes to salt stress induced growth inhibition by
enhancing DELLA restraint (Achard et al., 2006).
The Salt Overly Sensitive (SOS) signalling pathway has a key role in exporting Na+ through the
Na+/H+ antiporter system. Cytosolic Ca2+ accumulation results in increased SOS3
accumulation. SOS3 binds to Ca2+ activating the protein kinase SOS2. The SOS3-SOS2
complex increases SOS1 expression and activates the SOS1 protein, a Na+/H+ antiporter that
exports Na+ from the cell. The SOS pathway may also regulate other transporters at a post-
35
translational level to maintain ion homeostasis (Zhu, 2000). SOS1 activity is ubiquitous to
virtually all plant tissue, but activity is greatest in root epidermal cells, particularly at the
root tip and the cells surrounding the xylem, suggesting Na+ is loaded into the xylem for
transport away from the root cells (Shi et al., 2002b). Over-expression of SOS1 improved salt
tolerance in Arabidopsis (Shi et al., 2002a, b), likely due to interaction with RCD1 (Radical-
Induced Cell Death1), which protects cells against oxidative damage caused by the ROS
molecule hydrogen peroxide (Katiyar-Agarwal et al., 2006). An Arabidopsis mutant of AtSOS1
exhibited salt sensitivity coupled with the death of root cells under salt stress conditions (Oh
et al., 2010). It has also been proposed that SOS1 may act as a plasma membrane Na+
sensor, based on the presence of 10 – 12 transmembrane tails and a long cytoplasmic tail
(Zhu, 2003). A further Na+/H+ antiporter system, AtNHX, has been characterised in
Arabidopsis, controlling Na+ sequestration to the vacuole via an ABA-dependent mechanism
(Yokoi et al., 2002). Overexpression of the AtNHX5 gene in paper mulberry plants resulted in
increased salt tolerance (Li et al., 2011) and expression of the yeast Na+/H+ membrane
antiporter (SOD2) gene in rice also conveyed increased salt tolerance, likely through
increased root proton export capacity, increased photosynthetic capability, and reduced ROS
generation (Zhao et al., 2006). The SOS pathway may have a further role in salt stress
tolerance through interaction with pathways controlling cell division and expansion, and
crosstalk with other stress signalling pathways (Zhu, 2000).
Competition for ion uptake
Root cells must absorb nutrient ions despite the prevalence of toxic ions in the surrounding
environment. For most plants, sodium is not a limiting factor in plant growth; however,
potassium is an essential nutrient (Blumwald et al., 2000, Mäser et al., 2002). Na+ and K+ ions
have a similar radius and ion hydration energy, leading to competition for cellular uptake,
particularly where the external concentration of Na+ is higher than K+ (Niu et al., 1995;
Rodríguez-Navarro, 2000). Na+ may enter root cells through the high-affinity K+ transporter
HKT1, non-selective cation channels, and Na+ leakage into the transpiration stream via the
apoplast (Zhu, 2003). High K+:Na+ ratio is maintained by primary active transport mediated
by H+-ATPases, and secondary transport mediated by channels and co-transporters (Zhu,
2003).

36
1.5.7 DELLA and abiotic stress tolerance
DELLAs and response to abiotic stress
DELLA mediates response to environmental stress by limiting growth and up-regulating
expression of ROS detoxifying enzymes in environmentally unfavourable conditions, allowing
plants to respond to environmental changes through regulation of DELLA activity (Achard et
al., 2006). Wild-type plants show decreased levels of GA and increased levels of DELLA in
response to salt stress, resulting in inhibited growth. Growth inhibition is beneficial to
survival as smaller plants have a lower requirement for resources, and are thereby able to
survive in environments where resources are scarce. The effect of environmental stress on
DELLA-mediated growth is illustrated by the DELLA GoF and LoF Arabidopsis mutants
subjected to salt stress. The growth and development of the tall “quadruple-DELLA mutant”
of Arabidopsis (lacking GAI, RGA, RGL1 and RGL2) is less inhibited by saline conditions when
compared with the wild-type, yet has a lower rate of survival to salt toxicity (Achard et al.,
2008a). In contrast, the gai dwarf mutant is able to survive saline conditions better than the
wild-type. DELLAs are also important in freezing tolerance. Using wild-type and DELLA
mutant lines Achard et al. (2008b) showed that the gai mutant was better able to withstand
freezing than the wild-type controls which, in turn, survived better than the double mutant
gai-t6/rga-24. Furthermore, this mutant was less tolerant even following cold acclimation.
The authors hypothesised that this tolerance may also be mediated through DELLA-
mediated suppression of ROS signalling.
DELLAs regulate root hair growth in Arabidopsis via a ROS dependent mechanism, with root
hair growth inhibited under salt stress conditions. Elongation of roots in the “quadruple-
DELLA” mutant in salt conditions suggests that RGL3 may play a role in growth inhibition
under stress conditions (Achard et al., 2006). Indeed, Achard et al. (2008b) provided
additional evidence for the involvement of RGL3 in cold stress response, with increased
expression of the gene reported in response to cold treatment. Furthermore, specific
enhancement of RGL3 expression in transgenic Arabidopsis expressing the CBF1 (C=repeat
drought responsive element binding factor) gene, underlined the importance of this protein
in stress tolerance, but also showed that the freezing tolerance mechanism was not through
the CBF regulon. Cold treatment increased the level of GA2ox1, GA2ox3 and GA2ox6
transcripts which led to a decrease in bioactive GA and an increase in DELLA protein which in
turn led to increased transcript levels for Ga3ox and Ga20ox through a feedback mechanism.
Treatment of barley with growth inhibitors which reduce GA biosynthesis and therefore

37
likely stabilise DELLA have been shown to confer tolerance to abiotic stress in barley (Sarkar
et al., 2004). It has long been reported that GA play a role in abiotic stress response and
recently Alonso-Ramirez et al. (2009) suggested that this was likely to be as a result of their
ability to increase salicylic acid (SA) biosynthesis. Since there is increasing evidence that SA
elicits plant defence reactions in several abiotic stress conditions (Horvath et al., 2007), the
authors hypothesized that DELLA proteins (and/or the absence of GA) restrain growth by
repressing SA biosynthesis. DELLAs have been shown to delay flowering in Arabidopsis by
means of two distinct mechanisms: 1) DELLA inhibits plant development, increasing the
duration of the vegetative phase 2) DELLA inhibits expression of the LEAFY (LFY) gene, a
proponent of floral development (Achard et al., 2004). Wild-type Arabidopsis plants growing
in saline conditions exhibit delayed flowering, through activation of both ABA and ethylene
signalling pathways whose effects are integrated at the level of DELLA response (Achard et
al., 2006). In contrast, “quadruple-DELLA” mutants growing in saline conditions flowered
earlier than wild-type plants under the same growth conditions. Saline conditions produced
total inhibition of flowering in GA deficient and insensitive mutants (ga1-3 and gai mutants;
Achard et al., 2006). The delay in flowering under stress conditions may negatively affect the
yield potential of plants and the link of DELLAs with flowering time has been reported in
crop plants. The semi-dwarfing wheat mutant alleles rhtB1b and rhtD1b have pleiotropic
effects on flowering time (Silverstone & Sun, 2000; Khush, 2001) with flowering delayed by
drought (Dr. M. Boulton, personal communication) and severely dwarfed mutants (rhtB1c
and rhtD1c) in which the DELLA proteins are highly stable, have markedly delayed flowering
(Dr. M. Boulton, personal communication). It is therefore clear that the use of DELLA
mutants in agriculture requires careful consideration to identify the alleles most suited to
the changing environment.

38
Chapter 2: Materials and Methods
2.1 Plant materials and plant culture
2.1.1 Seed origin
Wild-type and mutant barley (Hordeum vulgare) lines were used in this study. Wild-type
lines for cultivars Bowman, Golden Promise, Herta, Himalaya and Triumph, as well as the
mutant lines 380, 382 (cv Bowman), sln1-1 (cv Herta), gse1a, sln1c and sln1d (cv Himalaya)
were acquired from the John Innes Centre germplasm collection or from seed packets
available in the Boulton laboratory. Seeds of cv H930-36 wild-type and dwf2 mutant were
originally provided by Dr. D.E. Falk (University of Guelph, Ontario), but were available as
bulked seed in packets in the Boulton laboratory. During this study, further seed was
collected from dwarf, medium and wild-type size tillers from a single revertant chimeric
plant (termed dwf2-1) that spontaneously resulted from dwf2 seed. The cv Himalaya gse1j
and gse1n mutant seed was obtained from Dr. P. Chandler (CSIRO, Canberra), and had been
backcrossed eight times. The cv Triumph mutant seed was collected from 4 plants (γ-1, -2, -
3, -5). These plants were produced from seed collected from a plant that had shown a late
flowering phenotype identified during analysis of a population derived from γ irradiated
seed grown in field plots at the JIC (unpublished data, Dr. D. Laurie). The cv Bowman 827 and
885 mutant lines were obtained from Dr. A. Druka (Scottish Crops Research Institute,
Dundee).
To produce bulk seed stocks, seedlings were transferred to 2 L pots containing barley mix
compost (see Section 2.1.3.2) and grown in a glasshouse (see Section 2.1.2). Developing
plant heads (pre-anthesis) were contained in polyethylene bags to prevent cross-pollination.
Mature seeds were collected from desiccated plants.
2.1.2 Plant growth conditions
Growth cabinets (Sanyo MLR Plant Growth Chamber, Sanyo, Leicestershire, UK) were used
for the growth of seedlings used in genotype characterisation and heat shock experiments.
Plants were grown at 20 °C, 16 h light period; 8 h dark period, and relative humidity of 60%.
Irradiance was approximately 150 µmol m-2 s-1.

39
A Controlled Environment Room (CER) was used to germinate and grow seedlings preceding
and post heat shock treatment, and preceding and during hydroponics experiments.
Seedlings grown for characterisation of mutant phenotype were also grown in the CER.
Plants were grown at 20 °C, 16 h light period; 8 h dark period and relative humidity of 60%.
Irradiance was approximately 150 µmol m-2 s-1.
For transformation experiments, donor plants for embryo isolation and post-tissue culture T0
seedlings were grown as described by Harwood et al. (2008) in a CER with a 16 h light period
(500 µmol m-2 s-1 at mature canopy level provided by metal halide lamps (HQI)
supplemented with tungsten bulbs) and 80% humidity, with watering as required.
Transformed callus was regenerated in a tissue culture room. Plants were grown at 23 °C, 16
h light period; 8 h dark period and 60% humidity. Irradiance was approximately 150 µmol m-2
s-1.
2.1.3 Plant culture
2.1.3.1 Seed stratification
Seeds were stratified at 4 °C on a double layer of 90 mm filter paper (Sartorius Stedim
Biotech, Aubagne, France) in a standard Petri dish (Sterilin, South Wales, UK) with
approximately 8 ml sterile distilled water (SDW). After five days seed were sown in barley
mix compost and transferred to a controlled environment room to germinate (16 h
photoperiod, 20 °C day, 15 °C night), or for hydroponics based experiments, transferred to a
controlled environment room and germinated in the Petri dish.
2.1.3.2 Growth in soil
Barley was grown in 70 – 2000 cc plastic containers (Desch Plantpak, Waalwijk, The
Netherlands) in Barley Mix compost (JIC Horticultural Services, Appendix 1.1). Seeds were
stratified as described in Section 2.1.3.1, then germinated in 70 or 100 cc containers and
transferred to larger containers as they developed before root growth was constrained.
Barley mix compost was prepared as described in Appendix 1.1.

40
2.1.3.3 Growth in hydroponic culture
Plants were grown in hydroponic culture in modified Hoagland’s solution (Hoagland &
Arnon, 1950; Appendix 1.2). Seeds were stratified as described in Section 2.1.3.1 before
transfer to CER or growth cabinet conditions (see Section 2.1.2). Seedlings were gently
removed from the filter paper when roots were sufficiently developed (minimum length 2
cm) and held at the base of the stem by foam bungs, which were secured in 50 ml
polypropylene centrifuge tubes (Corning Incorporated, Corning, NY, USA) with the bases and
caps removed. These tubes were placed in custom steel racks, which in turn were placed in
10 L plastic containers (Tontarelli, Castelfidardo, Italy) containing Hoagland’s solution (x 0.5).
Seedlings were positioned randomly in the racks according to randomisation patterns
generated using GenstatTM ver. 10 (VSN International, UK), and grown for two days before
transfer to respective treatment solutions. Plants designated for salt treatment were
transferred to Hoagland’s solution (x 0.5) containing 100 - 500 mM NaCl dependent on the
treatment group, whilst control lines were transferred to fresh Hoagland’s solution (x 0.5).
Seedlings of a similar developmental stage were selected for treatment. Solutions were
aerated by daily transference of solutions between two containers, or by constant aeration
using air pumps (Rena Air 100 & 200, Rena Aquarium Equipment, Charlotte, NC, USA;
Tetratec APS 100, Spectrum Brands, Madison, WI, USA).
2.1.3.4 Growth media for transgenic plants
Media used for the production of transgenic barley plants (barley callus induction (BCI)
medium, barley transition (BT) medium, and barley regeneration (BR) medium), were
prepared as described in Appendix 1.3.
2.1.4 Isolation of plant nucleic acid
2.1.4.1 Isolation of plant genomic DNA
Young leaf material was collected from seedling and mature plants for DNA extraction. DNA
was extracted immediately, or leaf material was immediately flash frozen in liquid nitrogen
and stored at -80 °C for subsequent extraction. DNA was isolated using the modified cetyl
trimethylammonium bromide (CTAB) method described by Sambrook & Russell (2001) or

41
using the DNeasy Plant Mini Kit (Qiagen, West Sussex, UK) according to the manufacturer’s
instructions.
A modified version of the Edwards et al. (1991) protocol was used to extract DNA from
transgenic barley lines. The following amendments were made: upon harvesting, tissue was
macerated in liquid nitrogen rather than at room temperature (rt). All centrifugation steps
were carried out at 4 °C. After treatment with extraction buffer, samples were centrifuged
for 3 min instead of 1 min. After addition of isopropanol, samples were incubated on ice
rather than at room temperature. The DNA pellet was air dried and was dissolved in 0.1 x TE
instead of 1 x TE buffer.
2.1.4.2 Isolation of plant RNA
Plant tissue samples were flash frozen in liquid nitrogen immediately after harvesting and
subsequently stored at -80 °C prior to RNA isolation. Frozen tissue samples were ground to
powder in liquid nitrogen in autoclaved pestle and mortars. RNA was extracted from a
maximum of 100 mg of plant tissue using the RNeasy Mini Kit (Qiagen) or RNeasy Plant Mini
Kit (Qiagen), according to manufacturer’s instructions, with the exception that β-
mercaptoethanol was not added to RLT and RLC buffers. RNA was re-suspended in ‘Super’
water produced using Super-Q Plus Water Purification Systems (Millipore, Bedford, MA,
USA) or UltraPure™ DEPC-Treated Water (Invitrogen). RNA quantity and quality was
assessed using the Picodrop™ spectrophotometer and agarose gel electrophoresis.
2.2 Bacteria and bacterial culture
2.2.1 Bacterial strains One Shot® TOP10 Chemically Competent Escherichia coli (E. coli, Invitrogen, Carlsbad, CA,
USA), and homemade E. coli DH5α cells were used in routine cloning for insert amplification
and sequencing. Homemade chemically competent and electrocompetent DH5α cells,
derived from DH1 E. coli (Hannahan, 1983) were provided by Dr. Nadia Al-Kaff and Dr.
Christine Faulkner (JIC, Norwich, UK) respectively. Library Efficiency® DH5α™ cells
(Invitrogen) were used in both routine and Gateway® cloning.

42
Agrobacterium tumefaciens (Agrobacterium) strain AGL1 was used for barley transformation
and was provided by Dr. W. Harwood (JIC).
2.2.2 Restriction enzymes and antibiotics Restriction enzymes and associated incubation buffers were obtained from New England
BioLabs (Ipswich, MA, USA) or Roche (Basel, Switzerland). Chemicals were from Sigma-
Aldrich (St. Louis, MO, USA) unless otherwise stated. The following antibiotics were used for
E. coli and Agrobacterium selection: ampicillin (Sigma-Aldrich), carbenicillin (Formedium,
Hunstanton, UK), hygromycin (Duchefa, Haarlem, The Netherlands), kanamycin
(Formedium).
2.2.3 Bacterial transformation
Unless otherwise stated, bacterial transformation of electrocompetent and chemically
competent cells was conducted according to the manufacturer’s instructions. Chemically
competent cells were heat shocked using a water bath (JB1, Grant Instruments,
Cambridgeshire, UK) or heating block (Thermomixer 5436, Eppendorf, Hamburg, Germany).
DNA (2 – 10 ng) was added to 50 µL electrocompetent cells which had been thawed on ice
immediately before use. The mixture was then transferred into a 2 mm electroporation
curvette pre-chilled on ice. The curvette was placed into an electroporator (BioRad Gene
Pulser II (BioRad, Hertfordshire, UK)) and cells pulsed at 2.5 kV (400 ohms, 25 µFd). Cells
were then added to 0.5 mL SOC medium (Super Optimal Broth with Catabolite Repression,
Hanahan, 1983) and shaken at 37 °C for 2 h. An aliquot (100 µL) of the suspension was then
spread on LB-G (LB: Luria-Bertani without glucose, Maniatis et al., 1982) agar plates
containing the appropriate selection, and incubated overnight at 37 °C.
Transformation of Agrobacterium was performed as for electroporation of E. coli, with the
exception that cells were transferred to 2 mL L broth and shaken at room temperature for 2
- 3 h after pulsing. Aliquots (10 – 100 µL) of this suspension were then spread on L agar (with
rifampicin (50 µg mL-1) for Agrobacterium selection and the appropriate selection for the
transforming plasmid). Plates were incubated for 2 days at 28 °C.

43
2.2.4 Bacterial culture
Unless otherwise stated, E. coli was cultured at 37 °C overnight on LB–G agar plates or with
shaking in LB–G broth, with appropriate selection: X-gal (5-bromo-4-chloro-3-indolyl-beta-D-
galactopyranoside) or ampicillin. SOC medium was used as a bacterial growth medium when
required according to the manufacturer’s instructions. Growth media were obtained from
the JIC media supply and produced to the formulations described in Appendix 1.4.
2.2.5 Colony PCR
White colonies growing on selective media were identified as putative transformants. The
presence of an insert was confirmed by colony PCR using insert and vector specific primers.
Colonies were sampled using sterile wooden toothpicks, added to 50 µL SDW, heated to 95
°C for 15 min then cooled and used in colony PCR. Each colony PCR reaction consisted of 2
µL colony preparation, 10 µL GoTaq® DNA Polymerase (Promega), 1.5 µL forward primer, 1.5
µL reverse primer, 0.6 µL Dimethylsuphoxide (DMSO), 4.4 µL SDW. Colony PCR cycling
conditions were dependent on the annealing temperature of the primer set and insert size.
Appropriate positive and negative controls (null transformant and SDW) were used.
Transformed cells were preserved as glycerol stocks, produced by the addition of 50 µL of
bacterial culture (grown overnight) to 50 µL glycerol, followed by mixing and storage at -80
°C.
2.2.6 Isolation of plasmids from E. coli
Plasmids were isolated from E. coli using QIAprep Spin Miniprep Kit (Qiagen) from a
maximum of 5 ml bacterial culture in LB-G medium, according to the manufacturer’s
instructions, however to increase plasmid concentration, 30 µL EB buffer was used in the
elution step instead of the recommended 50 µL.
44
2.3 Molecular biology materials and methods
2.3.1 Precipitation and purification of nucleic acids
2.3.1.1 Precipitation and purification of DNA Precipitation and purification of nucleic acids was used to increase DNA concentration and
remove contaminants that could inhibit subsequent PCR, cloning and sequencing steps.
Isopropanol and ethanol precipitation was used to precipitate and purify genomic DNA
before PCR amplification, whilst polyethylene glycol (PEG) precipitation and agarose gel
purification was used to precipitate and purify PCR product and plasmid DNA before cloning
and sequencing. Protocols used were as follows:
Isopropanol and ethanol precipitation was used preceding PCR amplification and were
carried out as described by Maniatis et al. (1982), with the amendment that precipitated
DNA was in some cases resuspended in SDW instead of TE buffer.
Polyethylene glycol precipitation was used preceding PCR amplification, and to increase the
concentration of insert DNA before the ligation step of bacterial cloning. Precipitation was
conducted as described by Sambrook & Russell, (2001).
QIAquick Extraction Kit (Qiagen) was used to isolate DNA bands from agarose gels. DNA
bands were excised from low concentration agarose gels (0.4 – 0.8%, 1 x TAE or TBE buffer)
and purified according to the manufacturer’s instructions.
2.3.1.2 Precipitation and purification of RNA
Lithium chloride precipitation was performed on DNase treated RNA samples before cDNA
synthesis, according to the procedure described by Maniatis et al. (1982) with the following
modifications: 1 volume of 8 M LiCl was added to a maximum volume of 30 μL of RNA
extract, and the mix was stored at -80 °C for 2 h or overnight. Samples were centrifuged at
21 000 x g for 30 min at room temperature and the supernatant carefully removed.
Resulting pellets were washed with 200 – 500 μL of 70% ethanol before centrifugation at 21
45
000 x g for 5 min. Supernatant was removed and the pellet air dried for 10 min, before
resuspension in ‘Super’ or DEPC-treated nuclease free water by incubation at 4 °C for 1 h.
2.3.2 PCR amplification
Full and partial amplification of the Sln1 gene was used for sequencing and for transgenic
construct production. Primers were designed using the criteria described by Dieffenbach et
al. (1993), or by using the primer design software Primer3 v.4.0 (http://frodo.wi.mit.edu;
Rozen & Skaletsky, 2000), or Primerfox (http://www.primerfox.com). Primer specificity was
checked against the National Centre for Biotechnology Information (NCBI) Hordeum vulgare
non-redundant database (http://blast.ncbi.nlm.nih.gov/Blast.cgi) using BLASTn (Altschul et
al., 1990). PCR efficiency was optimised by selecting the most efficient temperature from a
gradient. Primers were ordered form Eurofins MWG Operon (Ebersberg, Germany) and
Sigma-Aldrich (Gillingham, UK).
PCR amplification of target sequence was carried out using the following DNA polymerases,
as appropriate: Platinum® Taq DNA Polymerase High Fidelity, Platinum® Taq PCRx DNA
Polymerase, Platinum® Pfx DNA Polymerase (Invitrogen), Taq DNA Polymerase (Roche),
HotStar Taq DNA Polymerase (Qiagen), Phusion® High Fidelity DNA Polymerase (New
England BioLabs), GoTaq® DNA Polymerase (Promega). PCR was carried out using PTC-200
DNA Engine (MJ Research Inc., Alameda, CA, USA), Tetrad PTC-225 Thermo cycler (MJ
Research Inc.) and GS1 (G-Storm, Surrey, UK) thermal cyclers.
2.3.3 Qualitative and quantitative analysis of nucleic acids
Nucleic acid purity and quantity was assessed by gel electrophoresis and UV
spectrophotometry.
Gel electrophoresis was used to analyse precipitated or unprecipitated nucleic acid extracts,
PCR products and DNA digests. Clear band formation on an electrophoresis gel (0.6 – 0.8%
agarose, 1 x TAE or TBE buffer) was used as an indicator of nucleic acid quality, and the use
of molecular weight markers allowed assessment of band sizes. Loading buffers (5 x DNA
loading buffer blue (Bioline, London, UK) and 5 x Orange G loading buffer) provided by Dr.

46
Andrey Korolev (JIC) were added to the nucleic acid before loading on to the agarose gel.
Ethidium bromide stained nucleic acid was visualised and recorded using Gel Doc™ XR
System and Quantity One® ver. 4.6 software (Bio-Rad, Hertfordshire, UK) or AutoChemi™
System (UVP, Upland, CA, USA) and LabWorks™ ver. 4.6 (Media Cybernetics, Bethesda, MD,
USA). The following molecular markers were used, as appropriate: HyperLadder™ I (Bioline),
HyperLadder™ IV (Bioline), 1 kb DNA ladder (New England BioLabs), Quick-Load® 1 kb DNA
ladder (New England BioLabs), Quick-Load® 100 bp DNA ladder (New England BioLabs), 1 kb
DNA Ladder (Invitrogen), BenchTop 1 kb DNA Ladder (Promega, Madison, WI, USA).
UV spectrophotometry was used to analyse purified nucleic acid extracts.
Spectrophotometric quantification of RNA or DNA was carried out using a NanoDrop ND-
1000 (Thermo Scientific, Wilmington, DE, USA) or Picodrop (Picodrop, Cambridge, UK).
Contamination and quality of nucleic acids was estimated by the OD260/OD280 ratio, with 1.8
considered ideal for DNA and 2.0 considered ideal for RNA (Sambrook & Russell, 2001).
2.3.4 DNA sequencing
Purified PCR products and plasmids were sequenced using the BigDye® Terminator v3.1
Cycle Sequencing Kit (Applied Biosystems, Foster City, CA, USA) according to the
manufacturer’s instructions and specific primers. Sequencing was performed by The
Genome Analysis Centre (TGAC, Norwich, UK).
2.4 Quantification of Sln1 expression
2.4.1 DNase treatment
To remove DNA from RNA extracts prior to cDNA synthesis, samples were treated with
TURBO DNA-free™ DNase I (Ambion, Carlsbad, CA, USA) or DNase I recombinant, RNase-free
(Roche) according to the manufacturer’s instructions. RNA quantity and quality was assessed
using the Picodrop™ spectrophotometer and agarose gel electrophoresis. Where RNA
concentration or purity was insufficient for cDNA synthesis (<20 ng μL-1) or OD260/OD280 ratio
was less than 1.8 or more than 2.2, samples were purified and concentrated by lithium
chloride precipitation. RNA quantity and quality was re-assessed after precipitation.

47
A QPCR reaction was performed on a 1:10 or 1:20 dilution of the RNA samples to determine
whether genomic DNA was present after DNase treatment or LiCl precipitation. QPCR was
performed using a CFX 96™ Real-Time System (Bio-Rad) attached to a C1000™ Thermal
Cycler (Bio-Rad). Reactions were prepared in 96 well plates (Thermo-Fast® 96, Thermo
Scientific) to a final volume of 20 μL; with 4 μL diluted RNA, 10 μL SYBR® Green JumpStart™
Taq ReadyMix™ (Sigma-Aldrich); 2 μL forward primer (see Table 2.1); 2 μL reverse primer
(see Table 2.1); 2 μL nuclease free water. Cycling conditions were: 95 °C for 10 min; then 40
cycles of 94 °C for 20 s, 62 °C for 20 s (anneal temp), 72 °C for 30 s (plate read); followed by a
final extension of 72 °C for 10 min. Melt curve analysis (50-95 °C) was performed for each
sample at the end of the PCR reaction to distinguish double stranded amplicons from PCR
artefacts. A control qRT-PCR was performed on the same dilution of RNA used for cDNA
synthesis to reveal any genomic DNA remaining after DNase treatment. Only samples
without DNA contamination were used for cDNA synthesis.
Table 2.1 Primers used for amplification of the (a)target and (b)normalisation genes in the qRT-PCR assay. (c)Glyceraldehyde 3-phosphate dehydrogenase; (d)The primers used for amplification of Sln1 were designed for amplification of the wheat DELLA gene (Rht) but had been shown to amplify Sln1 (R. Saville, 2011).
Gene Forward Reverse Reference
Sln1a CTACGAGTCCTGCCCCTACC CCCTGCTTGATGCCGAAGTC Dr. R. Saville (JIC)
d
α-tubulinb AGTGTCCTGTCCACCCACTC AGCATGAAGTGGATCCTTGG Burton et al. (2004)
GAPDHb,c
CAGAAACCCCGAGGAGATT CCAT
TGGCTGGCTTGGCAAGTCTAA CAGTCAG
Dunford et al. (2005)
Ubiquitinb GCCGCACCCTCGCCGACTAC CGGCGTTGGGGCACTCCTTC Rostocks et al. (2003)
2.4.2 cDNA synthesis
cDNA was synthesised from a minimum of 80 ng and maximum of 5 μg RNA using the
Superscript™ III first strand synthesis kit (Invitrogen) according to the manufacturer’s
instructions. The reaction was primed with the addition of random hexamers (2.5 ng μL-1,
Invitrogen). RNA was digested using RNase-H (Invitrogen) by incubation at 37 °C for 20 min,
followed by cooling to 4 °C according to the manufacturer’s instructions.

48
2.4.3 Quantitative RT-PCR (qRT-PCR)
cDNA was diluted to 1:10 or 1:20 in nuclease free water and amplified using the protocol
described in Section 2.4.1. Data were analysed using Bio-Rad CFX Manager™ software ver.
1.6 (Bio-Rad). Each reaction was carried out using a minimum of two replicates, and the
mean Ct value for each reaction was calculated. The stability and primer efficiency for the
three reference genes were tested in all samples as described by Vandesompele et al. (2002)
using geNorm software ver. 3.5 (http://medgen.ugent.be/~jvdesomp/genorm/). The two
reference genes with the most stable expression under experimental conditions were used
to calculate a normalisation factor, which was used to normalise the target gene expression
data according to Pfaffl et al. (2001).
2.5 Bioinformatic and statistical analysis
Sequence alignment
DNA sequences were aligned using ContigExpress, from Vector NTI Suite 10 (Invitrogen).
Statistical analysis
Data were analysed using Excel (Microsoft Office 2007; Microsoft, Redmond, WA, USA), or
GenstatTM ver. 10 (VSN International).
49
Chapter 3: Characterisation of GA Signal Transduction Mutants
3.1 Aims
The aim of the work described in this chapter was to identify and characterise novel and
archived barley DELLA mutants that have dwarf or slender-like phenotypes by sequencing
the Sln1 genes of these plants. Novel characterised Sln1 mutants could then be used in
subsequent studies of the role of DELLA in abiotic stress tolerance. The Sln1 sequences
obtained were compared to wild-type and existing Sln1 mutant sequence to determine
whether the abnormal phenotypes were likely to be the result of mutations to Sln1, and if
so, whether the characterised polymorphisms were present in conserved domains and
motifs. The growth and developmental phenotypes of confirmed Sln1 mutants were also
assessed.
The following hypothesise were formulated. H1: The mutant phenotypes observed in
putative DELLA mutants result from differences in Sln1 nucleotide sequence or expression;
H0: The mutant phenotypes observed in putative DELLA mutants result from mutation to a
gene or genes other than Sln1, or through post transcriptional regulation of Sln1 gene
transcripts or the SLN1 protein.
3.2 Introduction
3.2.1 GRAS protein family
DELLAs are members of the GRAS family of regulatory proteins. GRAS proteins, named after
the first three member proteins to be identified, GAI, RGA and SCR, are a large family of
plant specific transcription factors that function in a diverse set of physiological and
developmental processes (Engstrom, 2011). The GRAS protein family is comprised of
subfamilies, each named after a member protein or common function. In addition to DELLA
proteins, other GRAS protein subfamilies include SCARECROW (SCR), LATERAL SUPPRESSOR
(Ls), HAIRY MERISTEM (HAM), PHYTOCHROME A SIGNALLING TRANSDUCTION (PAT1), and
SHORT-ROOT (SHR) (Table 3.1).

50
Table 3.1 GRAS protein subfamilies and their regulatory functions. Regulatory functions presented here are described in: (a)Peng et al., 1997; (b)Di Laurenzio et al., 1996; (c)Schumacher et al., 1999; (d)Stuurman et al., 2002; (e)Bolle et al., 2000; (f)Helariutta et al., 2000.
GRAS protein subfamily Characterised regulatory function
DELLA Growth inhibition (a)
SCARECROW (SCR) Radial patterning in root and shoot (b)
LATERAL SUPPRESSOR (Ls) Axillary meristem development (c)
HAIRY MERISTEM (HAM) Shoot development (d)
PHYTOCHROME A SIGNAL
TRANSDUCTION1 (PAT1)
Light stimulated developmental processes including
de-etiolation and hypocotyl elongation (e)
SHORT-ROOT (SHR) Root radial patterning and growth (f)
3.2.2 Conserved GRAS domains and motifs
GRAS proteins are typically 400 – 700 aa in length, and consist of variable N-terminal and
conserved C-terminal domains. The variable N-terminal domain defines individual GRAS
protein subfamilies, whilst the C-terminal domain is characterised by conserved GRAS motifs
(Figure 3.1). Conserved aa sequence motifs have been identified in the C-terminus: the LXXLL
sequence, leucine heptad repeat I (LHR I), VHIID motif, leucine heptad repeat II (LHR II),
PFYRE motif, RVER motif, and the SAW motif (Pysh et al., 1999).
Figure 3.1 Diagrammatic representation of the domains and conserved motifs of GRAS proteins (modified from Bolle, 2004). GRAS proteins are divided into two distinct domains, the C-terminal domain characterised by conserved GRAS motifs, and the variable N-terminal domain that defines individual GRAS protein subfamilies. The motifs are designated after their conserved aa. N and C = amino and carboxyl terminal of the protein, respectively.

51
An LXXLL sequence at the beginning of the LHR I region marks the beginning of the
conserved C-terminal part of several GRAS proteins. LXXLL sequence has been shown to
mediate the binding of steroid receptor co-activator complexes to cognate nuclear receptors
in mammals (Heery et al., 1997; Bolle, 2004); although an equivalent function is yet to be
reported in plant systems.
The LHR regions, LHR I and LHR II, which flank the VHIID motif, are approximately 100
residues in length (Bolle, 2004). The LHR regions in most cases do not consist of leucine
heptad repeats, instead they are more commonly regions of leucine richness (Bolle, 2004).
Where repeats do occur, the number of repeats is small, normally consisting of two repeats,
however, three to five repeats are observed less frequently (Pysh et al., 1999). Leucine rich
repeat motifs, 20 – 29 residues long, are associated with protein-protein interactions (Kobe
& Kajava, 2001; Itoh et al., 2002), suggesting a role for LHR regions in oligomer formation.
The presence of two LHR regions has been identified in several transcription factors,
supporting a similar role for GRAS proteins. Furthermore, characterisation of the SCR GRAS
protein in Arabidopsis identified a stretch of four leucines with spacing consistent with
leucine zipper (LZ) formation (Bolle, 2004). LZ are commonly found in DNA-binding proteins
(Landschulz et al., 1988) and define the basic-leucine zipper (bZIP) family of transcription
factors (Hirsh & Oldroyd, 2009).
The VHIID motif is not absolutely conserved in GRAS proteins, with only the histidine (H) and
aspartic acid (D) residues showing absolute conservation (Bolle, 2004). The full significance
of this motif is yet to be established, however it has been hypothesised that the LHR I-VHIID-
LHRII regions may act as a DNA-binding domain analogous to bZIP protein-DNA interaction
(Ellenberger et al., 1992), with the LHRs enabling protein-protein interaction and the VHIID
motif enabling protein-DNA interaction (Pysh, 1999).
After the LHRII domain, a putative tyrosine phosphorylation site is present in many members
of the GRAS family, overlapping with the tyrosine (Y) in the PFYRE motif (Bolle, 2004). Site
directed mutagenesis of the tyrosine in the Arabidopsis RGL GRAS protein to mimic
constitutive phosphorylation, resulted in reduced GA-mediated degradation of the protein
(Hussain et al., 2005). The PFYRE motif is less conserved than the VHIID and SAW motifs,
with only the proline (P) residue being absolutely conserved, although there is a high degree
of sequence similarity at this region between GRAS proteins (Pysh et al., 1999).
52
The SAW region consists of three pairs of absolutely conserved residues: R-E, W-G, and W-
W. The spacing between R-E and W-G pairs is absolutely conserved; however the spacing
between W-G and W-W pairs differs between GRAS proteins. A further motif, RVER, is
present between the PFYRE and SAW domains. Although the functions of the RVER and SAW
motifs have not currently been identified (Bolle, 2004), the SAW motif at least appears to be
essential for DELLA-mediated growth repression, in that a single amino acid substitution at
position 606 (T P) in the SAW motif of the rice SLR1 protein results in a slender phenotype
(Itoh et al., 2002).
In addition to the motifs and regions described above, nuclear localisation signals (NLS) have
been identified in a number of GRAS proteins (Hirsch & Oldroyd, 2009), with several proteins
exhibiting nuclear localisation (Tian et al., 2004). Sequence analyses together with evidence
for the nuclear localisation of GRAS proteins is consistent with the proposed role of the
GRAS family proteins as transcriptional regulators (Lee et al., 2008).
3.2.3 Motifs conserved in the DELLA proteins
The DELLA and GRAS domains
Sequence and expression analysis of mutant DELLA genes and analysis of mutant protein
function (primarily in Arabidopsis and rice) has identified conserved motifs and functional
regions in DELLA proteins (Ikeda et al., 2001; Pysh et al., 1999). Characteristically for GRAS
proteins, DELLA proteins comprise two domains. The N-terminal is highly specific to DELLA,
providing the basis for the DELLA subfamily, and is required for interaction with the GA-GID1
complex. Mutations that result in alteration to the DELLA or TVHYNP motifs that define
DELLA proteins, or the region between these motifs, commonly result in the development of
a GA insensitive, Gain of Function (GoF), dwarf mutant phenotype (Pysh et al., 1999; Itoh et
al., 2002). DELLA domain mutants are typically dominant, and exhibit reduced height, dark
green colour and late flowering (Chandler et al., 2002; Ikeda et al., 2001; Peng et al., 1997,
1999; Cassani et al., 2009; Liu et al., 2010). In addition to the DELLA and TVHYNP motifs, a
polyS/T/V region connects the N-and C-terminal domains of the DELLA proteins. This domain
shows marked sequence variation between species but has been characterised most
extensively in the SLR1 protein. Itoh et al. (2002) found that the polyS/T/V region enhanced
the growth suppression imposed by the SLR1 protein, and served as a putative target site for
O-linked N-acetylglucosamine (O-GlcNAc) modification by O-GlcNAc transferase encoded by

53
the SPY gene, thereby enhancing the suppressive activity of the DELLA proteins (Itoh et al.,
2005; Silverstone et al., 1998). Alanine substitution of residues in the polyS/T/V region did
not affect interaction of SLR with either GID1 or GID2 (Hirano et al., 2010). The C-terminus of
the DELLA proteins (the GRAS domain) is integral to growth repression, as exhibited with the
expression of a truncated form of the rice DELLA, SLR1 (ΔC-Ter), which lacks the VHIID,
PFYRE and SAW motifs. The highly truncated SLR1 lacked the DELLA growth repression
associated with the wild-type form of SLR1 (Itoh et al., 2002), with plants exhibiting a tall
(LoF) phenotype. GRAS domain mutants are typically recessive, and in plants containing a
single DELLA gene they result in tall, slender phenotypes similar to those of plants saturated
with GA, or having a constitutive GA response. Chlorosis and reduced seed fertility are
commonly associated with these mutations (Chandler et al., 2002; Ikeda et al., 2001; Bassel
et al., 2008; Weston et al., 2008). A summary of selected DELLA ORF mutants characterised
to date is shown in Table 3.2.
Table 3.2 Characterised mutations within the DELLA ORF. (a)Chandler et al., 2002; (b)Ikeda et al., 2001; (c)Peng et al., 1999; (d)Pearce et al., 2011 (e)Wu et al., 2011 (f)Cassani et al., 2009; (g)Bassel et al., 2008; (h)Weston et al., 2008; (i)Peng et al., 1997; (j)Liu et al., 2010; (k)Muangprom et al., 2005. Gene knockouts (e.g. transposon insertions in Arabidopsis DELLAs) are not included in this table.
Species Locus Identified mutants
Barley (Hordeum vulgare) Sln1 sln1a to sln1d (a)
Rice (Oryza sativa) SLR1 slr1; slr1-1 to slr1-4 (b)
Wheat (Triticum aestivum) RHT-1 Rht-B1b (c)
; Rht-B1c (d, e)
; Rht-D1b (c)
; Rht-D1c (d)
Maize (Zea mays) Dwarf8 d8 (f)
Tomato (Solanum lycopersicum) LeGAI pro (g)
Pea (Pisum sativum) LA; CRY la; cry-s; cry-c (h)
Arabidopsis (Arabidopsis thaliana) GAI gai (i)
Brassica (Brassica napus/rapa) BnRGA Bnrga-ds (j)
; Brrga1-d (k)
DELLA domain mutants
DELLA domain mutants have been characterised in both dicot and cereal species. The dwarf
Arabidopsis mutant named ga insensitive (gai) by Koorneef et al. (1985) contains a 51 bp
deletion in the 5’ region of the GAI ORF, resulting in a protein lacking 17 aa including the

54
DELLA motif. As the mutant lacks the N-terminal region required for GA-GID1 recognition,
GA-insensitivity is conferred (Peng et al., 1997; Willige et al., 2007). Similar GA insensitivity
has been observed in the agronomically important wheat Rht mutants, Rht-B1b and Rht-D1b
(also known as Rht1 and Rht2, respectively). These alleles contain substitution mutations
that produce premature stop codons within the DELLA domain (Peng et al., 1999). The
severely dwarfed mutant (RhtB1c, or Rht3) contains an insertion which disrupts the DELLA
domain (Pearce et al., 2011; Wu et al., 2011), and severe dwarf Rht10 (RhtD1c) results from
over-expression of the Rht-D1b protein (Pearce et al., 2011). In barley the dwarf sln1b allele
results from a frameshift mutation at position 278, affecting the protein from amino residue
93 (Thr, ACC to A-C) and producing an early stop codon at aa position 252. The dwarf sln1d
allele has a G to A substitution at position 137 (residue 46, Gly, GGG to GAG) causing a Gly to
Glu change in the DELLA region (39DELLAALG46 39DELLAALE46; Figure 3.2).
Figure 3.2 Mutants in SLN1 (adapted from Chandler et al., 2002). The ORF of cv Himalaya wild-type is 618 aa in length. Slender mutants: sln1b has a frameshift mutation in aa residue 93 (Thr, ACC to A-C), resulting in an early stop codon at residue 252, and sln1c has a G to A substitution in aa residue 602 (Trp, TGG to TGA), resulting in an early termination codon. Dominant dwarf: sln1d has a G to A substitution in aa residue 46 (Gly, GGG to GAG), causing a Gly to Glu change in the DELLA region, 39DELLAALG46 39DELLAALE46.
Further mutant alleles have been characterised in maize (Zea mays) and Brassica (Brassica
napus/rapa) species. The d8 mutant of maize possesses a dominant dwarf phenotype due to
a single aa insertion in the TVHYNP motif (Cassani et al., 2009). Previously characterised d8
mutants with mutations in the DELLA motif exhibited a more severe dwarf phenotype than
that of the TVHYNP motif mutant (Cassani et al., 2009). In Brassica napus the semi-dwarf

55
mutant, ds-1, results from the Bnrga-ds mutant allele that contains a missense mutation in
the TVHYNP motif (TVHYNP TVHYNL; Liu et al., 2010). The authors suggested that the
conserved proline participates in the DELLA-GID1 interaction. Itoh et al. (2002) produced a
series of transgenic DELLA domain mutants in rice through the deletions to the DELLA motif,
DELLA-TVHYNP inter-motif space, TVHYNP motif, polyS/T/V region, and the LZ region, with
deletion in each region resulting in a dwarf phenotype mutant.
GRAS domain mutants
Fewer GRAS domain mutants have been characterised compared with DELLA domain
mutants due to the recessive nature of GRAS mutants. The slr1-1 allele of rice contains a
single nt deletion at position 867 (Leu, CTC to –TC), affecting the protein from aa 289 (within
the putative NLS region), while the proteins of the slr1-2, slr1-3 and slr1-4 mutants contain
premature stop codons at aa positions 561, 609 and 620 respectively, close to the C-
terminus of the protein. The nucleotide substitution in slr1-4 occurs just 16 nucleotides
upstream of the stop codon (Ikeda et al., 2001). The mutations in slr1-4 result in slender tall
mutant phenotypes, indicating that several aa at the C-terminal are essential for DELLA-
mediated growth repression (Ikeda et al., 2001; Itoh et al., 2002). A similar mutation has
been characterised in barley (sln1c) that has a substitution at nt position 1806, affecting aa
602 (Trp, TGG to TGA), producing an early stop codon resulting in the loss of 17 C-terminal
amino acids resulting in a slender phenotype (Chandler et al., 2002; Figure 3.2). The procera
(pro) mutant of tomato has a slender phenotype resulting from a point mutation in the
VHIID motif (VHVID to VHEID; Bassel et al., 2008). Pea (Pisum sativum) has two DELLA
proteins (LA and CRY) and mutations have been identified in each; the la mutant allele arises
from an insertion of 190 bp at aa position 85, downstream of the TVHYNP motif. Two cry
mutant alleles (cry-s and cry-c) have also been characterised, cry-s arises from a frameshift
deletion at aa position 152, whilst the cry-c mutant arises from a nt substitution (GA) at nt
583 causing a change from Gly to Gln at aa position 163 (Weston et al., 2008). Thus, the la
and cry-s alleles encode non-functional proteins and cause plants to have a slender
phenotype whereas the ability of the protein encoded by cry-c to inhibit growth is not
abolished and the plants are therefore less tall. As described, mutations in the GRAS domain
normally result in slender phenotype mutants. A notable exception has been observed in the
dwarfed Brassica rapa mutant Brrga1-d, in which the protein contains a mutation of the
conserved aa residue (QR) at position 328 in the VHIID motif. The repressor function of
the Brrga1-d is maintained, however, Brrga1-d does not interact with the Arabidopsis SLY1 (F

56
box) protein that is required for DELLA degradation, suggesting the mutated protein
maintains dwarfism by preventing the interaction needed for DELLA degradation
(Muangprom et al., 2005).
3.3 Materials and methods
3.3.1 Selection of barley mutant varieties
Mutants of three distinct barley cultivars (Herta, H930-36, Triumph) were selected based on
phenotype observations suggesting the presence of mutations in genes involved in the GA-
DELLA signal transduction pathway. Unfortunately labelling of the seed was unclear,
requiring the molecular characterisation of the DELLA genes in these lines prior to use in
further studies. Preliminary molecular analysis at the JIC suggested that the mutation in cv
H930-36 was present in Sln1 (Dr. X. Fu, personal communication), and the Herta seed
(labelled only as “Herta sln1”) was likely to be the sln1-1 allele described in Fu et al. (2002),
derived by diethyl sulphate treatment of cv Herta seed (Foster, 1977). For clarity it has
therefore been designated as such in the current study. The three mutants selected for
characterisation were therefore dwf2 (cv H930-36), sln1-1 (cv Herta), and Triumph γ-1 (cv
Triumph). An additional mutant, designated dwf2-1, was observed during bulking of cv
H930-36 seed (See Section 2.1.1), and was subsequently investigated.
The dwf2 mutant (cv H930-36) originates from seed collected from a plant grown by Dr. D.E.
Falk (University of Guelph, Ontario), which spontaneously exhibited dwarf characteristics
following tissue culture of the wild-type parent (Dwf2; Falk, 1994). In the current study, of
over 100 seeds labelled as homozygous for the dwarf mutation that successfully germinated,
all but one produced dwarf plants. The single non-dwarf plant that exhibited chimeric
characteristics was termed dwf2-1, and had dwarf and wild-type height tillers. Plants were
grown from seed taken from the dwarf tillers and wild-type tillers in order to determine the
stability of, and the molecular basis for, this phenotype.
The Triumph γ-1 mutant used in this study was derived from a γ-irradiated population of cv
Triumph barley (Laurie, D.A. and Byrne, M., JIC, unpublished data). The plant was initially
selected (in the field, by Dr. D. Laurie, JIC) based on its late flowering phenotype and
subsequently five plants (γ-1 - γ-5) were grown in the glasshouse from the collected seed.
These plants were tall and similar to (but less severe than) the slender tall Sln1 mutant

57
phenotype (cv Himalaya) described in the literature (Chandler et al., 2002). The plants were
self-pollinated, and the resulting (M2 generation) seed collected. Insufficient time was
available for this seed to be back-crossed before use.
The growth and development of five cv Himalaya mutants was observed to determine how
independent mutations in two components of the GA signal transduction pathway, SLN1 and
GSE1, affect plant phenotype under the conditions used in the current study. The mutations
had previously been molecularly characterised (Chandler et al., 2002, 2008). Gse1 encodes
the GA receptor, GSE1, orthologous to GID1 of Arabidopsis. The characterised DELLA
mutants sln1c and sln1d, and Gse1 mutants gse1a, gse1j, and gse1n originated from sodium
azide treated seed, and were identified based on response to GA (Chandler et al., 2008).
These mutants provided a basis for comparison of phenotypes with the new and
uncharacterised mutants under the defined conditions used in the current study. The Gse1
mutants are further described in Section 1.4.6.
3.3.2 Plant growth and phenotype observation
Seed phenotype
DELLA proteins are reported to be important in regulating seed germination, but their effect
on seed morphology has received little attention. In order to assess the effect of mutant
SLN1 on seed development the dry seed were assessed visually and seed width, length and
thousand grain weight (TGW) measured using the MARVIN seed analyser (GTA Sensorik
GmbH, Neubrandenburg, Germany) and Excel (Microsoft) software according to the
manufacturer’s instructions. The sln1d and gse1a (cv Himalaya) and Triumph γ-1 (cv
Triumph) mutants and their corresponding wild-types were analysed. MARVIN analyses
provided single mean values for seed length and width, as well as range values. TGW
analysis provided a single value extrapolated from the mean weight of tested seed.
Plant phenotype
For experiments carried out in soil, seeds were stratified as described in Section 2.1.3.1, and
grown in Petri dishes for seven days in CER conditions (20 °C, 16 h light period; 8 h dark
period). Seed germination rate was assessed at this point, and germinating seeds were
planted and grown in Barley Mix compost (see Section 2.1.3.2). Three days after planting,
plants were transferred from the CER to the glasshouse (22 °C, 16 h light period; 15 °C, 8 h

58
dark period). Seed segregation was assessed based on the phenotype of germinated seed
during early plantlet development (2 days to 1 wk after germination). To allow comparison
between experiments, plant growth conditions were kept as similar as possible. Mutants
were always compared with their respective wild-type genotypes of the same age. Lines
under comparison were grown together when possible. Phenotypes were observed on a bi-
weekly basis over a four month period. Wild-type to mutant phenotype segregation ratio
was calculated during the first month of plant growth, once seedlings were developed
enough to clearly differentiate between phenotypes.
For hydroponics based experiments (where root growth could be analysed), seeds were
stratified as described in Section 2.1.3.1, and grown in modified 0.5 x Hoagland’s solution
(Appendix 1.2.), as described in Section 2.1.3.3. Plants were grown for ten days, before root
and shoot lengths and dry mass was measured. Mean mass values were calculated for the
pooled samples of each genotype.
3.3.3 Bioinformatic analysis of Sln1 sequence
Identification of the promoter region
The transcription start site (TSS) of the Sln1 gene has not been identified. Since changes
within the promoter region can affect gene expression, in silico identification of this region
was attempted. The Sln1 promoter sites were predicted using two independent promoter
recognition methods. The Promoter 2.0 software
(http://www.cbs.dtu.dk/services/Promoter/) predicts promoter sites based on sequence
pattern and motif separation (Knudsen, 1999). The GC-compositional strand bias software
(Fujimori et al., 2005) predicts promoter sites based on GC composition, as transcription
start sites (TSS) in plant promoters have a CG-compositional strand bias (GC skew), where C
is more frequently observed in the transcribed strand, and G more frequently observed in
the non-transcribed strand at the TSS (Tatarinova et al., 2003; Fujimori et al., 2005).
Sln1 gene composition and SLN1 protein structure
Conserved motifs of Sln1 were identified by aligning DELLA protein sequence using ClustalW
(http://www.ebi.ac.uk). The position of cultivar- and mutant-specific polymorphisms
identified in this study could thus be determined relative to the conserved motifs. The GC
composition of Morex WT Sln1 ORF sequence was analysed using Vector NTI Suite 10

59
(Invitrogen) software and the Sln1 mRNA secondary structure was predicted using the
MFOLD program (http://mfold.ma.albany.edu; Zucker et al., 1999). The Morex wild-type
Sln1 ORF sequence, obtained from the NCBI nucleotide database (AF460219;
http://www.ncbi.nim.nih.gov), was used in analyses.
3.3.4 Nucleic acid extraction
DNA extraction
DNA was extracted from young leaf tissue of plants growing in soil, and either extracted
immediately or flash-frozen in liquid nitrogen and stored at -80 °C for future extraction. DNA
was extracted using the modified CTAB method and agarose gel purified as described in
Sections 2.1.4.1 and 2.3.1.1. In addition, young leaf material of Himalaya sln1d was provided
by Dr. M. Boulton (JIC, Norwich) from a stock stored at -80 °C. Additional Himalaya wild-type
DNA was provided by Dr. A. Korolev (JIC, Norwich).
RNA extraction
Plants used for Sln1 expression analysis were stratified as described in Section 2.1.3.1, then
grown in Petri dishes under CER conditions (16 h photoperiod, 20 °C). For RNA extraction,
either whole plant or second leaf material was taken from plants at the 2-3 leaf stage. RNA
was extracted and purified as described in Section 2.3.1.2. Quantification of Sln1 mRNA
levels using qRT-PCR was conducted as described in Section 2.4.
3.3.5 Amplification and sequencing of Sln1
PCR amplification of the Sln1 gene was conducted on genomic DNA samples using existing
primer stocks left by Dr. X. Fu, and primers that were designed based on cv Morex Sln1
sequence (GenBank accession AF460219). Primer pairs were designed to amplify the Sln1
ORF, (data are not presented for primer pairs that failed to do this). Initially only partial Sln1
regions could be amplified, therefore optimisation of the amplification conditions was
required, resulting in successful amplification using the primer set shown in Table 3.3 and
the following cycling conditions: 94 °C for 3 min; then 10 cycles of 95 °C for 30 s, 57 °C for 1
min (decreasing by 0.5 °C per cycle) and 68 °C for 3 min. This was followed by 30 cycles of 95
°C for 30 s, 52 °C for 15 s, 68 °C for 3 min, followed by a final extension of 68 °C for 30 min.
PCR was conducted using proofreading polymerase (Platinum® Taq DNA Polymerase High

60
Fidelity or Platinum® Pfx DNA Polymerase High Fidelity (Invitrogen)). The expected product
was 2423 bp, consisting of 1857 bp ORF, 274 bp 5’ UTR and 292 bp of 3’ UTR sequence.
Table 3.3 Primers used to amplify the entire Sln1 ORF. (a)‘F’ denotes forward, and ‘R’ reverse primer orientation (b)Primer binding site coordinates are presented relative to the first nucleotide of the Sln1 initiation codon (‘A’ = co-ordinate 1), ‘-‘ refers to the number of bases upstream of this point, ‘+’ refers to the number of bases beyond the final nucleotide of the translational stop codon of Sln1. The reference sequence used was Sln1 of Morex (GenBank accession AF460219).
Orientation (a)
Primer binding site (b)
Sequence (5’-3’)
F -274 to -255 CACACCACTATGCCCAGATG
R +273 to +292 ATGGTGAACTGGGAACGAAG
The amplified product was cloned into pCR®4-TOPO® vector using One Shot® TOP10
Chemically Competent E. coli kit (Invitrogen, Carlsbad, CA, USA), and homemade DH5α
chemically competent cells as described in Section 2.2.3, or sequenced directly after agarose
gel purification of the PCR product. Sequencing reactions were performed as described in
Section 2.3.4 using the primers shown in Table 3.4, with additional forward and reverse M13
primers, M13F-20 (GTAAAACGACGGCCAGT), and M13R (CAGGAAACAGCTATGACC) being
used to sequence the cloned Sln1 product.
Table 3.4 Primers used in Sln1 ORF sequencing. (a)‘F’ denotes forward, and ‘R’ reverse primer orientation; (b)Primer binding site coordinates are presented relative to the first nucleotide of the Sln1 initiation codon (‘A’ = co-ordinate 1). The reference sequence used was Sln1 of Morex (GenBank accession AF460219).
Orientation (a)
Primer binding site (b)
Sequence (5’-3’)
F 118 to 137 GAGCTGCTGGCGGCGCTCGG
R 322 to 303 CGTTGAGCTCGGACAGCATG
F 358 to 376 CTCAACGCCTCCACCTCTT
F 803 to 822 GCAAGGTCGCCGCCTACTTC
F 1230 to 1249 CCTGGAGCCGTTCATGCTGC
F 1444 to 1464 TTCACCGAGTCCCTGCACTAC
R 1494 to 1476 GCCCTCGAGAGAATCGAAC
F 1635 to 1655 AGAGCGGCACGAGACACTGGG

61
3.3.6 Analysis of Sln1 transcript levels in the γ-1 (cv Triumph) mutant
To determine whether a difference in Sln1 expression would account for the slender-like
phenotype exhibited by the Triumph γ-1 mutant, qRT-PCR was carried out using second leaf
and whole seedling material collected from WT and γ-1 mutant plants and the methods
described in Section 2.4. Plants were grown under CER conditions (16 h photoperiod, 20 °C)
and sampled at the three leaf stage. In each case, three biological repeats were used (eight
plants per biological repeat) for each genotype, with two technical repeats used for each
biological repeat.
3.4 Results
3.4.1 Phenotype analysis
3.4.1.1 Seed size, germination and segregation
Seed size
Visual assessment of seed phenotype suggested the seed length and width of some Sln1
mutants differed respective to their corresponding wild-types. These mutants (sln1d, gse1a,
γ-1) were analysed further, using a minimum of 580 seeds per genotype. The sln1c mutant
seed could not be analysed, as this mutant is maintained in a heterozygous population, as
homozygous sln1c mutants do not produce seed. As no significant differences in seed length
and width were observed between genotypes in the Himalaya and Triumph backgrounds
(but differences in range were observed), (Figure 3.3), TGW weight anlaysis was used to
determine whether differences in seed phenotype were observable in seed weight. The
TGW data correlated with decreased seed length and width data in mutant lines, as all three
mutants had decreased TGW compared to their respective wild-type seed (Figure 3.4). The
calculated value for TGW for the gse1a mutant seed was lower than that of the sln1d
mutant.

62
Figure 3.3 Length and width of wild-type and mutant seed of Himalaya and Triumph cultivars. Mean values are shown, with bars denoting range.
Figure 3.4 Thousand grain weight of wild-type and mutant seed of Himalaya and Triumph cultivars.
Seed germination and segregation
Germination and genetic segregation data were generated based on the observation of over
200 seeds per genotype (Table 3.5). In the Himalaya background, the germination rate of
sln1d mutant seed (49.4%) was lower than that of the other cv Himalaya genotypes (WT,
gse1a, gse1j, gse1n) which varied between 68.7 – 87.5%. Germination rates were similar for
wild-type and mutant genotypes in both the H930-36 (86.3 – 92%) and Herta (74.7 – 82.4%)
backgrounds. Plants derived from seed of plants containing the putative SLN1 stabilising
alleles (sln1d, gse1a, gse1j, gse1n and dwf2) all showed the expected dwarf phenotypes
0
5
10
15
20
25
30
35
40
45
50
WT sln1d gse1a WT γ-1
cv Himalaya cv Triumph
TGW
(g)
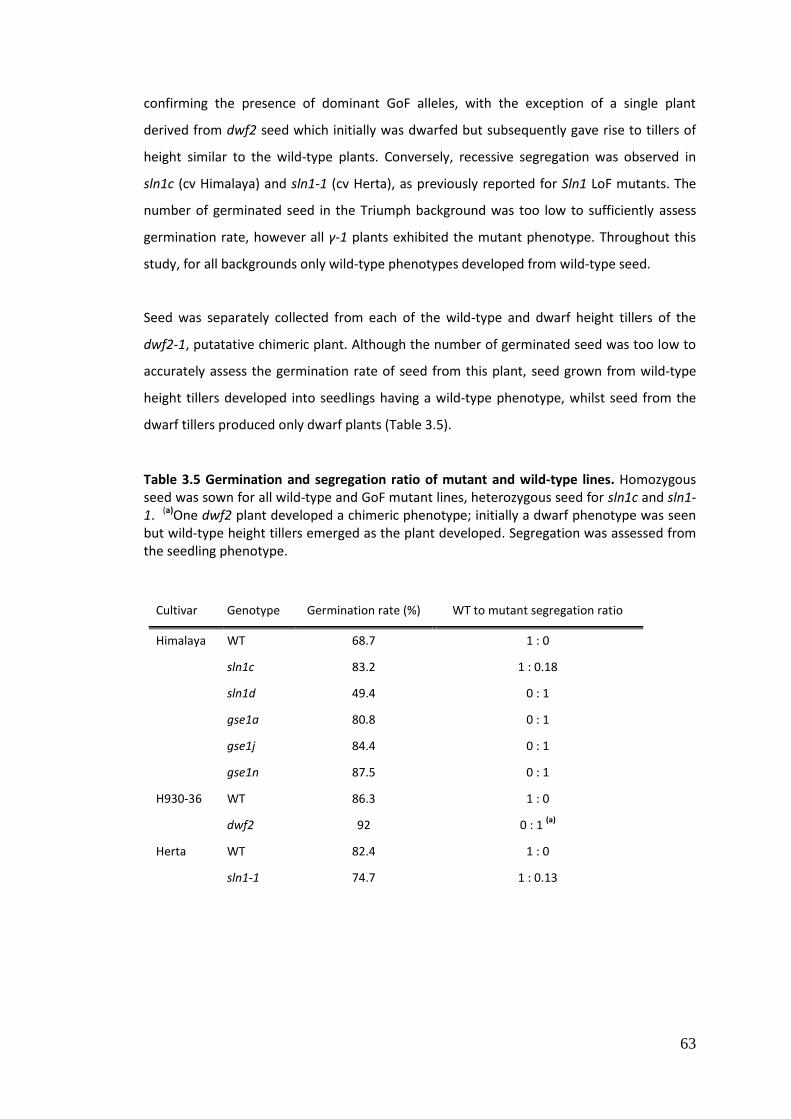
63
confirming the presence of dominant GoF alleles, with the exception of a single plant
derived from dwf2 seed which initially was dwarfed but subsequently gave rise to tillers of
height similar to the wild-type plants. Conversely, recessive segregation was observed in
sln1c (cv Himalaya) and sln1-1 (cv Herta), as previously reported for Sln1 LoF mutants. The
number of germinated seed in the Triumph background was too low to sufficiently assess
germination rate, however all γ-1 plants exhibited the mutant phenotype. Throughout this
study, for all backgrounds only wild-type phenotypes developed from wild-type seed.
Seed was separately collected from each of the wild-type and dwarf height tillers of the
dwf2-1, putatative chimeric plant. Although the number of germinated seed was too low to
accurately assess the germination rate of seed from this plant, seed grown from wild-type
height tillers developed into seedlings having a wild-type phenotype, whilst seed from the
dwarf tillers produced only dwarf plants (Table 3.5).
Table 3.5 Germination and segregation ratio of mutant and wild-type lines. Homozygous seed was sown for all wild-type and GoF mutant lines, heterozygous seed for sln1c and sln1-1. (a)One dwf2 plant developed a chimeric phenotype; initially a dwarf phenotype was seen but wild-type height tillers emerged as the plant developed. Segregation was assessed from the seedling phenotype.
Cultivar Genotype Germination rate (%) WT to mutant segregation ratio
Himalaya WT 68.7 1 : 0
sln1c 83.2 1 : 0.18
sln1d 49.4 0 : 1
gse1a 80.8 0 : 1
gse1j 84.4 0 : 1
gse1n 87.5 0 : 1
H930-36 WT 86.3 1 : 0
dwf2 92 0 : 1 (a)
Herta WT 82.4 1 : 0
sln1-1 74.7 1 : 0.13
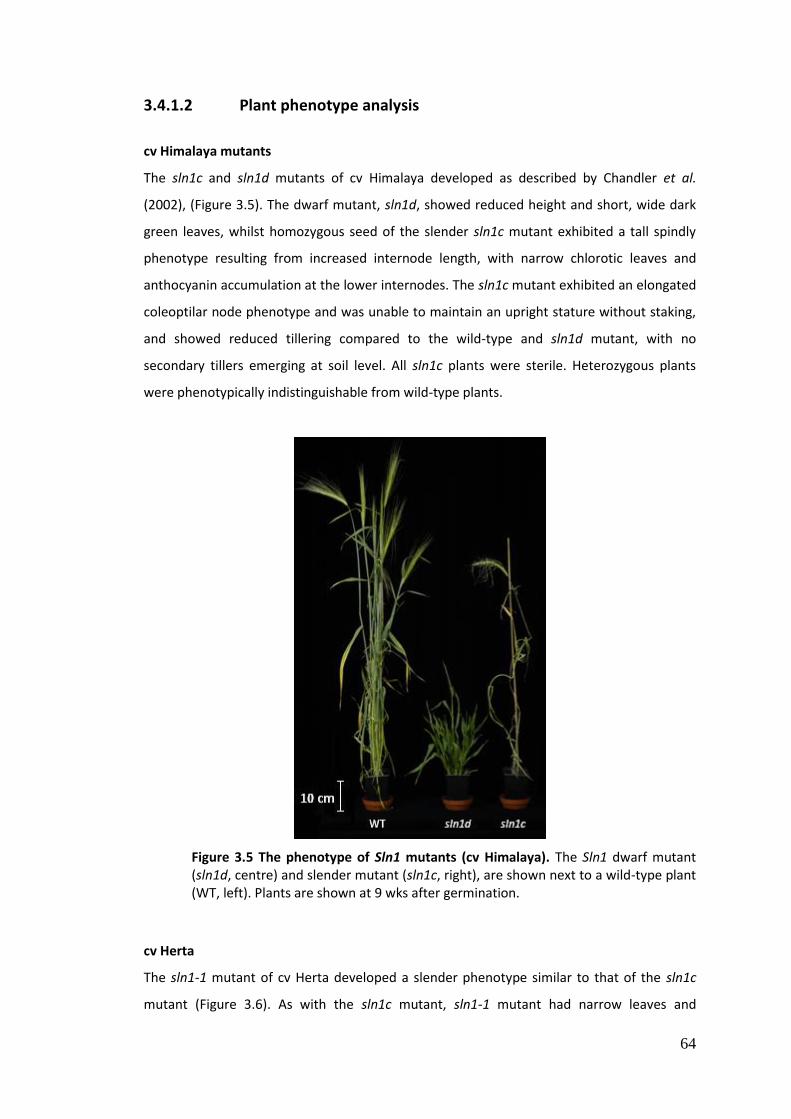
64
3.4.1.2 Plant phenotype analysis
cv Himalaya mutants
The sln1c and sln1d mutants of cv Himalaya developed as described by Chandler et al.
(2002), (Figure 3.5). The dwarf mutant, sln1d, showed reduced height and short, wide dark
green leaves, whilst homozygous seed of the slender sln1c mutant exhibited a tall spindly
phenotype resulting from increased internode length, with narrow chlorotic leaves and
anthocyanin accumulation at the lower internodes. The sln1c mutant exhibited an elongated
coleoptilar node phenotype and was unable to maintain an upright stature without staking,
and showed reduced tillering compared to the wild-type and sln1d mutant, with no
secondary tillers emerging at soil level. All sln1c plants were sterile. Heterozygous plants
were phenotypically indistinguishable from wild-type plants.
Figure 3.5 The phenotype of Sln1 mutants (cv Himalaya). The Sln1 dwarf mutant (sln1d, centre) and slender mutant (sln1c, right), are shown next to a wild-type plant (WT, left). Plants are shown at 9 wks after germination.
cv Herta
The sln1-1 mutant of cv Herta developed a slender phenotype similar to that of the sln1c
mutant (Figure 3.6). As with the sln1c mutant, sln1-1 mutant had narrow leaves and

65
pronounced anthocyanin accumulation at the internodes. The slender phenotype was
particularly pronounced at the early stages of plant development (Figure 3.6b); at later
stages, the Herta mutant produced tillers from soil level and although it was unable to
maintain an upright stature unaided, it was a more robust plant than the sln1c mutant
(compare Figures 3.5 and 3.6a). As with the cv Himalaya sln1c slender mutant, the sln1-1
mutant was sterile.
(a) (b)
Figure 3.6 The phenotype of cv Herta wild-type and sln1-1 mutant plants. (a) WT (left) and the sln1-1 mutant (right) shown at 7 wks after germination, (b) WT (left) and the seedling phenotype of the sln1-1 slender phenotype mutant (right) shown at 2 wks after germination.
cv H930-36
The dwf2 mutant exhibited a dwarf phenotype and wide, dark green leaves. The single dwf2-
1 plant initially developed as a dwarf phenotype, however, wild-type height tillers emerged
as the plant developed (Figure 3.7).
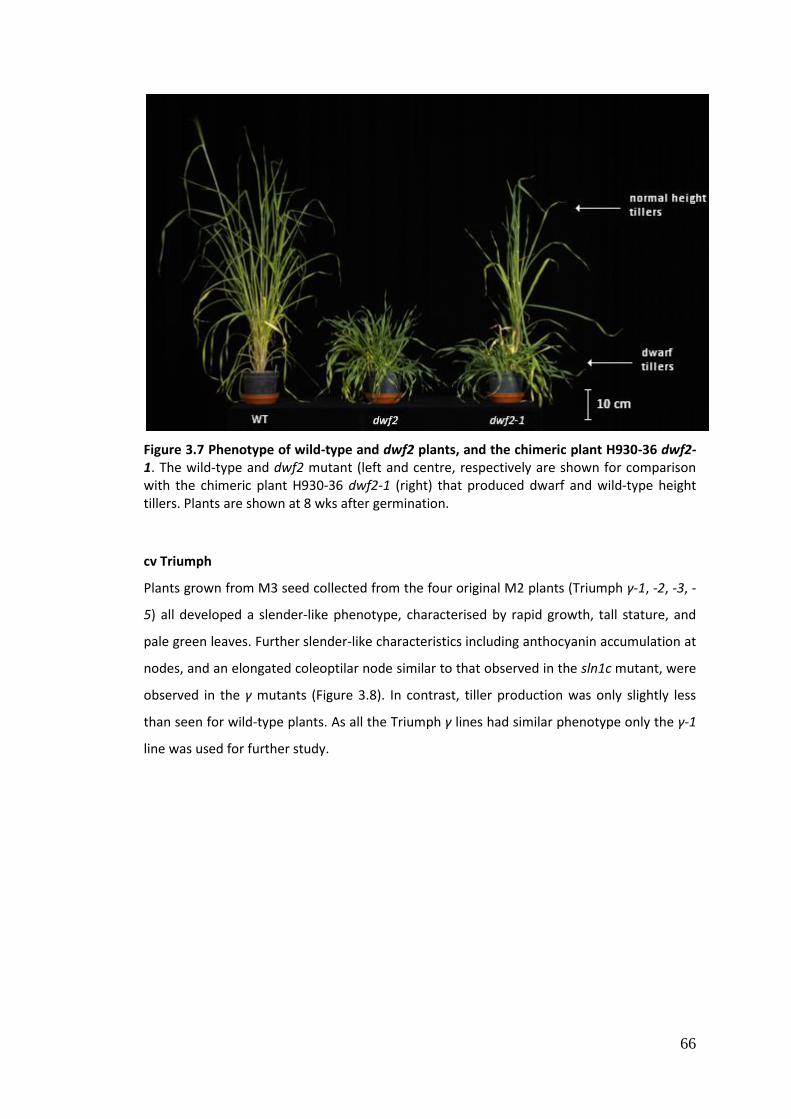
66
Figure 3.7 Phenotype of wild-type and dwf2 plants, and the chimeric plant H930-36 dwf2-1. The wild-type and dwf2 mutant (left and centre, respectively are shown for comparison with the chimeric plant H930-36 dwf2-1 (right) that produced dwarf and wild-type height tillers. Plants are shown at 8 wks after germination.
cv Triumph
Plants grown from M3 seed collected from the four original M2 plants (Triumph γ-1, -2, -3, -
5) all developed a slender-like phenotype, characterised by rapid growth, tall stature, and
pale green leaves. Further slender-like characteristics including anthocyanin accumulation at
nodes, and an elongated coleoptilar node similar to that observed in the sln1c mutant, were
observed in the γ mutants (Figure 3.8). In contrast, tiller production was only slightly less
than seen for wild-type plants. As all the Triumph γ lines had similar phenotype only the γ-1
line was used for further study.

67
(a) (b)
Figure 3.8 The phenotype of cv Triumph and the Triumph γ-1 plants. (a) Slender-like phenotype γ-1 mutant (right), compared to the corresponding wild-type (WT, left). (b) The elongated lower internodes and anthocyanin accumulation typical of the γ-1 mutant plants. Plants are shown at 9 wks after germination.
3.4.1.3 Root and shoot growth
Analysis of root and shoot growth was conducted on seedlings in the Himalaya background,
grown under hydroponic conditions for ten days. Results are based on a minimum of two
experiments, each consisting of between 4 - 14 seedlings of each genotype. With the
exception of the sln1d which had significantly shorter roots than the wild-type, root lengths
between the wild-type and mutant genotypes were similar. Differences were more
pronounced in regards to shoot length. The mean shoot length of the SLN1 LoF mutant,
sln1c, was significantly greater than that of the wild-type. Conversely, shoot length in the
characterised (sln1d) and putative (gse1a, gse1j, gse1n) SLN1 stabilising mutants, was lower
than that of the wild-type (Figure 3.9). Root dry mass was lower for the mutant genotypes
compared to the wild-type, with the exception of the gse1n mutant for which root dry mass

68
was greater than that of the wild-type. With the exception of gse1n, the mutant lines also
had decreased shoot mass compared to the wild-type seedlings, although the sln1c seedlings
had a greater shoot mass than the remaining mutants (Figure 3.10).
Figure 3.9 Root and shoot lengths of wild-type and mutant seedlings (cv Himalaya). Mean shoot lengths are shown; error bars denote standard deviation, asterisks denote significant difference compared to the WT.
Figure 3.10 Root and shoot dry mass of WT and mutant seedlings (cv Himalaya). Values were calculated from the pooled root and shoot masses for each genotype from each experiment.
*
*
* *
* *
0
100
200
300
400
500
600
700
800
WT sln1c sln1d gse1a gse1j gse1n
cv Himalaya
Me
an le
ngt
h (
mm
)
Root
Shoot
0
0.02
0.04
0.06
0.08
0.1
0.12
0.14
0.16
0.18
WT sln1c sln1d gse1a gse1j gse1n
cv Himalaya
Me
an d
ry m
ass
(g)
Root
Shoot

69
3.4.2 Sequence analysis of wild-type and mutant Sln1 alleles
3.4.2.1 Bioinformatic analysis
Promoter identification
The identification of putative promoter regions was conducted using Promoter 2.0 and CG-
compositional strand bias software as described in Section 3.3.3. Promoter 2.0 prediction
software identified a transcription start site (TSS) 279 to 249 bp (31 bp in length) upstream,
and CG-compositional strand bias software identified a TSS 171 to 151 bp upstream of the
ATG start codon of the Sln1 ORF.
GC composition
In order to determine whether the difficulty in amplifying Sln1 was because of the primary
nucleotide sequence composition and extensive secondary structure, the GC composition of
the Morex WT Sln1 ORF was assessed as described in Section 3.3.3. Analysis showed that the
ORF has a GC composition of 70.8 % (Table 3.6).
Table 3.6 Nucleotide composition of the Morex Sln1 ORF. (a)Number of nucleotides in the ORF (ORF = 1857 nt); (b)Percentage composition of the ORF per base; (c)AT and CG composition of the ORF as a percentage.
Base No. of nucleotides (a)
Base composition of ORF (%) (b)
AT/GC composition (%) (c)
A 262 14.1 29.2
T 281 15.1
C 685 36.9 70.8
G 629 33.9
Total 1857 100 100
Sln1 mRNA secondary structure
Sln1 mRNA sequence was analysed using the MFOLD programme as described in Section
3.3.3, in order to identify the extent of secondary structure. The mRNA was predicted to be
highly folded with extensive double stranded regions. A number of stem loop structures are
also visible (Figure 3.11).

70
Figure 3.11 The secondary structure of the Sln1 mRNA.
Identification of conserved motifs
Analysis of the Morex SLN1 sequence using ClustalW software (see Section 3.3.3) identified
key motifs common to DELLA proteins, which are shown in Figure 3.12. This analysis was
conducted in order to determine if mutations in the characterised mutants were within
conserved domains.

71
1MKREYQDGGGSGGGGDEMGSSRDKMMVSSSEAGEGEEVDELLAALGYKVRAS
DMADVAQKLEQLEMAMGMGGPAPDDGFATHLATDTVHYNPTDLSSWVESMLSE
LNAPPPPLPPAPPQLNASTSSTVTGGGGYFDLPPSVDSSSSTYALRPIISPPV
APADLSADSVRDPKRMRTGGSSTSSSSSSSSSLGGGAARSSVVEAAPPVAAAA
AAPALPVVVVDTQEAGIRLVHALLACAEAVQQENLSAAEALVKQIPLLAASQG
GAMRKVAAYFGEALARRVFRFRPQPDSSLLDAAFADLLHAHFYESCPYLKFAH
FTANQAILEAFAGCRRVHVVDFGIKQGMQWPALLQALALRPGGPPSFRLTGVG
PPQPDETDALQQVGWKLAQFAHTIRVDFQYRGLVAATLADLEPFMLQPEGEED
PNEEPEVIAVNSVFEMHRLLAQPGALEKVLGTVRAVRPRIVTVVEQEANHNSG
SFLDRFTESLHYYSTMFDSLEGGSSGGPSEVSSGGAAPAAAAGTDQVMSEVYL
GRQICNVVACEGTERTERHETLGQWRNRLGNAGFETVHLGSNAYKQASTLLAL
FAGGDGYKVEEKEGCLTLGWHTRPLIATSAWRLAAP618
Figure 3.12 Conserved motifs within SLN1. Conserved domains are shown in bold, with the DELLA motif shown in red, LHR I in orange, NLS in light green, VHIID in dark green, LHR II in light blue, PFYRE in purple, and SAW in brown. The DELLA domain is shown in regular font, whilst the GRAS domain is in italics. The 5’ terminal amino acid is designated as co-ordinate ‘1’, and the 3’ terminal amino acid has a co-ordinate of ‘618’.
3.4.2.2 Sequencing and analysis
Sequencing the Sln1 ORF
The Sln1 ORF of the dwf2 (cv H930-36) putative SLN1 GoF mutant, and γ-1 (cv Triumph) and
sln1-1 (cv Herta) putative SLN1 LoF mutants and all corresponding wild-types were amplified
using the conditions described in Section 3.3.5. The Sln1 ORF of the wild-type tiller of H930-
36 dwf2-1 was also amplified. Multiple bands were observed when the PCR product was
analysed electrophoretically (Figure 3.13), however similar bands were observed for all
genotypes. The prominent band of the predicted size (2423 bp) was excised and purified as
described in Section 2.3.1.1.

72
Figure 3.13 Agarose gel electrophoresis of the amplified product of H930-36 dwf2-1 wild-type tiller Sln1 ORF. The sample lane (1) was loaded with 2.5 µL of PCR product. Samples were run on a 0.8% agarose gel (TBE buffer) at 100 V. (M) 2 µL Quick-Load® 100 bp DNA ladder (NEB) was used as molecular weight marker.
All Sln1 ORFs were sequenced (see Section 3.3.5), and nt and aa sequences aligned as
described in Section 2.5. Full sequence for each genotype is presented in Appendix 2.
Sequencing revealed cultivar specific polymorphisms, and mutations that could account for
the altered phenotypes of the cv H930-36 and cv Herta mutants. Comparison of the nt
sequence of the Sln1 ORFs of the wild-type lines showed little cultivar-specific
polymorphism. The sequence of H930-36 wild-type was identical to that of the Morex wild-
type, whilst the sequence of Himalaya, Triumph and Herta wild-types were identical, with
only four single nucleotide polymorphisms (SNPs) identified between their ORFS and that of
the Morex wild-type. None of these nt polymorphisms resulted in aa changes, suggesting a
low level of diversity between these cultivars (Table 3.7).
Sequencing of the H930-36 dwf2 mutant revealed a deletion of 9 nt (position 126-134)
resulting in the deletion of three amino acids, comprising the final aa (A) of the core DELLA
motif, and two aa immediately downstream of the motif (A, L). Four further polymorphisms
between the wild-type and the dwf2 mutant (nt position 90, G→A; nt position 420 and 1074,
T→C; nt position 1272, T→G) were identified although all were silent substitutions.
Sequencing of clones obtained from the wild-type phenotype tiller of H930-36 dwf2-1
resulted in heterogeneity at nt position 1155, with two clones containing G (homologous

73
with wild-type sequence), and two clones containing A at this positions. Direct sequencing of
a PCR product was used to clarify the heterogeneity the ORF sequence, and a mixed profile
(G or A) was produced at nt position 1155. The G to A substitution at nt position 1155 would
result in a premature stop codon at aa position 385 (W stop) in the LHR II region of the
domain, which could result in the protein lacking the 589 C-terminal amino acids. Two
further SNPs were identified between H930-36 dwf2 and H930-36 dwf2-1 wild-type
phenotype tiller, (nt position 90, A→G; nt position 1776, G A), although these
substitutions were silent, producing no change in aa sequence compared to the H930-36
wild-type.
The Herta sln1-1 mutant contains a SNP at nt position 748 (G T, in bold Table 3.7),
producing a premature stop codon in the LHR I motif of the GRAS domain at aa position 250
(E stop), resulting in a protein potentially lacking 368 C-terminal amino acids. As the wild-
type and γ-1 mutant of cv Triumph exhibited complete homology in Sln1 sequence, qRT-PCR
was used to establish whether altered expression of Sln1 accounted for differences in
phenotype.
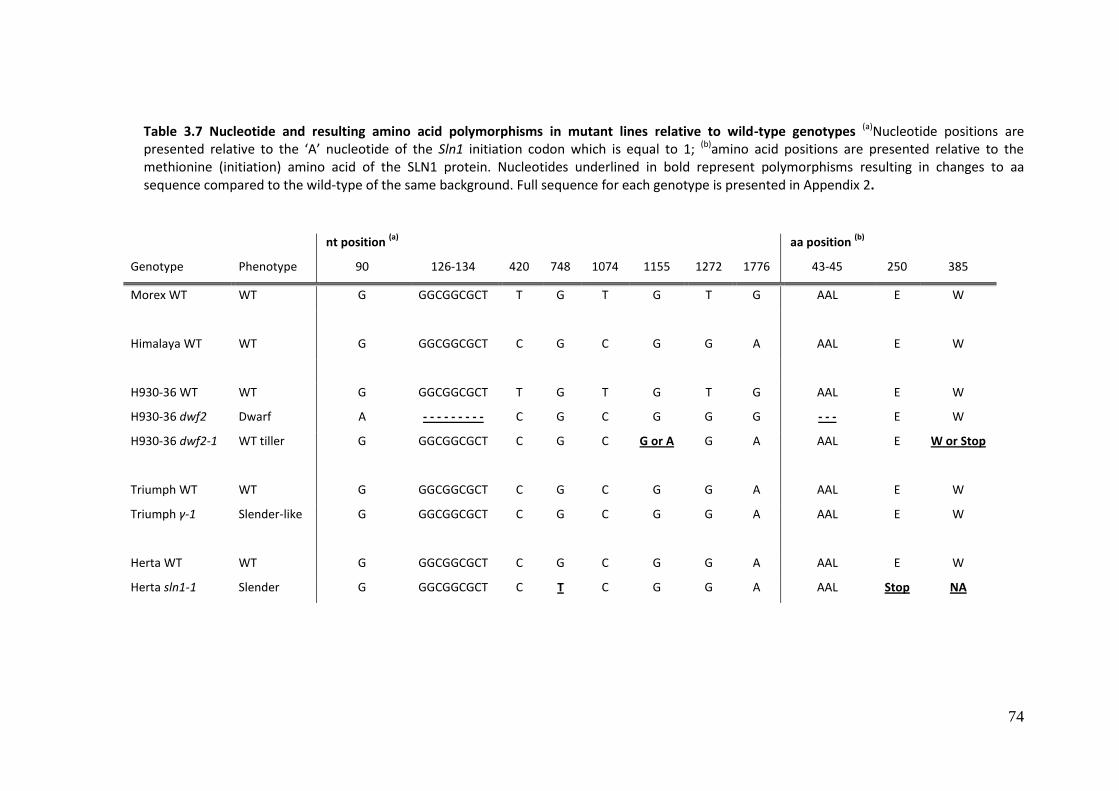
74
Table 3.7 Nucleotide and resulting amino acid polymorphisms in mutant lines relative to wild-type genotypes (a)Nucleotide positions are presented relative to the ‘A’ nucleotide of the Sln1 initiation codon which is equal to 1; (b)amino acid positions are presented relative to the methionine (initiation) amino acid of the SLN1 protein. Nucleotides underlined in bold represent polymorphisms resulting in changes to aa sequence compared to the wild-type of the same background. Full sequence for each genotype is presented in Appendix 2.
nt position (a)
aa position (b)
Genotype Phenotype 90 126-134 420 748 1074 1155 1272 1776 43-45 250 385
Morex WT WT G GGCGGCGCT T G T G T G AAL E W
Himalaya WT WT G GGCGGCGCT C G C G G A AAL E W
H930-36 WT WT G GGCGGCGCT T G T G T G AAL E W
H930-36 dwf2 Dwarf A - - - - - - - - - C G C G G G - - - E W
H930-36 dwf2-1 WT tiller G GGCGGCGCT C G C G or A G A AAL E W or Stop
Triumph WT WT G GGCGGCGCT C G C G G A AAL E W
Triumph γ-1 Slender-like G GGCGGCGCT C G C G G A AAL E W
Herta WT WT G GGCGGCGCT C G C G G A AAL E W
Herta sln1-1 Slender G GGCGGCGCT C T C G G A AAL Stop NA
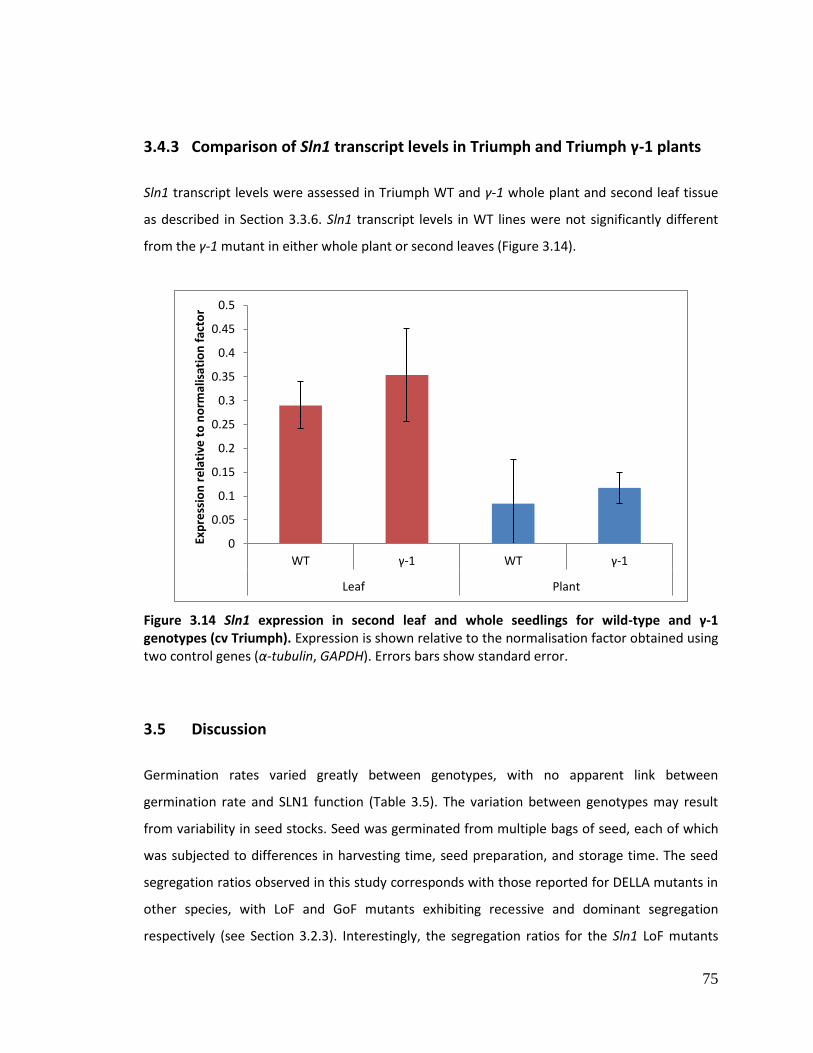
75
3.4.3 Comparison of Sln1 transcript levels in Triumph and Triumph γ-1 plants
Sln1 transcript levels were assessed in Triumph WT and γ-1 whole plant and second leaf tissue
as described in Section 3.3.6. Sln1 transcript levels in WT lines were not significantly different
from the γ-1 mutant in either whole plant or second leaves (Figure 3.14).
Figure 3.14 Sln1 expression in second leaf and whole seedlings for wild-type and γ-1 genotypes (cv Triumph). Expression is shown relative to the normalisation factor obtained using two control genes (α-tubulin, GAPDH). Errors bars show standard error.
3.5 Discussion
Germination rates varied greatly between genotypes, with no apparent link between
germination rate and SLN1 function (Table 3.5). The variation between genotypes may result
from variability in seed stocks. Seed was germinated from multiple bags of seed, each of which
was subjected to differences in harvesting time, seed preparation, and storage time. The seed
segregation ratios observed in this study corresponds with those reported for DELLA mutants in
other species, with LoF and GoF mutants exhibiting recessive and dominant segregation
respectively (see Section 3.2.3). Interestingly, the segregation ratios for the Sln1 LoF mutants
0
0.05
0.1
0.15
0.2
0.25
0.3
0.35
0.4
0.45
0.5
WT γ-1 WT γ-1
Leaf Plant
Exp
ress
ion
re
lati
ve t
o n
orm
alis
atio
n f
acto
r

76
(sln1c, cv Himalaya; sln1-1, cv Herta; Table 3.5) was lower than the 1 : 0.25 expected for
recessive mutants, suggesting seeds homozygous for the mutant alleles may exhibit reduced
germination compared to WT/mutant heterozygotes or WT/WT homozygotes. Whilst the
germination rate of the sln1c mutant was not reported by Chandler et al. (2002), it was reported
that α-amalase production in endosperm half-grains was greater in sln1c mutant seed compared
to the wild-type, suggesting differences in seed composition may account for the reduced
germination (and subsequent segregation ratios) for LoF mutant homozygotes. Analysis of seed
width and length in the Sln1 GoF and Gse1 mutants suggests the stabilisation of SLN1 does not
affect seed size, although further study is required to determine the effect on seed composition
and total yield. In wheat, the dwarf DELLA GoF mutants (RhtB-B1b, Rht-D1b and Rht-B1C (also
termed Rht3, Börner et al., 1996)) were shown to provide a greater grain yield than taller
varieties as a result of the diversion of assimilate from the stem to the developing ear. A higher
grain number per ear was also observed in the Rht dwarf mutants compared to the wild-type
(Flintham et al., 1997), although at the cost of reduced mean weight (Flintham et al., 1997), a
trend that the TGW data presented in this study supports (Figure 3.4).
The sln1-1 (cv Herta) and dwf2 (cv H930-36) mutants were phenotypically similar to the sln1c
and sln1d mutants (cv Himalaya) first characterised by Chandler et al., 2002, and the observed
slender and dwarf phenotypes were consistent with those typical of GRAS and DELLA domain
mutants (see Section 3.2.3). Root and shoot dry mass data was only collected from mutants in
the Himalaya background, meaning direct numerical comparisons between the novel mutants,
sln1-1 (cv Herta) and dwf2 (cv H930-36) and their corresponding wild-types could not be made.
Observations of root and shoot development suggests the stabilisation of SLN1 can reduce both
root and shoot length (sln1d; Figure 3.9). Conversely, loss of SLN1 function had little apparent
effect on root length, but resulted in increased shoot length compared to the wild-type, Sln1
GoF and Gse1 mutants (sln1c; Figure 3.9). With the exception of the gse1n mutant, the
stabilisation of SLN1 appeared to reduce overall plant mass, which is consistent with the role of
DELLA as an inhibitor of plant growth (Harberd et al., 2003). Reduced overall plant mass was
also observed in the sln1c mutant (Figure 3.10). Although no notable differences were observed
between sln1c and wild-type root length, the narrow leaves and slender stems of the sln1c
plants could account for the reduced shoot biomass compared to the wild-type (Figure 3.10).
The growth of the Gse1 mutants in this study was not consistent with the growth observed by
77
Chandler et al., 2008, who report the gse1n mutant had a more dwarfed phenotype than the
gse1a and gse1j mutants. In this study, the gse1n mutant showed greater mean shoot length
compared to gse1a (Figure 3.9), with mean root and shoot mass greater for the gse1n mutant
than for the gse1a and gse1j mutants (Figure 3.10). The length and mass results presented in
this chapter provided the basis for subsequent studies investigating the effect of salt and heat
stress on seedling growth and development.
Bioinformatic analysis was performed on SLN1 sequence to identify conserved regions and
motifs so that the impact of mutations affecting these areas could be assessed. Although
bioinformatic analysis was conducted on wild-type sequence derived from the Morex
background, analysis of the Sln1 ORF and mRNA secondary structure is widely applicable to all
the genotypes sequenced in this study, due to the high level of Sln1 ORF sequence homology
between the genotypes. Despite the presence of several nt differences between the wild-type
genotypes of the five analysed cultivars, the high degree of conservation in aa sequence
suggests conservation of aa sequence is integral to SLN1 function either through the
maintenance of key motifs or regions, or its importance in protein folding. That said, the
potential importance of specific nt for maintaining RNA processing stability in RNA cannot be
discounted. Sln1 ORF analysis accounts for the difficulties experienced in this study in
characterising Sln1 at the molecular level. The high GC content of the Sln1 ORF (approximately
70%; Table 3.6), commonly results in a high level of self-complementary strand binding. Fold
analysis predicted an extensively closed structure, with a high degree of folding and stem loop
structures; features that impair polymerase binding and activity. Furthermore, PCR amplification
of GC rich sequence requires the use of high annealing temperatures, and often restricts the
design of primer sequences (to prevent primer secondary structure or primer dimer formation)
thereby limiting flexibility in PCR programme design. Although secondary structure can be
relaxed using chemical means (e.g. the addition of glycerol or DMSO to the PCR mix; Frackman
et al., 1998) this can decrease the fidelity of the PCR. Problems with molecular analysis of Sln1
were also experienced during sequencing, from which only relatively short reads could be
achieved. To overcome these problems, PCR conditions were continuously altered and tested.
Changes were made to PCR reagent concentrations, PCR components, primer pairs, and cycling
conditions. The key to overcoming the amplification problems came with the implementation of
a ‘touchdown’ PCR programme, designed to amplify with less stringency during early cycles,

78
followed by high levels of specificity during final cycles. Difficulties with amplification of barley
and wheat DELLAs are widely acknowledged (Pearce et al., 2011; personal communications, Dr.
A. Phillips, Rothamsted Research, UK., Dr. P. Chandler, CSIRO, Canberra Australia, Dr. R. Saville
and Dr. N Al-Kaff, JIC, UK). The extensive secondary structure can also decrease efficiency and
fidelity of reverse transcription, to alleviate this, the techniques proven successful for Rht mRNA
were followed (Saville, 2011).
This study led to the identification of a novel Sln1 GoF mutant, dwf2 (cv H930-36), and the
characterisation of a stored (but unclearly labelled) seed stock as the sln1-1 (cv Herta) mutant
described in Fu et al. (2002), meaning the alternative hypothesis (H1) was accepted for these
two mutant genotypes. The dwf2 mutant shared phenotypic and Sln1 ORF sequence similarities
with the barley DELLA domain mutant sln1d (cv Himalaya), characterised by Chandler et al.,
2002. The sln1d mutant resulted from a single aa substitution in the DELLA region (DELLAALG →
DELLAALE), in the same region deleted in the dwf2 mutant (DELLAALG → DELL---G). The dwf2
mutant is consistent with the findings of Itoh et al. (2002), in that partial deletion of the DELLA
motif results in a GA unresponsive dwarf mutant. The dwf2 mutant further highlights the
importance of the DELLA domain in GA-GID1-mediated degradation of DELLA proteins (Sun et
al., 2010).
The sln1-1 (cv Herta) mutant phenotype, although similar to that of the sln1c (cv Himalaya)
mutant (Chandler et al., 2002), was less severe. While some disparity in phenotype may be
accounted for by varietal differences, it might be expected that the sln1-1 mutant would have a
more severe slender phenotype, as the sln1c mutant results from a 16 aa deletion at the 3’
terminal, just after the SAW domain, and has therefore not lost any conserved motifs, whereas
the sln1-1 mutant lacks most of the LHR II domain, and the entire PFYRE and SAW motifs. A
similar effect was reported in rice, where the slr1-1 to slr1-4 GRAS domain mutants resulted in
slender phenotype mutants (see Section 3.2.3) without a difference in the strength of the
slender phenotype being reported (Ikeda et al., 2001). The sln1c, sln1-1, and slr1-2 to slr1-4
mutants result from premature stop codons. Premature stop codons can result in a truncated
protein, but may also result in the non-production of the protein because of RNA instability (e.g.
nonsense-mediated decay), giving the potential for the production of a dominant negative
mutant, a partially functional protein, or no protein at all. The difficulty in determining whether

79
mutations in the Sln1 ORF mutations result in LoF DELLA proteins or the non-production of
proteins is highlighted by the sln1b and sln1c mutants in the Himalaya background (Chandler et
al., 2002). Both mutants result in near identical phenotypes, despite the sln1c mutation resulting
in a LoF protein, whilst SLN1 is absent in the sln1b mutant. It therefore cannot be determined
whether the difference in SLN1 protein levels is due to the altered functions of the mutant
protein, decreased susceptibility to GA-mediated degradation (e.g. by altered intracellular
location), or to general ubiquitin-mediated degradation as a result of protein misfolding.
The nucleotide ORF sequence of the H930-36 dwf2-1 mutant was unexpected, as it more closely
resembled the Himalaya, Triumph or Herta wild-type ORF sequences than the H930-36 wild-type
sequence (Table 3.7). The dwf2-1 phenotype is unlikely to result from two seeds planted in the
same pot, as seeds were pre-germinated on filter paper and transferred to soil as young
seedlings, one seedling per pot. Great care was taken to ensure that the sequence was correct,
with sequence outputs generated from several PCR products checked multiple times. Proof-
reading polymerase was consistently used to minimise the possibility of mis-amplification, and
laboratory standard operating procedures closely followed to prevent cross-contamination
between samples. The dwf2-1 mutant is likely a chimera, resulting from the simultaneous
expression of both wild-type and loss of function or non-functional Sln1 genes. The emergence
of chimeric plants is not uncommon in plants regenerated from tissue culture (Orton, 1980),
which was the method used in the generation of the original dwf2 mutant (Falk, 1994).
The γ-1 mutant in the Triumph background was initially investigated due to its slender-like
phenotype, and for its potential use in stress response experiments. The preliminary stages of
analysis did not support the case for the γ-1 mutant being a Sln1 LoF mutant. Whilst being
phenotypically similar to Sln1 LoF mutants, the γ-1 mutant phenotype was less extreme than the
characterised Sln1 LoF mutants. Furthermore segregation ratios did not support the case for the
γ-1 mutant being a Sln1 LoF mutant, as all germinating γ-1 mutant seed developed a slender-like
phenotype, whereas Sln1 LoF mutants exhibited recessive segregation for the slender
phenotype. Sequencing of the γ-1 mutant and the corresponding wild-type revealed the ORFs to
be completely homologous in terms of both nt and aa sequence, suggesting the γ-1 mutant
phenotype was not the result of differences in SLN1 structure. Finally, the parity in Sln1
transcript levels between the two genotypes suggest the γ-1 mutant phenotype is not caused by

80
differential expression of Sln1, rather the γ-1 mutant results from changes to a gene or genes
other than Sln1. The alternative hypothesis (H1) was therefore rejected in favour of the null
hypothesis (H0) for the Triumph γ-1 mutant genotype. Very few taller than wild-type mutants of
cereals have been identified, and the ones that have are characteristically recessive alleles.
Recessive mutants such as the ao-1 and eui mutants of rice (Aoki et al., 2002; Zhu et al., 2006)
exhibit elongated internode lengths as a result of negative regulation of the GA signalling
pathway. Shoot and internode elongation has been observed in rice growing under flood
conditions resulting from activation of the SNORKEL1 and SNORKEL2 genes that code for
transcription factors that regulate ethylene signalling (Hattori et al., 2009). The phenotypic
similarities between the γ-1 mutant and the elongated internode mutants of rice suggest the γ-1
mutant may result from mutations to the GA or ethylene signalling pathways. Quantification of
Sln1 transcript also inferred information about expression and localisation of SLN1. Sln1
expression levels were significantly higher in second leaf material than in the whole plant
material, suggesting Sln1 is preferentially expressed in the growing leaf. This is consistent with
the findings of Chandler et al., 2002, which found that the SLN1 protein was localized almost
exclusively to the leaf elongation zone.

81
Chapter 4: The Importance of DELLA on Salt Stress Tolerance in Barley
4.1 Aims
The aim of the work described in this chapter was to determine whether data obtained by
Achard et al. (2006, 2008c) showing that DELLA proteins are important in the survival of salt
stress by Arabidopsis, could be translated to barley. The approach taken was to identify whether
differences in SLN1 function affect the survival of salt stress in barley, by subjecting Sln1
mutants and their corresponding wild-types to saline conditions. The effect of salt on root and
shoot growth of surviving plants was also investigated. To further understand the role of SLN1,
preliminary experiments were conducted to determine whether SLN1 status affects
accumulation of sodium and uptake of other macroelements, in root and shoot tissues.
The following hypothesise were formulated. H1: Sln1 GoF mutants exhibit increased survival and
are less susceptible to saline stress compared to the wild-type. Conversely, Sln1 LoF mutants
exhibit decreased survival and increased susceptibility to saline stress compared to the wild-
type; H0: SLN1 has no effect on plant survival or susceptibility to saline stress.
4.2 Introduction
Salinity jeopardises the capacity of agriculture to produce enough food to meet the needs of a
burgeoning world population (Flowers, 2004). The amount of land available to agriculture is set
to decline due to global warming, which will increase soil degradation, water scarcity, and the
unpredictability of weather patterns (Utset & Borroto, 2001; Khush, 1999; Vinocur & Altman,
2005; Ericsson & Nilsson, 2006). Changes in land use through urbanisation and industrialisation
will further reduce the availability of land for food production (Khan et al., 2006). Consequently
future food production strategies will seek to reduce the rate of land lost through salinisation,
whilst maximising output from saline soils through the introduction of novel salt tolerant
varieties.

82
4.2.1 Mechanisms of saline damage
Plants exposed to saline conditions encounter three fundamental problems: 1) a reduction in
water availability due to osmotic imbalance between the roots and the surrounding
environment, 2) interference of salt ions with metabolic processes within the cell, and the
resulting production of ROS, and 3) competition between essential ions and similarly charged
toxic ions for uptake by roots (Pasternak, 1987; Apel & Hirt, 2004; Zhu, 2002). Susceptibility to
salt depends on plant species, growth stage, and the amount of water passing through the root
zone. Plants have evolved mechanisms to cope with saline stress at the cellular and whole plant
level, through isolation of ions and ROS in specially adapted morphological structures, and
remediation through stress response pathways. Plants most successfully adapted to saline
conditions are likely to use more than one of these pathways (El-Sharkawy, 1989). Salt tolerance
adaptations are both genetically and physiologically complex, and under polygenic control
(Flowers, 2004). Plant response to salt stress is similar to that of drought response, and involves
major changes in gene expression.
4.2.2 Salt stress response
Prevention of ion interference and ROS production
Toxic inorganic ions are normally excluded from the cell, however cellular exclusion is used in
response to sudden salt shocks, whilst long term adjustment relies on Na+ compartmentalisation
in the vacuoles of shoot and leaf cells (Ellouzi et al., 2011). Toxic inorganic ions are removed
from the cytoplasm via the Na+/H+ antiporter and H+-ATPase systems on the plasma membrane,
or the Na+/H+ antiporter on the tonoplast, which sequesters Na+ to the vacuole. In Arabidopsis,
the vacuolar Na+/H+ exchanger AtNHX1 (Shi & Zhu, 2002) is expressed in response to increased
ABA during osmotic stress. Cytotoxicity is a consequence of the accumulation of ions in the
cytosol that result in the substitution of K+ by Na+ in biochemical reactions and conformational
changes and loss of protein function. The ensuing metabolic imbalances may cause the
production of free radical and ROS oxidative agents (Chinnusamy et al., 2005; Zhu, 2002).
Concentrations > 0.4 M Na+ and Cl- inhibit most enzymes by disturbing the electrostatic bonds
required for protein folding and catalysis (Wyn Jones & Pollard, 1983), however concentrations

83
as low as 0.1 M Na+ are cytotoxic, suggesting a more direct interference between Na+ and the
substrates of cellular reactions (Serrano, 1996).
DELLA and salt tolerance
The role of DELLAs in resistance to salt stress was first identified in Arabidopsis by Achard et al.
(2006). A strong correlation between the relative growth and developmental effects of DELLA
and salt stress tolerance (ρ = -0.96 and 0.94 respectively) was observed in a further study
(Achard et al., 2008c), suggesting a common regulatory mechanism.
DELLA levels are post transcriptionally regulated through GA-mediated degradation (Achard et
al., 2006). Salt treated wild-type Arabidopsis plants showed lower levels of bioactive GA (GA1
and GA4) compared to untreated plants (Achard et al., 2006), whilst GFP tagged DELLA (GFP-
RGA) was shown to accumulate to higher levels in the roots of salt treated plants, despite a lack
of detectable changes in RGA transcript levels. Salt therefore restricts growth through a DELLA-
dependent mechanism associated with reduced accumulation of bioactive GA and subsequent
DELLA accumulation (Achard et al., 2006).
Arabidopsis “quadruple-DELLA mutants” lacking four (GAI, RGA, RGL1 and RGL2), of the five
DELLAs encoded by the Arabidopsis genome showed reduced growth inhibition under saline
conditions compared to the wild-type. Salt slowed the rate of leaf production and expansion,
biomass accumulation, and root growth in wild-type plants, but had a less inhibitory effect on
the quadruple-DELLA mutant, suggesting DELLA inhibits plant growth and development in
response to salt stress (Achard et al., 2006). However, the quadruple-DELLA mutant showed
decreased survival in 200 mM NaCl compared to the wild-type (5% and 36% survival,
respectively), whilst mutants with increased DELLA accumulation, either through diminished GA
biosynthesis (ga1-3) or decreased GA-DELLA interaction (gai), showed increased survival (93%
and 82% respectively) (Achard et al., 2006). Thus, DELLAs provide a mechanism for
environmentally-responsive growth regulation in Arabidopsis.

84
4.3 Materials and methods
4.3.1 Plant material
Barley lines were selected based on mutations present in genes involved in the GA signal
transduction pathway. Those available contained mutations either within the Sln1 gene (cv
Himalaya: sln1c, sln1d; cv H930-36: dwf2; cv Herta: sln1-1), or within the Gse1 gene (cv
Himalaya: gse1a, gse1j, gse1n). The cv Himalaya mutants had been characterised by Chandler et
al. (2002, 2008), whilst cv H930-36 and cv Herta Sln1 mutants were characterised as part of this
study (see Chapter 3). Investigation of the role of SLN1 in salt stress tolerance initially focused
on the Himalaya background in which characterised LoF and GoF Sln1 mutants and Gse1
mutants were available (Chandler et al., 2002, 2008). Further mutants (cv Herta: sln1-1; cv
H930-36: dwf2) were included once they had been molecularly characterised. Plants of the Sln1
LoF mutant genotypes sln1c (cv Himalaya) and sln1-1 (cv Herta) have a slender phenotype,
whilst the GoF mutants sln1d (cv Himalaya) and dwf2 (cv H930-36) have a dwarf phenotype.
Plants containing the mutant gse1a, gse1j and gse1n alleles exhibit dwarf and semi-dwarf
phenotypes (Chandler et al., 2008).
4.3.2 Plant growth and salt stress
Growth conditions
Seeds for the mutant barley genotypes listed in Section 4.3.1, and their corresponding wild-
types were stratified as described in Section 2.1.3.1 and then germinated on filter paper in Petri
dishes in a CER (16 h photoperiod, 20 °C) for two days. Salt stress response was investigated
using hydroponic culture and plants at a similar developmental stage. Seedlings were grown to
the 2-3 leaf stage (only those with roots longer than 3 cm were used), then gently removed
from the filter paper and supported at the base of the stem by foam bungs, which were secured
in 50 ml polypropylene centrifuge tubes (Corning Inc., Corning, NY, USA) which had their bases
and caps removed. The tubes were placed in custom steel racks (JIC workshop) in 10 L plastic
containers (Tontarelli, Castelfidardo, Italy) containing Hoagland’s solution (x 0.5). Seedlings from
each line under test were positioned randomly in the racks. The size of the plastic containers
and steel racks limited plant numbers to a maximum of 28 seedlings per treatment per
experiment. As there was no information available regarding the salt tolerance of the barley

85
cultivars used, it was necessary to conduct preliminary experiments in order to establish the
conditions that would maximise the chance to identify any possible differences between wild-
type and mutant lines. Seedlings were acclimatised to hydroponics in Hoagland’s solution (x 0.5)
for two days before transfer to the respective treatment solutions. Plants were transferred to
Hoagland’s solution (x 0.5) containing 0, 100, 200 or 300 mM NaCl or 0, 150, 250 or 500 mM
NaCl (for preliminary experiments), for a 10 day period. Solutions were aerated by daily
transference of solutions between two containers, or for the preliminary experiments, by
constant aeration using air pumps (Rena Air 100 & 200, Rena Aquarium Equipment, Charlotte,
NC, USA; Tetratec APS 100, Spectrum Brands, Madison, WI, USA). An example of the
experimental conditions is shown in Figure 4.1.
Figure 4.1 Preliminary hydroponics experiment using cv Himalaya seedlings (wild-type, sln1c, sln1d, gse1a, gse1j, gse1n) showing plant development after 10 days treatment in 0, 150, 250 or 500 mM NaCl. Polythene film was used to prevent splashing of solution on stems and leaves during aeration with an air pump.

86
Sample size
Phenotypic observations and growth measurements were made for each experiment using 4 -14
seedlings of each genotype per treatment. Element accumulation studies were conducted for a
single experiment, and pooled samples consisting of 4 – 10 seedlings for each genotype per
treatment were collected.
4.3.3 Assessment of plant growth
Survival was assessed visually after 10 days of treatment, with plants defined as dead if leaf and
stem necrosis was extensive or total. After 10 days treatment, root and shoot lengths were
measured for all seedlings, and roots and shoots separately frozen in liquid nitrogen before
being freeze dried (Edwards Modulyo Freeze-Dryer, Edwards Lab, Sandusky, OH, USA) for five
days. When recording root and shoot dry mass, samples from dead seedlings were included in
the analysis of cv Himalaya, but analysis of cv H930-36 data did not include tissue from dead
seedlings. For Himalaya wild-type and mutant plants, mean mass values were calculated for the
pooled samples for each genotype for each treatment. For measurements of growth (root and
shoot dry mass and length), mean values for salt treated groups were normalised against the
control group (0 mM NaCl) for each genotype, by expressing growth in salt as a percentage of
growth under control conditions (control group growth being equal to 100%). As root and shoot
dry masses in the Himalaya background were calculated from pooled samples, standard
deviation could not be calculated. Individual masses were used to obtain standard deviation
values for dry mass in the H930-36 background, and root and shoot lengths in Himalaya, H930-
36 and Herta backgrounds. Samples were weighed to four decimal places and dry mass
recorded. Root length data were collected by measuring the longest root of each seedling.
Further observations were made including tiller and leaf number, and number of developing
roots, as well as root necrosis and root fine hair formation. As qualitative, non-numerical
assessments were made of root necrosis and root fine hair formation; median values are
presented in the results.
Chlorosis was observed in seedlings developing during the salt treatment period. As chlorosis is
indicative of decreased photosynthetic potential, photosynthetic yield was measured using the
MINI-PAM Photosynthesis Analyzer (Walz, Effeltrich, Germany). Initial attempts to measure

87
chlorophyll levels using a SPAD meter were unsuccessful because seedling leaves were too
narrow. Measurements were taken two days into the treatment period. This time point was
chosen as leaf chlorosis was observable at this point, but leaf necrosis was not extensive enough
to prevent readings from being obtained. Three measurements were taken over the central
region of the first and second leaves, and the median values recorded. Median values were used
so as to remove extreme values that could result from taking measurements from
unrepresentative areas of the leaf.
4.3.4 Analysis of element accumulation
Analyses were carried out to determine whether SLN1 affects the accumulation of elements in
roots and shoots in the presence or absence of salt. Wild-type and mutant (sln1c, sln1d) cv
Himalaya seedlings were grown in Hoagland’s solution containing 0 mM NaCl or 100 mM NaCl,
as described in Section 2.1.3.3. After one week, seedlings were removed from the solutions and
excess hydroponics solution removed by dipping the roots several times in a large volume of
sterile distilled water followed by gentle blotting on absorbent paper towels. Root and shoot
material was separated, and samples from the same genotype and treatment combined, freeze
dried, and ground to a fine powder using a 8000 M Mixer/Mill (Glen Creston, Middlesex, UK).
Samples were submitted to Mr. Graham Chilvers (University of East Anglia, Norwich, UK) for
analysis. For each sample, approximately 3 mg of powdered root or shoot material was
incubated at 150 °C for 4 h with 1 ml high purity HNO3 in sealed boro-silicate tubes. The treated
samples were diluted with high purity MQ Water from the Elga water purification system (Elga
LabWater, Marlow, Buckinghamshire, UK). Rhodium was added at the dilution stage for use as
an internal standard. Spectrophotometric analysis was performed using the Thermo Electron X5
Series IICP-MS (Thermo Scientific, Wilmington, DE, USA). The spectrophotometer was run in
standard resolution mode at a nebulising rate of 600 µL min-1. Standard performance checks
were run to assure correct performance. Each sample was run in triplicate, with any changes or
drift automatically corrected using the internal standard. Levels of sodium (Na), potassium (K),
calcium (Ca), magnesium (Mg) and phosphorus (P) were expressed as parts per million (ppm).

88
4.4 Results
4.4.1 Preliminary experiment
A preliminary experiment was conducted in order to establish the saline conditions needed to
produce an approximately 50% survival rate for wild-type seedlings (cv Himalaya). Several
mutant lines were also included. Survival results for the preliminary experiment were obtained
using 4 - 5 seedlings per genotype per treatment. All wild-type seedlings survived the non-saline
control conditions (0 mM NaCl); conversely none survived the highest level of salinity (500 mM
NaCl). Intermediate treatments (150 and 250 mM NaCl) produced survival closer to the desired
level amongst the wild-type seedlings (60% and 20% respectively; Table 4.1). Although sample
numbers were small there was increased survival (100%) of two lines (sln1c and gse1a) at 150
mM NaCl compared to the wild-type (60% survival). The Sln1 GoF mutant sln1d and the gse1n
mutants showed slightly increased survival (80% and 75%, respectively) whereas another Gse1
mutant gse1j survived slightly less well (50% survival). A considerable reduction in seedling
survival was observed between 150 and 250 mM NaCl treatments for most lines, with only gse1j
showing little reduction (10%) in survival and gse1n showing complete survival at 250 mM NaCl
(Table 4.1). None of the alleles were able to confer seedling survival at 500 mM NaCl. Based on
the results of this preliminary experiment, treatment at 100, 200, 300 mM NaCl were selected
for subsequent experiments.

89
Table 4.1 Survival (%) of salt stress by cv Himalaya seedlings. The data were obtained from a preliminary experiment designed to identify appropriate NaCl concentrations. Hydroponic treatment was conducted using 0.5 x Hoagland’s solution and 0, 150, 250 or 500 mM NaCl. Data was collected 10 days after treatment commenced.
NaCl concentration
Genotype 0 mM 150 mM 250 mM 500 mM
WT 100 60 20 0
sln1c 100 100 0 0
sln1d 100 80 40 0
gse1a 100 100 40 0
gse1j 100 50 40 0
gse1n 100 75 100 0
4.4.2 Seedling survival
Using the experimental conditions established by the preliminary experiment, plant survival was
measured in further experiments using Himalaya (wild-type, sln1c, sln1d, gse1a, gse1j, gse1n),
H930-36 (wild-type, dwf2), and Herta (wild-type, sln1-1) backgrounds.
Survival data was initially assessed using generalised linear models, which generated survival
prediction values for each genotype under each test condition (0 mM – 300 mM NaCl). As the
data was non-parametric, Mann-Whitney U tests were used to calculate significant differences
between the test groups. Survival results for cv Himalaya (Figure 4.2a) were obtained using 4 -
10 seedlings per genotype per treatment. No survival differential was observed between
genotypes treated with 0, 100 or 200 mM NaCl, indeed all seedlings survived these
concentrations. However at 300 mM NaCl, the LoF mutant sln1c showed lower survival (only 2/9
seedlings survived) compared to the wild-type (10/10 seedlings survived), although this
difference was not statistically significant (P: 0.167). Furthermore, there was no significant
difference in survival between sln1c and the putative SLN1 stabilising mutants (sln1d, gse1a,
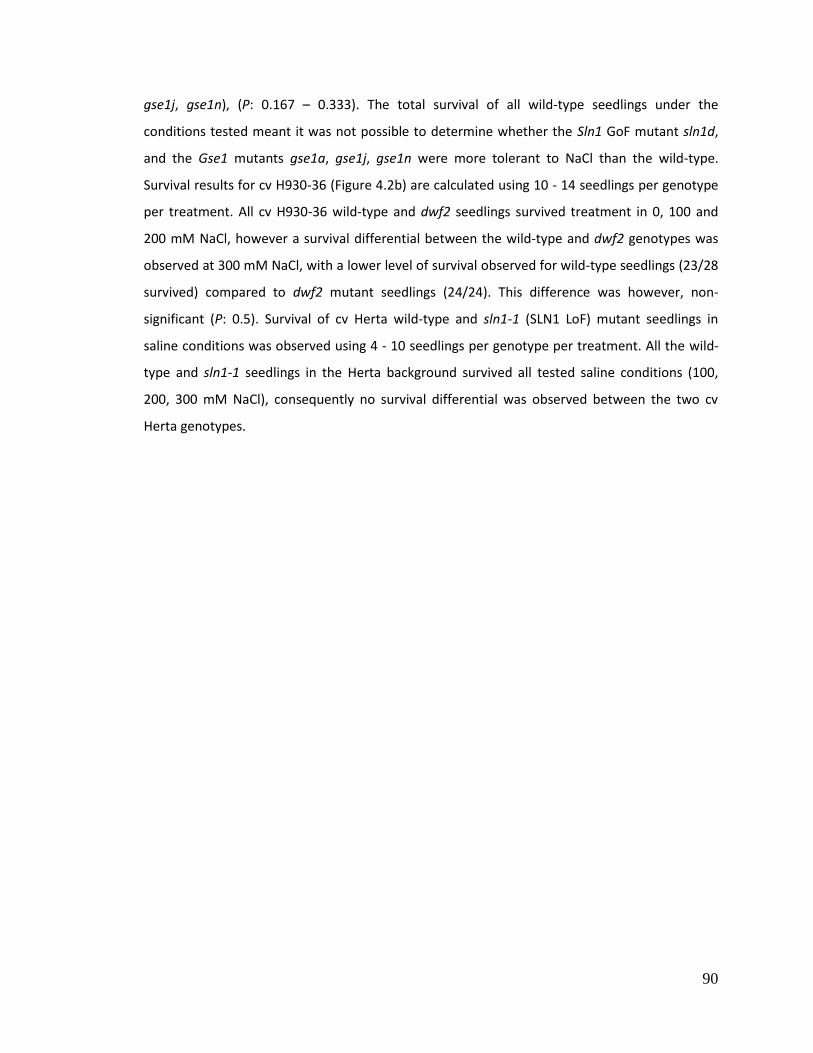
90
gse1j, gse1n), (P: 0.167 – 0.333). The total survival of all wild-type seedlings under the
conditions tested meant it was not possible to determine whether the Sln1 GoF mutant sln1d,
and the Gse1 mutants gse1a, gse1j, gse1n were more tolerant to NaCl than the wild-type.
Survival results for cv H930-36 (Figure 4.2b) are calculated using 10 - 14 seedlings per genotype
per treatment. All cv H930-36 wild-type and dwf2 seedlings survived treatment in 0, 100 and
200 mM NaCl, however a survival differential between the wild-type and dwf2 genotypes was
observed at 300 mM NaCl, with a lower level of survival observed for wild-type seedlings (23/28
survived) compared to dwf2 mutant seedlings (24/24). This difference was however, non-
significant (P: 0.5). Survival of cv Herta wild-type and sln1-1 (SLN1 LoF) mutant seedlings in
saline conditions was observed using 4 - 10 seedlings per genotype per treatment. All the wild-
type and sln1-1 seedlings in the Herta background survived all tested saline conditions (100,
200, 300 mM NaCl), consequently no survival differential was observed between the two cv
Herta genotypes.

91
(a)
(b)
Figure 4.2 Survival values for plants grown for 10 days in 100, 200, 300 mM NaCl or control (0 mM NaCl) conditions. Prediction values were generated from survival data using general linear models. Values of 1 represent the prediction of total survival, and 0 total death of all samples of the genotype under the stated treatment condition. Genotype and NaCl concentrations (mM) are on the x-axis. Results are presented for (a) cv Himalaya, (b) cv H930-36.
0
0.2
0.4
0.6
0.8
1
1.2
WT
sln
1c
sln
1d
gse1
a
gse1
j
gse1
n
WT
sln
1c
sln
1d
gse1
a
gse1
j
gse1
n
WT
sln
1c
sln
1d
gse1
a
gse1
j
gse1
n
WT
sln
1c
sln
1d
gse1
a gs
e1j
gse1
n
0 mM 100 mM 200 mM 300 mM
cv Himalaya
Pre
dic
tio
n v
alu
e

92
4.4.3 Root and shoot mass
Root and shoot mass were used as an indicator of plant growth. In the preliminary experiment,
data were obtained using cv Himalaya and 4 - 5 seedlings per genotype per treatment. All saline
conditions (150, 250 and 500 mM NaCl) resulted in reduced mean root and shoot mass (dry
weight) for both wild-type and putative SLN1 stabilising mutant seedlings (sln1d, gse1a, gse1j,
gse1n) compared with seedlings grown in the absence of NaCl (Figure 4.3a). In contrast, the
mean root mass of sln1c seedlings treated with 150 mM NaCl exceeded that of control (treated
in 0 mM NaCl) sln1c seedlings. Indeed, the root mass of sln1c seedlings decreased less under
saline treatment (150, 250 and 500 mM) than for the wild-type. Accumulation of root biomass in
three of the four putative SLN1 stabilising mutants, (sln1d, gse1a, gse1j) was less inhibited than
(or equal to) that of the wild-type at 150, 250 and 500 mM NaCl conditions. Following treatment
with 150 and 250 mM NaCl, root growth inhibition in the putative SLN1 stabilising mutants
decreased in the order of sln1d > gse1a > gse1j > gse1n, although in 250 mM NaCl the gse1n
mutant showed decreased mass compared to the wild-type roots (Figure 4.3a). All mutants
retained root mass better than the wild-type seedlings after treatment with 500 mM NaCl.
Following treatment in 150 mM NaCl, the trend of shoot growth generally corresponded to root
growth with the exception of the sln1c mutant, for which shoot biomass accumulation was
similar to (or only slightly greater than) that of the wild-type (Figure 4.3a, red bars). Differences
in shoot dry biomass between the wild-type and mutants at 250 and 500 mM NaCl were
relatively small, with all mutants showing only slightly higher levels of growth than the wild-type
at 250 mM NaCl. As these observations were based on single combined mass values, only
limited conclusions could be drawn.
Further experiments using 4 - 10 seedlings per cv Himalaya genotype per treatment provided
additional biomass data (Figure 4.3b). In these experiments saline treatments of 100, 200 and
300 mM NaCl resulted in reduced mean root and shoot mass (dry weight) for both wild-type and
mutant genotypes compared to the growth under control (0 mM NaCl) conditions, with the
exception of the Gse1 mutant, gse1a, which showed greater biomass accumulation following
treatment at 100 mM NaCl compared with 0 mM. As observed in the preliminary experiment,
under low salinity (100 mM) the rate of shoot growth was similar to that of root growth.
Although following 100 mM NaCl treatment there was no evidence of generally increased salt
tolerance of the mutants predicted to have increased DELLA stability compared to the wild-type;

93
at higher concentrations (200 and 300 mM NaCl), greater growth was observed in mutants
sln1d, and gse1a, as well as with the LoF mutant sln1c. Equivalent results were not seen with
mutants gse1j and gse1n. As with the preliminary experiment, the observations were based on
either one or two experimental repeats, therefore only limited conclusions could be drawn.
To assess the effect of salt on growth of a SLN1 GoF mutant in a different background, an
experiment was conducted using the SLN1 GoF mutant (dwf2) in the H930-36 background. The
use of only one mutant allowed more replicates to be used (14 samples per genotype per
treatment), increasing the chances of identifying any significant differences between the two
genotypes. As observed with seedlings of the Himalaya background, increasing levels of salinity
corresponded with a decrease in both root and shoot biomass for the wild-type and mutant
lines (Figure 4.3c). At 300 mM NaCl root biomass accumulation was significantly less inhibited in
dwf2 seedlings than in the wild-type (P: 0.004), a trend also seen in seedlings treated with 100
and 200 mM NaCl (P: 0.007). A similar trend was seen for shoot biomass, which was maintained
significantly better in dwf2 seedlings compared to the wild-type at 300 mM NaCl (P: 0.007).
(a)
0
20
40
60
80
100
120
140
160
WT
sln
1c
sln
1d
gse1
a
gse1
j
gse1
n
WT
sln
1c
sln
1d
gse1
a
gse1
j
gse1
n
WT
sln
1c
sln
1d
gse1
a
gse1
j
gse1
n
150 mM 250 mM 500 mM
cv Himalaya
Dry
mas
s re
lati
ve t
o 0
mM
(%
)
Root
Shoot

94
(b)
(c)
Figure 4.3 Root and shoot dry mass of wild-type and mutant seedlings treated with 0, 100, 200 and 300 mM NaCl. Growth (as represented by biomass) in salt is shown as a percentage of growth under control conditions (0 mM NaCl) for each genotype. Salt concentrations are shown on the x-axis. (a) data from the preliminary cv Himalaya experiment, (b) cv Himalaya, (c) cv H930-36. Blue and red bars indicate root and shoot data, respectively. Bars represent standard deviation.
0
20
40
60
80
100
120
140
WT
sln
1c
sln
1d
gse1
a
gse1
j
gse1
n
WT
sln
1c
sln
1d
gse1
a
gse1
j
gse1
n
WT
sln
1c
sln
1d
gse1
a
gse1
j
gse1
n
100 mM 200 mM 300 mM
cv Himalaya
Dry
mas
s re
lati
ve t
o 0
mM
(%
)
Root
Shoot
0
20
40
60
80
100
120
140
WT dwf2 WT dwf2 WT dwf2 WT dwf2
0 mM 100 mM 200 mM 300 mM
cv H930-36
Dry
mas
s re
lati
ve t
o 0
mM
(%
)
Root
Shoot

95
4.4.4 Root and shoot length
Root and shoot length analysis is shown in Figure 4.4. In the preliminary experiment using cv
Himalaya seedlings (Figure 4.4a), growth in saline conditions (150, 250 mM NaCl) resulted in
reduced root and shoot length for all genotypes, yet the difference was most acute at 250 mM
NaCl. The reduced root growth was, however, clear in wild-type, gse1a, gse1j and gse1n
genotypes treated at 150 mM NaCl. In parallel shoot growth was also reduced in wild-type,
gse1j and gse1n seedlings. Two further experiments were carried out in which 4 – 5 cv Himalaya
seedlings per genotype per treatment were tested. Again, it was clear that NaCl treatment
decreased shoot and root length for all genotypes, with greatest effects being seen at the higher
salt concentrations (200 mM and 300 mM NaCl, Figure 4.4b). The large variation in root length
of individual seedlings of each genotype in each treatment group made it difficult to identify any
differences at 100 mM NaCl, although the root length of the sln1c mutant was significantly
decreased compared to the control plants (P: <0.001). Differences between the root length of
the genotypes were more marked at 200 mM NaCl, with the wild-type and sln1c (LoF) root
growth being markedly reduced (P: <0.001), whereas the root length of the severely dwarfed
gse1n mutant was not significantly different from that at 0 mM NaCl (P: 1.0). Plants treated
with 300 mM NaCl all had significantly decreased root length compared to plants grown at 0
mM NaCl. Analysis of the shoot length data was again hampered by the seedling variation within
a genotype, resulting in large error bars. Nevertheless, the shoot length of the gse1 mutants was
significantly less affected by salt treatment at 100 mM and 200 mM NaCl than the wild-type
seedlings (P: <0.001 – 0.002), (Figure 4.4b). Following treatment at 300 mM NaCl this difference
was not so clearly manifested, with only the gse1a mutant showing shoot growth substantially
greater than the wild-type plants (P: 0.007). To determine whether salt stress responses differed
between cultivars (and mutants of that cultivar), the experiment was repeated using cv H930-36
seedlings. Data were combined from three experiments to give sample sizes of 8 - 19 seedlings
per genotype, per treatment. Salt treatment decreased shoot and root lengths for both the wild-
type and dwf2 seedlings as was seen with cv Himalaya plants. The decrease was most marked at
300 mM NaCl where final root length was less than half that seen in control (0 mM NaCl) plants
(Figure 4.4c).

96
To further address potential cultivar-specific responses to salt, an additional experiment was
conducted using the SLN1 LoF mutant in the Herta background (sln1-1, Figure 4.4d). Data
(obtained using 4 - 8 seedlings per genotype per treatment) showed that root length was
significantly decreased in both the wild-type and sln1-1 genotypes following treatment in 200 or
300 mM NaCl (P: <0.001). At 100 mM NaCl the root length of wild-type seedlings was not
significantly decreased (P: 0.087), whereas that of the sln1-1 mutant was (P: 0.003). This
genotype-dependent difference was not seen at higher NaCl concentrations. As observed with
the other cultivars, shoot growth was less affected than root growth by salt, although both wild-
type and sln1-1 seedlings treated at 300 mM had significantly shorter shoot length than the
control plants (P: <0.001). At 200 mM NaCl the shoot elongation of the sln1-1 mutant was less
affected than the wild-type (P: 0.087), (Figure 4.4d).

97
(a)
(b)
0
20
40
60
80
100
120
140
160
WT
sln
1c
sln
1d
gse1
a
gse1
j
gse1
n
WT
sln
1c
sln
1d
gse1
a
gse1
j
gse1
n
WT
sln
1d
gse1
a
gse1
j
gse1
n
0 mM 150 mM 250 mM
cv Himalaya
Len
gth
re
lati
ve t
o 0
mM
(%
)
Root
Shoot
0
20
40
60
80
100
120
140
WT
sln
1c
sln
1d
gse1
a
gse1
j
gse1
n
WT
sln
1c
sln
1d
gse1
a
gse1
j
gse1
n
WT
sln
1c
sln
1d
gse1
a
gse1
j
gse1
n
WT
sln
1c
sln
1d
gse1
a
gse1
j
gse1
n
0 mM 100 mM 200 mM 300 mM
cv Himalaya
Len
gth
re
lati
ve t
o 0
mM
(%
)
Root
Shoot
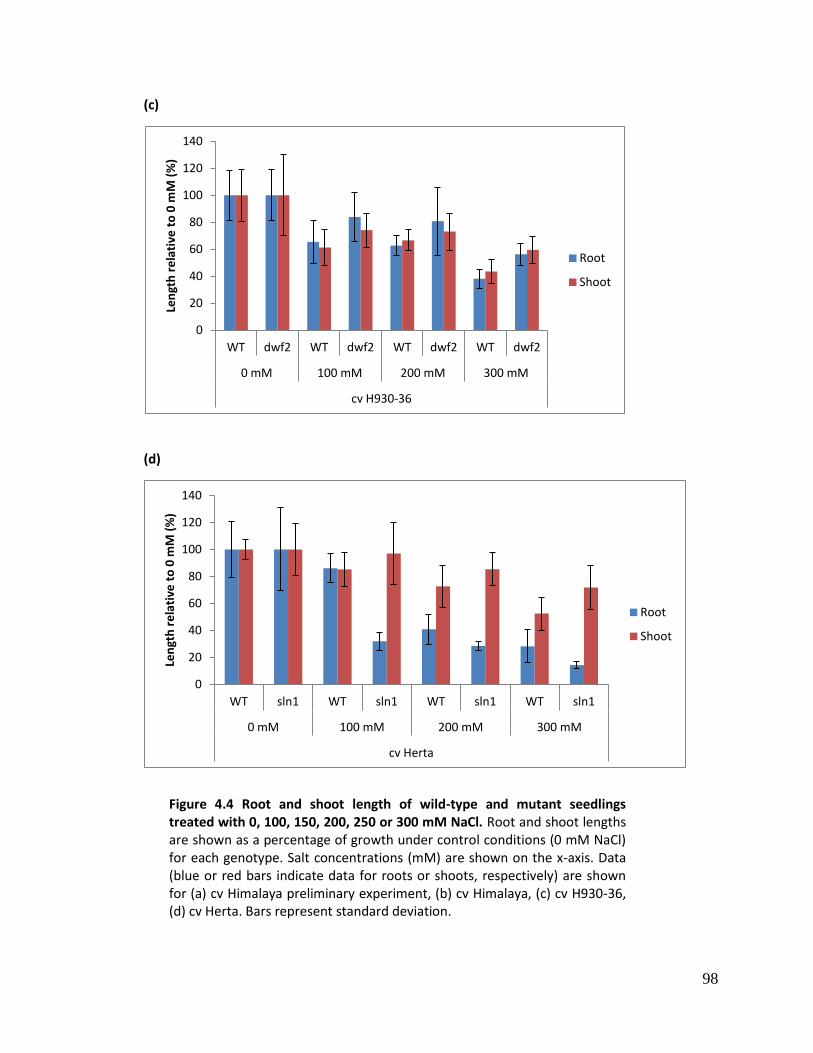
98
(c)
(d)
Figure 4.4 Root and shoot length of wild-type and mutant seedlings treated with 0, 100, 150, 200, 250 or 300 mM NaCl. Root and shoot lengths are shown as a percentage of growth under control conditions (0 mM NaCl) for each genotype. Salt concentrations (mM) are shown on the x-axis. Data (blue or red bars indicate data for roots or shoots, respectively) are shown for (a) cv Himalaya preliminary experiment, (b) cv Himalaya, (c) cv H930-36, (d) cv Herta. Bars represent standard deviation.
0
20
40
60
80
100
120
140
WT dwf2 WT dwf2 WT dwf2 WT dwf2
0 mM 100 mM 200 mM 300 mM
cv H930-36
Len
gth
re
lati
ve t
o 0
mM
(%
)
Root
Shoot
0
20
40
60
80
100
120
140
WT sln1 WT sln1 WT sln1 WT sln1
0 mM 100 mM 200 mM 300 mM
cv Herta
Len
gth
re
lati
ve t
o 0
mM
(%
)
Root
Shoot

99
4.4.5 Leaf, root and tiller number
Leaf, root and tiller numbers were recorded for each plant at the end of the treatment period.
Data were not recorded for the preliminary experiment, but were recorded from two further
experiments using cv Himalaya seedlings, one using cv H930-36 seedlings, and one using cv
Herta seedlings. Data from dead seedlings were not included in the analyses, and mean values
were calculated. At the time of transfer to salt treatment, all of the seedlings had only a single
main stem, and unless stated were at the two leaf stage.
Leaf number
Increasing salinity caused a reduction in mean leaf number for both wild-type and mutant
genotypes in all cultivars (Table 4.2) although in the Himalaya background, leaf number in the
gse1j and gse1n mutants was less affected than the wild-type at 100 mM and 200 mM NaCl
(Table 4.2a). Fewer leaves were produced by seedlings of the wild-type, sln1d, gse1a genotypes
after treatment with 100 mM NaCl compared with seedlings grown in the absence of NaCl,
whilst mean leaf number of the gse1j and gse1n mutants remained constant (8 and 7,
respectively). Under high salinity (300 mM NaCl), leaf production was decreased for all
genotypes (2 – 3 leaves). In the H930-36 background, leaf formation in the dwf2 (Sln1 GoF)
mutant was marginally less inhibited under low salinity (100 mM NaCl) than leaf formation in
the wild-type genotype (Table 4.2b). At higher salinities (200 and 300 mM NaCl), leaf formation
was equal (a mean of 2 leaves). In the Herta background, a similar response to that obtained
with cv Himalaya seedlings was seen with a decrease in leaf production in both the wild-type
and the sln1-1 (Sln1 LoF) mutant being observed as salinity increased. Mean leaf number for the
wild-type genotype was high compared to the sln1-1 mutant under control conditions (8 and 5
respectively; 0 mM NaCl, Table 4.2c), yet decreased sharply as salinity increased. Mean leaf
number decreased in the wild-type from 8 to 5 leaves as salinity increased from 0 mM to 100
mM NaCl (Table 4.2c).

100
Table 4.2 Mean number of leaves present in wild-type and mutant seedlings following treatment with 0, 100, 200, 300 mM NaCl. Results are shown for wild-type and mutant genotypes in (a) cv Himalaya, (b) cv H930-36, (c) cv Herta genotypes.
(a)
NaCl conc. Genotype and mean leaf number
WT sln1c sln1d gse1a gse1j gse1n
0 7 5 7 7 8 7
100 5 5 5 5 8 7
200 4 4 4 4 6 7
300 3 3 3 2 3 3
(b)
(c)
NaCl conc. Genotype and mean leaf number
WT sln1-1
0 8 5
100 5 4
200 4 3
300 3 3
NaCl conc. Genotype and mean leaf number
WT dwf2
0 3 3
100 2 3
200 2 2
300 2 2

101
Root number
As observed with mean leaf number, treatment at high salt (300 mM NaCl) caused a reduction in
mean root number for both wild-type and the mutant genotypes that are predicted to have
stabilised DELLA proteins (wild-type following salt stress, and sln1d, gse1a, gse1j and gse1n;
Table 4.3). This reduction was seen in all cultivars tested. In contrast, seedlings containing the
LoF alleles sln1c (Table 4.3a) and sln1-1 (Table 4.3c) either showed little decrease or an
increased root number, dependent on the cultivar. Root number was less affected at low salt
with the root production being unaffected by treatment with 100 mM NaCl in the gse1j and
gse1n lines, moreover, the mean number of roots remained constant in the gse1n mutant even
at 200 mM NaCl. In contrast, root number was slightly reduced for all other cv Himalaya
seedlings at 100 mM NaCl and increasingly affected at 200 mM NaCl (Figure 4.3a).

102
Table 4.3 Mean number of roots present following treatment of barley seedlings with 0 mM (control) or 100, 200, 300 mM NaCl. Results are shown for wild-type and mutant genotypes in (a) cv Himalaya, (b) cv H930-36, (c) cv Herta genotypes.
(a)
NaCl conc. Genotype and mean root number
WT sln1c sln1d gse1a gse1j gse1n
0 17 11 13 12 15 19
100 15 9 12 11 15 19
200 14 9 10 10 13 19
300 11 10 9 8 8 10
(b)
NaCl conc. Genotype and mean root number
WT dwf2
0 15 13
100 12 10
200 14 12
300 12 10
(c)
NaCl conc. Genotype and mean root number
WT sln1-1
0 14 9
100 11 10
200 12 11
300 10 12

103
Tiller number
Very few tillers were produced during the treatment period, such that significant differences
between genotypes could not be discerned (data not shown).
Data obtained over three experiments for Himalaya wild-type and sln1c and sln1d mutants
showed that few tillers were produced by sln1c LoF control (0 mM NaCl treatment) plants during
the experimental period. The sln1c LoF mutant produced a tiller in only 4/15 plants tested
whereas 13/15 and 10/15 of the wild-type and sln1d GoF plants, respectively, were able to do
so. Notably, two tillers had emerged on one wild-type plant and two sln1d plants. At 100 mM
NaCl only wild-type plants produced a tiller (4/10 plants). In the single experiment in which the
gse1 mutants gse1a, gse1j, gse1n were analysed, plants responded in a manner similar to the
wild-type, with most producing a tiller at 0 mM NaCl (8/10, 7/8 and 8/8, respectively). The gse1
mutants differed from the Sln1 mutants in that all gse1n plants produced a tiller at 100 mM
NaCl as did 3/4 of gse1j plants (with one plant producing 2 tillers), and 1/5 gse1a plants. Tiller
production was completely inhibited for wild-type and all (Sln1 and gse1) mutant plants at 250
mM NaCl.
4.4.6 Further observations of seedling phenotypes in response to salt
Root phenotypes
The root morphology of all lines was affected by salt treatment; limited visual assessment was
carried out in two experiments and was based on 4 - 10 seedlings (cv Himalaya) per genotype
per treatment. Root necrosis, scored based on root discoloration, was predominantly seen in
seedlings grown under saline conditions (100 – 300 mM NaCl), however a low level of
discolouration was observed in plants growing under control (0 mM NaCl) conditions; this was
classified as minor root necrosis (Table 4.4). Root necrosis was seen at 100 mM in the wild-type,
sln1c, and sln1d genotypes (Table 4.4), but was not observed in the other genotypes until salt
treatment at 200 mM NaCl and even at this concentration the roots of the gse1n mutant
remained healthy. The gse1n mutant only showed necrosis at the highest level of salinity (300
mM NaCl).

104
Table 4.4 Median root necrosis in cv Himalaya seedlings after 10 days growth in control (0 mM NaCl) and saline (100, 200, 300 mM NaCl) conditions. ‘-‘represents minor root necrosis, ‘+’ represents moderate root necrosis, ‘++’ extensive root necrosis.
NaCl concentration
Genotype 0 mM 100 mM 200 mM 300 mM
WT - + ++ ++
sln1c - + + ++
sln1d - + + +
gse1a - - + +
gse1j - - + ++
gse1n - - - ++
During the first of these experiments it was noted that root hair formation was affected by salt
and this was assessed visually in a single experiment consisting of 5 seedlings per genotype (cv
Himalaya) per treatment. Although root hair formation was extensive in wild-type and sln1c
(Sln1 LoF) seedlings under control (0 mM NaCl) and low salinity (100 mM NaCl) conditions, fewer
root hairs were seen in sln1d (Sln1 GoF) mutant seedlings grown in the absence of salt and their
appearance remained similar (“moderate root hair formation”) following all salt treatments
(100, 200 and 300 mM NaCl) (Table 4.5). In contrast, the wild-type and sln1c mutant seedlings
were unable to produce extensive root hair formation at 300 mM NaCl, although the wild-type
was less affected at 200 mM NaCl (Table 4.5).
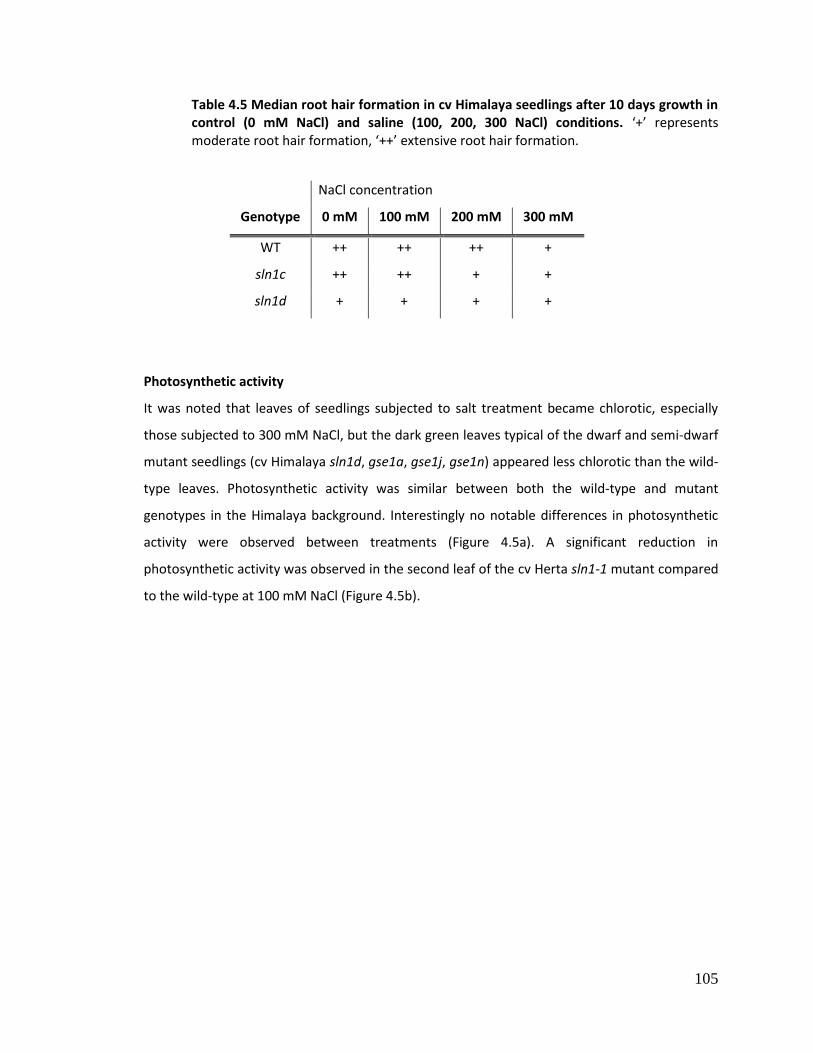
105
Table 4.5 Median root hair formation in cv Himalaya seedlings after 10 days growth in control (0 mM NaCl) and saline (100, 200, 300 NaCl) conditions. ‘+’ represents moderate root hair formation, ‘++’ extensive root hair formation.
NaCl concentration
Genotype 0 mM 100 mM 200 mM 300 mM
WT ++ ++ ++ +
sln1c ++ ++ + +
sln1d + + + +
Photosynthetic activity
It was noted that leaves of seedlings subjected to salt treatment became chlorotic, especially
those subjected to 300 mM NaCl, but the dark green leaves typical of the dwarf and semi-dwarf
mutant seedlings (cv Himalaya sln1d, gse1a, gse1j, gse1n) appeared less chlorotic than the wild-
type leaves. Photosynthetic activity was similar between both the wild-type and mutant
genotypes in the Himalaya background. Interestingly no notable differences in photosynthetic
activity were observed between treatments (Figure 4.5a). A significant reduction in
photosynthetic activity was observed in the second leaf of the cv Herta sln1-1 mutant compared
to the wild-type at 100 mM NaCl (Figure 4.5b).
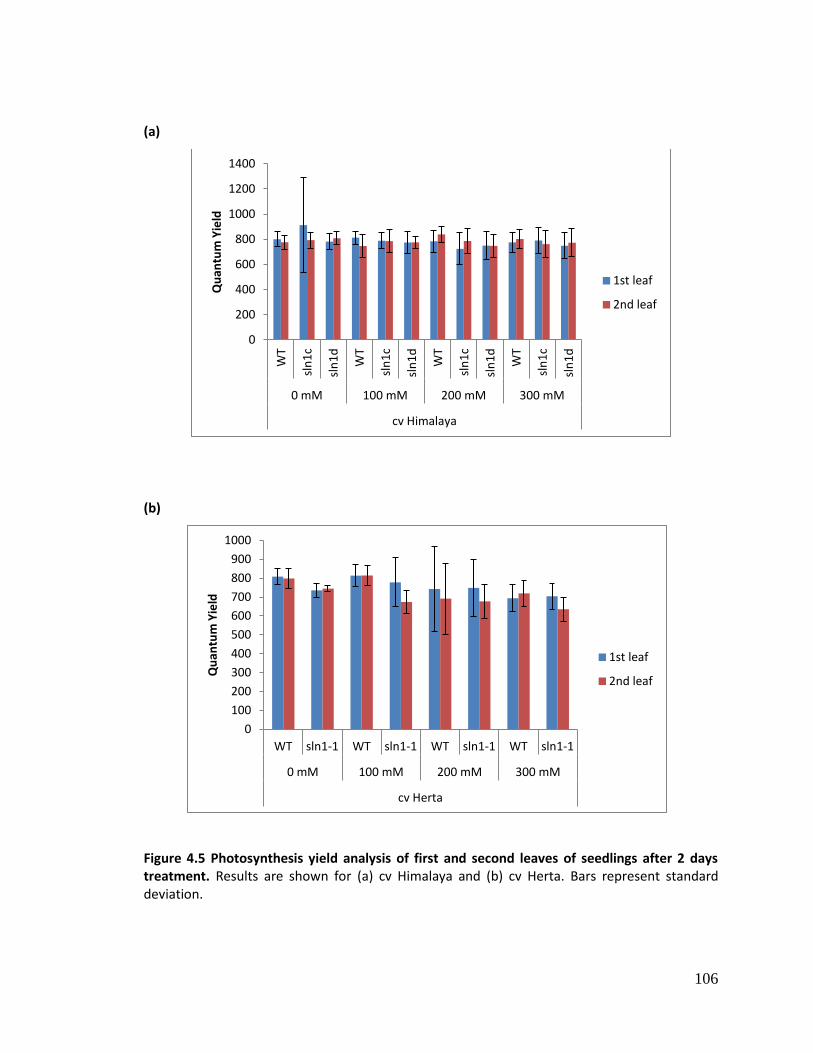
106
(a)
(b)
Figure 4.5 Photosynthesis yield analysis of first and second leaves of seedlings after 2 days treatment. Results are shown for (a) cv Himalaya and (b) cv Herta. Bars represent standard deviation.
0
200
400
600
800
1000
1200
1400
WT
sln
1c
sln
1d
WT
sln
1c
sln
1d
WT
sln
1c
sln
1d
WT
sln
1c
sln
1d
0 mM 100 mM 200 mM 300 mM
cv Himalaya
Qu
antu
m Y
ield
1st leaf
2nd leaf
0
100
200
300
400
500
600
700
800
900
1000
WT sln1-1 WT sln1-1 WT sln1-1 WT sln1-1
0 mM 100 mM 200 mM 300 mM
cv Herta
Qu
antu
m Y
ield
1st leaf
2nd leaf

107
4.4.7 The effect of DELLA on ion element accumulation under salt stress
A preliminary study was undertaken to determine whether DELLA is important in determining
ion uptake through the roots in the presence, or absence, of salt. Ion element analysis was
undertaken on cv Himalaya wild-type and the DELLA LoF and GoF mutants (sln1c and sln1d,
respectively) at a single time point (two days) following incubation at 0 mM or 100 mM NaCl.
Low salt concentration was used to minimise erroneous measurements arising from extensively
damaged roots or shoot material. Although the data are limited to one tissue sample for each
genotype per treatment, the analysis revealed differences between the genotypes in terms of
sodium (Na+), phosphorous (P+), and calcium (Ca2+) accumulation. Element accumulation is
shown in ppm in Table 4.6a, and K+:Na+ ratios shown in Table 4.6b. The accumulation of
Magnesium (Mg2+) and Potassium (K+) was similar between the genotypes in both root and
shoots; for all genotypes levels of Mg2+ in the shoots were higher than in the roots in control and
NaCl treated seedlings (Table 4.6a). In contrast, the K+ accumulation in roots and shoots was
similar within each genotype although there was an indication that K+ accumulated to a greater
extent in shoots of salt treated sln1c plants. In all cases, K+ levels in roots and shoots were
lowered by salt treatment. Na+ levels in roots and shoots were, as expected, low in the control
plants and no clear genotype-specific differences were observed. Following NaCl treatment the
Na+ values increased greatly in both roots and shoot material although both the roots and
shoots of sln1c plants accumulated much less than those of the wild-type and sln1d plants
(approx. 8,000 ppm Na+ compared to more than 30,000 ppm) (Table 4.6a). Genotype-specific
differences in the accumulation of P+ were also identified; of particular note was the low level
(approx. 200 ppm) in both roots and shoots of sln1c plants treated with 100 mM NaCl. Although
this low level was also seen in shoots of sln1c control plants, a higher level of P+ was seen in the
roots of these plants (Table 4.6a). For all genotypes the P+ accumulation was higher in roots than
shoots in plants grown under control (0 mM) conditions. Again, the wild-type and sln1d plants
showed similar patterns of accumulation irrespective of NaCl conditions. Accumulation of Ca2+
was higher in the shoots than the roots for the sln1d mutant in control (0 mM) and NaCl-treated
plants. However, this was not the case in tissues of sln1c plants irrespective of the treatment;
for this genotype Ca2+ levels were lower in the shoots than the roots. For all genotypes salt
treatment resulted in lower Ca2+ in the shoots, but the difference was much less marked in the

108
roots of the sln1c mutant. Again, the sln1c mutant appeared to respond differently from the
wild-type and sln1d mutant.
Table 4.6 Ion element accumulation in root and shoots in cv Himalaya. Seedlings were either grown in 0.5 x Hoagland’s medium (control, 0 mM NaCl) or medium containing 100 mM NaCl. 1 Genotype; 2 No result. Results are presented as (a) parts per million and (b) K+:Na+ ratios.
(a)
Root Shoot
Gen.1 NaCl Conc. Na+ Mg2+ P+ K+ Ca2+ Na+ Mg2+ P+ K+ Ca2+
WT 0 mM 156 1211 12013 64840 1468 13 1707 7956 63052 3743
100 mM 31716 857 7956 63052 3743 33082 936 9241 33151 1458
sln1c 0 mM 469 914 8646 48769 2483 NR2 1676 270 49644 1115
100 mM 7823 807 226 20975 2323 7884 1269 201 30470 956
sln1d 0 mM 506 1262 15208 82545 1281 287 2209 12368 74140 4352
100 mM 42393 1117 15323 35942 766 31194 1257 12300 38350 1924
(b)
Root Shoot
Gen.1 NaCl Conc. K+: Na+ ratio K+: Na+ ratio
WT 0 mM 416 : 1 4850 : 1
100 mM 2 : 1 1 : 1
sln1c 0 mM 104 : 1 NR2
100 mM 3 : 1 4 : 1
sln1d 0 mM 163 : 1 258 : 1
100 mM 1 : 1 1: 1

109
4.5 Discussion
The experiments described in this chapter were designed to determine whether the finding
(Achard et al., 2006) that DELLA proteins were important for survival of salt by Arabidopsis was
true also in a cereal species. Barley was chosen because it has a single DELLA and appropriate
mutants were available. The aim was to replicate, as far as possible, the conditions used by
Achard et al. (2006), but several modifications had to be made because of the longer life cycle
and larger seedlings of barley compared with Arabidopsis. Notably, in the Achard study
Arabidopsis plants were grown in culture plates on agar medium, and this was not feasible for
the larger (barley) seedlings (Dr. M. Boulton, personal communication). Instead, hydroponic
culture was used to allow investigation of both root and shoot responses. Hydroponic culture
has been widely used to investigate salt tolerance and element uptake in cereals (Witzel et al.,
2009). Space and equipment limitations, along with the longer life cycle and physical size of
barley seedlings (which makes downstream processing of samples more difficult) meant that
sample sizes were lower than those in the study of Achard et al. (2006). These limitations
complicated the statistical analyses and advice was sought from Mr James Gallagher, Statistical
Services Centre, University of Reading, UK). GA biosynthesis mutants were used in the
Arabidopsis study, however these were unavailable in the barley backgrounds used in this study.
To assess the effect of non-DELLA mutants on salt stress response, GSE1 mutants (equivalent to
Arabidopsis GID1) were used in the study. This gene is also part of the DELLA signalling pathway,
and although other characterised mutants of differing stature were sought, no taller plants were
available and other dwarf mutants were either not characterised or were modified in pathways
known to impinge on DELLA regulation.
Wild-type and mutant seedlings of all tested genotypes survived treatment at 0 mM NaCl,
showing that the hydroponic treatment used in this study was suitable for barley cultivation.
Despite a decrease in seedling survival for the sln1c genotype at 300 mM NaCl, no statistically
significant differences in survival were observed between the wild-type, SLN1 LoF and putative
SLN1 stabilising mutant genotypes (Figure 4.2a). This contrasts the results of the Achard study
(Achard et al., 2006), in which the Arabidopsis DELLA mutant lacking 4 of 5 DELLAs (GAI, RGA,
RGL1 and RGL2) showed decreased survival under saline conditions compared to wild-type
seedlings (5 and 36 % respectively). In the current study a survival differential was not observed

110
between wild-type and the putative LoF mutant sln1-1 (see Section 4.4.2). The absence of a
survival differential may be explained by differences in varietal background (cv Herta versus cv
Himalaya) or by the different mutations resulting in a SLN1 protein with differing function or
stability. Certainly the sln1-1 plants are sturdier than the sln1c plants (see Chapter 3).
Experimental conditions were designed based on preliminary experiments designed to optimise
experimental (seedling survival) conditions in the Himalaya background, whereas cv Herta
seedlings appear to be more salt tolerant. Differential salt tolerance of barley cultivars has been
reported widely (Chen et al., 2007; Mahmood, 2011). Accordingly, further experiments, not
possible within the time constraints of this project, using higher NaCl concentration are needed
to determine whether the sln1-1 mutant differs in salt tolerance from its wild-type parent.
Furthermore, the dwf2 mutant in the H930-36 background exhibited no significant difference in
survival after salt treatment compared to the wild-type seedlings (Figure 4.2b). This data is
again, inconsistent with the results in the Achard study (Achard et al., 2006), in which the
Arabidopsis DELLA GoF mutant (stabilised GAI) exhibited a greater level of survival under saline
conditions compared to the wild-type (82 and 36% respectively). The survival data obtained in
this study therefore suggest SLN1 has no significant effect on plant survival, supporting the null
hypothesis (H0), however the difficulty in obtaining reproducible data between every
experiment and the limited sample numbers may account for the lack of statistical significance
in the survival data.
Increases in salinity generally resulted in reduced root and shoot growth (both dry mass and
length), for all genotypes, with only the root dry mass of sln1c and gse1a seedlings grown under
150 and 100 mM NaCl conditions respectively, defying this trend (Figure 4.3a, b). Salinity
therefore has a detrimental effect on plant growth independent of SLN1 function, as has been
widely reported (Munns et al., 2006; Taghipour & Salehi, 2008). Significant differences were
observed between the dwf2 GoF mutant and the wild-type in the H930-36 background, with
dwf2 root and shoot mass significantly less inhibited than the wild-type under saline conditions
(Figure 4.3c). Furthermore, shoot growth (length) for the putative SLN1 stabilising mutant
gse1n, was significantly less inhibited, and root growth (length) for the sln1c LoF mutant, was
significantly inhibited under saline conditions compared to the wild-type (Figure 4.4b). This
provides strong evidence to support the alternative hypothesis (H1).

111
The extent to which plant development is governed by DELLA function is likely determined by
the interplay between two factors. DELLA inhibits growth under saline conditions, whilst
simultaneously protecting plants from the harmful effects of salt, thereby promoting plant
survival (and therefore, indirectly, growth). This interplay likely accounts for the difficulty in
discerning DELLA-related trends for tissue mass and length. Salinity reduced root number for all
tested cultivars (see Section 4.4.5). The sln1c (Sln1 LoF) mutant showed reduced root number
compared to wild-type and putative SLN1 stabilising mutants at 0 – 200 mM NaCl conditions
(Table 4.3a). Fine root hair formation in both wild-type and mutant genotypes was reduced in
line with increasing salinity. Interestingly, fine root hair formation was least prevalent in sln1d
GoF mutant roots, which is consistent with the DELLA-mediated inhibition of growth observed in
Arabidopsis (Achard et al., 2006). The limited tiller production during the experimental period,
and the low number of gse1 mutant plants tested prevented statistical analysis to identify
genotype-specific responses, but it is tempting to speculate that tiller production in gse1j and
gse1n mutant plants was less affected than for the LoF Sln1 mutants. A further difference
between this study and that of the Arabidopsis study was the nature of the genotypes used. The
LoF DELLA mutant in the Arabidopsis study lacked four of the five DELLAs, meaning that a single
DELLA, RGL3, was functional in the mutant, whereas the LoF mutant in barley, sln1c, lacks the
final 17 aa of a functional single DELLA protein (SLN1) and the protein has no growth repression
activity. Although the Arabidopsis RGL3 has been implicated in stress tolerance (Achard et al.,
2008b), the Arabidopsis LoF plants were, like the sln1c plants, unable to survive high levels of
NaCl.
Ion element accumulation analysis suggest Mg2+, P+ and K+ uptake by roots is limited in roots
under both control and salt stress conditions in the sln1c (LoF) mutant compared to the wild-
type and sln1d (GoF) genotype, suggesting the uptake of essential plant nutrients is limited for
the sln1c genotype. DELLA LoF mutants have been characterised as having elongated cells
(Chandler et al., 2002). If the number of ion channels remains unchanged compared to the wild-
type, then the potential for ion uptake may be limited compared to uptake in wild-type root
cells. This is largely consistent with observations of uptake by the sln1d (GoF) mutant, which has
reduced cell size, and largely showed increased ion element accumulation compared to the
wild-type under control conditions. Ion accumulation results were part of a preliminary

112
experiment, and data needs to be verified in additional experiments before definitive
conclusions can be drawn.
Despite the increase in chlorosis observed in the SLN1 LoF mutants (sln1c, cv Himalaya; sln1-1,
cv Herta) compared to the wild-type and SLN1 GoF mutants, there was largely no difference in
photosynthetic activity between the genotypes. The similarity in photosynthetic activity
suggests the decrease in the survival of sln1c seedlings is not due to loss of photosynthetic
activity. Furthermore, given the low levels of Na+ in shoot material in the wild-type and sln1d
GoF mutant, it is similarly doubtful that sodium toxicity per se is the cause of decreased survival.
The lowest levels of root necrosis were observed in the sln1d (SLN1 GoF) and GSE1 mutants,
suggesting SLN1 stabilisation provides a high level of protection to seedling roots. It is therefore
proposed that the primary cause of plant death is damage to roots.

113
Chapter 5: The Effect of Transient Extreme Heat Stress on Sln1 Mutants
5.1 Aims
The aim of the work described in this chapter was to determine whether the salt stress
tolerance conferred by stabilised DELLA observed by Achard et al. (2006) and in this study
(Chapter 4), extended to other forms of abiotic stress. Transient “extreme” heat stress (heat
shock, 50 °C, 1 - 4 h) was used to assess the immediate role of SLN1 in stress response, rather
than its potential role in acquired tolerance. In addition to the use of the GA signal transduction
mutants used in the salt stress experiments, additional height mutants were tested to establish
whether plant stature determines survival to heat shock.
The following hypothesise were formulated. H1: Sln1 GoF mutants exhibit increased survival and
are less susceptible to heat shock compared to the wild-type; Conversely, Sln1 LoF mutants
exhibit decreased survival and increased susceptibility to heat shock compared to the wild-type.
H0: SLN1 has no effect on plant survival or susceptibility to heat shock.
5.2 Introduction
Heat stress due to increased temperature is a growing agricultural problem worldwide, with an
increase in the frequency, intensity and duration of seasonal heatwaves predicted as a result of
global climate change (Wahid et al., 2007; Ainsworth & Ort, 2010; Christensen et al., 2007).
Plants can be preconditioned to tolerate heat stress either through the application of
osmoprotectants (e.g. glycinebetaine and proline), or the exposure of plants to environmental
stress during the early stages of the plant life cycle (Wahid et al., 2007). Tolerance of long term
heat stress requires the integration of genetic heat tolerance traits into agricultural lines
(Maestri et al., 2002).
The role of temperature in plant development
Temperature plays an integral role in plant development, acting as an environmental cue for the
transition between different developmental stages. Germination is highly sensitive to
temperature in many species, with initiation triggered by the destruction of germination

114
inhibitors in response to either low or high temperature (Walbot, 2011). Transition from the
vegetative to the reproductive phase is similarly affected, with temperature being the most
important environmental cue for plant flowering (Huijser & Schmid, 2011). Increased
temperature triggers the expression of flower inductive pathways (e.g. photoperiod and GA)
that increase the expression of a small number of floral integrator genes such as FT (Flowering
locus T), SOC1 (Suppressor of constans1) and LFY (Leafy) in Arabidopsis. When the expression of
floral integrators exceeds the required threshold, plant flowering is initiated (Tooke et al., 2005).
Effect of high temperature on plant development
In contrast to mammalian systems which maintain a constant temperature by homeostasis,
plants must be able to function at a range of temperatures (Walbot, 2011). Both short and long
term exposure of plants to high temperatures results in a range of morphological and
biochemical changes affecting plant growth and development, with the impact of heat stress
greatly dependent upon the stage of plant development at which the temperature stress occurs
(Wahid et al., 2007). Seedlings in the early vegetative phase (e.g. during early leaf emergence)
are less tolerant to high temperatures than more well established plants, as the structures
conferring heat tolerance in mature plants are undeveloped in young seedlings (Karim et al.,
1999; Walbot, 2011). Furthermore, the enzymes implicated in the breakdown of starch are
inactivated under high temperature conditions, preventing the mobilisation of the metabolite
reserves required for the seedling to develop (Essemine, 2010). Mature plants are most
susceptible to heat damage at the point of transition between the vegetative and reproductive
phases, with male pollen development being highly sensitive to even short-term extremes of
temperature (Zinn et al., 2010; Walbot, 2011). A moderate increase in temperature above
optimal conditions was shown to greatly reduce the number of functional pollen grains in
tomato (Lycopersicon esculentum), thereby reducing fertility (Sato et al., 2006). In cereals,
exposure to supraoptimal temperatures commonly results in a reduction in grain yield due to
induced morphological changes, reduced photosynthesis, and early flowering coupled with
pollen sterility (Wahid et al., 2007; Essemine, 2010). High temperature reduced basal tillering,
the numbers of grains per inflorescence, and single grain weight in pearl millet (Pennisetum
americanum) (Fussel et al., 1980). In wheat (Triticum aestivum), high temperature reduced
photosynthetic activity and leaf area, and resulted in a decrease in shoot and grain mass, as well
as the mass and starch content of the kernel (Shah & Paulsen, 2003).

115
Heat tolerance and phytohormones
High temperature disrupts cellular metabolic processes, resulting in the production and
accumulation of toxic compounds including ROS, which interfere with the processes required for
both photosynthesis and respiration (Essemine, 2010). Although the GA pathway is implicated in
heat tolerance in plants, more investigation is required to understand the mechanisms involved
(Vettakkorumakankav et al., 1999; Qin et al., 2008), however, GA is thought to have a role in the
antioxidant pathway that is induced during heat stress (Sarkar et al., 2004; Wigoda et al., 2006)
and there is evidence for heat-induced changes in expression of GA biosynthetic and signalling
genes in both dicots and cereals. Indeed, Qin et al. (2008) reported the downregulation of
expression of a “RGA homologue” in heat stressed wheat.
DELLAs are believed to act as integrators of heat stress signals, responding to ABA and ethylene
signals. ABA is antagonistic to GA function (Weiss & Ori, 2007), inhibiting growth whilst GA
promotes growth via DELLA degradation. Transient accumulation of ABA was observed after
heat treatment in pea plants (Pisum sativum) (Liu et al., 2006) whilst ABA has been shown to
confer thermotolerance in maize (Gong et al., 1998) and bromegrass (Robertson et al., 1994).
Furthermore the exogenous addition of ABA has been shown to induce heat tolerance in
Arabidopsis and maize seedlings (Larkindale & Knight, 2002; Bonham-Smith et al., 1988). The
importance of ABA function in mediating response to heat stress is illustrated by the response of
the abi-1 mutant of Arabidopsis, which lacks a protein phosphatase required for sensing ABA,
rendering the mutant ABA-insensitive. When subjected to heat stress, the abi-1 mutant
exhibited decreased tolerance to heat stress compared to the wild-type plants (Larkindale &
Knight, 2002). These findings are in agreement with the report (Qin et al., 2008) that the wheat
homologues of the Arabidopsis Arac7 and Arac10 genes (the negative regulators of ABA-
mediated signalling) were downregulated in heat treated wheat. A link between ethylene and
heat susceptibility in wheat was reported by Hays et al. (2007), with a heat susceptible cultivar
showing increased ethylene levels in kernels, embryos and flag leaves whereas a heat tolerant
variety showed no change in ethylene production. Other reports have shown ethylene levels to
increase in wheat (Balota, 2004) and creeping bentgrass (Larkindale & Huang, 2005) in response
to heat stress, with levels rising during the recovery phase post heat treatment. Furthermore,
the ethylene-insensitive Arabidopsis mutant etr-1 showed increased susceptibility to heat

116
damage (Larkindale & Knight, 2002). Achard et al. (2003) showed that ethylene has a stabilising
effect on DELLA in root cells of Arabidopsis, even in the presence of bioactive GA, leading the
authors to hypothesise that ethylene confers heat stress tolerance via a DELLA-mediated
response. Further investigations have highlighted the importance of DELLAs as integrators of
multiple plant growth regulatory inputs converging ethylene, ABA and auxin signals (reviewed
by Van Der Straeten et al., 2007). Yet the author accepted that the mechanism was still largely
unknown. Considerable research is ongoing which emphasises the cross-regulatory mechanisms
in hormonal signalling which in many cases take place at the level of transcriptional regulation
(Kuppusamy et al., 2008). The integral importance of the (transcription factor) function of the
DELLA proteins in these pathways was recently shown by transcriptomic analysis of DELLA
responsive genes in Arabidopsis seedlings which revealed that the GA pathway directly
influenced both the ethylene and auxin pathways and, through additional effects on gene
expression, other transcriptional networks (Gallego-Bartoleme et al., 2011).
5.3 Materials and methods
5.3.1 Plant material
In addition to barley lines used in salt stress experiments (Chapter 4; cv Himalaya: sln1c, sln1d,
gse1a, gse1j, gse1n; cv H930-36: dwf2; cv Herta: sln1-1), cv Bowman mutants were used to
determine whether seedling height determines survival of heat stress. Four cv Bowman mutants
were used in this study, two uncharacterised mutants exhibiting a tall phenotype (M380, M382;
Dr. A. Druka, SCRI, Dundee, personal communication), and two semi-dwarf mutants, a GA-20
oxidase mutant (M827; Dr. L. Ramsay, The James Hutton Institute (JHI), Dundee, personal
communication) and a brassinosteroid receptor mutant (M855; Chono et al., 2003).
5.3.2 Plant growth and heat shock
Growth conditions
Seeds for the mutant barley genotypes listed in Section 5.3.1, and their corresponding wild-
types were stratified as described in Section 2.1.3.1, and planted and grown in barley mix soil
under CER or growth cabinet conditions (Section 2.1.2).

117
Heat shock
The duration of the heat shock treatment used in each experiment, ranging from 1 - 4 h, was
dependent upon the barley line tested and based on preliminary data collected by Dr. Andrey
Korolev (JIC). Seedlings were not watered before heat shock treatment, although soil moisture
was checked by touch to ensure soil was not dry. Seedlings were subjected to heat shock when
at the 2-3 leaf stage, with one or no tillers emerging (Zadoks stage 12-13/20-21; Zadoks, 1974).
Heat shock conditions (50 °C, Humidity 60%, irradiance ~150 µmol m-2 s-1) were generated in
growth cabinets (MLR Plant Growth Chamber, Sanyo). Cabinet temperature was monitored by
observing the cabinet’s external electronic temperature display, and by periodic observation of
an alcohol thermometer (Russel Scientific, Dereham, UK) within the cabinet. Heat shock was
conducted at 6 h into the light cycle. Seedlings from each line tested were placed (positions
were randomised) on trays, and during heat shock treatment trays were repositioned on the
growth cabinet shelves on an hourly basis to overcome potential positional bias. Seedlings were
returned to the CER after heat shock, and were watered at least 1 h after heat shock, to allow
time for the soil to cool. Seedlings were grown for a further 3 wks post heat shock under CER
conditions (Figure 5.1) and inspected visually during this time.

118
Sample size
Survival, final plant height, and shoot dry mass were measured three weeks after heat shock
using 8 - 48 seedlings of each genotype per treatment. Roots could not be sampled because
plants were grown in compost.
5.3.3 Assessment of plant growth
Survival was assessed visually 3 wks after heat shock treatment, with plants defined as dead if
leaf and stem necrosis was extensive or total. Prediction values were generated from survival
data using general linear models. 3 wks after heat shock treatment, shoot lengths were
measured before being separately sampled and frozen in liquid nitrogen and freeze dried
(Edwards Modulyo Freeze-Dryer, Edwards Lab, Sandusky, OH, USA) for five days. Samples were
weighed to four decimal places and dry mass recorded. Shoot dry mass and length data was
collected from individual seedlings, with dead seedlings excluded from analysis. Mean values
Figure 5.1 A representative tray of cv Himalaya seedlings (wild-type, sln1c, sln1d, gse1a, gse1j, gse1n) showing plant development 3 wks post heat shock treatment. Seedlings were randomised on the tray before heat shock and during subsequent growth to negate positional effects.

119
were then calculated for each genotype under each treatment, and normalised against the
mean value of the control group for each genotype, by expressing growth as a percentage of
growth under control conditions (control group growth being equal to 100%). Individual values
were used to obtain standard deviation values for shoot dry mass and length in the H930-36 and
Herta backgrounds.
5.4 Results
5.4.1 Seedling survival
Preliminary data generated by Dr. Andrey Korolev was used to determine the experimental
conditions required to generate approximately 50% survival in the wild-type lines of cv
Himalaya. Plant survival was measured in further experiments using cv Himalaya (WT, sln1c,
sln1d, gse1a, gse1j, gse1n), cv H930-36 (WT, dwf2), cv Herta (WT, sln1-1), and cv Bowman (WT,
M380, M382, M820, M827). Survival was assessed using general linear models and Mann-
Whitney U testing as described for salt treatment (Section 4.4.2). All seedlings, independent of
background and genotype, survived control conditions (0 h heat shock). Increasing the duration
of heat shock resulted in a general decrease in survival for all genotypes. Survival results for cv
Himalaya (Figure 5.2a) were obtained using 8-29 seedlings per genotype per treatment, and
heat shock treatments of 1, 2, 3 and 3.5 h. The LoF mutant sln1c showed significantly lower
survival compared to the wild-type after 1 h heat shock (P: 0.014), however differences after 2
and 3 h treatments were not significant (P: 0.071 and 0.5 respectively). The sln1c mutants were
not subjected to 3.5 h heat shock, as seedling numbers were limited. Of the putative SLN1
stabilising mutants, only the sln1d mutant at 1 h exhibited significantly increased survival
compared to the wild-type (P: 0.014). Survival results for genotypes of the H930-36 background
(Figure 5.2b) were obtained using 35-47 seedlings per genotype per treatment, and heat shock
treatments of 1, 1.5 and 2 h. All of the wild-type and dwf2 (GoF) mutant seedlings survived 1 h
heat shock, therefore no survival differential was observed. Furthermore, no significant
differences in survival were observed between the wild-type and dwf2 GoF mutant genotypes
after 1.5 and 2 h heat shocks (P: 0.5 and 0.129 respectively). Survival results for cv Herta (Figure
5.2c) were obtained using 6-58 seedlings per genotype per treatment, and heat shock
treatments of 1, 1.5 and 2 h. The sln1-1 LoF mutant showed significantly lower levels of survival

120
after 1 h heat shock compared to the wild-type (P: 0.008), however an equivalently significant
survival differential was not observed between the sln1-1 and wild-type genotypes at 1.5 h (P:
0.15). No seedlings in the Herta background survived 2 h heat shock. Survival results for cv
Bowman (Figure 5.2d) were obtained using 8-18 seedlings per genotype per treatment. No
significant differences in survival were observed between the Bowman genotypes after 3 and 4
h heat shock (P: 0.3 – 0.5).

121
(a)
(b)
0
0.2
0.4
0.6
0.8
1
1.2
WT
sln
1c
sln
1d
gse1
a
gse1
j
gse1
n
WT
sln
1c
sln
1d
gse1
a
gse1
j
gse1
n
WT
sln
1c
sln
1d
gse1
a
gse1
j
gse1
n
WT
sln
1c
sln
1d
gse1
a
gse1
j
gse1
n
WT
sln
1d
gse1
a
gse1
j
gse1
n
0 h 1 h 2 h 3 h 3.5 h
cv Himalaya
Pre
dic
tio
n v
alu
e
0
0.2
0.4
0.6
0.8
1
1.2
WT dwf2 WT dwf2 WT dwf2 WT dwf2
0 h 1 h 1.5 h 2 h
cv H930-36
Pre
dic
tio
n v
alu
e

122
(c)
(d)
Figure 5.2 Survival values for plants subjected to heat shock or control (0 h heat shock) conditions. Prediction values were generated from survival data using general linear models. Prediction values are shown on the y-axes. Values of 1 represent the prediction of total survival, and 0 the death of all samples of the genotype under the stated treatment condition. Genotype and heat shock duration are on the x-axes. Results are presented for (a) cv Himalaya, (b) cv H930-36, (c) cv Herta, (d) cv Bowman.
0
0.2
0.4
0.6
0.8
1
1.2
WT sln1-1 WT sln1-1 WT sln1-1 WT sln1-1
0 h 1 h 1.5 h 2 h
cv Herta
Pre
dic
tio
n v
alu
e
0
0.2
0.4
0.6
0.8
1
1.2
WT
M3
80
M3
82
M8
27
M8
85
WT
M3
80
M3
82
M8
27
M8
85
WT
M3
80
M3
82
M8
27
M8
85
0 h 3 h 4 h
cv Bowman
Pre
dic
tio
n v
alu
e

123
5.4.2 Shoot mass
Shoot mass was measured in the H930-36 and Herta backgrounds. Data were obtained for cv
H930-36 using 20-38 samples per genotype per treatment and 0, 1.5 and 2 h heat shock
treatments (Figure 5.3a). Heat shock led to a decrease in dry mass for both the wild-type and
dwf2 plants. The results suggest that the dwf2 (GoF) mutant has significantly greater shoot dry
mass than the wild-type after 1.5 h heat shock (P: <0.001), however there was no significant
difference at 2 h. Data were not collected after 1 h treatment. Data were obtained for the Herta
background using 17-44 samples per genotype per treatment and 0 and 1 h heat shock
treatments (Figure 5.3b). The number of surviving sln1-1 mutant seedlings was too low after 1.5
and 2 h heat shock treatments to make meaningful comparisons between the mutant and wild-
type genotypes. The sln1-1 mutant showed significantly lower dry mass compared the wild-type
after 1 h treatment (P: <0.001). At this time point the wild-type showed a relatively low
decrease in dry mass after heat shock treatment.
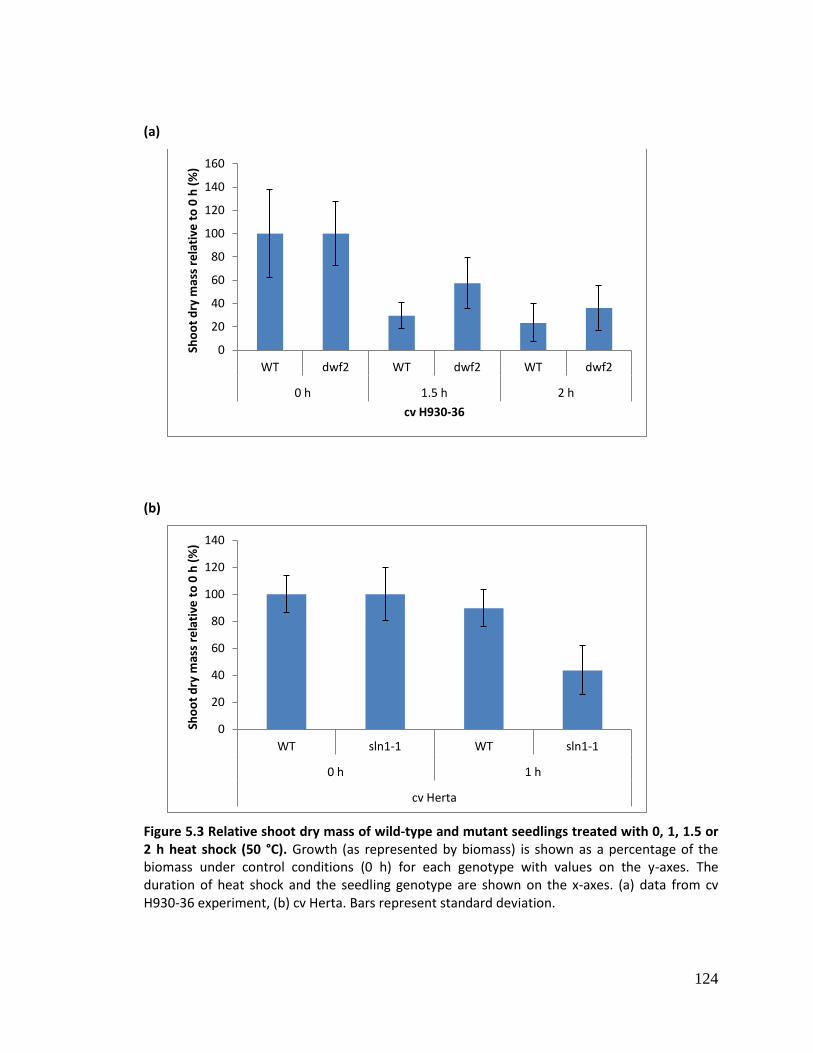
124
(a)
(b)
Figure 5.3 Relative shoot dry mass of wild-type and mutant seedlings treated with 0, 1, 1.5 or 2 h heat shock (50 °C). Growth (as represented by biomass) is shown as a percentage of the biomass under control conditions (0 h) for each genotype with values on the y-axes. The duration of heat shock and the seedling genotype are shown on the x-axes. (a) data from cv H930-36 experiment, (b) cv Herta. Bars represent standard deviation.
0
20
40
60
80
100
120
140
160
WT dwf2 WT dwf2 WT dwf2
0 h 1.5 h 2 h
Sho
ot
dry
mas
s re
lati
ve t
o 0
h (
%)
cv H930-36
0
20
40
60
80
100
120
140
WT sln1-1 WT sln1-1
0 h 1 h
cv Herta
Sho
ot
dry
mas
s re
lati
ve t
o 0
h (
%)
125
5.4.3 Shoot lengths
Shoot length was measured in experiments using seedlings of the H930-36 and Herta
backgrounds. Data were obtained for the H930-36 background using 24-45 samples per
genotype per treatment and 0, 1.5 and 2 h heat shock treatments (Figure 5.4a). Heat shock
produced a decrease in mean height for both the GoF dwf2 and wild-type genotypes. There was
no significant difference in shoot length between the dwf2 and wild-type genotypes after 1.5
and 2 h heat shock (P: 0.431 and 0.886 respectively). Data were not collected after 1 h
treatment. Data were obtained for the Herta background using 18-52 samples per genotype per
treatment and 0 and 1 h heat shock treatments (Figure 5.4b). The surviving LoF sln1-1 mutant
seedlings showed significantly reduced shoot length compared to the wild-type after the 1 h
heat shock treatment (P: <0.001).

126
(a)
(b)
Figure 5.4 Relative shoot length of wild-type and mutant seedlings treated at 0, 1, 1.5 or 2 h heat shock (50 °C). Growth (as represented by length) is shown as a percentage of height under control conditions (0 h) for each genotype. The duration of heat shock is shown on the x-axes, along with the genotype. (a) data from cv H930-36 experiment, (b) cv Herta. Bars represent standard deviation.
0
20
40
60
80
100
120
140
WT dwf2 WT dwf2 WT dwf2
0 hr 1.5 hr 2 hr
cv H930-36
Sho
ot
len
gth
re
lati
ve t
o 0
h (
%)
0
20
40
60
80
100
120
140
WT sln1-1 WT sln1-1
0 h 1 h
cv Herta
Sho
ot
len
gth
re
lati
ve t
o 0
h (
%)
127
5.5 Discussion
In order to extend the investigation of the role of DELLA proteins in abiotic stress tolerance in
cereals, heat shock treatment was selected in order to produce high levels of ROS within plant
cells (Mittler, 2002) and with the aim of identifying differential survival between genotypes.
High levels of ROS were required as DELLAs are believed to confer abiotic stress tolerance by
reducing ROS via upregulation of ROS detoxifying enzyme expression (Achard et al., 2006). The
high-temperature (50 °C), transient heat stress described in this study was favoured over a
prolonged exposure to elevated temperature as long-term exposure to lower temperature could
have allowed plants to adapt to the abiotic stress conditions and was unlikely to produce 50%
death of wild-type plants (Dr. A. Korolev, personal communication). Furthermore longer term
heat stress was likely to result in increased stabilisation of DELLA in wild-type plants, perhaps
thereby resulting in levels close to those in the DELLA GoF mutants. The conditions also parallel
those used by Sarkar et al. (2004), and allowed comparison of their results (where LoF mutants
were not used) with the results obtained in this study. The use of heat shock had the advantage
of ease of application and for a relatively high number of samples to be tested simultaneously,
providing a strong basis for statistical analysis of the results. Other forms of induced oxidative
stress were considered, but were rejected based on practicality (e.g. cold stress) or concerns
regarding the instigation of non-ROS related DELLA interactions (e.g. UV light treatment and
DELLA-PIF interaction).
Heat shock was conducted on seedlings, as young plants were reported to be more prone to
heat stress than older, more established plants (Karim et al., 1999; Walbot, 2011). However, a
small scale experiment conducted on mature plants (Zadoks stage: 55+; Zadoks, 1974),
suggested the mature plants responded to heat stress in a similar way as the young seedlings of
the same genotype (cv Himalaya: wild-type, sln1c, sln1d), (data not shown). The use of seedlings
was also desirable due to practical constraints imposed by the size of the heat shock cabinets,
and the availability of growth space. Constant environment space restrictions also meant that
the number of SLN1 LoF plants (cv Himalaya: sln1c; cv Herta: sln1-1) was always limited due to
the recessive nature of the mutants (see Chapter 3), and the low germination of the mutant
seedlings, which required large numbers of seed from heterozygous plants to be germinated.
128
The focus of the work in this chapter was to establish whether SLN1 function confers heat shock
tolerance at the cellular level, therefore efforts were made to limit the impact of plant stature
and phenotype when assessing plant survival. As SLN1 function is intrinsically linked to plant
phenotype, this was difficult to achieve. Furthermore there is limited availability of height
mutants with lesions not implicated in the GA pathway. Plant stature affects tolerance to heat
and abiotic stress (Patel & Franklin, 2009; Sarkar et al., 2004), as does leaf morphology (Chaves
et al., 2003), and the use of seedlings went some way to negating the effect of plant stature. The
cv Bowman mutants of differing stature showed no significant differences in survival as a result
of heat shock (Figure 5.2d), suggesting plant stature per se does not determine survival under
the conditions used in this study. Caution must however be applied when comparing the results
of the Bowman background with results of stature mutant survival in the Himalaya, H930-36 and
Herta backgrounds. None of the cv Bowman mutants were severely dwarfed (M827 and M885
were semi-dwarfs), nor did the “tall” exhibit a true slender phenotype (M380 and M382 were
tall rather than slender). The genetic basis for the M827 and M885 mutants are known (GA-20
oxidase and brassinosteroid receptor mutants respectively), with both likely to result in
stabilised SLN1 through mediation of GA levels (Dr. L. Ramsey, JHI, personal communication;
Chono et al., 2003), however, the data do not suggest the mutations confer a statistically
increased tolerance to heat shock under the conditions used (Figure 5.2d). Although these
findings tend to support the conclusion of Sarkar et al. (2004) that short stature in barley
resulting from reduced GA levels (or from reduced sensitivity to GA) leads to abiotic stress
tolerance, the link of the M827 and M885 mutants to the GA – DELLA pathway and the lack of
characterisation of the lesions for the tall phenotypes exhibited by M380 and M382 mean that
the importance of stature versus DELLA function in heat stress tolerance cannot be clearly
dissected.
Based on the survival under salt stress of DELLA GoF and LoF mutants of Arabidopsis, it was
hypothesised that SLN1 stability and function would confer increased survival to heat stress. The
results of the heat shock experiments support this, with the sln1d GoF mutant exhibiting
increased survival, and the sln1c LoF mutant exhibiting significantly decreased survival (P: 0.014)
after 1 h heat shock compared to the wild-type (Figure 5.2a). Furthermore, the sln1-1 LoF
mutant showed significantly decreased survival after 1 h heat shock compared to the wild-type
(Figure 5.2c; P: 0.008). A greater survival differential was observed in heat shock experiments
129
compared to the salt stress experiments, perhaps because of the larger number of plants tested,
or because the smaller experiments resulted in fewer variables such as position effects in the
cabinet. The survival data supports the alternative hypothesis (H1). The need to process large
numbers of samples meant that shoot length and dry mass analysis had to be limited and was
focused on the H930-36 and Herta backgrounds, for which there is a single GoF and LoF sln1
mutant genotype, respectively, in each background. Furthermore, the sln1-1 phenotype was less
severe than that of the sln1c plants (plants grew slightly more strongly and appeared to have
slightly thicker leaves, Chapter 3), which would go some way to diminishing the effect of plant
morphology on the data. Growth data (dry mass and length) was collected only from surviving
samples in order to investigate how SLN1 affects plant recovery and growth following transient
heat stress. The dwf2 GoF mutant showed significantly increased shoot biomass accumulation at
1.5 h compared to the wild-type (P: <0.001; Figure 5.3a), suggesting the stabilised DELLA in
these plants protected them from heat shock and allowed them to better maintain their growth
characteristics. Conversely, the sln1-1 LoF mutant showed significantly reduced biomass
accumulation and shoot length at 1 h compared to the wild-type (P: <0.001; Figures 5.3b, 5.4b),
suggesting that even when these plants survived heat stress, they showed limited recovery and
were unable to “benefit” from the lack of DELLA to recommence growth. These findings support
the alternative hypothesis (H1).
It is possible that DELLA confers stress tolerance in DELLA stabilising mutants such as dwf2, by
reducing the effects of oxidative damage, whereas potential stabilisation of DELLA in wild-type
plants is relatively delayed and unable to provide rapid protection. However, it is likely that the
potential stabilisation was then also a cause of the reduced growth in these plants compared to
non-treated controls. It is unfortunate that anti-SLN1 antiserum was no longer available (and
attempts by collaborators to produce more failed) since direct measurement of the protein
levels would have been informative. It is likely that the removal of dead samples from the
analyses reduced the significance of genotype differences even for the dwf2 (cv H930-36) GoF
mutant. For example, removal of dead samples from cv H930-36 1.5 and 2 h treatment groups
reduced the total sample size for analysis from 35 to 24 seedlings, and 47 to 25 seedlings
respectively, with most dead plants being from the wild-type group. It was interesting to note
that highly damaged seedlings of the wild-type and GoF (but not LoF) mutants produced new
shoots from the meristem or from emerging tillers. Since SLN1 is localised in growing tissue

130
(Chandler et al., 2002), the presence of high levels of DELLA, even in wild-type plants, may
protect meristem tissue from heat shock damage, allowing some seedlings to survive despite
widespread death to older leaf and stem tissue.

131
Chapter 6: Silencing Sln1 Expression
6.1 Aims
The aim of the work described in this chapter was to produce transgenic lines with
downregulated expression of Sln1 in order to assess the effect of reduced SLN1 on plant growth
and development. This work was undertaken as there were no barley plants available which had
either a complete knockout of the wild-type gene or known reduced expression. This chapter
describes the construction and use of RNAi (hairpin construct) designed to give a range of
silencing levels for the Sln1 gene in barley.
The following hypothesise were formulated. H1: significant downregulation or the complete
knockout of Sln1 expression results in altered plant development; H0: significant downregulation
or complete knockout of Sln1 expression has no effect on plant development.
6.2 Introduction
6.2.1 Applications of transgenic technology
Plant transformation has allowed both greater insight into the fundamental mechanisms of
plant function and the direct improvement of commercial crop species (Bartlett et al., 2008).
Economic and agriculturally beneficial traits including reduced stature, increased yield, altered
plant and seed composition, and biotic and abiotic stress tolerance have been introduced to
crop lines (Dayan et al., 2010; Dunwell, 2000). Modification of flowering time has allowed
growth patterns to be exploited to increase seasonal yield, change growing season to secure
better market opportunities, or to extend the plant vegetative stage if the desired product is
foliage rather than grain or fruit (Richards, 2000; Salehi et al., 2005). Silencing of GA signalling
pathway genes has been used in monocots, and extensively in dicots, to determine how the loss
of pathway components affects plant growth and development. Barley is an ideal system for
translating transgenic research from dicots (Arabidopsis and tobacco), to cereals, as barley is
amenable to transformation, and barley DELLA (SLN1) is encoded by a single gene (Sln1).
132
6.2.2 Transgenic adaptation of the GA-DELLA signal transduction pathway
Studies using transgenic plants have provided a greater insight into DELLA function and
structure. Overexpression of DELLA in wild-type and mutant lines allows the affect of altered
DELLA levels on plant development to be observed, whilst the expression of mutant DELLA
genes allows the identification of key protein functional regions and motifs. The tagging of
DELLA proteins using fluorescent proteins (GFP) has allowed the sites of intracellular DELLA
accumulation and degradation to be visualised.
Transgenic regulation of GA-DELLA signal transduction pathway components
The effect of DELLA on plant growth has been investigated through the expression of the
Arabidopsis DELLA gene (RGA) tagged with Green Fluorescent Protein (GFP) expressed in wild-
type, and the DELLA rga LoF mutant. Constitutive expression of the GFP-RGA fusion protein
under the 35S promoter in wild-type plants repressed GA signalling more efficiently than
expression under the native promoter (Silverstone et al., 2001), whilst expression in the mutant
lines (lacking functional RGA) resulted in a reversion from the mutant to the wild-type
phenotype, thereby confirming RGA as a GA-mediated inhibitor of growth. An analogous study
was conducted in rice by Itoh et al., 2002. Expression of SLR1-GFP in transgenic rice resulted in
the development of mild dwarf plants (60 – 80% of the height of wild-type plants), which were
responsive only to the addition of GA3 at high concentration (100 µM). SLR1-GFP expression in
the slr1-1 slender mutant rescued the mutant phenotype to that of the wild-type (Itoh et al.,
2002). Expression of GAI, the Arabidopsis DELLA orthologous to SLR1, also resulted in a dwarf
phenotype when expressed in wild-type rice (Fu et al., 2001). Furthermore GAI expression was
linked to the extent of the dwarfism, with higher expression (conferred by the ubiquitin
promoter as opposed to the 35S promoter) resulting in a more extreme phenotype, supporting
the relief of restraint model proposed by Harberd et al., 2003 (Figure 1.2).
In addition to overexpression of DELLA, the effect of increased GID1 expression has been
explored in rice. Overexpression of GID1 which mediates DELLA degradation in the presence of
GA (see Section 1.4.2) produces a GA hypersensitive phenotype. The GA hypersensitive
response was identified through the growth of second leaf material, which was highly
responsive to the addition of exogenous GA compared to control plants. The slender-like

133
phenotype characterised by the development of long, light green leaves, poor fertility, and
decreased tiller formation, likely results from increased degradation of DELLA, and the
subsequent loss of growth inhibition (Ueguchi-Tanaka et al., 2005).
Components of the GA-DELLA signal transduction pathway can be silenced using transgenic
methods. Antisense silencing of the single endogenous DELLA in tomato, SIDELLA, produced
plants with a slender-like phenotype, elongated flower trusses and parthenocarpic small fruit
(Martí et al., 2007).
Expression of DELLA mutant genes
The importance of conserved motifs in GA recognition in cereals was identified in rice (Oryza
sativa) by Itoh et al., 2005. The expression of transgenes with altered DELLA and TVHYNP motifs,
and alteration to the space between these motifs, resulted in a GA insensitive severe dwarf
phenotype. Transgenic expression of mutant GA-insensitive DELLA GoF mutant proteins in
transgenic plants results in growth inhibition. Expression of the rgl1 and Atgaidel, in Arabidopsis
and tomato (Solanum Lycopersicum L.) respectively, produced severe GA-insensitive dwarf
phenotypes, with the growth restraint in tomato equivalent to that of GA-deficient mutants
(Marti et al., 2007). Transgenic Arabidopsis exhibited delayed bolting and under-developed
trichomes and flowers compared to control lines (Wen & Chang, 2002), whilst tomato lines were
partially sterile with compacted inflorescences. Expression of the GA-insensitive GoF mutant
Arabidopsis DELLA allele gai in transgenic rice resulted in a GA insensitive dwarf phenotype. As
with GAI expression, phenotype was linked to the strength of expression, with gai driven by the
ubiquitin promoter resulting in a more severe dwarf phenotype than expression under the 35S
promoter (Fu et al., 2001).
6.2.3 Post-transcriptional gene silencing
Mechanism of RNA interference (RNAi) based silencing
Post-transcriptional gene silencing (PTGS) is ubiquitous to eukaryotic organisms, providing roles
in defence against viruses, condensation of chromatin into heterochromatin and regulation of
134
gene expression (Qi & Hannon, 2005; Sharp, 2001; Baulcombe, 2004). PTGS allows the
translation of one or more genes to be downregulated or suppressed entirely via the targeted
action of sequence specific antisense RNA. A common mechanism of PTGS is RNA interference
(RNAi), which is initiated when sense and antisense strands form a double helix of long double-
stranded RNA (dsRNA), and interact with RNA Dicer, (a ribonuclease (RNase) III enzyme). The
dicer cuts dsRNA (typically >200 nt) into small interfering RNAs (siRNAs, typically 20-25 nt) and
micro RNA (miRNA) that target homologous mRNAs for destruction via an RNA-induced silencing
complex (RISC).
Transgenic application of gene silencing
Elucidation of the RNA interference (RNAi) silencing pathway has allowed specific target genes
to be downregulated or suppressed entirely through the expression of silencing constructs.
Dicer activity is dependent on a stem loop structure in the secondary structure of RNA, formed
by the expression of inverted repeat sequences of the gene separated by an intron. These
hairpin forming structures are naturally encoded in genomic DNA, however artificial structures
can be expressed transgenically in order to silence a gene of interest.
Transgenic induction of the RNAi silencing mechanism has been shown to work in both dicots
and cereals, including hexaploid wheat and barley, and has been used extensively as a tool for
functional genomics, allowing the linkage of gene and protein function to plant phenotype
(McGinnis et al., 2005). RNAi has advantages over GoF and LoF approaches in the study of gene
function, as it allows silencing of multigene families, and in polyploids such as hexaploid wheat it
allows homeologous genes to be silenced (Travella et al., 2006).
Transgenic utilisation of the RNAi silencing pathway has provided agricultural and commercial
benefits. One practical application for the RNAi silencing pathway has been in conferring
resistance to disease, as shown by the immunity conferred to barley yellow dwarf virus through
the expression of the virus derived transgene in a silencing hairpin structure (Wang et al., 2000).
Further examples of RNAi induced resistance to disease are seen in papaya with resistance to
Papaya Ringspot Virus (PRSV), and transgenic potatoes with resistance to Potato Leafroll Virus
and Potato Virus Y (PVY), (Fuchs & Gonsalves, 2007; Lawson et al., 1990; Eamens et al., 2008). In

135
addition to virus resistance, RNAi has been used to enhance crop qualities, highlighting the
commercial applications of the RNAi silencing mechanism.
6.3 Materials and Methods
6.3.1 Production and cloning of the Sln1 fragment
PCR amplification of the Sln1 fragment
The hairpin construct designed to downregulate endogenous Sln1 gene expression required an
insert of 150-500 bp, consisting of 5’ untranslated region (UTR) and 5’ ORF sequence. 5’
sequence was required to ensure SLN1 specificity (i.e. to prevent silencing of orthologous, non-
target GRAS proteins). Additionally, 5’ prime sequence has been shown to produce a lower
efficiency of silencing compared to 3’ sequence (Helliwell & Waterhouse, 2005), which was most
appropriate, as total silencing was not desired due to concerns that full Sln1 silencing would be
lethal to seedling development. To produce an appropriate Sln1 product, PCR amplification and
a Sln1 specific primer pair (Table 6.1) were used. Barley (cv Himalaya) genomic DNA, isolated
using DNeasy Plant Minikit (Qiagen), was used as template DNA. PCR was conducted using
GoTaq® DNA Polymerase (Promega) with the following cycling conditions: 94 °C for 3 min; then
10 cycles of 94 °C for 15 s, 59 °C for 15 s (decreasing by 0.5 °C per cycle) and 72 °C for 30 s. This
was followed by 25 cycles of 94 °C for 15 s, 54 °C for 15 s, 72 °C for 30 s, followed by a final
extension of 72 °C for 10 min. The expected product should be 468 bp, consisting of 274 bp of 5’
UTR and 194 bp of 5’ ORF sequence. The success of the amplification and the size of the Sln1
product were assessed by electrophoresis and comparison against Quick-Load® 100 bp DNA
ladder (New England BioLabs).
Table 6.1 Primers used to produce the Sln1 insert. (a)‘F’ denotes forward, and ‘R’ reverse primer orientation. (b)Primer binding site coordinates are presented relative to the first nucleotide of the Sln1 initiation codon (‘A’ = co-ordinate 1), ‘-‘ refers to the number of bases upstream of this point. The reference sequence used was Sln1 of Himalaya (see Appendix 2).
Orientation (a)
Primer binding site (b)
Sequence (5’-3’)
F -274 to -255 CACACCACTATGCCCAGATG
R 175 to 194 TCGAGCTGCTCCAGCTTCTG

136
The Sln1 silencing insert was cloned into pCR®8/GW/TOPO® TA using the pCR®8/GW/TOPO
Cloning Kit (Invitrogen) and Library Efficiency® DH5α™ cells (Invitrogen). Cloning was conducted
according to the manufacturer’s instructions, with the following modifications: the ligation
reaction was incubated at rt for 30 min instead of 5 min, and cells were heat-shocked for 35 s
instead of 45 s. Transformed cells were propagated on spectinomycin (50 mM) selective LB-G
plates (see Appendix 1.4) at 37 °C overnight.
The presence and orientation of the Sln1 insert was confirmed by colony PCR (see Section 2.2.5)
using the vector specific forward primer M13F-20 (GTAAAACGACGGCCAGT), and the reverse
primer used to produce the silencing insert (Table 6.1). The following cycling conditions were
used: 95 °C for 5 min; then 35 cycles of 95 °C for 30 s, 47 °C for 30 s, 72 °C for 30 s, followed by a
final extension of 72 °C for 10 min. The size of the product was assessed against Quick-Load®
100 bp DNA ladder (New England BioLabs), with a product of 612 bp indicative of successful
cloning of an insert in the appropriate orientation. It was estimated that 50% of the colonies
would contain the insert in the desired orientation.
Selected colonies were grown with shaking in overnight culture (LB-G, spectinomycin 50 mM) at
37 °C, before plasmids were isolated (see Section 2.2.6), and the integrity of the insert
confirmed by sequencing using vector specific primers M13F-20 and M13R
(CAGGAAACAGCTATGACC) and the primers used to produce the Sln1 insert (Table 6.1).
Sequencing was carried out by the The Genome Analysis Centre (TGAC). The selected clone was
designated pENTRYSln1.
6.3.2 Sln1 plant gene silencing vector construction
The Sln1 silencing vector for plant transformation was created using the Gateway® system
(Invitrogen). The LR reaction in which the entry vector was recombined in a site-specific reaction
(based on attL recombination sites) with the destination vector pBract207 was performed
according to manufacturer’s instructions, with the exception that the LR reaction was incubated
for a minimum of 2 h at rt instead of 1 h. pENTRYSln1 DNA was combined with the destination

137
plasmid (http://www.bract.org) designed to provide a hairpin-based silencing vector in the LR
clonase mix, with the resulting construct being designated pBract207Sln1-SC1 (Figure 6.1)
E. coli (DH5α) was transformed with the mix and recombinants selected by plating on LB-G
containing 50 µg/mL kanamycin. Insertion of two copies in the destination vector in opposite
orientations results in the deletion of both copies of the ccdB gene which prevents growth in E.
coli, allowing selection of the desired clone. Selected colonies were grown with shaking in
overnight culture (LB-G, spectinomycin 50 mM) at 37 °C, before plasmids were isolated (see
Section 2.2.6).
Figure 6.1 RNAi silencing vector pBract207Sln1-SC1. RNAi cassette expression is driven by the ubiquitin promoter, providing strong, constitutive expression. The Hyg resistance gene is under constitutive expression by the 35S promoter. Arrows denote gene promoter orientation.

138
6.3.3 Transformation of Agrobacterium tumefaciens
The pBract vectors are based on pGreen and were therefore co-transformed into Agrobacterium
with helper plasmid pSoup (Hellens et al., 2000). The pBract202 (containing the hygromycin
resistance gene, Hyg) was used as a transformation control (Figure 6.2).
Figure 6.2 The pBract202 construct used in the production of control lines. pBract202 contains the Hyg resistance gene under constitutive expression by the 35S promoter. Arrows denote gene orientation.
Agrobacterium transformation
Electroporation competent A. tumefaciens (strain AGL1) cells, prepared as described by
Harwood et al., 2008 were provided by Mr. M. Smedley, JIC. Transformation of Agrobacterium
was performed using electroporation. 100 ng of pBract207Sln1-SC1 and 1 µL pSoup (50 ng) was
gently mixed with 45 µL competent cells in a pre-chilled electroporation cuvette (2mm gapped,
AnaSpec, Fremont, CA, USA), and electroporated at 2.5 V. The electroporation mix was
immediately added to 250 µL LB (Invitrogen), at rt (and gently shaken at rt for 4 h. An aliquot
(100 µL) of the suspension was spread on LB-G plates (see Appendix 1.4) with rifampicin and

139
kanamycin selection (both at 50 µg mL-1). Plates were incubated at 28 °C for two days to allow
recombinant Agrobacterium clones to grow.
Confirmation of pBract207Sln1-SC1 status in Agrobacterium
In order to confirm the presence and orientation of the inserts, and the entirety of the
pBract207Sln1-SC1 vector in Agrobacterium, extracted plasmid was back-transformed into E.
coli. Plasmids were isolated from Agrobacterium, and transformed into DH5α™ (see Section
2.2.3), and propagated on spectinomycin (50 mM) selective LB-G plates (see Appendix 1.4) at 37
°C overnight. Selected colonies were grown with shaking in overnight culture (LB-G,
spectinomycin 50 mM) at 37 °C, before plasmids were isolated (see Section 2.2.6). To confirm
that all parts of the pBract207Sln1-SC1 construct were present, a restriction digest was run using
the restriction enzyme BsrGI. Confirmation of insert orientation was provided by colony PCR
using sense (UbiProF1, i18intronR1) and antisense (IV2intronF1, NostermR1) primer sets (Table
6.2). The following cycling conditions were used: 95 °C for 5 min; then 38 cycles of 95 °C for 30 s,
59 °C for 40 s, 72 °C for 45 s, followed by a final extension of 72 °C for 10 min. Product size was
assessed by agarose gel electrophoresis and comparison with HyperLadder™ I (Bioline), with a
band of 903 bp produced by sense primers and a band of 820 bp produced by antisense primers
indicative of a successful LR reaction and cloning.
Table 6.2 Primers used to confirm the presence and orientation of the Sln1 insert. (a)Orientation of the Sln1 insert in the pBract207Sln1-SC1 vector. (b)‘F’ denotes forward, and ‘R’ reverse primer orientation.
Primer Insert orientation (a)
Primer orientation (b)
Sequence (5’-3’)
UbiProF1 Sense F ATGCTCACCCTGTTGTTTGG
i18intronR1 Sense R CATCGTTGTATGCCACTGGA
IV2intronF1 Antisense F CCAAAATTTGTTGATGTGCAG
NostermR1 Antisense R TGTTTGAACGATCCTGCTTG

140
Preparation of standard Agrobacterium inoculums
The method of Tingay et al. (1997) was used to prepare a standard inoculum for transformation.
Standard Agrobacterium inoculum was produced from single colonies in modified MG/L medium
(with rifampicin and kanamycin selection, Appendix 1.4; Garfinkel & Nester, 1980) incubated for
40 h at 27 °C. A standard inoculum was prepared by adding 200 µL of culture to 200 µL of 15%
aqueous glycerol in a microcentrifuge tube, and kept at rt for 6 h before being transferred to -80
°C. A 400 µL aliquot of standard inoculum was removed from -80 °C storage, added to 10 mL of
MG/L medium without antibiotics, and incubated overnight at 28 °C with shaking at 200 rpm to
produce Agrobacterium suspension.
6.3.4 Production of embryos for transformation
Immature seed sterilisation
Immature barley seed was collected from donor plants grown as described in Section 2.1.2. Seed
sterilisation was performed as described by Harwood et al. (2008). Briefly, barley spikes were
collected when the immature embryos were approximately 1.5 – 2 mm in diameter. All
subsequent steps were performed in a laminar flow hood. Immature seeds were removed from
the spike and sterilised by washing in 70% ethanol for 30 s followed by three washes in sterile
distilled water. A 50% (v/v) solution of sodium hypochlorite (sodium hypochlorite solution,
Sigma Aldrich) was then added and seeds incubated for 4 min. Finally, seeds were washed four
times in sterile distilled water, and left wet in a sterile screw top jar ready for the isolation of
embryos.
Isolation of immature embryos and induction of callus
Under sterile conditions, sterilised immature seeds were opened with a pair of fine forceps. The
embryonic axis was removed from the immature embryo, before the immature embryo was
plated scutellum side up on BCI medium (Appendix 1.3). Up to 25 embryos were placed on each
9 cm Petri plate. The immature embryos were stored overnight in an incubator (24 °C), before
transformation with Agrobacterium.

141
6.3.5 Barley transformation
Transformation of embryos
Barley transformation was performed as described by Bartlett et al. (2008). A small drop of
Agrobacterium suspension was added to each of the immature embryos on a plate. The plate
was then tilted to allow any excess Agrobacterium suspension to run off. Immature embryos
were then gently drawn across the surface of the medium (to remove excess Agrobacterium),
before transfer to a fresh BCI medium plate, scutellum side down. Embryos and Agrobacterium
were co-cultivated in the dark for 3 days at 23 – 24 °C.
Selection of Transformed Material
Selection of transformed material was performed as described by Harwood et al. (2008).
Hygromycin-resistant transformants were selected by transferring embryos to selective BCI
medium plates containing 50 mg L-1 hygromycin and 160 mg L-1 Timentin (Duchefa). Inoculated
embryos were cultured for 2 wks at 23 – 24 °C in the dark (selection 1), then transferred to fresh
selective BCI medium plates on a 2 week basis (selection 2 and 3) and cultured under the same
conditions as selection 1. During this 6 wk period, callus showing no development or severe
Agrobacterium contamination, were discarded. After 6 wks selection on BCI medium,
developing callus was transferred to selective BT medium (50 mg L-1 hygromycin and 160 mg L-1
Timentin), (Appendix 1.3), and developed for 2 wks under low light conditions, achieved by
covering plates with a thin sheet of paper in the tissue-culture room (conditions described in
Section 2.1.2).
Regeneration of transgenic plants
Regeneration of transgenic plants was performed as described by Harwood et al. (2008). After 2
wks on BTM, embryo-derived material was transferred to selective BR medium (50 mg L-1
hygromycin and 160 mg L-1 Timentin) in deep Petri dishes (Appendix 1.3). Callus was observed
on a bi-weekly basis; with callus development efficiency calculated as the number of calli
exhibiting shoot initiation during development on BR medium, as a proportion of the original
number of inoculated embryos. Plantlets were grown in tissue culture rooms, under normal light
conditions, as described in Section 2.1.2. Once shoots were 2-3 cm in length and roots had
developed, the small plantlets were transferred to glass culture tubes (Sigma Aldrich),
containing approximately 12 mL of selective BCI medium (with hygromycin and Timentin

142
selection as above but without dicamba or growth regulators). Transformation efficiency was
determined as the number of independently transformed lines (which successfully produced
adult plants), as a proportion of the original number of inoculated embryos. Once a root system
had developed, roots were gently washed in water, and seedlings transplanted into Barley Mix
soil (see Appendix 1.1), and grown under the same conditions as donor plants under CER
conditions as described in Section 2.1.2. Plant phenotype was observed on a bi-weekly basis. T1
seed was harvested from mature T0 plants, with the germination rate calculated as the number
of germinating seeds as a proportion of the total seed harvested from unbagged T0 heads.
Transgenic nomenclature
For each experiment the inoculations were given a laboratory experiment number, such that in
the first experiment embryos inoculated with pBract207Sln1-SC1 were designated 271 and
those inoculate with pBract202 were designated 272. Regenerants generated from callus from
original embryos were given the suffix -01, -02. Individual T0 plantlets developing from these
separate transformation events were assigned a further suffix e.g. -01, -02. Plants in the T1 and
T2 generation were assigned further suffixes -01, -02 etc. to denote separate individual plants
developing from the previous generation.
Screening of transgenic plants
T0, T1, and T2 lines of plants transformed with pBract207Sln1-SC1 and pBract202 were screened
for the presence of the hygromycin resistance gene (Hyg) and both sense and antisense
components of SC1. Genomic DNA was extracted from leaves of seedlings of each of the
putative transgenic lines using a modification (see Section 2.1.4.1) of the protocol described by
Edwards et al. (1991).
Screening for Hyg was conducted using Hyg specific primers: HygF (ACTCACCGCGACGTCTGTCG)
and HygR (GCGCGTCTGCTGCTCCATA) provided by Dr. Wendy Harwood. Cycling conditions were:
95 °C for 5 min; then 35 cycles of 95 °C for 30 s, 60 °C for 40 s, 72 °C for 1 min, followed by a final
extension of 72 °C for 10 min. The product was assessed by agarose gel electrophoresis and by
comparison with a DNA marker. A product of 917 bp indicated the presence of Hyg.
143
The sense and antisense specific primer sets used to determine the presence of the silencing
insert in transformed E. coli (Section 6.3.1), were used in a PCR based screen for the presence of
SC1 in transgenic lines. Cycling conditions were: 95 °C for 5 min; then 38 cycles of 95 °C for 30 s,
60 °C for 40 s, 72 °C for 45 s, followed by a final extension of 72 °C for 10 min. Products were
assessed following electrophoresis and comparison with a DNA marker. Products of 903 bp
(using sense primers) or 820 bp (using antisense primers) indicated the presence of the Sln1
sequences.
6.3.6 Indentifying homozygotes in T1 lines
Identification of homozygote lines was conducted so that fair comparisons could be made
between putatively silenced lines, in addition to establishing whether Sln1-SC1 copy number
impacted on the degree of silencing for each line. Estimation of copy number in the T1 seedlings
was performed by iDNA Genetics (Norwich, UK, http://www.idnagenetics.com), by quantitative
PCR (qPCR) of the Hyg gene, using Hyg specific TaqManTM primers and a TaqManTM probe
designed by Dr. Peter Isaac (iDNA Genetics, Norwich). Between 6 - 11 Hyg positive T1 samples
per line were submitted for copy number analysis. With the exception of a single null control, no
other null samples were submitted for analysis. Consequently, a segregation ratio of 2:1
hemizygous to homozygous for Hyg was expected, with plants with the highest Hyg copy
number per line identified as likely homozygotes.
6.3.7 Assessing silencing levels in barley lines transformed with pBract207Sln1-SC1
Silencing levels were assessed using the procedure described in Section 2.4. RNA was extracted
from young developing tiller leaves of T0 and T1 plants. Care was taken to ensure that leaves of a
similar developmental stage were selected. Due to time constraints, and a desire to sample
plants at contemporaneous stages of development, T2 samples were generated from seed by
embryo rescue. First leaf material was sampled and combined from 2-7 rescued T2 embryos for
each selected T1 plant after approximately one week of development. The embryo rescue
procedure was similar to that of the isolation of immature embryos described in Section 6.3.4,

144
however embryonic axes were not removed and immature embryos were plated on 0.8% MS
medium (Murashige & Skoog, 1962) instead of BCI medium.
Sln1 transcript levels were assessed by qRT-PCR in T0, T1, T2 transgenic lines, with Golden
Promise WT and pBract202 lines used as controls. Low Sln1 transcript levels (compared to
control lines) were indicative of Sln1 silencing.
6.4 Results
6.4.1 Production of the silencing construct
6.4.1.1 Production of the Sln1 insert
The Sln1 insert (comprised of Sln1 ORF and upstream sequence), was successfully amplified
using the methods described in Section 6.3.1. Assessment of PCR product against a ladder
marker suggested a product size of 468 bp was produced; the correct size for the desired insert
(Figure 6.3).
Figure 6.3 PCR amplification of the Sln1 insert used in the production of the silencing construct. Both lanes were loaded with 2 µL of PCR product, with 1 µL x5 loading buffer and 2 µL SDW. Samples were run on a 0.8% agarose gel (TBE buffer) at 120 V. (M) 2 µL Quick-Load® 100 bp DNA ladder (NEB) was used as a ladder marker.

145
6.4.1.2 Assessment of the pCR®8 vector
PCR product of 612 nt was used to indicate that the Sln1 insert was present in the correct
orientation in the pCR®8 vector (Figure 6.4). Of the 10 colonies analysed, 6 (60 %; lanes 1, 2, 4,
6, 8, 10, Figure 6.4) contained the insert in the correct orientation, which correlated with the
pre-screen estimate of 50% (see Section 6.3.1).
Figure 6.4 Colony PCR to determine the presence and orientation of the Sln1 insert in the Gateway vector. Sample lanes were loaded with 5 µL of PCR product. Samples were run on a 0.8% agarose gel (TBE buffer) at 100 V. (M) 2 µL Quick-Load® 100 bp DNA ladder (NEB) was used as a ladder marker.
Sequencing of 4 of the 6 colonies confirmed that the insert was in the correct orientation, and
was completely homologous to the Himalaya wild-type upstream and ORF sequence (Figure
6.5).
-274CACACCACTATGCCCAGATGCCTTCCCCTCCCATCACCCGATGCCGTCTCGCAATCTCCTCC
CTCCCCCCCTCCCCTACAACTACTCCCAGTTGCTCCCGCTGCCGCTCGCTCGCTGCTTTGCCAGT
TTGCCCGCTCGCTCCCCTCCTCCTCCCCCCTTTCCCAACCCTGGATCCAAATCCCGACCCTCCCC
GCACCCGAAACCGAGGCAAGCAAAAGCTTCCCGCGATTATTGGCTAGGTAGAGAGCGAGGTAGCT
CGCTCGCGGCGAGGATCATGAAGCGCGAGTACCAGGACGGCGGCGGGAGCGGCGGTGGGGGTGAT
GAGATGGGGTCGTCGAGGGACAAGATGATGGTGTCGTCGTCGGAGGCGGGGGAGGGGGAGGAGGT
GGACGAGCTGCTGGCGGCGCTCGGGTACAAGGTGCGGGCGTCCGACATGGCGGACGTGGCGCAGA
AGCTGGAGCAGCTCGA194
Figure 6.5 Sequence of the Sln1 silencing insert sequenced from the pCR®8 vector. The methionine encoding ‘ATG’ denoting the start of the Sln1 ORF is underlined, and the ‘GACGAGCTGCTGGCG’ region encoding the ‘DELLA’ motif in underlined in bold. Coordinates denote the position of the sequence relative to the start codon (ATG) of the Himalaya ORF, which is 0.

146
6.4.1.3 Assessment of the pBract207Sln1-SC1 construct
Restriction digest
Restriction digests were conducted on two E. coli colonies transformed with the pBract207Sln1-
SC1 plasmid derived from Agrobacterium as described in Section 6.3.3, in order to confirm that
no key regions had been lost from the construct (see Figure 6.1). The presence of bands of 2948
bp, 2056 bp, 2053 bp, 698 bp, 456 bp in size indicated that the construct was in its whole form
(Figure 6.6).
Figure 6.6 Restriction digest to confirm the presence of the Sln1 insert in the pBract207Sln1-SC1 construct. The two colonies produced identical digest patterns. (a)Vector backbone fragments are visible at 2948 bp. (b)35S-Hyg CaMV terminator fragments are visible at 2056 bp, and the Ubi promoter at 2053 bp. (c)Sln1 insert fragments (including part of the recombination site) are visible at 698 bp (one for sense and one for antisense). (d)Intron fragments are visible at 456 bp. Sample lanes were loaded with 3 µL of digest product, with 3 µL x6 loading buffer and 9 µL SDW. Samples were run on a 1% agarose gel (TBE buffer) at 100 V. (M) 1 µL 1kb DNA ladder (Invitrogen) was used as a ladder marker.
PCR
The two samples used in the restriction digest were also used in a PCR to confirm the presence
of the sense and antisense components of the silencing cassette. PCR amplification produced
products of 903 bp and 820 bp, confirming the presences and correct orientation of the
silencing insert (Figure 6.7).

147
Figure 6.7 Colony PCR to determine the presence and orientation of the Sln1 insert in the pBract207Sln1-SC1 construct. Two samples were used in PCR (1, 2). Amplification of the sense (S), and antisense (A), components of the silencing construct produced PCR products 903 and 820 bp in length respectively. Sample lanes were loaded with 15 µL of PCR product, and run on a 1% agarose gel (1x TBE buffer) at 100 V. (M) 1 µL 1 Kb DNA Ladder (Invitrogen), was used as a ladder marker.
6.4.2 Characterisation of T0 transformants
Embryo transformation
Embryo-derived callus putatively transformed with silencing construct (pBract207Sln1-SC1)
inoculum developed into plantlets, as did callus transformed with pBract202 control vector
inoculum (Table 6.3, Figure 6.8). Callus development efficiency of pBract207Sln1-SC1 inoculated
lines was almost equal to those inoculated with pBract202 (8% and 10.2% respectively). Callus
inoculated with pBract207Sln1-SC1 exhibited difficulties in regeneration compared to pBract202
inoculated callus, characterised by increased levels of chlorosis, and reduced vegetative growth
(Figure 6.9).
Transformation efficiency of T0 lines
A total of 27 transgenic plants from 16 independent lines were generated (9 putative silencing
plants from 5 independent lines, 18 control plants from 11 independently transformed lines). Of
these 27 plants, 16 were transferred to soil. The transformation efficiency of silencing construct
lines (1.3%) was less than half that of pBract202 control lines (4.9%). Both callus development
efficiency and transformation efficiency varied greatly between experiments, irrespective of the
inoculum used (Table 6.3).

148
Figure 6.8 Agrobacterium-mediated transformation of Golden Promise. The stages of transformant development from embryo-derived callus to transgenic plantlet (a) callus development on BCI medium (selection 1) 2 wks post inoculation; (b) regeneration of callus on BR medium 8 wks post inoculation; (c) plantlet development on BCI medium 12 wks post inoculation; (d) plantlet development on BCI medium 16 wks post inoculation.
Table 6.3 Efficiency of Agrobacterium-mediated transformation of Golden Promise embryos with the silencing construct pBract207Sln1-SC1 and pBract202 control vector. (a)Individual embryo isolation event. (b)Construct used for transformation. (c)Callus development efficiency was calculated as the number of calli exhibiting shoot initiation during development on BR medium, as a proportion of the original number of inoculated embryos. (d)Transformation efficiency was determined as the number of independently transformed lines that successfully produced adult plants, as a proportion of the original number of inoculated embryos.
Iso.
(a) Exp. Construct
(b) No.
Embryos Independent Hyg resistant
callus
Callus dev. efficiency
(%) (c)
No. of independent
lines
Trans. plants
produced
Trans. efficiency
(%) (d)
1 271 pBract207Sln1-SC1 75 4 5.3 1 3 1.3
272 pBract202 75 6 8 3 10 4
2 273 pBract207Sln1-SC1 76 6 7.9 1 1 1.3
274 pBract202 75 7 9.3 6 6 8
275 pBract207Sln1-SC1 75 0 0 0 0 0
276 pBract202 75 2 2.7 2 2 2.7
3 296 pBract207Sln1-SC1 75 12 16 3 5 4
299 pBract207Sln1-SC1 75 8 10.7 0 0 0
Totals pBract207Sln1-SC1 376 30 8 5 9 1.3
pBract202 225 23 10.2 11 18 4.9

149
(a)
(b)
Figure 6.9 Typical development of transformed callus (8 wks post inoculation) on BR medium (a) callus transformed with silencing construct (pBract207Sln1-SC1) and (b) control construct (pBract202). pBract207Sln1-SC1 inoculated lines exhibit difficulties in regeneration characterised by increased levels of chlorosis and reduced vegetative growth. All pictures are taken at the same magnification.

150
PCR screening of T0 lines
T0 plantlets were screened for the presence of Hyg and, when appropriate, both sense and
antisense components of the pBract207Sln1-SC1 as described in Section 6.3.5. All 16 transgenic
lines (both silencing construct and control) were positive for the Hyg gene (Figure 6.10 (a)). Of
the five putative silenced lines, three contained both sense and anti-sense components of the
silencing cassette (Figure 6.10 (b), 273-01, 296-01, 296-02, lanes 4 –7), one contained the sense
component alone (Figure 6.10 (b), 271-01, lanes 1 –3), and one contained neither sense nor
anti-sense components of the silencing cassette (Figure 6.10 (b), 296-03, lanes 8 - 9), (Table 6.4).
The later line was termed ‘Hyg-only’, due to the presence of Hyg, but absence of the silencing
cassette. Identical results were obtained for all plantlets within each line. A secondary screen
using a new genomic DNA preparation confirmed these results.

151
Table 6.4 Screening of putative pBract207Sln1-SC1 T0 plants. The results of PCR screens for the presence of Hyg, and both sense and antisense components of the silencing cassette. (a)Lane reference for agarose electrophoresis gel results shown in Figure 6.10.
Line Transformation Event Plants Hyg SC1 sense
SC1 antisense Gel reference (a)
271 01 01 + + - 1
02 + + - 2
03 + + - 3
273 01 01 + + + 4
296 01 01 + + + 5
02 + + + 6
02 01 + + + 7
03 01 + - - 8
02 + - - 9
Figure 6.10 Screening of putative pBract207Sln1-SC1 T0 plantlets for (a) Hyg, and (b) sense and antisense components of the silencing cassette. Lanes 1-9 contain products obtained using DNA extracted from plantlets developing from embryo inoculated with the pBract207Sln1-SC1 construct. Diluted (1:10) minipreps of pBract207Sln1-SC1 cloned cells were used for the (+ve) control. DNA extract from a non-transgenic donor plant (left), and SDW (right) were used for the negative controls (-ve). (M) 2 µL HyperLadder™ I (Bioline). Hyg specific primers were used to generate the product shown in (a), these were (HygF and HygR, Section 6.3.5), which produce a product of 917 bp. Each sample was separately amplified with a sense-specific primer set (UbiProF1 and i18intronR1, Section 6.3.3), which produces a product of 903 bp, and an antisense specific primer set (IV2intronF1 and NosTermR1, Section 6.3.3), which produces a product of 820 bp.
(a) (b)

152
T0 plant development
The development of T0 lines in soil was observed until plants reached maturity. Transgenic
plants expressing the partial construct appeared shorter at the time of flowering than full
construct or Hyg-only lines (Table 6.5). No differences were observed in anthocyanin
accumulation or stem thickness in any of the transgenic lines. All pBract207Sln1-SC1 containing
plants produced seed, and no consistent difference in germination of T1 seed from unbagged T0
heads was seen between partial and full Sln1-SC1 construct containing and control transgenic
lines (varying between 38 and 63%), however the Hyg-only line showed a higher germination
rate (94%) than the other transgenic lines.
Table 6.5 Germination and final plant height of T0 plants at maturity. (a)Each line combines individual plant data. (b)Height was measured from the stem base to the top of the grain. (c)Seed germination rate was calculated from 32-48 seeds. (d)This line produced no seed. NR denotes data was not recorded, NA indicates data was not analysed.
Line (a) SC1 status Height (cm) (b) Mean Germination (T1 seed (%))(c)
273-01 Full 72.7 NA 38
296-01 Full 69.5; 72.4 71.0 44
296-02 Full 70.3 NA 75
271-01 Partial 66.9; 67.2; 67.5 67.2 38
296-03 Hyg-only 70.0; 71.2 70.6 94
272-01 Control NR NA 63
272-02(d) Control 55.0 NA 0
272-03 Control 72.8; 74.4; 75.6 74.3 52
Assessment of silencing in T0 lines
Sln1 transcript levels in young, single leaf material was measured using qRT-PCR as described in
Section 6.3.7. Lines containing the full SC1 construct (273-01, 296-01 and 296-02), a Hyg-only
line (296-03) and the transgenic control line (272-01) had Sln1 transcript levels between 69 and
145% of those seen in the non-transformed Golden Promise plant (taken as 100%; Figure 6.11).
Sln1 transcript levels were highest (288%) compared to the untransformed plant(s) in the 271-
01 transformant, which contained only part of the SC1 construct.

153
Figure 6.11 Sln1 expression analysis in T0 lines. Sln1 transcript levels for transgenic plantlets containing the full (273-01, 296-01, 296-02) and partial form (271-01) of the Sln1-SC1 construct are shown beside transgenic control (272-01; Hyg positive without Sln1-SC1 construct), a Hyg-only plant (296-03; Hyg positive and Sln1-SC1 negative), and non-transgenic control (Golden Promise wild-type) lines. Expression is presented relative to the Golden Promise wild-type (GP WT) control that was set to 1.
6.4.3 Characterisation of T1 transformants
Identification of homozygotes in T1 lines
PCR screening of genomic DNA with primers specific for Hyg and the Sln1-SC1 was conducted as
described in Section 6.3.5 to establish the transgenic status of the T1 generation, and the
presence of Sln1-SC1 in the T1 lines. 61 Hyg positive plant samples were submitted for Hyg copy
number analysis, along with one control plant sample, as described in Section 6.3.6. Of the 62
Hyg positive plant samples, two lines (totalling 14 plants) contained the full Sln1-SC1 cassette,
one line (9 plants) contained the partial Sln1-SC1 cassette, three transgenic control lines
(totalling 29 plants), and one Hyg-only line (10 plants) were submitted (Table 6.6).
0
0.5
1
1.5
2
2.5
3
3.5
273-01 296-01 296-02 271-01 296-03 272-01 GP WT
full construct partial construct
Hyg-only transgenic control
non-transgenic
control
Re
lati
ve E
xpre
ssio
n (
to G
P W
T)
T0 plants

154
Table 6.6 Results of Hyg copy number analysis on the T1 generation. T1 plants listed were retained for T2 expression analysis. Homozygous lines were identified based on Hyg copy number. (a)Denotes the T0 plant the T1 plant was derived from, line information is derived by removing the final two letter suffix from the T0 plant number. (b)Suffix given to denote individual T1 plants e.g. 273-01-01-xx, where xx denotes the suffix listed in this column.
Line (T0 plant) (a) SC1 status Hyg copy no.
No. of plants with copy no.
T1 plants with copy no. (b)
273-01-01 full construct 5 1 -01
4 5 -02 to -06
3 1 -07
null control 0 1 -08
296-02-01 full construct 10 1 -01
8 2 -02, -03
7 1 -04
6 1 -05
3 1 -06
271-01-03 partial construct 4 1 -01
2 3 -02 to -04
1 5 -05
296-03-02 Hyg-only 8 1 -01
4 2 -02, -03
2 7 -04, -10
272-01-01 transgenic control 16 4 -01 to -04
8 6 -05 to -10
272-03-05 transgenic control 12 2 -01, -02
8 4 -03 to -06
6 2 -07, -08
4 1 -09
2 1 -10
272-03-08 transgenic control 3 2 -01, -02
2 2 -03, -04
1 5 -05 to -09

155
Assessment of silencing in T1 lines
Sln1 transcript levels in young, single leaf material was measured using qRT-PCR as described in
Section 6.3.7. The T1 plants analysed are shown in Table 6.7. Golden Promise leaf material at an
equivalent stage of development was not available; therefore comparisons were made with the
null control plant, 272-03-07-01.
Table 6.7 Plants selected for T1 expression analysis. Zygosity was determined from the Hyg copy number ratios for each line, as described in Section 6.3.6.
Line SC1 status T1 plant Hyg copy number Zygosity
273-01 full construct 273-01-01-02 4
296-02 full construct 296-02-01-01 10 Homozygous
271-01 partial construct 271-01-03-01 4 Homozygous
271-01-03-02 2 Hemizygous
296-03 Hyg-only 296-03-02-02 4
272-01 transgenic control 272-01-01-02 16 Homozygous
272-03 transgenic control 272-03-05-01 12 Homozygous
272-03 transgenic control 272-03-08-02 3
272-03 null control 272-03-07-01 0
296-03 null control 296-03-01-01 0
Sln1 transcript levels in plants containing the full or partial Sln1-SC1 construct were similar (37 –
55%, and 52 – 55% respectively), compared to that of the null control plant 272-03-07-01 (taken
as 100%). Sln1 transcript levels in the full and partial Sln1-SC1 construct plants, appeared
generally lower than the transgenic control (21 – 79%), approximately half that of null control
plants (100 – 300%), but higher than the transcript level in the Hyg-only plant, 296-03-02-02
(39%). The similarity in Sln1 transcript level between 271-01-03-01 (homozygous; 55%), and 271-
01-03-02 (hemizygous; 52%), produced from the same T1 parent, suggests consistency in Sln1
transcript levels between directly related plants, regardless of zygosity (Figure 6.12).

156
Figure 6.12 Sln1 expression analysis in T1 lines. Sln1 transcript levels for transgenic plants containing Hyg and the full (273-01-01-02, 296-02-01-01) or partial form (271-01-03-01, 271-01-03-02) of the Sln1-SC1 construct are shown beside transgenic control (272-01-01-02, 272-03-05-01, 272-03-08-02), Hyg-only (296-03-02-02), and null control (273-03-07-01, 296-03-01-01) plants. Expression is presented relative to the 272-03-07-01 null control that was set to 1.
T1 plant development
22 plants from the seven independent transformation lines were grown to maturity. These 22
plants comprised of two likely homozygotes and one likely hemizygote from each line, with a
further single null control from the 273-01-01 line. No clear phenotypic differences were noted
between plants in this generation. Immature T2 seed was collected for embryo rescue to speed
up obtaining the T2 generation.
6.4.4 Characterisation of T2 transformants
Analysis of Sln1 transcript levels was conducted in pBract207Sln1-SC1 T2 lines containing the full
silencing construct. Although not ideal due to the effects of tissue culture, time constraints
meant that embryo rescue was used to generate the T2 plants used in Sln1 expression analysis.
T2 seed was at an early stage of development, which may account for the resulting low number
0
0.5
1
1.5
2
2.5
3
3.5
27
3-0
1-0
1-0
2
29
6-0
2-0
1-0
1
27
1-0
1-0
3-0
1
27
1-0
1-0
3-0
2
29
6-0
3-0
2-0
2
27
2-0
1-0
1-0
2
27
2-0
3-0
5-0
1
27
2-0
3-0
8-0
2
27
2-0
3-0
7-0
1
29
6-0
3-0
1-0
1
full construct partial construct Hyg-only transgenic control null control
Re
lati
ve E
xpre
ssio
n (
to2
72
-03
-07
)
T1 plants

157
of plantlets that were successfully regenerated. Lines of interest, including those containing the
partial Sln1-SC1 construct were consequently unavailable for T2 expression analysis. PCR
screening of genomic DNA with primers specific for Hyg and Sln1-SC1 was conducted as
described in Section 6.3.5 to establish the transgenic status of the T2 generation, and the
presence of Sln1-SC1 in the T2 lines. Expression analysis was conducted as described in Section
2.2.4. Expression values for Golden Promise wild-type plants were disregarded as the geNorm
software identified them as being unsuitable for further analysis. Comparisons were therefore
made with the transgenic control plants derived from 272-01-01-04 (pBract202), and a single
null control plant (Table 6.8).
Table 6.8 Plants selected for T2 expression analysis. Zygosity was determined from the Hyg copy number ratios for each line, as described in Section 6.3.6.
Line SC1 status T1 plant Hyg copy no. Zygosity T2 plant analysed
273-01 full construct 273-01-01-01 5 Homozygous 273-01-01-01-01
273-01 full construct 273-01-01-05 4 Homozygous 273-01-01-05-01
273-01 full construct 273-01-01-07 3 Hemizygous 273-01-01-07-01
296-02 full construct 296-02-01-01 10 Homozygous 296-02-01-01-01
296-02 full construct 296-02-01-02 8 Homozygous 296-02-01-02-01
296-02 full construct 296-02-01-06 3 Hemizygous 296-02-01-06-01
272-01 transgenic control 272-01-01-04 16 Homozygous 272-01-01-04-01
272-03 transgenic control 272-03-05-01 12 Homozygous 272-03-05-01-01
272-03 transgenic control 272-03-05-08 6 Hemizygous 272-03-05-08-01
273-01 null control 273-01-01-08 0 NA 273-01-01-08-01
Sln1 transcript levels were similar in plants containing the full Sln1-SC1 construct (22 – 66%)
compared to the transgenic control plants (16 - 50%), and the null control (28%), (Figure 6.13).

158
Figure 6.13 Sln1 expression analysis in whole plant T2 lines. Error bars denote standard deviation between technical repeats. Expression is presented relative to the 273-01-01-08-01 null control (Hyg and Sln1-SC1 negative) that was set to 1.
6.5 Discussion
Sln1 regulates growth and development at all stages of the barley life cycle (Achard et al., 2009).
Due to the potentially lethal effect on plant develop that complete Sln1 silencing could cause,
barley was transformed using the pBract207Sln1-SC1 construct, which previous experimental
evidence suggested was likely to provide a range of silencing levels. It is likely that lines with
high levels of silencing were non-recoverable. 5’ sequence was selected to ensure that RNAi
silencing was DELLA specific, as the 3’ region is conserved amongst members of the GRAS family
(Pysh et al., 1999). Expression of 3’ Sln1 sequence in an RNAi construct could conceivably result
in the silencing of non-target members of the GRAS family of regulatory proteins, affecting non-
DELLA-mediated plant growth and development (Engstrom, 2011).
Development of Sln1-SC1 lines during the early stages of callus regeneration and plantlet
development was closely monitored in case expression of the RNAi construct proved lethal to
embryo development. Data showed that although callus development efficiency was similar
between Sln1-SC1 lines and control lines, the transformation efficiency of Sln1-SC1 lines was
0
0.5
1
1.5
2
2.5
3
27
3-0
1-0
1-0
1-0
1
27
3-0
1-0
1-0
5-0
1
27
3-0
1-0
1-0
7-0
1
29
6-0
2-0
1-0
1-0
1
29
6-0
2-0
1-0
2-0
1
29
6-0
2-0
1-0
6-0
1
27
2-0
1-0
1-0
4-0
1
27
2-0
3-0
5-0
1-0
1
27
2-0
3-0
5-0
8-0
1
27
3-0
1-0
1-0
8-0
1
full construct transgenic control null control
Re
lati
ve e
xpre
ssio
n (
to 2
73
-01
-01
-08
-01
)
T2 plants
159
much lower. The difference between callus development efficiency and transformation
efficiency suggests Sln1-SC1 expression did not affect callus initiation from immature embryos,
nor the very early stages of embryo development, but resulted in plant death at the early stages
of plantlet development. Phenotype observations during the regeneration stage support this
view, with Sln1-SC1 lines exhibiting early signs of plantlet death. Commonly in Sln1-SC1 lines,
green areas were observed on callus, but green shoots failed to develop. Differences in
development and transformation efficiency may result from the response of Sln1-SC1 lines to
tissue culture induced abiotic stress. As DELLAs are implicated in conferring resistance to abiotic
stress (Achard et al., 2008c), silencing of DELLA expression would likely result in increased
susceptibility to the stress induced by tissue culture. Sln1-SC1 lines exhibited stress phenotypes
at the regeneration stage, characterised by high levels of chlorosis and reduced vegetative
growth. It is likely that the most highly stress susceptible Sln1-SC1 lines fail to develop beyond
the regeneration stage, accounting for the difference in transformation efficiency compared to
control lines.
A slender phenotype similar to that of the sln1c (cv Himalaya) or sln1-1 (cv Herta) LoF mutants
(Chandler et al., 2002) was expected in lines expressing the Sln1-SC1 construct. Characteristics
including anthocyanin accumulation and slender phenotype, in addition to sterility were not
seen in the Sln1-SC1 lines. No clear differences in phenotype were apparent between the Sln1-
SC1 and control lines from the callus regeneration stage onwards. Furthermore, all Sln1-SC1
lines produced viable seed, with a germination rate of T1 seed similar to that of the control lines.
Fundamental difference between silencing lines and LoF lines could account the lack of a
slender-like phenotype. As the silencing construct lines were knockdown rather than knockout
lines, functional SLN1 would still be produced. This functional SLN1 would inhibit growth,
preventing the extreme slender phenotypes seen in Sln1 LoF mutants. Furthermore, functional
SLN1 could interact with other signalling pathways (see Section 1.4.3), promoting other
developmental and growth inhibitory mechanisms.
Hyg copy number analysis identified potentially complex transgene insertion patterns and an
unusually high copy number in the majority of transgenic lines generated in this study. A study
of the efficacy of the Agrobacterium transformation method (Bartlett et al., 2008), suggests that
45% of transgenic plants should have a Hyg copy number of one, and that high copy numbers

160
are rare, with only 3% of transformants containing a transgene copy number of over seven. Hyg
copy numbers appear high in both Sln1-SC1 and control lines, suggesting high Hyg copy number
is not linked to construct type. The concentration of genomic DNA submitted for Hyg count
analysis was lower than that usually submitted, which may have reduced the usual precision of
the method, producing more variable and higher copy number reads.
Based on previous experimental evidence, it was expected that half the developing Sln1-SC1
lines would contain the full Sln1-SC1 cassette, with the remainder containing only part of the
cassette, and a small proportion containing no part of the cassette at all (Wendy Harwood, JIC,
personal communication). Accordingly, one line (296-03) appeared to contain only the Hyg
component, whilst another (271-01) appeared to contain only the Hyg and the sense
component of the cassette. PCR is unable to elucidate the size of the missing sequence, raising
the possibility that regions as large as the Sln1-SC1 cassette, or as small as the sequence
necessary for primer binding, may have been recombined out. If the latter is true, the RNAi
construct may be fully functional despite the negative results suggested by PCR. This may be the
case in the 296-03 (Hyg-only) line, which showed reduced Sln1 transcript levels in both the T0
and T1 generations compared to the respective control lines, suggesting Sln1 is silenced in this
line. Similarly, Sln1 transcript levels varied greatly between the T0 and T1 generations in the 271-
01 (partial construct) line compared to the respective control lines. In the T1 generation (in
which two plants generated from seed were analysed for Sln1 silencing), both 271-01 plants
showed decreased Sln1 transcript levels compared to the control lines, suggesting Sln1 silencing
is functional in this line, and that antisense primer biding sites are likely to have been lost.
Whilst expression of the antisense component may result in silencing through complementary
binding to Sln1 mRNA, expression of the sense component alone would likely have no silencing
effect. Furthermore, expression of the sense component alone is unlikely to produce a protein
with DELLA function, as only a small component of the ORF would be expressed, and such a
protein would lack the GRAS domain required for SLN1 function, and the TVHYNP motif required
for GID1-GA recognition (Itoh et al., 2005).
Investigation of the full impact of Sln1 silencing in barley was limited by the low numbers of
silencing line transformants, despite the high number of inoculations conducted in this study.
Silencing levels were assessed in T0 lines to determine if the Sln1-SC1 construct conferred

161
functional Sln1 silencing, and whether silencing was readily apparent. Such analysis would
normally be conducted post T0 generations; however, concerns that Sln1 silenced lines would be
sterile due to loss of developmental function made it important to assess possible silencing at
the earliest feasible stage. A clear pattern of silencing was not observed in the T0 generation,
likely due to the effects of tissue culture, which produces variability between regenerating
tissues, and also imposes abiotic stress likely to directly affect Sln1 transcript levels. Project time
constraints meant that analysis of the T2 generation had to be conducted on material generated
from embryo rescue rather than from germinated seed, which would have been preferable. As
with the T0 analysis, although there was some indication of silencing in the Sln1-SC1 lines, no
definitive pattern of silencing was observed in this generation. Analysis of Sln1 silencing in the T1
generation provided a more stable basis for analysis compared to the T0 and T2 generations, as
samples are generated from seed rather than tissue culture. Analysis of the T1 generation
indicated that Sln1-SC1 lines contained reduced Sln1 transcript levels compared to null control
lines, although similar results were observed in the transgenic control lines. Further analysis will
be required to confirm the degree of silencing in the Sln1-SC1 lines, however the data presented
suggests expression of the RNAi construct confers some silencing in transgenic barley. Further
confirmatory work is required on the T2 or subsequent generations to determine whether the
null hypothesis (H0) is to be rejected or accepted.
This study is the first reported example of DELLA silencing in cereal species, with only one
preceding example reported in tomato (Solanum lycopersicum L.), (Martí et al., 2007). The
slender-like elongated phenotype and parthenocarpy reported in DELLA gene homologue
(SlDELLA) antisense silenced lines was not apparent in the Sln1-SC1 lines observed in this study.
The ability of SlDELLA lines to develop to maturity may be due to functional redundancy caused
by the function of orthologous DELLA genes present in tomato, but absent in barley.

162
Chapter 7: General Discussion
The primary aim of the work described in this study is summarised by the following hypothesise.
H1: DELLA function is equivalent between barley and Arabidopsis; H0: DELLA function is not
equivalent between barley and Arabidopsis. Barley was selected for this translational work, as
DELLA is expressed in barley by a single gene, unlike Arabidopsis DELLAs, which are expressed by
five genes with overlapping function. Barley also represents a simpler system for the study of a
temperate cereal than wheat which is less genetically tractable because DELLA is expressed by
three homeologous genes. Several characterised DELLA and GID1 mutants were available and
additional putative mutants were stored in the laboratory or JIC genetic resources unit although
these stocks were poorly labelled and required characterisation. An additional benefit of using
barley was the availability of established platforms for barley transformation and regeneration
at the John Innes Centre (JIC), thereby facilitating the transgenic study of Sln1 expression and
protein function. Although rice also possesses only one fully functional DELLA (SLR1), and has
the advantage of a sequenced genome, it has proven difficult to grow at the JIC (Dr. P. Vain, JIC,
personal communication). Barley is also an important crop to UK agriculture, and the fourth
most abundant cereal crop in the world (Bartlett et al., 2008), therefore a greater understanding
of DELLA function has the potential to be advantageous for world agriculture, and to form the
basis for translation to wheat, the UK’s major cereal crop.
The current work commenced some time after the cessation of studies of DELLA function in
barley (carried out by Fu et al., 2002) with limited stocks and poorly labelled packets of some
seed being available. Thus, it was necessary to characterise at the molecular level, the DELLA
sequence present in stocks labelled sln1 and dwf2. This proved unexpectedly challenging with
both sequencing and PCR being relatively inefficient because of the high GC content of DELLA
and the resulting complex secondary structure (Chapter 3). Other groups have reported similar
difficulties with analysis of the wheat and barley DELLAs (Pearce et al., 2011; Saville, 2011; Dr. P.
Chandler, personal communication). However, optimisation of the protocols enabled these
analyses and identified the lesions in the mutant stocks. Although the lesion in the DELLA
domain of dwf2 was similar to that in sln1d (Chandler et al., 2002), the premature stop codon in
sln1-1 produced a protein truncated upstream of the lesion in sln1c, and a slightly less severe
phenotype which was useful for stress tolerance studies. The similarity in mutant phenotype

163
and the location of the lesions within the DELLA genes is indicative of the high degree of DELLA
homology, both genetic and functional, between barley and Arabidopsis; further supporting the
alternative hypothesis (H1) of the shared role of DELLA. Sequencing of the wild-type parental
cultivars (cv Himalaya, cv H930-36, Herta and Triumph, all of which are modern breeding lines)
revealed a lack of diversity in the gene with very few SNPs present (Chapter 3). While this could
reflect the need for sequence conservation of a gene integral to plant growth and development,
the finding is in agreement with Comadran et al. (2011) who found limited diversity in
conserved genes of modern varieties.
The findings of Achard et al. (2006) formed the basis for the translational studies of abiotic
stress tolerance described in this study. Initial assessment of the importance of SLN1 in
tolerance to abiotic stress was conducted using salinity, with the protocol following, as far as
possible, that described in the Achard study. The advantage of using Arabidopsis as a model
plant was apparent when comparing the sample throughput of Arabidopsis and barley. The
space requirements and the manipulations required for setting up, and then analysing the data
from, the hydroponics study limited seedling numbers to 28 per treatment per experiment,
compared to the Achard study which used small seedlings and agar culture meaning that there
was no major limit to the number of samples that could be treated simultaneously. Low sample
number can give undue prominence to outliers, whilst the sample numbers were insufficient in
the hydroponic experiments for statistically meaningful conclusions to be made for survival
results, statistically meaningful differences were identified for root and shoot growth,
supporting the alternative hypothesis (H1). The use of heat shock as a source of abiotic stress
allowed sample numbers to be increased, with the result that clearer conclusions could be
drawn. The abiotic stress tests used in this study provided results consistent with those obtained
for Arabidopsis, (supporting the alternative hypothesis, H1), with SLN1 GoF mutants conferring
increased survival to abiotic stress, and LoF mutants showing decreased survival to abiotic stress
compared to the wild-type genotype. Achard et al. (2006) reported that DELLA-mediated growth
inhibition was lacking in the DELLA LoF mutant (quadruple-DELLA) grown under salt conditions.
This trend was not observed in this study, with the growth of the barley SLN1 LoF mutants
(sln1c, sln1-1) generally showing reduced growth in response to salt and heat stress. The
reduced growth in the barley SLN1 LoF mutants is likely due to reduced growth resulting from
damage, perhaps as a consequence of the production of ROS, as suggested for Arabidopsis by

164
Achard et al. (2008). The effect of abiotic stress on the Arabidopsis quadruple-DELLA mutant
may be diminished by the remaining single functional DELLA (RGL3) since RGL3 has been
implicated in stress response (Alvey & Boulton, 20008). It would be interesting to determine
whether the ‘global’ DELLA mutant that lacks all five DELLAs responds differently from the
quadruple-DELLA mutant. However, overall the data presented in the current translational study
suggest that a common DELLA-mediated response to abiotic stress is conserved in dicots and
monocots.
Although the effect of SLN1 on plant phenotype, and in this study, on abiotic stress tolerance,
has been observed at the whole-plant level, the elucidation of SLN1 localisation and
accumulation remains an avenue of further investigation, which despite being an early aim of
this study, was not achieved due to the recalcitrance of the Sln1 gene to molecular techniques
(Chapter 3). Chandler et al. (2002) used immunoblotting to show that SLN1 accumulated in the
elongation zone of young 2nd leaves of barley, but no evidence for potential stabilisation of
protein or altered Sln1 expression during abiotic stress has been presented. To address this I
aimed to produce reporter constructs for SLN1 protein accumulation and for Sln1 gene
expression. However this was not achieved; the envisaged SLN1:GFP fusion protein construct
containing the Sln1 promoter and the nos terminator could not be completed. Despite
successful cloning of the Sln1 promoter, it was not possible to clone the SLN1 ORF downstream
of it (data not presented). Similarly, the Sln1 promoter::insert could not be cloned into the GUS
plant gene reporter vector (data not presented). Similar difficulties were experienced by Dr.
Nadia Al-Kaff (JIC, personal communication) during the production of an Rht:GFP construct for
the transformation of wheat, which ultimately had to be synthesized commercially and did not
produce plants expressing the fusion protein, and resulted in many lines showing recombination
of the transgene (personal communications, Dr. H. Jones, Rothamsted Research, Dr. A. Korolev,
JIC). Cereal DELLA GUS reporter constructs for gene expression studies can however be made as
Pearce et al. (2011) analysed Rht expression in transgenic wheat. The SLN1 antibody used by
Chandler et al., (2002) was no longer available (F. Gubler, personal communication) and
antibodies that would recognise the RHT or SLN1 proteins in plants could not be generated
during the lifetime of this project, despite the assistance of two collaborating groups (personal
communications, Dr. M. Boulton, JIC, S. Thomas, Rothamsted Research). Assessment of Sln1

165
transcript levels using qRT-PCR as part of the Triumph mutant characterisation during the
current study found that DELLA transcript levels were highest in growing leaf material (Section
3.4.3), which is consistent with the findings of Chandler et al. (2002) who found Sln1 mRNA to
be preferentially expressed in elongating regions of the leaf.
There were no mutant lines available in which the SLN1 protein was absent or expressed at low
levels. Given that the LoF mutants were capable of producing a truncated protein (and this
protein, in the case of the sln1c mutant, was extremely stable in planta) I decided to attempt to
produce transgenic barley lines in which Sln1 was silenced, or partially silenced. This was to give
me the opportunity to correlate the level of functional SLN1 protein with abiotic stress tolerance
and plant phenotype. Although transgenic barley lines containing the Sln1 RNAi construct were
obtained, none of them showed clearly stable silencing of Sln1 (Chapter 6). The low number of
transformants containing an intact construct suggests that silencing of the gene may be
detrimental to regeneration. I had envisaged this might be the case, and had designed a
construct that was intended to give “inefficient” silencing. It is commonly found that it is not
possible to obtain transgenic plants in which essential genes are silenced. For example, Liu &
Makaroff (2006) were unable to obtain Arabidopsis plants transformed with a CaMV 35S
promoter:AESP construct (AESP is necessary for embryo development), but were able to obtain
them if the construct was expressed from a meiosis-specific promoter. Further attempts to
decrease Sln1 expression should therefore be based on weaker or inducible promoters.
The integration of DELLA mutant alleles into agricultural populations fuelled the Green
Revolution, and as understanding of DELLA function increases, the potential benefits of further
integration remain high. Anti-lodging characteristics and stress tolerance are clearly beneficial to
agriculture, especially with the potential for climate change to increase the incidence of lodging.
Further consideration needs to be given to negative linkages that may exist between DELLA
genes and alleles encoding negative agricultural traits (e.g. reduced yield, increased disease
susceptibility). Further elucidation of the barley genome should facilitate rapid and thorough
haplotype analysis, whilst crop breeding programs seek to eliminate any possible negative
linkages associated with DELLA genes. There remains an important trade-off between abiotic
stress tolerance and reduced growth that must be considered when using DELLA mutants in an
agricultural context. Thousand grain weight (TGW) appeared reduced in the DELLA stabilising

166
mutants (cv Himalaya: sln1d, gse1a) compared to the wild-type, suggesting DELLA stability
results in diminished yield in barley. Whereas the integration of the Rht dwarfing genes (Rht-B1b
and Rht-D1b) have been reported to increase grain yield at the cost of stem biomass production,
Rht is present on each of the three homeologous pairs of chromosomes in wheat, so the wild-
type allele is still functional in dwarf and semi-dwarf mutant lines. This is not the case for barley,
where DELLA is expressed by Sln1 alone, with the introduction of the known dwarfing alleles
resulting in a severe dwarf phenotype, meaning the range of heights achievable using Rht
mutants of hexaploid wheat is not currently possible for barley. However, useful mutants may
be obtained by TILLING (Colbert et al., 2001) of the DELLA gene, or of genes in the GA
biosynthetic or degradation pathway, or potentially using transgenic approaches although this
may currently not be acceptable to consumers. Certainly my data suggest that modification of
the GA-DELLA pathway could be a feasible approach to increasing crop resistance to abiotic
stress provided mutants can be identified that do not have the negative association of extreme
reduction in plant height. An additional benefit of DELLA has recently been identified in biotic
stress tolerance, where barley and wheat GoF DELLA mutants generally conferred increased
resistance to necrotrophs and increased susceptibility to biotrophs compared to wild-type
plants (Saville, 2011). Many studies aimed at increasing plant stress tolerance (e.g. through the
overexpression of antioxidant components) can be detrimental to plant development and crop
yield (see Section 1.5.6.1) and it is clear that further work, employing molecular manipulation
and the identification of stress tolerant varieties is still required.
Nevertheless the data reported here, and the methodology established, provide a basis, and the
tools, for further work towards the production of cereals with abiotic stress tolerance as well as
providing additional characterised mutants to allow studies into the mechanism of that
tolerance. They will also allow investigation of the interconnectivity between the signalling
response pathways of which DELLA is an integrator via response to changes in GA levels.

167
Bibliography
Abrol, I.P., Yadav, J.S.P., Massoud, F. (1998) Salt affected soils and their management. Food and
Agricultural Organization of the United Nations (FAO), Soils Bulletin, 39.
Achard, P., Cheng, H., De Grauwe, L., Decat, J. Schoutteten, H., Moritz, T., Van Der Straeten, D.,
Peng, J., Harberd, N.P. (2006) Integration of plant responses to environmentally
activated phytohormonal signals. Science, 311, 91-94.
Achard, P., Genschik, P. (2008a) Releasing the brakes on plant growth: how GAs shutdown
DELLA proteins. Journal of Experimental Botany, 60, 1085-1092.
Achard, P., Gong, F., Cheminant, S., Alioua, M., Hedden, P., Genschik, P. (2008b) The cold-
inducible CBF1 factor-dependent signaling pathway modulates the accumulation of the
growth-repressing DELLA proteins via its effect on gibberellin metabolism. The Plant
Cell, 20, 2117-2129.
Achard, P., Gusti, A., Cheminant, S., Alioua, M., Dhondt, S., Coppens, F., Beemster, G.T.S.,
Genschik, P. (2009) Gibberellin signalling controls cell proliferation rate in Arabidopsis.
Current Biology, 19, 1-6.
Achard, P., Renou, J.P., Berthomé, R., Harberd, N.P., Genschik, P. (2008c) Plant DELLAs restrain
growth and promote survival of adversity by reducing the levels of reactive oxygen
species. Current Biology, 18, 656-660.
Achard, P., Vriezen, W.H., Van Der Straeten, D., Harberd, N.P. (2003) Ethylene regulates
Arabidopsis development via the modulation of DELLA protein growth repressor
function. The Plant Cell, 15, 2816-2825.
Achard, P., Herr, A., Baulcombe, D.C., Harberd, N.P. (2004) Modulation of floral development by
a gibberellins-regulated microRNA. Development, 131, 3357-3365.
Ahmad, P., Sarwat, M., Sharma, S. (2008) Reactive oxygen species, antioxidants and signalling in
Plants. The Journal of Plant Biology, 51, 167-173.
Ainsworth, E.A., Ort, D.R. (2010) How do we improve crop production in a warming world? Plant
Physiology, 154, 526-530.
Alfonso, M., Yruela, I., Almárcegui, S., Torrado, E., Pérez, M.A., Picorel, R. (2001) Unusual
tolerance to high temperatures in a new herbicide-resistant D1 mutant from Glycine
max (L.) Merr. cell cultures deficient in fatty acid desaturation. Planta, 212, 573-582.

168
Allen, R.D. (1995) Dissection of oxidative stress tolerance using transgenic plants. Plant
Physiology, 107, 1049-1054.
Alonso-Ramírez, A., Rodriguez, D., Reyes, D., Jiménez, J.A., Nicolás, G., López-Climent, M.,
Gómez-Cadenas, A., Nicolás, C. (2009) Evidence for a role of gibberellins in salicylic acid-
modulated early plant responses to abiotic stress in Arabidopsis seeds. Plant Physiology,
150, 1335-1344.
Altschul, S.F., Gish, W., Miller, W., Myers, E.W., Lipman, D.J. (1990) Basic local alignment search
tool. Journal of Molecular Biology, 215, 403-410.
Aoki, T., Kitano, H., N. Kameya, N., Nakamura, I. (2002) Accelerated shoot overgrowth of rice
mutant ao-1 is epistatic to gibberellins-sensitive and -insensitive dwarf mutants. Journal
of Plant Research, 3, 195-202.
Apel, K., Hirt, H. (2004) Reactive oxygen species: metabolism, oxidative stress, and signal
transduction. Annual Review of Plant Biology, 5, 373-399.
Appleford, N.E.J., Wilkinson, M.D., Ma, Q., Evans, D.J., Stone, M.C., Pearce, S.P., Powers, S.J.,
Thomas, S.G., Jones, H.D., Phillips, A.L., Hedden, P., Lenton, J.R. (2007) Decreased shoot
stature and grain α-amylase activity following ectopic expression of a gibberellin 2-
oxidase gene in transgenic wheat. Journal of Experimental Botany, 58, 3213-3226.
Apse, M.P., Aharon, G.S., Snedden, W.A., Blumwald, E. (1999) Salt tolerance conferred by
overexpression of a vacuolar Na+/H+ antiport in Arabidopsis. Science, 285, 1256-1258.
Asano, K., Takashi, T., Miura, K., Quian, Q., Kitano, H., Matsuoka, M., Ashikari, M. (2007) Genetic
and molecular analysis of utility of sd1 alleles in rice. Breeding Science, 57, 53-58.
Asano, K., Yamasaki, M., Takuno, S., Miura, K., Katagiri, S., Ito, T., Doi, K., Wu, J., Ebana, K.,
Matsumoto, T., Innan, H., Kitano, H., Ashikari, M., Matsuok, M. (2011) Artificial selection
for a green revolution gene during japonics rice domestication. Procedings of the
National Academy of Sciences of the United Stated of America, 108, 11034-11039.
Aus der Beek, T., Flörke, M., Lapola, D.M., Schaldach, R., Voβ, F., Teichert, E. (2010) Modelling
historical and current irrigation water demand on the continental scale: Europe.
Advances in Geosciences, 27, 79-85.
Azad, A.K., Sawa, Y., Ishikawa, T., Shibata, H. (2004) Phosphorylation of plasma membrane
aquaporin regulates dependent opening of tulip petals. Plant Cell Physiology, 45, 608-
617.

169
Bailey-Serres, J., Mittler, R. (2006) The roles of reactive oxygen species in plant cells. Plant
Physiology, 141, 311.
Baker, C.J., Berry, P.M., Spink, J.H., Sylvester-Bradley, R., Griffin, J.M., Scott, R.K., Clare, R.W.
(1998) A method for the assessment of the risk of wheat lodging. Journal of Theoretical
Biology, 194, 587-603.
Balota, M., Cristescu, S., Payne, W.A., Hekkert, S.t.L., Laarhoven, L.J.J., Harren, F.J.M. (2004)
Ethylene production of two wheat cultivars exoised to dessication, heat, and paraquat-
induced oxidation. Crop Science, 44, 812-818.
Bartlett, J.G., Alves, S.C., Smedley, M., Snape, J.W., Harwood, W.A. (2008) High-throughput
Agrobacterium-mediated barley transformation. Plant Methods, 4, 22.
Bassel, G.W., Mullen, R.T., Bewley, J.D. (2008) procera is a putative DELLA mutant in tomato
(Solanum lycopersicum): effects on the seed and vegetative plant. Journal of
Experimental Botany, 59, 585-593.
Baulcombe, D. (2004) RNA silencing in plants. Nature, 431, 356-363.
Biemelt, S., Tschiersch, H., Sonnewald, U. (2004) Impact of altered gibberellin metabolism on
biomass accumulation, lignin biosynthesis, and photosynthesis in transgenic tobacco
plants. Plant Physiology, 135, 254-265.
Blumwald, E., Aharon, G.S., Apse, M.P. (2000) Sodium transport in plant cells. Biochimica et
Biophysica Acta, 1465, 140-151.
Bohnert, H.J., Nelson, D.E., Jensen, R.G. (1995) Adaptations to environmental stresses. The Plant
Cell, 7, 1099-1111.
Bolle, C. (2004) The role of GRAS proteins in plant signal transduction and development. Planta,
218, 683-692.
Bolle, C., Koncz, C., Chua, N.H. (2000) PAT1, a new member of the GRAS family, is involved in
phytochrome A signal transduction. Genes & Development, 14, 1269-1278.
Bonham-Smith, P.C., Kapoor, M., Bewley, J.D. (1988) Exogenous application of abscisic acid or
triadimefon affects the recovery of Zea mays seedlings from heat shock. Physiologia
Plantarum, 73, 27-30.
Börner, A., Plaschke, J., Korzun, V., Worland, A.J. (1996) The relationship between the dwarfing
genes of wheat and rye. Euphytica, 89, 69-75.

170
Botella, M. A., Rosado, A., Bressan, R.A., Hasegawa, P.M. (2005) Plant adaptive response to
salinity stress. In: Plant Abiotic Stress. (Jenks, M.A., Hasegawa, P.M. eds.) Oxford, UK:
Blackwell Publishing, pp. 37-70.
Boyer, J.S. (1982) Plant productivity and environment. Science, 218, 443-448.
Burton, R. A., Shirley, N. J., King, B.J., Harvey, A.J., Fincher, G.B. (2004) The CesA gene family of
barley. Quantitative analysis of transcripts reveals two groups of co-expressed genes.
Plant Physiology, 134, 224-236.
Carrera, E., Bou, J., Garcia-Martinez, J.L., Prat, S. (2000) Changes in GA20-oxidase gene
expression strongly affect stem length, tuber induction and tuber yield of potato plants.
Plant Journal, 22, 247-256.
Cassani, E., Bertolini, E., Badone, F.C., Landoni, M., Gavina, D., Sirizzotti, A., Pilu, R. (2009)
Characterization of the first dominant dwarf maize mutant carrying a single amino acid
insertion in the VHYNP domain of the dwarf8 gene. Molecular Breeding, 24, 375-385.
Chandler, P.M., Harding, C.A., Ashton, A.R., Mulcair, M.D., Dixon, N.E., Mander, L.N. (2008)
Characterization of gibberellin receptor mutants of Barley (Hordeum vulgare L.).
Molecular Plant, 2, 285-294.
Chandler, P.M., Marion-Poll, A., Ellis, M., Gubler, F. (2002) Mutants at the Slender1 locus of
barley cv Himalaya. Molecular and physiological characterization. Plant Physiology, 129,
181-190.
Chang, C., Sommerfeldt, T.G., Entz, T. (1990) Soil chemistry after eleven annual applications of
cattle feedlot manure. Journal of Environmental Quality, 20, 475-480.
Chasan, R. (1995) GA biosynthesis: a glimpse at the genes. The Plant Cell, 7, 141-143.
Chaves, M.M., Maroco, J.P., Pereira, J.S. (2003) Understanding plant responses to drought –
from genes to the whole plant. Functional Plant Biology, 30, 239-264.
Chen, Z., Pottosin, I.I., Cuin, T.A., Fuglsang, A.T., Tester, M., Jha, D., Zepeda-Jazo, I., Zhou, M.,
Palmgren, M.G., Newman, I.A., Shabala, S. (2007) Environmental stress and adaptation
to stress. Plant Physiology, 145, 1714-1725.
Chinnusamy, V., Jagendorf, A., Zhu, J.K. (2005) Understanding and improving salt tolerance in
plants. Crop Science, 45, 437-448.

171
Chono, M., Honda, I., Zeniya, H., Yoneyama, K., Saisho, D., Takeda, K., Takatsuto, S., Hoshino, T.,
Watanabe, Y. (2003) A semidwarf phenotype of barley uzu results from a nucleotide
substitution in the gene encoding a putative brassinosteroid receptor. Plant Physiology,
133, 1209-1219.
Christensen, J.H., Hewitson, B., Busuioc, A., Chen, A., Gao, X., Held, I., Jones, R., Kolli, R.K., Kwon,
W.T., Laprise, R., Magaña Rueda, V., Mearns, L., Menéndez, C.G., Räisänen, J., Rinke, A.,
Sarr, A., Whetton, P. (2007) Regional climate projections. In: Climate Change 2007: The
Physical Science Basis. Contribution of Working Group I to the Fourth Assessment Report
of the Intergovernemntal Panel on Climate Change. (Solomon, S., Qin, D., Manning, M.,
Chen, Z., Marquis, M., Averyt, K.B., Tignor, M., Miller, H.L. eds.) Cambridge, UK:
Cambridge University Press, pp. 996.
Colbert, T., Till, B.J., Tompa, R., Reynolds, S., Steine, M.N., Yeung, A.T., McCallum, C.M., Comai,
L., Henikoff, S. (2001) High-throughput screening for induced point mutations. Plant
Physiology, 126, 480-484.
Coles, J.P., Phillips, A.L., Croker, S.J., García-Lepe, R., Lewis, M.J., Hedden, P. (1999) Modification
of gibberellin production and plant development in Arabidopsis by sense and antisense
expression of gibberellins 20-oxidase genes. Plant Journal, 17, 547-556.
Comadran, J., Ramsay, L., MacKenzie, P., Hayes, T., Close, J., Muehlbauer, G., Stein, N., Waugh,
R. (2011) Patterns of polymorphism and linkage disequilibrium in cultivated barley.
Theoretical Applied Genetics, 122, 523-531.
Conklin, P.L., Williams, E.H., Last, R.L. (1996) Environmental stress sensitivity of an ascorbic acid-
deficient Arabidopsis mutant. Proceedings of the National Academy of Sciences, 93,
9970-9974.
Cosgrove, D.J., Hedrich, R. (1991) Stretch-activated chloride, potassium, and calcium channels
coexisting in plasma membranes of guard cells of Vicia faba L. Planta, 186, 143-153.
Creissen, G., Firmin, J., Fryer, M., Kular, B., Leyland, N., Reynolds, H. Pastori, G, Wellburn, F.,
Baker, N., Wellburn, A., Mullineaux, P. (1999) Elevated glutathione biosynthetic capacity
in the chloroplasts of transgenic tobacco plants paradoxically caused increased oxidative
stress. The Plant Cell, 11, 1277-1291.
Cushman, J., Bohnert, H.J. (2000) Genomic approaches to plant stress tolerance. Current Opinion
in Plant Biology, 3, 117-124.

172
Davidson, S.E., Swain, S.M., Reid, J.B. (2005) Regulation of the early GA biosynthesis pathway in
pea. Planta, 222, 1010-1019.
Davison, P.A., Hunter, C.N., Horton, P. (2002) Overexpression of β-carotene hydroxylase
enhances stress tolerance in Arabidopsis. Nature, 418, 203-206.
Dayan, J., Schwarzkopf, M., Avni, A., Aloni, R. (2010) Enhancing plant growth and fiber
production by silencing GA 2-oxidase. Plant Biotechnology Journal, 8, 425-35.
De Lucas, M., Daviere, J.M., Roriguez-Falcon, M., Pontin, M., Iglesias-Pedraz, J.M., Lorrain, S.,
Fankhauser, C., Blazquez, M.A., Titarenko, E., Prat, S. (2008) A molecular framework for
light and gibberellin control of cell elongation. Nature, 451, 480-486.
Di Laurenzio, L., Wysocka-Diller, J., Malamy, J.E., Pysh, L., Helariutta, Y., Freshour, G., Hahn,
M.G., Feldmann, K.A., Benfey, P.N. (1996) The SCARECROW gene regulated an
asymmetric cell division that is essential for generating the radial organization of the
Arabidopsis root. Cell, 86, 423-433.
Dieffenbach, C.W., Lowe, T.M., Dveksler, G.S. (1993) General concepts for PCR primer design.
Genome Research, 3, 30-37.
Dill, A., Sun, T. (2001) Synergistic derepression of gibberellin signalling by removing RGA and GAI
function in Arabidopsis thaliana. Genetics, 159, 777-785.
Dill, A., Thomas, S.G., Hu, J., Steber, C.M., Sun, T.P. (2004) The Arabidopsis F-box protein
SLEEPY1 targets gibberellins signalling repressors for gibberellins-induced degradation.
The Plant Cell, 16, 1392-1405.
Dugardeyn, J., Vandenbussche, F., van der Straaten, D. (2008) To grow or not to grow: what we
can learn on ethylene-gibberellin cross-talk in silico gene expression analysis. Journal of
Experimental Botany, 59, 1-16.
Dunford, R.P., Griffiths, S., Christodoulou, V., Laurie, D.A. (2005) Characterisation of a barley
(Hordeum vulgare L.) homologue of the Arabidopsis flowering time regulator GIGANTEA.
Theoretical and Applied Genetics, 110, 925-931.
Dunwell, J.M. (2000) Transgenic approaches to crop improvement. Journal of Experimental
Botany, 51, 487-496.
Eamens, A., Wang, M.B., Smith, N.A., Waterhouse, P.M. (2008) RNA silencing in plants:
yesterday, today and tomorrow. Plant Physiology, 147, 456-468.
Eckardt, N.A. (2002) Foolish seedlings and DELLA regulators: the function of rice SLR1 and
Arabidopsis RGL1 in GA signal transduction. The Plant Cell, 14, 1-5.

173
Eckardt, N.A. (2007) GA perception and signal transduction: molecular interactions of the GA
receptor GID1 with GA and the DELLA protein SLR1 in rice. Plant Cell, 19, 2095-2097.
Edwards, K., Johnstone, C., Thompson, C. (1991) A simple and rapid method for the preparation
of plant genomic DNA for PCR analysis. Nucleic Acids Research, 19, 1349.
El-Sharkawy, H. (1989) A review of genetic advances on breeding salt tolerant crops. Option
Méditerranéennes, 1, 183-190.
Ellenberger, T.E., Brandl, C.J., Struhl, K., Harrison, S.C. (1992) The GCN4 basic region leucine
zipper binds DNA as a dimer of uninterrupted α helices: crystal structure of the protein-
DNA complex. Cell, 71, 1223-1237.
Ellouzi, H., Ben Hamed, K., Cela, J., Munné-Bosch, S., Abdelly, C. (2011) Early effects of salt stress
on the physiological and oxidative status of Cakile maritima (halophyte) and Arabidopsis
thaliana (glycophyte). Physiologia Plantarum, 142, 128-143.
Engstrom, E.M. (2011) Phylogenetic analysis of GRAS proteins from moss, lycophyte and
vascular plant lineages reveals that GRAS genes arose and underwent substantial
diversification in the ancestral lineage common to bryophytes and vascular plants. Plant
Signalling & Behaviour, 6, 1-5.
Ericsson, K., Nilsson, L.J. (2006) Assessment of the potential biomass supply in Europe using a
resource-focused approach. Biomass and Bioenergy, 30, 1-15.
Eriksson, M.E., Israelsson, M., Olsson, O., Moritz, T. (2000) Increased gibberellin biosynthesis in
transgenic trees promotes growth, biomass production and xylem fibre length. Nature
Biotechnology, 18, 784-788.
Essemine, J., Ammar, S., Bouzid, S. (2010) Impact of heat stress on germination and growth in
higher plants: physiological, biochemical and molecular repercussions and mechanisms
of defence. Journal of Biological Science, 10, 565-572.
Falk, D.E. (1994) New dominant dwarfing gene (Dwf2) in barley. Barley Genetics Newsletter, 24,
87-89.
Feng, S.H., Martinez, C., Gusamaroli, G., Wang, Y., Zhou, J.L., Wang, F., Chen, L.Y., Yu, L., Iglesias-
Pedraz, J.M., Kircher, S., Schafer, E., Fu, X.D., Fan, L.M., Deng, X.W. (2008) Coordinated
regulation of Arabidopsis thaliana development by light and gibberellins. Nature, 451,
475-479.

174
Ferris, R., Ellis, R.H., Wheeler, T.R., Hadley, P. (1998) Effect of high temperature stress at
anthesis on grain yield and biomass of field-grown crown crops of wheat. Annals of
Botany, 82, 631-639.
Flintham, J.E., Börner, A., Worland, A.J., Gale, M.D. (1997) Optimizing wheat grain yield: effects
of Rht (gibberellin-insensitive) dwarfing genes. The Journal of Agricultural Science, 128,
11-25.
Flowers, T.J. (2004) Improving crop salt tolerance. Journal of Experimental Botany, 55, 307-319.
Flowers, T.J., Colmer, T.D. (2008) Salinity tolerance in halophytes. New Phytologist, 179, 945-
963.
Foster, C.A. (1977) Slender: an accelerated extension growth mutant of barley. Barley Genetics
Newsletter, 7, 24-27.
Frackman, S., Kobs, G., Simpson, D., Storts, D. (1998) Betaine and DMSO: enhancing agents for
PCR. Promega Notes, 65, 27.
Fridovich, I. (1986) Biological effects of the superoxide radical. Archives of Biochemistry and
Biophysics, 247, 1-11.
Fu, X., Harberd, N.P. (2003) Auxin promotes Arabidopsis root growth by modulating gibberellin
response. Nature, 421, 740-743.
Fu, X., Richards, D.E., Ait-ali, T., Hynes, L.W., Ougham, H., Peng, J., Harberd, N.P. (2002)
Gibberellin-mediated proteasome-dependent degradation of the barley DELLA protein
Slender1 repressor. The Plant Cell, 14, 3191-3200.
Fu, X., Sudhakar, D., Peng, J., Richards, D.E., Christou, P., Harberd, N.P. (2001) Expression of
Arabidopsis GAI in transgenic rice represses multiple gibberellin responses. The Plant
Cell, 12, 1791-1802.
Fuchs, M., Gonsalves, D. (2007) Safety of virus-resistant transgenic plants two decades after
their introduction: Lessons from realistic field risk assessment studies. Annual Review of
Plant Pathology, 45, 173-202.
Fujimori, S., Washio, T., Tomita, M. (2005) GC-compositional strand bias around transcription
start sites in plants and fungi. BMC Genomics, 6, 26.
Fussel, L.K., Pearson, C.J., Norman, M.J.T (1980) Effect of temperature during various growth
stages on grain development and yield of Pennisetum americanum. Journal of
Experimental Botany, 31, 621-633.
175
Gale, M. (2003) Application of Molecular Biology and Genomics to Genetic Enhancement of Crop
Tolerance to Abiotic Stress – A Discussion Document. Consultative group on
international agricultural research interim science council. Secretariat food and
agriculture organization of the united nations.
Gallego-Bartolome, J., Alabadi, D., Blazquez, M.A. (2011) DELLA-induces early transcriptional
changes during etiolated development in Arabidopsis thaliana. Public Library of Science,
6, 23918.
Gallego-Bartolome, J., Minguet, E.G., Marin, J.A., Prat, S., Blazquez, M.A., Alabadi, D. (2010)
Transcriptional diversification and functional conservation between DELLA proteins in
Arabidopsis. Molecular Biology and Evolution, 27, 1247-1256.
Garfinkel, M., Nester, E.W. (1980) Agrobacterium tumefaciens mutants affected in crown gall
tumorigenesis and octopine catabolism. The Journal of Bacteriology, 144, 732-743.
Garg, A.K., Kim, J.K, Owens, T.G., Ranwala, A.P., Choi, Y.D., Kochian, L.V., Wu, R.J. (2002)
Trehalose accumulation in rice plants confers high tolerance levels to different abiotic
stresses. Procedings of the National Academy of Sciences of the United States of
America, 99, 15898-15903.
Glenn, E.P., Brown, J.J. (1999) Salt tolerance and crop potential of halophytes. Critical Reviews in
Plant Sciences, 18, 227-255.
Gollin, D. (2006) Impacts of international research on intertemporal yield stability in wheat and
maize: an economic assessment. Mexico, D.F.: CIMMYT.
Gomi, K., Sasaki, A., Itoh, H., Ueguchi-Tanaka, M., Ashikari, M., Kitano, H., Matsuoka, M. (2004)
GID2, an F-box subunit of the SCF E3 complex, specifically interacts with phosphorylated
SLR1 protein and regulates the gibberellin-dependent degradation of SLR1 in rice. The
Plant Journal, 37, 626-634.
Gong, M., Li, Y.J., Chen, S.Z. (1998) Abscisic acid induced thermotolerance in maize seedlings is
mediated by Ca2+ and associated with antioxidant systems. Journal of Plant Physiology,
153, 488-496.
Gou, J., Strauss, S.H., Tsai, C.J., Fang, K., Chen, Y., Jiang, X., Busov, V.B. (2010) Gibberellins
regulate lateral root formation in Populus through interactions with auxin and other
hormones. The Plant Cell, 22, 623-639.
Grene, R. (2002) Oxidative stress and acclimation mechanisms in plants. The Arabidopsis Book.

176
Griffiths, J., Murase, K., Rieu, I. Zentella, R., Zhang, Z.L, Powers, S.J., Gong, F., Phillips, A.L.,
Hedden, P., Sun, T.P. Thomas, S.G. (2006) Genetic characterisation and functional
analysis of the GID1 receptors in Arabidopsis. The Plant Cell, 18, 3399-3414.
Hall, A.E. (2001) Crop Responses to Environment. (Hall, A.E. ed) Boca Raton, FL: CRC Press LLC.
Hanahan, D. (1983) Studies on transformation of Escherichia coli with plasmids. Journal of
Molecular Biology, 166, 557-580.
Harberd, N.P., Freeling, M. (1989) Genetics of dominant gibberellin-insensitive dwarfism in
maize. Genetics, 121, 827-838.
Harberd, N.P. (2003) Botany: relieving DELLA restraint. Science, 299, 1853-1854.
Harwood, W.A., Bartlett, J.G., Alves, S.C., Perry, M., Smedley, M.A, Leyland, N., Snape, J.W.
(2008) Barley transformation using Agrobacterium-mediated techniques. In: Methods in
Molecular Biology, Transgenic Wheat, Barley and Oats. (Jones, H.D., Shewry, P.R. eds.)
New York, NY: Humana Press, pp. 55.
Hattori, Y., Nagai, K., Furukawa, S., Song, X.J., Kawano, R., Sakakibara, H., Wu, J., Matsumoto, T.,
Yoshimura, A., Kitano, H., Matsuoka, M., Mori, H., Ashikari, M. (2009) The ethylene
response factors SNORKEL1 and SNORKEL2 allow rice to adapt to deep water. Nature,
460, 1026-1030.
Hayashi, H., Alia, Mustardy, L., Deshnium, P., Ida, M., Murata, N, (1997) Transformation of
Arabidopsis thaliana with the codA gene for choline oxidase; accumulation of
glycinebetaine and enhanced tolerance to salt and cold stress. Plant Journal, 12, 133-
142.
Hays, D.B., Do, J.H., Mason, R.E., Morgan, G., Finlayson, S.A. (2007) Heat stress induced ethylene
production in developing wheat grains induces kernel abortion and increased
maturation in a susceptible cultivar. Plant Science, 172, 1113-1123.
Hedden, P. (2003) The genes of the green revolution. Trends in Genetics, 19, 5-9.
Hedden, P., Phillips, A.L. (2000) Gibberellin metabolism: new insights revealed by the gene.
Trends in Plant Science, 5, 523-530.
Hedden, P., Phinney, B.O. (1979) Comparison of ent-kaurene and ent-isokaurene synthesis in
cell-free systems from etiolated shoots of normal and dwarf-5 maize seedlings.
Phytochemistry, 18, 1475-1479.
Heery, D.M., Kalkhoven, E., Hoare, S., Parker, M.G. (1997) A signature motif in transcriptional co-
activators mediates binding to nuclear receptors. Nature, 387, 733-736.
177
Helariutta, Y., Fukaki, H., Wysocka-Diller, J., Nakajima, K., Jung, J., Sena, G., Hauser, M.T.,
Benfrey, P.N. (2000) The SHORT-ROOT gene controls radial patterning of the Arabidopsis
root through radial signalling. Cell, 101, 555-567.
Hellens, R.P., Edwards, E.A., Leyland, N.R., Bean, S., Mullineaux, P.M. (2000) pGreen: a versatile
and flexible binary Ti vector for Agrobacterium-mediated plant transformation. Plant
Molecular Biology, 42, 819-832.
Helliwell, C.A., Waterhouse, P.M. (2005) Constructs and methods for hairpin RNA-mediated
gene silencing in plants. Methods in Enzymology, 392, 24-35.
Hillel, D. (1998) Environmental Soil Physics. (Hillel, D. ed.) London, UK: Academic Press.
Hirano, K., Asano, K., Tsuji, H., Kawamura, M., Mori, H., Kitano, H., Ueguchi-Tanaka, M.,
Matsuoka, M. (2010) Characterization of the molecular mechanism underlying
gibberellin perception complex formation in rice. The Plant Cell, 22, 2680-2696.
Hirsch, S., Oldroyd, G.E.D. (2009) GRAS-domain transcription factors that regulate plant
development. Plant Signal Behaviour, 8, 698-700.
Hisamatsu, T., King, R.W., Helliwell, C.A., Koshioka, M. (2005) The involvement of Gibberellin 20-
oxidase genes in phytochrome-regulated petiole elongation of Arabidopsis. American
Society of Plant Biologists, 138, 1106-1116.
Hoagland, D.R., Arnon, D.I. (1950) The water-culture method for growing plants without soil.
California Agricultural Experiment Station Circular, 347.
Hooley, R. (1994) Gibberellins: perception, transduction and responses. Plant Molecular Biology,
26, 1529-1555.
Horváth, I., Glatz, A., Varvasovszki, V., Török, Z., Páli, T., Balogh, G., Kovács, E., Nádasdi, L.,
Benkö, S., Joó, F., Vigh, L. (1998) Membrane physical state controls the signalling
mechanism of the heat shock response in Synechocystus PCC 6803: identification of
hsp17 as a “fluidity gene”. Proceedings of the National Academy of Sciences of the
United States of America, 95, 3513-3518.
Huijser, P., Schmid, M. (2011) The control of developmental phase transitions in plants.
Development, 138, 4117-4129.
Hugly, S., Kunst, L., Browse, J., Somerville, C. (1989) Enhanced thermal tolerance of
photosynthesis and altered chloroplast ultrastructure in a mutant of Arabidopsis
deficient in lipid desaturation. Plant Physiology, 90, 1134-1142.

178
Hussain, A., Cao, D., Cheng, H., Wen, Z., Peng, J. (2005) Identification of the conserved
serine/threonine residues important for gibberellin-sensitivity of Arabidopsis RGL2
protein. The Plant Journal, 44, 88-99.
Ikeda, A., Ueguchi-Tanaka, M., Sonoda, Y., Kitano, H., Koshioka, M., Futsuhara, Y., Matsuoka, M.,
Yamaguchi, J. (2001) Slender rice, a constitutive gibberellin response mutant, is caused
by a null mutation of the SLR1 gene, and ortholog of the height-regulating gene,
GAI/RGA/RHT/D8. The Plant Cell, 13, 999-1010.
Itoh, H., Shimada, A., Ueguchi-Tanaka, M., Kamiya, N., Hasegawa, Y., Ashikari, M., Matsuoka, M.
(2005) Overexpression of a GRAS protein lacking the DELLA domain confers altered
gibberellin responses in rice. Plant Journal, 44, 669-679.
Itoh, H., Ueguchi-Tanaka, M., Sato, Y., Ashikari, M., Matsuoka, M. (2002) The gibberellin
signalling pathway is regulated by the appearance and disappearance of SLENDER RICE1
in nuclei. The Plant Cell, 14, 57-70.
Jacobsen, S.E., Olszewski, N.E. (1991) Characterization of the arrest in anther development
associated with gibberellin deficiency of the gib-1 mutant of tomato. Plant Physiology,
97, 409-414.
Kader, A., Lindberg, S. (2010) Cytosolic calcium and pH signalling in plants under salinity stress.
Plant Signalling Behaviour, 5, 233-238.
Karim, A., Fracheboud, Y., Stamp, P. (1999) Photosynthetic activity of developing leaves of Zea
mays is less affected by heat stress than that of developed leaves. Physiologia
Plantarum, 105, 685-693.
Katiyar-Agarwal, S., Zhu, J., Kim, K., Agarwal, M., Fu, X., Huang, A., Zhu, J.K. (2006) The plasma
membrane Na+/H+ antiporter SOS1 interacts with RCD1 and functions in oxidative stress
tolerance in Arabidopsis. Proceedings of the National Academy of Sciences, 103, 18816-
18821.
Khan, S., Tariq, R., Yuanlai, C., Blackwell, J. (2006) Can irrigation be sustainable? Agricultural
Water Management, 80, 87-99.
Khodarahmpour, Z., Motamedi, M. (2011) Evaluation of drought and salinity stress effects on
germination and early growth of two cultivars of maize (Zea mays L.). African Journal of
Biotechnology, 10, 14868-14872.
Khush, G.S. (1999) Green revolution: preparing for the 21st century. Genome, 42, 646-655.
Khush, G.S. (2001) Green Revolution: the way forward. Nature Reviews Genetics, 2, 815-822.

179
Khush, G.S., Virk, S. (2002) Rice improvement: past, present, and future. In: Crop Improvement:
Challenges in the Twenty-First Century. (Kang, M.S. ed.) New York, NY: Food Products
Press, pp. 17-42.
Kim, J., Yoon, I., Lee, M. (2006) Effects of light on the feedback control of GA-20 oxidase gene
homolog in DongJinByeo seedlings. Journal of Environmental Biology, 27, 367-371.
Knight, H., Veale, E., Warren, G.J., Knight, M.R. (1999) The sfr6 mutation in Arabidopsis
suppresses low temperature induction of genes dependent on the CRT/DRE sequence
motif. The Plant Cell, 11, 875-886.
Knudsen, S. (1999) Promoter 2.0: for the recognition of PolII promoter sequences.
Bioinformatics, 15, 356-361.
Kobe, B., Kajava, A.V. (2001) The leucine-rich repeat as a protein recognition motif. Current
Opinion in Structural Biology, 11, 725-732.
Koini, M.A., Alvey, L., Allen, T., Tilley, C.A., Harberd, N.P. Whitelam, G.C., Franklin, K.A. (2009)
High temperature-mediated adaptations in plant architecture require the bHLH
transcription factor PIF4. Current Biology, 19, 408-413.
Koornneef, M., Elgersma, A., Hanhart, C.J., van Loenen-Martinet, E.P., van Rijn, L., Zeevaart,
J.A.D. (1985) A gibberellin insensitive mutant of Arabidopsis. Physiologia Plantarum, 65,
33-39.
Koornneef, M., Reuling, G., Karssen, C.M. (1984) The isolation and characterization of abscisic
acid-insensitive mutants of Arabidopsis thaliana. Physiologia Plantarum, 61, 377-383.
Kuppusamy, K.T., Walcher, C.L., Nemhauser, J.L. (2008) Cross-regulatory mechanisms in
hormone signalling. Plant Molecular Biology, 69, 375-381.
Landschulz, W.H., Johnson, P.F., McKnight, S.L. (1988) The leucine zipper: a hypothetical
structure common to a new class of DNA binding proteins. Science, 240, 1759-1763.
Lang-Pauluzzi, I. (2000) The behaviour of the plasma membrane during plasmolysis: a study by
UV microscopy. Journal of Microscopy, 198, 188-198.
Larkindale, J., Huang, B. (2005) Effects of abscisic acid, salicylic acid, ethylene and hydrogen
peroxide in thermotolerance and recovery for creeping bentgrass. Plant Growth
Regulation, 47, 17-28.
Larkindale, J., Knight M.R. (2002) Protection against heat stress induced oxidative damage in
Arabidopsis involves calcium, abscisic acid, ethylene, and salicylic acid. Plant Physiology,
128, 682-695.

180
Lashof, D.A., Ahuja, D.P. (1990) Relative contributions of greenhouse gas emissions to global
warming. Nature, 344, 529-531.
Lawson, E.C., Kaniewski, W., Haley, L., Rosman, R., Newell, C., Sanders, P., Turner, N. (1990)
Engineering resistance to mixed virus infection in a commercial potato cultivar:
resistance to potato virus X and potato virus Y in transgenic Russet Burbank.
Biotechnology Journal, 8, 127-134.
Lee, B.H., Zhu, J.K. (2010) Phenotypic analysis of Arabidopsis mutants: germination rate under
salt/hormone-induced stress. Cold Spring Harbour Protocols, 4, 4969.
Lee, M.H., Kim, B., Song, S.K., Heo, J.O., Yu, N.L, Lee, S.A., Kim, M., Kim, D.G., Sohn, S.O., Lim,
C.E., Chang, K.S., Lee, M.M., Lim, J. (2008) Large-scale analysis of the GRAS gene family
in Arabidopsis thaliana. Plant Molecular Biology, 67, 659-670.
Li, M., Li, Y., Li, H., Wu, G., Näsholm, T. (2011) Overexpression of AtNHX5 improves tolerance to
both salt and drought stress in Broussonetia papyrifera (L.) vent. Tree Physiology, 31,
349-357.
Lis, J.T. (1980) Fractionation of DNA fragments by polyethylene glycol induced precipitation.
Methods in Enzymology, 65, 347-353.
Liu, H.T., Liu, Y.Y., Pan, Q.H., Yang, H.R., Zhan, J.C., Huang, W.D. (2006) Novel interrelationship
between salicylic acid, abscisic acid, and PIP2-specific phospholipase C in heat
acclimation-induced thermotolerance in pea leaves. Journal of Experimental Botany, 57,
3337-3347.
Liu, C., Wang, J., Huang, T., Wang, F., Yuan, F., Cheng, X., Zhang, Y., Shi, S., Wu, J., Liu, K. (2010) A
missense mutation in the VHYNP motif of the DELLA protein causes a semi-dwarf
mutant phenotype in Brassica napus. Theoretical Applied Genetics, 121, 249-258.
Liu, Q., Kasuga, M., Sakuma, Y., Abe, H., Miura, S., Yamaguchi-Shinozaki, K., Shinozaki, K. (1998)
Two transcription factors, DREB1 and DRB2, with an EREBP/AP2 DNA binding domain
separate two cellular signal transduction pathways in drought- and low-temperature-
responsive gene expression, respectively, in Arabidopsis. The Plant Cell, 10, 1391-1406.
Liu, Z., Makaroff, C.A. (2006) Arabidopsis separase AESP is essential for embryo development
and the release of cohesion during meiosis. The Plant Cell, 18, 1213-1225.
Lopato, S., Langridge, P. (2011) Engineering stress tolerance in cereals using DREB/CBF genes:
outcomes and problems and perspectives. ISBN news report.
181
Lopez-Huertas, E., Charlton, W.L., Johnson, B., Graham, I.A., Baker, A. (2000) Stress induces
peroxisome biogenesis genes. The EMBO Journal, 19, 6770-6777.
Maestri, E., Klueva, N., Perrotta, C., Gulli, M., Nguyen, H.T., Marmiroli, N. (2002) Molecular
genetics of heat tolerance and heat shock proteins in cereals. Plant Molecular Biology,
48, 667-681.
Mahmood, K (2011) Salinity tolerance in barley (Hordeum vulgare L.) effects of varying NaCl,
K+/Na+ and NaHCO3 levels on cultivars differing in tolerance. Pakistan Journal of Botany,
43, 1651-1654.
Maniatis, T., Fritsch, E.F., Sambrook, J. (1982) Molecular Cloning: A Laboratory Manual.
(Sambrook, J. ed.) New York, NY: CSHL Press.
Martí, C., Orzáez, D., Ellul, P., Moreno, V., Carbonell, J., Granell, A. (2007) Silencing of DELLA
induced facultative parthenocarpy in tomato fruits. Plant Journal, 52, 865-876.
Martin, D.N., Proebsting, W.M., Parks, T.D., Dougherty, W.G., Lange, T., Lewis, M.J., Gaskin, P.,
Hedden, P. (1996) Feed-back regulation of gibberellin biosynthesis and gene expression
in Pisum sativum L., Planta, 200, 159-166.
Mäser, P., Gierth, M., Schroeder, J.I. (2002) Molecular mechanisms of potassium and sodium
uptake in plants. Plant and Soil, 247, 43-54.
McGinnis, K.M., Chandler, V., Cone, K., Kaeppler, H., Kaeppler, S., Kerschen, A., Pikaard, C.,
Richards, E., Sidorenko, L., Smith, T., Springer, N., Wulan, T. (2005) Transgene-induced
RNA interference as a tool for plant functional genomics. Methods in Enzymology, 392,
1-24.
McGinnis, K.M., Thomas, S.G., Soule, F.D., Strader, L.C., Zale, J.M., Sun, T.P., Steber, C.M. (2003)
The Arabidopsis SLEEPY1 gene encodes a putative F-box subunit of an SCF E3 ubiquitin
ligase. The Plant Cell, 15, 1120-1130.
Milnes, E., Renard, P. (2004) The problems of salt recycling and seawater intrusion in coastal
irrigated plains: an example from the kiti aquifer (southern Cyprus). Journal of
Hydrology, 288, 327-343.
Mittler, R. (2002) Oxidative stress, antioxidants and stress tolerance. Trends in Plant Science, 7,
405-410.

182
Moon, H., Lee, B., Choi, G., Shin, D., Prasad, T. (2003) NDP kinase 2 interacts with two oxidative
stress-activated MAPKs to regulate cellular redox state and enhances multiple stress
tolerance in transgenic plants. Proceedings of the National Academy of Sciences, 100,
358-363.
Moore, P.D (2008) Tundra. (Moore, P.D. ed.) New York, NY: Infobase Publishing.
Morran, S., Eini, O., Pyvovarenko, T., Parent, B., Singh, R., Ismagul, A., Eliby, S., Shirley, N.,
Langridge, P., Lopato, S. (2011) Improvement of salt stress tolerance of wheat and
barley modulation of expression of DREB/CBF factors. Plant Biotechnology Journal, 9,
230-249.
Muangprom, A., Thomas, S.G., Sun, T.P., Osborn, T.C. (2005) A novel dwarfing mutation in a
green revolution gene from Brassica rapa. Plant Physiology, 137, 931-938.
Mullineaux, P.M., Karpinski, S., Baker, N.R. (2006) Spatial dependence for hydrogen peroxide-
directed signalling in light-stressed plants. Plant Physiology, 141, 346-350.
Munns, R. (2002) Comparative physiology of salt and water stress. Plant, Cell and Environment,
25, 239-250.
Munns, R., James, R.A., Lauchli, A. (2006) Approaches to increasing the salt tolerance of wheat
and other cereals. Journal of Experimental Botany, 57, 1025-1043.
Murakami, Y., Tsuyama, M., Kobayashi, Y., Kodama, H., Iba, K. (2000) Trienoic fatty acids and
plant tolerance of high temperature. Science, 287, 476-479.
Murashige, T., Skoog, F. (1962) A revised medium for rapid growth and bioassays with tobacco
tissue cultures. Physiologia plantarum, 15, 473-497.
Murata, N., Los, D.A. (1997) Membrane fluidity and temperature perception. Plant Physiology,
115, 875-879.
Niu, X., Bressan, R.A., Hasegawa, P.M., Pardo, J.M. (1995) Ion homeostasis in NaCl stress
environments. Plant Physiology, 109, 735-774.
Noctor, G., Foyer, C.H. (1998) Ascorbate and glutathione: keeping active oxygen under control.
Annual Review of Plant Physiology and Plant Molecular Biology, 49, 249-279.
O’Neill, D.P., Davidson, S.E., Clarke, V.C., Yamauchi, Y., Kamiya, Y., Reid, J.B., Ross, J.J. (2010)
Regulation of the gibberellin pathway by auxin and DELLA proteins. Planta, 232, 1141-
1149.

183
Oh, E., Yamaguchi, S., Kmaiya, Y., Bae, G., Chung, W.I., Choi, G. (2006) Light activates the
degradation of PIL5 protein to promote seed germination through gibberellin in
Arabidopsis. The Plant Journal, 47, 124-139.
Oh, D.H., Lee, S.Y., Bressan, R.A., Yun, D.J., Bohnert, H.J. (2010) Intracellular consequences of
SOS1 deficiency during salt stress. Journal of Experimental Botany, 61, 1205-1213.
Olszewski, N., Sun, T.P., Gubler, F. (2002) Gibberellin signalling: biosynthesis, catabolism, and
response pathways. Plant Cell, 14, 61-80.
Orton, T.J. (1980) Chromosomal variability in tissue cultures and regenerated plants of
Hordeum. Theoretical and Applied Genetics, 56, 101-112.
Pasternak, D. (1987) Salt tolerance and crop production – a comprehensive approach. Annual
Review of Phytopathology, 25, 271-291.
Patel, D., Franklin, K.A. (2009) Temperature-regulation of plant architecture. Plant Signaling
Behaviour, 4, 577-579.
Pearce, S., Saville, R., Vaughan, S.P., Chandler, P.M., Wilhelm, E.P., Sparks, C.A., Korolev. A., Al-
Kaff, N., Boulton, M.I., Phillips, A.L., Hedden, P., Nicholson, P., Thomas, S.G. (2011)
Molecular characterisation of Rht-1 dwarfing genes in hexaploid wheat (Triticum
aestivum). Plant Physiology, 157, 1820-1831.
Penfield, S. (2008) Temperature perception and signal transduction in plants. New Phytologist,
179, 615-628.
Peng, J., Carol, P., Richards, D.E., King, K.E., Cowling, R.J., Murphy, G.P., Harberd, N.P. (1997) The
Arabidopsis GAI gene defines a signaling pathway that negatively regulates gibberellin
responses. Genes & Development, 11, 3194-3205.
Peng, J., Richards, D.E., Hartley, N.M., Murphy, G.P., Devos, K.M., Flintham, J.E., Beales, J., Fish,
L.J., Worland, A.J., Pelica, F., Sudhakar, D., Christou, P., Snape, J.W., Gale, M.D, Harberd,
N.P. (1999) ‘Green revolution’ genes encode mutant gibberellin response modulators.
Nature, 400, 256-61.
Pfaffl M.W. (2001) A new mathematical model for relative quantification in real-time RT-
PCR. Nucleic Acids Research, 29, 45.
Pimenta Lange, M.J., Lange, T. (2006) Gibberellin biosynthesis and the regulation of plant
development. Plant Biology, 8, 281-290.

184
Plieth, C., Ulf-Peter, H., Knight, H., Knight, M.R. (1999) Temperature sensing by plants: the
primary characteristics of signal perception and calcium response. The Plant Journal, 18,
491-497.
Pysh, L.D., Wysocka-Diller, J.W., Camilleri, C., Bouchez, D., Benfey, P.N. (1999) The GRAS gene
family in Arabidopsis: sequence characterization and basic expression analysis of the
SCARECROW-LIKE genes. The Plant Journal, 18, 111-119.
Qi, Y., Hannon, G.J. (2005) Uncovering RNAi mechanisms in plants: biochemistry enters the
foray. FEBS Letters, 579, 5899-5903.
Qin, D.Z., Li, X., Zhou, C., Sun, Q. (2008) Heat stress-responsive transcriptome analysis in heat
susceptible and tolerant wheat (Triticum aestivum L.) by using wheat genome array.
BMC Genomics, 9, 432.
Rengasamy, P. (2006) World salinisation with emphasis on Australia. Journal of Experimental
Botany, 57, 1017-1023.
Richards, D.E., King, K.E., Ait-ali, T., Harberd, N.P. (2001) How gibberellin regulates plant growth
and development: a molecular genetic analysis of gibberellin signalling. Annual Review
of Plant Physiology and Plant Molecular Biology, 52, 67-88.
Richards, R.A. (2000) Selectable traits to increase crop photosynthesis and yield of grain crops.
Journal of Experimental Botany, 51, 447-458.
Robertson, A.J., Ishikawa, M., Gusta, L.V., MacKenzie, S.L. (1994) Abscisic acid induced heat
tolerance in Bromus inermis leyss cell-suspension cultures. Plant Physiology, 105, 181-
190.
Rodríguez-Navarro, A. (2000) Potassium transport in fungi and plants. Biochimica et Biophysica
Acta, 1469, 1-30.
Ross, J.J., O’Neill, D.P., Smith, J.J., Kerckhoffs, L.H.J., Elliot, R.C. (2000) Evidence that auxin
promotes gibberellin A1 biosynthesis in pea. Plant Journal, 21, 547-552.
Rostocks, N., Schmierer, D., Kudrna, D., Kleinhofs, A. (2003) Barley putative hypersensitive
induced reaction genes: genetic mapping, sequence analyses and differential expression
in disease lesion mimic mutants. Theoretical and Applied Genetics, 107, 1094-1101.
Rozen, S., Skaletsky, H.J. (2000) Primer3 on the WWW for general users and for biologist
programmers. In: Bioinformatics Methods and Protocols: Methods in Molecular Biology.
(Krawetz S, M. S. Ed.) Totowa; NJ: Humana Press, pp. 365-386.

185
Rutger, J.N. (2008) The induced SD1 mutant and other useful mutant genes in modern rice
varieties. Abstract, p.5 InL Book of Abstracts, FAO/IAEA International Symposium on
Induced Mutations in Plants 12-15 Aug., 2008, Vienna, Austria.
Sahi, C., Singh, A., Blumwald, E., Grover, A. (2006) Beyond osmolytes and transporters: novel
plant salt-stress tolerace-related genes from transcriptional profiling data. Physiologia
Plantarum, 127, 1-9.
Sakamoto, T., Mornaka, Y., Ishiyama, K., Kobayashi, M., Itoh, H., Kayano, T., Iwahori, S.,
Matsuoka, M., Tanaka, H. (2003) Genetic manipulation of gibberellin metabolism in
transgenic rice. Nature Biotechnology, 21, 909-913.
Salehi, H., Ransom, C.B., Oraby, H.F., Seddighi, Z., Sticklen, M.B. (2005) Delay in flowering and
increase in biomass of transgenic tobacco expressing the Arabidopsis floral repressor
gene FLOWERING LOCUS C. Journal of Plant Physiology, 162, 711-717.
Sambrook, J., Russell, D.W. (2001) Molecular cloning: a Laboratory manual. (Sambrook, J. ed.)
New York, NY: CSHL Press.
Sarkar, S., Perras, M.R., Falk, D.E., Zhang, R., Pharis, R.P., Austin, F.R. (2004) Relationship
between gibberellins, height, and stress tolerance in barley (Hordeum vulgare L.)
seedlings. Plant Growth Regulation, 42, 125-135.
Sarowar, S., Kim, E.N., Kim, Y.J., Ok, S.H., Kim, K.D., Hwang, B.K., Shin, J.S.H. (2005)
Overexpression of a pepper ascorbate peroxadise-like 1 gene in tobacco plants
enhances tolerance to oxidative stress and pathogens. Plant Science, 169, 55-63.
Sasaki, A., Ashikari, M., Ueguchi-Tanaka, M., Itoh, H., Nishimura, A., Swapan, D., Ishiyama, K.,
Saito, T., Kobayashi, M., Khush, G.S., Kitano, H., Matsuoka, M. (2002) Green revolution: a
mutant gibberellin-synthesis gene in rice. Nature, 416, 701-702.
Sasaki, A., Itoh, H., Gomi, K., Ueguchi-Tanaka, M., Ishiyama, K., Kobayashi, M., Jeong, D.H., An,
G., Kitano, H., Ashikari, M., Matsuoka, M. (2003) Accumulation of phosphorylated
repressor for gibberellin signalling in an F-box mutant. Science, 299, 1896-1898.
Sato, S., Kamiyama, M., Iwata, T., Makita, N., Furukawa, H., Ikeda, H. (2006) Moderate increase
of mean daily temperature adversely affects fruit set of Lycopersicon esculentum by
disrupting specific physiological processes in male reproductive development. Annals of
Botany, 97, 731-738.
Saville, R. (2011) PhD thesis: Understanding DELLA in Wheat Linking Genotype to Phenotype,
University of East Anglia.

186
Schumacher, K., Schmitt, T., Rossberg, M., Schmitz, C., Theres, K. (1999) The lateral suppressor
(Ls) gene of tomato encodes a new member of the VHIID protein family. Proceedings of
the National Academy of Sciences of the United States of America, 96, 290-295.
Schünmann, P.H.D., Harrison, J., Ougham, H.J. (1994) Slender barley, an extension growth
mutant. Journal of Experimental Botany, 45, 1753-1760.
Serrano, R. (1996) Salt tolerance in plants and microorganisms: toxicity targets and defense
responses. International Review of Cytology, 165, 1-52.
Shah, N.H., Paulsen, G.M. (2003) Interaction of drought and high temperature on
photosynthesis and grain-filling of wheat. Plant and Soil, 257, 219-226.
Sharma, A.D., Thakur, M., Rana, M., Singh, K. (2004) Effect of plant growth hormones and abiotic
stresses on germination, growth and phosphatase activities in Sorghum bicolor L.
Moench seeds. African Journal of Biotechnology, 6, 208-312.
Sharp, P.A. (2001) RNA interference-2001. Genes & Development, 15, 485-490.
Shi, H., Lee, B.H., Wu, S.J., Zhu, J.K. (2002a) Overexpression of a plasma membrane Na+/H+
antiporter gene improves salt tolerance in Arabidopsis thaliana. Nature Biotechnology,
21, 81-85.
Shi, H., Quintero, F.J., Pardo, J.M, Zhu, J.K. (2002b) The putative plasma membrane Na+/H+
antiporter SOS1 controls long-distance Na+ transport in plants. The Plant Cell, 14, 465-
477.
Silverstone, A.L., Ciampaglio, C.N., Sun, T.P. (1998) The Arabidopsis RGA gene encodes a
transcriptional regulator repressing the gibberellin signal transduction pathway. The
Plant Cell, 10, 155-169.
Silverstone, A.L., Jung, H.S., Dill, A., Kawaide, H., Kamiya, Y., Sun, T.P. (2001) Repressing a
repressor: gibberellin-induced rapid reduction of the RGA protein in Arabidopsis. The
Plant Cell, 13, 1555-1565.
Silverstone, A.L., Sun, T. (2000) Gibberellins and the green revolution. Trends in Plant Science, 5,
1-2.
Smirnoff, N. (2000) Ascorbic acid: metabolism and functions of a multifaceted molecule. Current
Opinion in Plant Biology, 3, 229-235.
Spray, C.R., Bernard, O., Gaskin, P., Gilmour, S.J., MacMillan, J. (1984) Internode length in Zea
mays L. Planta, 160, 1432-2048.

187
Spray, C.R., Kobayashi, M., Suzuki, Y., Phinney, B.O., Gaskin, P., MacMillan, J. (1996) The dwarf-
1(dt) mutant of Zea mays blocks three steps in the gibberellin-biosynthesic pathway.
Proceedings of the National Academy of Sciences of the United States of America, 93,
10515-10518.
Stöhr, C., Stremlau, S. (2006) Formation and possible roles of nitric oxide in plant roots. Journal
of Experiemental Botany, 57, 463-470.
Stuurman, J., Jaggi, F., Kuhlemeier, C. (2002) Shoot meristem maintenance is controlled by a
GRAS-gene mediated signal from differentiating cells. Genes & Development, 16, 2213-
2218.
Sun, T. (2010a) Gibberellin-GID1-DELLA: A pivotal regulatory module for plant growth and
development. Plant Physiology, 154, 567-570.
Sun, X., Jones, W.T., Harvey, D., Edwards, P.J.B., Pascal, S.M., Kirk, C., Cosidine, T., Sheerin, D.J.,
Rakonjac, J., Oldfield, C.J., Xue, B., Dunker, A.K., Uversky, V.N. (2010b) N-terminal
domains of DELLA proteins are intrinsically unstructured in the absence of interaction
with GID1/gibberellic acid receptors. The Journal of Biological Chemistry, 285, 11557-
11571.
Sung, D.Y., Kaplan, F., Lee, K.J., Guy, C.L. (2003) Acquired tolerance to temperature extremes.
Trends in Plant Science, 8, 179-187.
Taghipour, F., Salehi, M. (2008) The study of salt tolerance of Iranian barley (Hordeum vulgare
L.) genotypes in seedling growth stages. American-Eurasion Journal of Agriculture &
Environmental Science, 4, 525-529.
Tatarinova, T., Brover, V., Troukhan, M., Alexandrov, N. (2003) Skew in GC content near the
transcription start site in Arabidopsis thaliana. Bioinformatics, 19, 313-314.
Thomas, S.G.S., Sun, T.P. (2004) Update on gibberellin signalling. A tale of the tall and the short.
Plant Physiology, 135, 668-676.
Tian, C., Wan, P., Sun, S., Li, J., Chen, M. (2004) Genome-wide analysis of the GRAS gene family
in rice and Arabidopsis. Plant Molecular Biology, 54, 519-532.
Tingay, S., McElroy, D., Kalla, R., Fieg, S., Wang, M., Thornton, S., Brettel, R. (1997)
Agrobacterium tumefaciens-mediated barley transformation. Plant Journal, 11, 1369-
1376.
Tooke, F., Ordridge, M., Chiurugwi, T., Battey, N. (2005) Mechanisms and function of flower and
inflorescence reversion. Journal of Experimental Botany, 56, 2587-2599.
188
Travella, S., Klimm, T.E., Keller, B. (2006) RNA interference-based gene silencing as an efficient
tool for functional genomics in hexaploid bread wheat. Plant Physiology, 142, 6-20.
Tsugane, K., Kobayashi, K., Niwa, Y., Ohba, Y., Wada, K., Kobayashi, H. (1999) A recessive
Arabidopsis mutant that grows photoautotrophically under salt stress shows enhanced
active oxygen detoxification. The Plant Cell, 11, 1195-1206.
Tyerman, S.D., Bohnert, H.J., Maurel, C., Steudie, E., Smith, J.A.C. (1999) Plant aquaporins: their
molecular biology, biophysics and significance for plant water relations. Journal of
Experimental Botany, 50, 1055-1071.
Ueguchi-Tanaka, M., Ashikari, M., Nakajima, M., Itoh, H., Katoh, E., Kobayashi, M., Chow, T.Y.,
Hsing, Y.I.C., Kitano, H., Yamaguchi, I., Matsuoka, M. (2005) GIBBERELLIN INSENSITIVE
DWARF1 encodes a soluble receptor for gibberellin. Nature, 437, 693-698.
Ueguchi-Tanaka, M., Nakajima, M., Katoh, E., Ohmiya, H., Asano, K., Saji, S., Hongyu, X., Ashikari,
M., Kitano, H., Yamaguchi, I., Matsuoka, M. (2007a) Molecular interactions of a soluble
gibberellin receptor, GID1, with a rice DELLA protein, SLR1, and gibberellin. The Plant
Cell, 19, 2140-2155.
Ueguchi-Tanaka, M., Nakajima, M., Motoyuki, A., Matsuoka, M. (2007b) Gibberellin receptor
and its role in gibberellin signalling in plants. Annual Review of Plant Biology, 58, 183-
198.
Urao, T., Yakubov, B., Satoh, R., Yamaguchi-Shinozaki, K., Seki, M., Hirayama, T., Shinozaki, K.
(1999) A transmembrane hybrid-type histidine kinase in Arabidopsis functions as an
osmosensor. The Plant Cell, 11, 1743-1754.
Utset, A., Borroto, M. (2001) A modelling-GIS approach for assessing irrigation effects on soil
salinisation under global warming conditions. Agricultural Water Management, 50, 53-
63.
Van Breemen, N., Mulder, J., Driscoll, C.T. (1983) Acidification and alkalinization of soils. Plant
and Soil, 75, 283-308.
Van Der Straeten, D., Vandenbussche, F., De Grauwe, L., Dugardeyn, J., Hagenbeek, D. (2007)
Interactions with the ethylene pathway: a puzzle yet to be completed. Advances in Plant
Ethylene Research, 2, 61-68.
Vandesompele, J., De Preter, K., Pattyn, F., Poppe, B., Van Roy, N., De Paepe, A., Speleman, F.
(2002) Accurate normalization of real-time quantitative RT-PCR data by geometric
averaging of multiple control genes. Genome Biology, 3, 1-11.

189
Vettakkorumakankav, N.N., Falk, D., Sazena, P., Fletcher, R. (1999) A crucial role for gibberellins
in stress protection of plants. Plant Cell Physiology, 40, 542-548.
Vij, S., Tyagi, A. (2007) Emerging trends in the functional genomics of the abiotic stress response
in crop plants. Plant Biotechnology Journal, 5, 361-380.
Vinocur, B., Altman, A. (2005) Recent advances in engineering plant tolerance to abiotic stress:
achievements and limitations. Current Opinion in Biotechnology, 16, 123-132.
Wahid, A., Gelani, S., Ashraf, M., Foolad, M.R. (2007) Heat tolerance in plants: an overview.
Environmental and Experimental Botany, 61, 199-223.
Walbot, V. (2011) How plants cope with temperature stress. BMC Biology, 9, 79.
Wang, M.B., Abbot, D.C., Waterhouse, P.M. (2000) A single copy of a virus-derived transgene
encoding hairpin RNA gives immunity to barley yellow dwarf virus. Molecular Plant
Pathology, 1, 347-356.
Weiss, D., Ori, N. (2007) Mechanisms of cross talk between gibberellin and other hormones.
Plant Physiology, 144, 1240-1246.
Wen, C.K, Chang, C. (2002) Arabidopsis RGL1 encodes a negative regulator of gibberellin
responses. The Plant Cell, 14, 87-100.
Weston, D.E., Elliot, R.C., Lester, D.R., Rameau, C., Reid, J.B., Murfet, I.C., Ross, J.J. (2008) The
pea DELLA proteins LA and CRY are important regulators of gibberellin synthesis and
root growth. Plant Physiology, 147, 199-205.
Wigoda, N., Ben-Nissan, G., Granot, D., Schwartz, A., Weiss, D. (2006) The gibberellin-induced
cysteine-rich protein GIP2 from Petunia hybrid exhibits in planta antioxidant activity.
Plant Journal, 48, 796-805.
Willige, B.C., Ghosh, S., Nill, C., Zourelidou, M., Dohmann, E.M.N, Maier, A., Schwechheimer, C.
(2007) The DELLA domain GA INSENSITIVE mediates the interaction with the GA
INSENSITIVE DWARF1A gibberellin receptor of Arabidopsis. Plant Cell, 19, 1209-1220.
Winkler, R.G., Helentjaris, T. (1995) The maize Dwarf3 gene encodes a cytochrome P450-
mediated early step in gibberellin biosynthesis. The Plant Cell, 7, 1307-1317.
Witzel, K., Weidner, A., Surabhi, G.K, Börner, A., Mock, H.P. (2009) Salt stress-induced
alterations in the root proteome of barley genotypes with contrasting response towards
salinity. Journal of Experimental Botany, 60, 3545-3557.
World Health Organization (2005) Modern food biotechnology, human health and development:
an evidence-based study.

190
Wu, C. (1995) Heat shock transcription factors: structure and regulation. Annual Review of Cell
and Developmental Biology, 11, 441-469.
Wu, G., Wei, Z.K., Shao, H.B. (2007) The mutual responses of higher plants to environment:
physiological and microbiological aspects. Colloids and Surfaces B: Biointerfaces, 59,
113-119.
Wu., J., Kong, X., Wan, J., Liu, X., Zhang, X., Guo, X., Zhou, R., Zhao, G., Jing, R., Fu, X., Jia, J.
(2011) Dominant and pleiotropic effects of a GAI gene in wheat results from lack of
interaction between DELLA and GID1. Plant Physiology, 157, 2120-2130.
Xiong, L., Zhu, J.K. (2002) Salt Tolerance. The Arabidopsis Book.
Xu, Y.L., Li, L., Wu, K., Peeters, A.J.M., Gage, D.A., Zeevaart, J.A.D. (1995) The GA5 locus of
Arabidopsis thaliana encodes a multifunctional gibberellin 20-oxidase: molecular cloning
and functional expression. Proceedings of the National Academy of Sciences, 92, 6640-
6644.
Yamaguchi, S., Sun, T.P., Kawaide, H., Kamiya, Y. (1998) The GA2 locus of Arabidopsis thaliana
encodes ent-kaurene synthase of gibberellin biosynthesis. Plant Physiology, 116, 1271-
1278.
Yamauchi, Y., Ogawa, M., Kuwahara, A., Hanada, A., Kamiya, Y., Yamaguchi, S. (2004) Activation
of gibberellin biosynthesis and response pathways by low temperature during imbibition
of Arabidopsis thaliana seeds. The Plant Cell, 16, 367-378.
Yasumura, Y., Crumpton-Taylor, M., Fuentes, S., Harberd, N.P. (2007) Step-by-step acquisition of
the gibberellin-DELLA growth-regulatory mechanism during land-plant evolution.
Current Biology, 17, 1225-1230.
Yokoi, S., Quintero, F.J., Cubero, B., Ruiz, M.T., Bressan, R.A., Hasegawa, P.M., Pardo, J.M. (2002)
Differential expression and function of Arabidopsis thaliana NHX Na+/H+ antiporters in
the salt stress response. Plant Journal, 30, 529-539.
Zadoks, J.C., Chang, T.T., Konzak, C.F. (1974) A decimal code for the growth stages of cereals.
Weed Research, 14, 415-421.
Zentella, R., Zhang, Z.L., Park, M., Thomas, S.G., Endo, A., Murase, K., Fleet, C.M., Jikumaru, Y.,
Nambara, E., Kamiya, Y., Sun, T.P. (2007) Global analysis of DELLA direct targets in early
gibberellin signalling in Arabidopsis. The Plant Cell, 19, 3037-3057.
Zhao, F., Guo, S., Zhang, H., Zhao, Y. (2006) Expression of yeast SOD2 in transgenic rice results in
increased salt tolerance. Plant Science, 170, 216-224.

191
Zhu, J.K. (2000) Genetic analysis of plant salt tolerance using Arabidopsis. Plant Physiology, 124,
941-948.
Zhu, J.K. (2003) Regulation of ion homeostasis under salt stress. Current Opinion in Plant Biology,
6, 441-445.
Zhu, Y., Nomura, T., Xu, Y., Zhang, Y., Peng, Y., Mao, B., Hanada, A., Zhou, H., Wang, R., Peijin, L.,
Zhu, X., Mander, L.N., Kamiya, Y., Yamaguchi, S., He, Z. (2006) ELONGATED UPPERMOST
INTERNODE encode a cytochrome P450 monooxygenase that epoxidizes gibberellins in a
novel deactivation reaction in rice. The Plant Cell, 18, 442-456.
Zinn, K.E., Tunc-Ozdemir, M., Harper, J.F. (2010) Temperature stress and plant sexual
reproduction: uncovering the weakest links. Journal of Experimental Botany, 61, 1959-
1968.
Zuker, M., Mathews, D.H., Turner, D.H. (1999) Algorithms and thermodynamics for RNA
secondary structure prediction: a practical guide. In: RNA Biochemistry and
Biotechnology. (Barciszewski, J., Clark, B.F.C. eds.) Dorerecht, NL: Kluwer Academic
Publishers, pp. 11-43.

192
Appendix 1: Growth Media
1.1 Soil growth media
Barley Mix compost
375 L Levington M3 compost (Scotts professional)
100 L Perlite
200 L 4 mm grit
1.6 kg Osmocote Plus™
1.2 Hydroponic solution
Hoagland’s solution (Hoagland & Arnon, 1950)
Formula for 1 litre of (x 0.5) modified Hoagland’s medium
3 ml of 1 M potassium nitrate (KNO3)
2 ml of 1 M calcium nitrate (Ca(NO3)2)
0.5 ml of 1 M monoammonium phosphate (NH4H2PO4)
1 ml of 1 M magnesium sulphate (MgSO4)
0.5 ml of micronutrient solution (see below)
0.125 ml of iron chelate stock solution (see below)
sodium chloride added as required from a 5 M stock (JIC media supply)
Adjust to 1 litre using de-ionised water
Micronutrient stock solution
Formula for 1 litre
2.86 g boric acid (H3BO3)
1.81 g manganese chloride 4-hydrate (MnCl2.4H20)
0.22 g zinc sulphate 7-hydrate (ZnSO4.7H2O)
0.08 g copper sulphate 5-hydrate (ZnSO4.5H2O)
0.02 g molybdic acid (assaying 85% MoO3) (H2MoO4.H2O)
Adjust to 1 litre using de-ionised water

193
Iron chelate stock solution
Formula for 1 litre
In 286 ml de-ionised water:
26.1 g EDTA
19 g potassium hydroxide (KOH)
In 500 ml de-ionised water
24.9 g iron sulphate 7-hydrate (FeSO4.7H2O)
Slowly add iron sulphate solution to potassium EDTA solution, aerate
overnight with stirring. Adjusted to 1 litre using de-ionised water, and
stored at 4 °C
1.3 Transgenics media
Barley callus induction media (Bartlett et al., 2008)
Formula for 1 litre of medium
4.3 g Murashige & Skoog plant salt base (M0221, Melford Laboratories,
UK)
30 g maltose
1.0 g casein hydrolysate
350 mg myo-inositol
690 mg proline
1.0 mg thiamine HCl
2.5 mg dicamba
1.25 mg copper sulphate 5-hydrate (CuSO4.5H2O)
pH 5.8
3.5 g PhytagelTM
194
Barley transition media (Bartlett et al., 2008)
Formula for 1 litre of media
2.7 g Murashige & Skoog modified plant salt base (without NH4NO3)
20 g maltose
165 mg ammonium nitrate (NH4NO3)
1.25 mg copper sulphate 5-hydrate (CuSO4.5H2O)
750 mg glutamine
100 mg myo-inositol
0.4 mg thiamine HCl
2.5 mg 2,4D (2,4-Dichlorophenoxyacetic acid)
0.1 mg BAP
pH 5.8
3.5 g PhytagelTM
Barley regeneration media (Bartlett et al., 2008)
Formula for 1 litre of media
2.7 g Murashige & Skoog modified plant salt base (without NH4NO3)
20 g maltose
165 mg ammonium nitrate (NH4NO3)
750 mg glutamine
100 mg myo-inositol
0.4 mg thiamine HCl
pH 5.8
3.5 g PhytagelTM
195
1.4 Bacterial growth media
LB-G broth and agar
Formula for 1 litre of media
10 g tryptone
5 g yeast extract
10 g NaCl
pH 7.0
For solid medium (LB–G agar), 10 g Lam M No. 1 agar was added
MG/L medium (modified from Garfinkel & Nester, 1980)
5.0 g / L tryptone
5.0 g / L mannitol
2.5 g / L yeast extract
1.0 g / L glutamic acid
250 mg / L potassium phosphate monobasic (KH2PO4)
100 mg / L NaCl
100 mg / L magnesium sulphate 7-hydrate (MgSO4.7H2O)
10 µL biotin (0.1 mg / mL stock)
pH 7.0
SOC media
20 g Tryptone
5 g yeast extract
2 ml of 5M NaCl
2.5 ml of 1 M KCl
10 ml of 1 M MgCl2
10 ml o 1 M MgSO4
20 ml of 1 M glucose
Adjust to 1 litre using de-ionised water, sterilise by autoclaving

196
Appendix 2: Sln1 ORF Sequences WT (cv Himalaya, cv Herta, cv Triumph), γ-1 (cv Triumph) Nucleotide sequence atgaagcgcgagtaccaggacggcggcgggagcggcggtgggggtgatgagatggggtcgtcgag
ggacaagatgatggtgtcgtcgtcggaggcgggggagggggaggaggtggacgagctgctggcgg
cgctcgggtacaaggtgcgggcgtccgacatggcggacgtggcgcagaagctggagcagctcgag
atggccatggggatgggcggccccgcccccgacgacggcttcgcgacccacctcgccacggacac
cgtccactacaaccccaccgacctctcctcctgggtcgagagcatgctgtccgagctcaacgcgc
cgccgccgcccctcccgccggccccgccgcagctcaacgcctccacctcttccaccgtcacgggc
ggcggcggatacttcgatctcccgccctccgtcgactcctccagcagcacctacgccctgcgccc
gatcatctcgccgcccgtcgcgccggccgacctctccgctgactccgtccgggaccccaagcgga
tgcgcactggcggcagcagcacgtcgtcttcgtcctcctcgtcgtcctcgctcggcggtggtgcc
gccaggagctctgtggtggaggctgctccgccggtggcggctgcggctgctgcgcccgcgctgcc
ggtcgtcgtggtcgacacgcaggaggccgggattcggctggtgcacgcgctgctggcgtgcgcgg
aggccgtgcagcaggagaacctctcggccgccgaggcgctggtgaagcagatacccttgctggca
gcgtcgcagggcggcgcgatgcgcaaggtcgccgcctacttcggcgaggccctcgcccgccgcgt
cttccgcttccgcccgcagccggacagctccctcctcgacgccgccttcgccgacctcctccacg
cgcacttctacgagtcctgcccctacctcaagttcgcccatttcaccgccaaccaggccatcctg
gaggcgttcgccggctgccgccgcgtccacgtcgtcgacttcggcatcaagcaggggatgcagtg
gccggcccttctccaggccctcgcactccgtcccggcgggcccccttcgttccgcctcaccggcg
ttggccccccgcagccggacgagaccgacgccctgcagcaggtgggctggaagctcgcccagttc
gcgcacaccatccgcgtcgacttccagtatcgcggcctcgtcgccgccacgctcgcggacctgga
gccgttcatgctgcagccggagggcgaggaggacccgaacgaggagcccgaggtaatcgccgtga
actcagtcttcgagatgcaccggctcctcgcgcagcccggcgccctcgagaaggtcctgggcacg
gtgcgcgccgtgcggccgaggatcgtcaccgtggtcgagcaggaggcgaaccacaactccggctc
attcctggaccgcttcaccgagtccctgcactactactccaccatgttcgattctctcgagggcg
gcagctccggcggcccgtccgaggtctcatcggggggtgccgctcctgccgccgccgccggcacg
gaccaggtcatgtccgaggtgtacctcggccggcagatctgcaacgtggtggcctgcgagggcac
ggagcgcacagagcggcacgagacactggggcagtggcggaaccggctgggcaacgccgggttcg
agaccgtgcacctgggctccaatgcctacaagcaggcgagcacgctgctggccctcttcgccggc
ggcgacgggtacaaggtggaagagaaggaagggtgcctgactctcgggtggcacacgcgcccgct
gatcgccacttccgcatggcgcctcgccgcgccgtga
Amino acid sequence MKREYQDGGGSGGGGDEMGSSRDKMMVSSSEAGEGEEVDELLAALGYKVRASDMADVAQKLEQLE
MAMGMGGPAPDDGFATHLATDTVHYNPTDLSSWVESMLSELNAPPPPLPPAPPQLNASTSSTVTG
GGGYFDLPPSVDSSSSTYALRPIISPPVAPADLSADSVRDPKRMRTGGSSTSSSSSSSSSLGGGA
ARSSVVEAAPPVAAAAAAPALPVVVVDTQEAGIRLVHALLACAEAVQQENLSAAEALVKQIPLLA
ASQGGAMRKVAAYFGEALARRVFRFRPQPDSSLLDAAFADLLHAHFYESCPYLKFAHFTANQAIL
EAFAGCRRVHVVDFGIKQGMQWPALLQALALRPGGPPSFRLTGVGPPQPDETDALQQVGWKLAQF
AHTIRVDFQYRGLVAATLADLEPFMLQPEGEEDPNEEPEVIAVNSVFEMHRLLAQPGALEKVLGT
VRAVRPRIVTVVEQEANHNSGSFLDRFTESLHYYSTMFDSLEGGSSGGPSEVSSGGAAPAAAAGT
DQVMSEVYLGRQICNVVACEGTERTERHETLGQWRNRLGNAGFETVHLGSNAYKQASTLLALFAG
GDGYKVEEKEGCLTLGWHTRPLIATSAWRLAAP
197
WT (cv H930-36) Nucleotide sequence atgaagcgcgagtaccaggacggcggcgggagcggcggtgggggtgatgagatggggtcgtcgag
ggacaagatgatggtgtcgtcgtcggaggcgggggagggggaggaggtggacgagctgctggcgg
cgctcgggtacaaggtgcgggcgtccgacatggcggacgtggcgcagaagctggagcagctcgag
atggccatggggatgggcggccccgcccccgacgacggcttcgcgacccacctcgccacggacac
cgtccactacaaccccaccgacctctcctcctgggtcgagagcatgctgtccgagctcaacgcgc
cgccgccgcccctcccgccggccccgccgcagctcaacgcctccacctcttccaccgtcacgggc
ggcggcggatacttcgatctcccgccctctgtcgactcctccagcagcacctacgccctgcgccc
gatcatctcgccgcccgtcgcgccggccgacctctccgctgactccgtccgggaccccaagcgga
tgcgcactggcggcagcagcacgtcgtcttcgtcctcctcgtcgtcctcgctcggcggtggtgcc
gccaggagctctgtggtggaggctgctccgccggtggcggctgcggctgctgcgcccgcgctgcc
ggtcgtcgtggtcgacacgcaggaggccgggattcggctggtgcacgcgctgctggcgtgcgcgg
aggccgtgcagcaggagaacctctcggccgccgaggcgctggtgaagcagatacccttgctggca
gcgtcgcagggcggcgcgatgcgcaaggtcgccgcctacttcggcgaggccctcgcccgccgcgt
cttccgcttccgcccgcagccggacagctccctcctcgacgccgccttcgccgacctcctccacg
cgcacttctacgagtcctgcccctacctcaagttcgcccatttcaccgccaaccaggccatcctg
gaggcgttcgccggctgccgccgcgtccacgtcgtcgacttcggcatcaagcaggggatgcagtg
gccggcccttctccaggccctcgcactccgtcctggcgggcccccttcgttccgcctcaccggcg
ttggccccccgcagccggacgagaccgacgccctgcagcaggtgggctggaagctcgcccagttc
gcgcacaccatccgcgtcgacttccagtatcgcggcctcgtcgccgccacgctcgcggacctgga
gccgttcatgctgcagccggagggcgaggaggaccctaacgaggagcccgaggtaatcgccgtga
actcagtcttcgagatgcaccggctcctcgcgcagcccggcgccctcgagaaggtcctgggcacg
gtgcgcgccgtgcggccgaggatcgtcaccgtggtcgagcaggaggcgaaccacaactccggctc
attcctggaccgcttcaccgagtccctgcactactactccaccatgttcgattctctcgagggcg
gcagctccggcggcccgtccgaggtctcatcggggggtgccgctcctgccgccgccgccggcacg
gaccaggtcatgtccgaggtgtacctcggccggcagatctgcaacgtggtggcctgcgagggcac
ggagcgcacagagcggcacgagacactggggcagtggcggaaccggctgggcaacgccgggttcg
agaccgtgcacctgggctccaatgcctacaagcaggcgagcacgctgctggccctcttcgccggc
ggcgacgggtacaaggtggaggagaaggaagggtgcctgactctcgggtggcacacgcgcccgct
gatcgccacttccgcatggcgcctcgccgcgccgtga
Amino acid sequence MKREYQDGGGSGGGGDEMGSSRDKMMVSSSEAGEGEEVDELLAALGYKVRASDMADVAQKLEQLE
MAMGMGGPAPDDGFATHLATDTVHYNPTDLSSWVESMLSELNAPPPPLPPAPPQLNASTSSTVTG
GGGYFDLPPSVDSSSSTYALRPIISPPVAPADLSADSVRDPKRMRTGGSSTSSSSSSSSSLGGGA
ARSSVVEAAPPVAAAAAAPALPVVVVDTQEAGIRLVHALLACAEAVQQENLSAAEALVKQIPLLA
ASQGGAMRKVAAYFGEALARRVFRFRPQPDSSLLDAAFADLLHAHFYESCPYLKFAHFTANQAIL
EAFAGCRRVHVVDFGIKQGMQWPALLQALALRPGGPPSFRLTGVGPPQPDETDALQQVGWKLAQF
AHTIRVDFQYRGLVAATLADLEPFMLQPEGEEDPNEEPEVIAVNSVFEMHRLLAQPGALEKVLGT
VRAVRPRIVTVVEQEANHNSGSFLDRFTESLHYYSTMFDSLEGGSSGGPSEVSSGGAAPAAAAGT
DQVMSEVYLGRQICNVVACEGTERTERHETLGQWRNRLGNAGFETVHLGSNAYKQASTLLALFAG
GDGYKVEEKEGCLTLGWHTRPLIATSAWRLAAP

198
dwf2 (cv H930-36) Nucleotide sequence atgaagcgcgagtaccaggacggcggcgggagcggcggtgggggtgatgagatggggtcgtcgag
ggacaagatgatggtgtcgtcgtcagaggcgggggagggggaggaggtggacgagctgctcgggt
acaaggtgcgggcgtccgacatggcggacgtggcgcagaagctggagcagctcgagatggccatg
gggatgggcggccccgcccccgacgacggcttcgcgacccacctcgccacggacaccgtccacta
caaccccaccgacctctcctcctgggtcgagagcatgctgtccgagctcaacgcgccgccgccgc
ccctcccgccggccccgccgcagctcaacgcctccacctcttccaccgtcacgggcggcggcgga
tacttcgatctcccgccctccgtcgactcctccagcagcacctacgccctgcgcccgatcatctc
gccgcccgtcgcgccggccgacctctccgctgactccgtccgggaccccaagcggatgcgcactg
gcggcagcagcacgtcgtcttcgtcctcctcgtcgtcctcgctcggcggtggtgccgccaggagc
tctgtggtggaggctgctccgccggtggcggctgcggctgctgcgcccgcgctgccggtcgtcgt
ggtcgacacgcaggaggccgggattcggctggtgcacgcgctgctggcgtgcgcggaggccgtgc
agcaggagaacctctcggccgccgaggcgctggtgaagcagatacccttgctggcagcgtcgcag
ggcggcgcgatgcgcaaggtcgccgcctacttcggcgaggccctcgcccgccgcgtcttccgctt
ccgcccgcagccggacagctccctcctcgacgccgccttcgccgacctcctccacgcgcacttct
acgagtcctgcccctacctcaagttcgcccatttcaccgccaaccaggccatcctggaggcgttc
gccggctgccgccgcgtccacgtcgtcgacttcggcatcaagcaggggatgcagtggccggccct
tctccaggccctcgcactccgtcccggcgggcccccttcgttccgcctcaccggcgttggccccc
cgcagccggacgagaccgacgccctgcagcaggtgggctggaagctcgcccagttcgcgcacacc
atccgcgtcgacttccagtatcgcggcctcgtcgccgccacgctcgcggacctggagccgttcat
gctgcagccggagggcgaggaggacccgaacgaggagcccgaggtaatcgccgtgaactcagtct
tcgagatgcaccggctcctcgcgcagcccggcgccctcgagaaggtcctgggcacggtgcgcgcc
gtgcggccgaggatcgtcaccgtggtcgagcaggaggcgaaccacaactccggctcattcctgga
ccgcttcaccgagtccctgcactactactccaccatgttcgattctctcgagggcggcagctccg
gcggcccgtccgaggtctcatcggggggtgccgctcctgccgccgccgccggcacggaccaggtc
atgtccgaggtgtacctcggccggcagatctgcaacgtggtggcctgcgagggcacggagcgcac
agagcggcacgagacactggggcagtggcggaaccggctgggcaacgccgggttcgagaccgtgc
acctgggctccaatgcctacaagcaggcgagcacgctgctggccctcttcgccggcggcgacggg
tacaaggtggaggagaaggaagggtgcctgactctcgggtggcacacgcgcccgctgatcgccac
ttccgcatggcgcctcgccgcgccgtga
Amino acid sequence MKREYQDGGGSGGGGDEMGSSRDKMMVSSSEAGEGEEVDELGYKVRASDMADVAQKLEQLEMAMG
MGGPAPDDGFATHLATDTVHYNPTDLSSWVESMLSELNAPPPPLPPAPPQLNASTSSTVTGGGGY
FDLPPSVDSSSSTYALRPIISPPVAPADLSADSVRDPKRMRTGGSSTSSSSSSSSSLGGGAARSS
VVEAAPPVAAAAAAPALPVVVVDTQEAGIRLVHALLACAEAVQQENLSAAEALVKQIPLLAASQG
GAMRKVAAYFGEALARRVFRFRPQPDSSLLDAAFADLLHAHFYESCPYLKFAHFTANQAILEAFA
GCRRVHVVDFGIKQGMQWPALLQALALRPGGPPSFRLTGVGPPQPDETDALQQVGWKLAQFAHTI
RVDFQYRGLVAATLADLEPFMLQPEGEEDPNEEPEVIAVNSVFEMHRLLAQPGALEKVLGTVRAV
RPRIVTVVEQEANHNSGSFLDRFTESLHYYSTMFDSLEGGSSGGPSEVSSGGAAPAAAAGTDQVM
SEVYLGRQICNVVACEGTERTERHETLGQWRNRLGNAGFETVHLGSNAYKQASTLLALFAGGDGY
KVEEKEGCLTLGWHTRPLIATSAWRLAAP

199
dwf2-1 (cv H930-36) Nucleotide sequence atgaagcgcgagtaccaggacggcggcgggagcggcggtgggggtgatgagatggggtcgtcgag
ggacaagatgatggtgtcgtcgtcggaggcgggggagggggaggaggtggacgagctgctggcgg
cgctcgggtacaaggtgcgggcgtccgacatggcggacgtggcgcagaagctggagcagctcgag
atggccatggggatgggcggccccgcccccgacgacggcttcgcgacccacctcgccacggacac
cgtccactacaaccccaccgacctctcctcctgggtcgagagcatgctgtccgagctcaacgcgc
cgccgccgcccctcccgccggccccgccgcagctcaacgcctccacctcttccaccgtcacgggc
ggcggcggatacttcgatctcccgccctccgtcgactcctccagcagcacctacgccctgcgccc
gatcatctcgccgcccgtcgcgccggccgacctctccgctgactccgtccgggaccccaagcgga
tgcgcactggcggcagcagcacgtcgtcttcgtcctcctcgtcgtcctcgctcggcggtggtgcc
gccaggagctctgtggtggaggctgctccgccggtggcggctgcggctgctgcgcccgcgctgcc
ggtcgtcgtggtcgacacgcaggaggccgggattcggctggtgcacgcgctgctggcgtgcgcgg
aggccgtgcagcaggagaacctctcggccgccgaggcgctggtgaagcagatacccttgctggca
gcgtcgcagggcggcgcgatgcgcaaggtcgccgcctacttcggcgaggccctcgcccgccgcgt
cttccgcttccgcccgcagccggacagctccctcctcgacgccgccttcgccgacctcctccacg
cgcacttctacgagtcctgcccctacctcaagttcgcccatttcaccgccaaccaggccatcctg
gaggcgttcgccggctgccgccgcgtccacgtcgtcgacttcggcatcaagcaggggatgcagtg
gccggcccttctccaggccctcgcactccgtcccggcgggcccccttcgttccgcctcaccggcg
ttggccccccgcagccggacgagaccgacgccctgcagcaggtgggctg(g/a)aagctcgccca
gttcgcgcacaccatccgcgtcgacttccagtatcgcggcctcgtcgccgccacgctcgcggacc
tggagccgttcatgctgcagccggagggcgaggaggacccgaacgaggagcccgaggtaatcgcc
gtgaactcagtcttcgagatgcaccggctcctcgcgcagcccggcgccctcgagaaggtcctggg
cacggtgcgcgccgtgcggccgaggatcgtcaccgtggtcgagcaggaggcgaaccacaactccg
gctcattcctggaccgcttcaccgagtccctgcactactactccaccatgttcgattctctcgag
ggcggcagctccggcggcccgtccgaggtctcatcggggggtgccgctcctgccgccgccgccgg
cacggaccaggtcatgtccgaggtgtacctcggccggcagatctgcaacgtggtggcctgcgagg
gcacggagcgcacagagcggcacgagacactggggcagtggcggaaccggctgggcaacgccggg
ttcgagaccgtgcacctgggctccaatgcctacaagcaggcgagcacgctgctggccctcttcgc
cggcggcgacgggtacaaggtggaagagaaggaagggtgcctgactctcgggtggcacacgcgcc
cgctgatcgccacttccgcatggcgcctcgccgcgccgtga
Amino acid sequence MKREYQDGGGSGGGGDEMGSSRDKMMVSSSEAGEGEEVDELLAALGYKVRASDMADVAQKLEQLE
MAMGMGGPAPDDGFATHLATDTVHYNPTDLSSWVESMLSELNAPPPPLPPAPPQLNASTSSTVTG
GGGYFDLPPSVDSSSSTYALRPIISPPVAPADLSADSVRDPKRMRTGGSSTSSSSSSSSSLGGGA
ARSSVVEAAPPVAAAAAAPALPVVVVDTQEAGIRLVHALLACAEAVQQENLSAAEALVKQIPLLA
ASQGGAMRKVAAYFGEALARRVFRFRPQPDSSLLDAAFADLLHAHFYESCPYLKFAHFTANQAIL
EAFAGCRRVHVVDFGIKQGMQWPALLQALALRPGGPPSFRLTGVGPPQPDETDALQQVG(W/sto
p)KLAQFAHTIRVDFQYRGLVAATLADLEPFMLQPEGEEDPNEEPEVIAVNSVFEMHRLLAQPGA
LEKVLGTVRAVRPRIVTVVEQEANHNSGSFLDRFTESLHYYSTMFDSLEGGSSGGPSEVSSGGAA
PAAAAGTDQVMSEVYLGRQICNVVACEGTERTERHETLGQWRNRLGNAGFETVHLGSNAYKQAST
LLALFAGGDGYKVEEKEGCLTLGWHTRPLIATSAWRLAAP

200
sln1-1 (cv Herta) Nucleotide sequence atgaagcgcgagtaccaggacggcggcgggagcggcggtgggggtgatgagatggggtcgtcgag
ggacaagatgatggtgtcgtcgtcggaggcgggggagggggaggaggtggacgagctgctggcgg
cgctcgggtacaaggtgcgggcgtccgacatggcggacgtggcgcagaagctggagcagctcgag
atggccatggggatgggcggccccgcccccgacgacggcttcgcgacccacctcgccacggacac
cgtccactacaaccccaccgacctctcctcctgggtcgagagcatgctgtccgagctcaacgcgc
cgccgccgcccctcccgccggccccgccgcagctcaacgcctccacctcttccaccgtcacgggc
ggcggcggatacttcgatctcccgccctccgtcgactcctccagcagcacctacgccctgcgccc
gatcatctcgccgcccgtcgcgccggccgacctctccgctgactccgtccgggaccccaagcgga
tgcgcactggcggcagcagcacgtcgtcttcgtcctcctcgtcgtcctcgctcggcggtggtgcc
gccaggagctctgtggtggaggctgctccgccggtggcggctgcggctgctgcgcccgcgctgcc
ggtcgtcgtggtcgacacgcaggaggccgggattcggctggtgcacgcgctgctggcgtgcgcgg
aggccgtgcagcaggagaacctctcggccgcctaggcgctggtgaagcagatacccttgctggca
gcgtcgcagggcggcgcgatgcgcaaggtcgccgcctacttcggcgaggccctcgcccgccgcgt
cttccgcttccgcccgcagccggacagctccctcctcgacgccgccttcgccgacctcctccacg
cgcacttctacgagtcctgcccctacctcaagttcgcccatttcaccgccaaccaggccatcctg
gaggcgttcgccggctgccgccgcgtccacgtcgtcgacttcggcatcaagcaggggatgcagtg
gccggcccttctccaggccctcgcactccgtcccggcgggcccccttcgttccgcctcaccggcg
ttggccccccgcagccggacgagaccgacgccctgcagcaggtgggctggaagctcgcccagttc
gcgcacaccatccgcgtcgacttccagtatcgcggcctcgtcgccgccacgctcgcggacctgga
gccgttcatgctgcagccggagggcgaggaggacccgaacgaggagcccgaggtaatcgccgtga
actcagtcttcgagatgcaccggctcctcgcgcagcccggcgccctcgagaaggtcctgggcacg
gtgcgcgccgtgcggccgaggatcgtcaccgtggtcgagcaggaggcgaaccacaactccggctc
attcctggaccgcttcaccgagtccctgcactactactccaccatgttcgattctctcgagggcg
gcagctccggcggcccgtccgaggtctcatcggggggtgccgctcctgccgccgccgccggcacg
gaccaggtcatgtccgaggtgtacctcggccggcagatctgcaacgtggtggcctgcgagggcac
ggagcgcacagagcggcacgagacactggggcagtggcggaaccggctgggcaacgccgggttcg
agaccgtgcacctgggctccaatgcctacaagcaggcgagcacgctgctggccctcttcgccggc
ggcgacgggtacaaggtggaagagaaggaagggtgcctgactctcgggtggcacacgcgcccgct
gatcgccacttccgcatggcgcctcgccgcgccgtga
Amino acid sequence MKREYQDGGGSGGGGDEMGSSRDKMMVSSSEAGEGEEVDELLAALGYKVRASDMADVAQKLEQLE
MAMGMGGPAPDDGFATHLATDTVHYNPTDLSSWVESMLSELNAPPPPLPPAPPQLNASTSSTVTG
GGGYFDLPPSVDSSSSTYALRPIISPPVAPADLSADSVRDPKRMRTGGSSTSSSSSSSSSLGGGA
ARSSVVEAAPPVAAAAAAPALPVVVVDTQEAGIRLVHALLACAEAVQQENLSAAstop