
Arctic System Model workshop III Montreal, Canada, July 17 th , 2009 10:50 – 11:10
11
Arctic System Model Arctic System Model workshop III workshop III Montreal, Canada, July Montreal, Canada, July 17 17 th th , 2009 , 2009 10:50 – 11:10 10:50 – 11:10 Ocean/Atmosphere Ocean/Atmosphere observations observations A. Proshutinsky, WHOI A. Proshutinsky, WHOI a) a) Model forcing validation Model forcing validation b) b) Data for oceanic model validation Data for oceanic model validation
-
Upload
phyllis-blackwell -
Category
Documents
-
view
19 -
download
1
description
Ocean/Atmosphere observations A. Proshutinsky, WHOI. Arctic System Model workshop III Montreal, Canada, July 17 th , 2009 10:50 – 11:10. Model forcing validation Data for oceanic model validation. Model forcing validation: - PowerPoint PPT Presentation
Transcript of Arctic System Model workshop III Montreal, Canada, July 17 th , 2009 10:50 – 11:10
Arctic System Model workshop IIIArctic System Model workshop III
Montreal, Canada, July 17Montreal, Canada, July 17thth, 2009, 2009
10:50 – 11:1010:50 – 11:10
Ocean/Atmosphere observationsOcean/Atmosphere observationsA. Proshutinsky, WHOI A. Proshutinsky, WHOI
a)a) Model forcing validationModel forcing validation
b)b) Data for oceanic model validationData for oceanic model validation

Data Coverage: 1954-1991 and 2003-Data Coverage: 1954-1991 and 2003-20062006Temporal SpatialTemporal Spatial
Model forcing validation: Model forcing validation: Air temperature, humidity, SLP, wind, SLP, cloudiness from NCAR/NCEP Air temperature, humidity, SLP, wind, SLP, cloudiness from NCAR/NCEP can be validated based on North Pole stations can be validated based on North Pole stations

Sea Sea level level
Fresh water andFresh water andheat contentheat content
Mixed LayerMixed Layerthicknessthickness
Water volume,Water volume,heat and saltheat and salt
fluxes via straitsfluxes via straits
Water Water circulationcirculation
Hydrography:Hydrography:T and ST and S
Ocean model Ocean model validation validation
parametersparameters

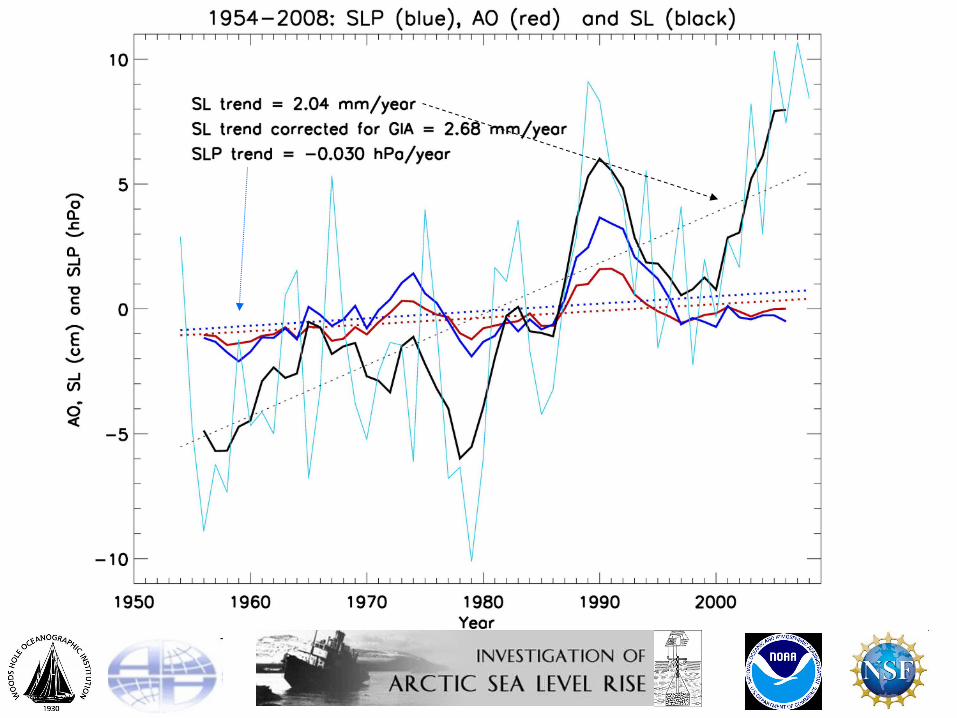
Sea Level data sources
Monthly mean relative sea levels were provided by the Arctic and Antarctic Research Institute for 71 stations (see station numbers) located in the Barents and Siberian Seas. The time series of sea level variability generally cover the period between 1948 and 2008 but temporal coverage differs significantly from station to station. Red denotes stations with the most complete datasets. The best data are available from 9 stations (blue circles) for the period 1954 – 2008.
http://www.whoi.edu/science/PO/arcticsealevelhttp://www.whoi.edu/science/PO/arcticsealevel//
1850 1860 1870 1880 1890 1900 1910 1920 1930 1940 1950 1960 1970 1980 1990 2000
Ãî ä û
0
1000
2000
3000
4000
5000
6000
7000
8000
9000
10000
11000
12000
13000
14000
15000
16000
17000
18000
19000
20000
Êîë
è÷å
ñòâî
ñòà
íöè
é
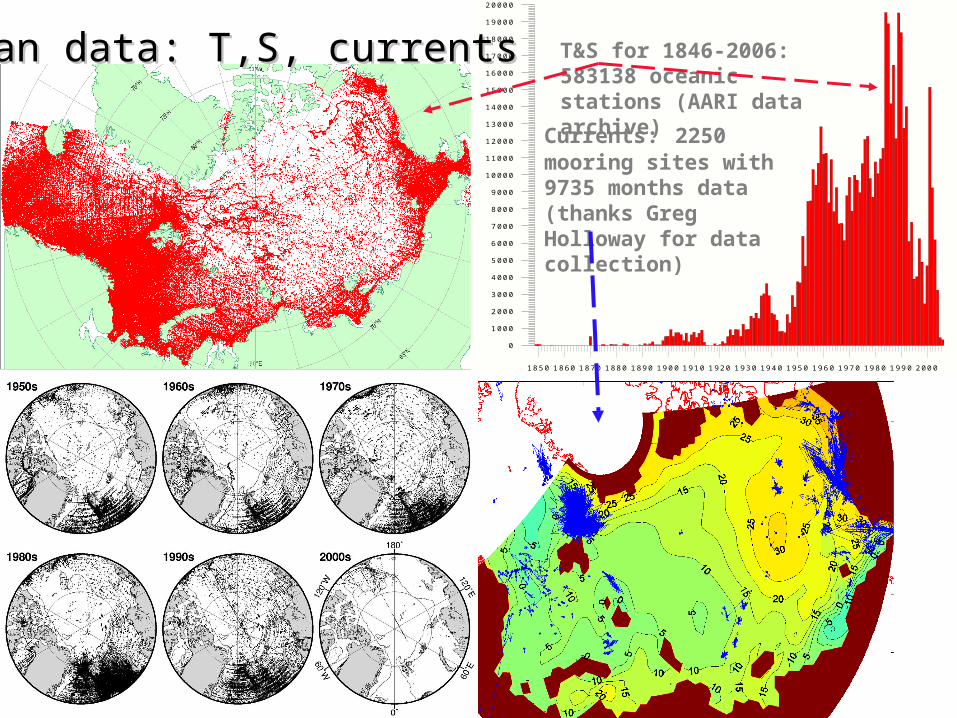
Ocean data: T,S, currentsOcean data: T,S, currents T&S for 1846-2006: 583138 oceanic stations (AARI data archive)
Currents: 2250 mooring sites with 9735 months data (thanks Greg Holloway for data collection)
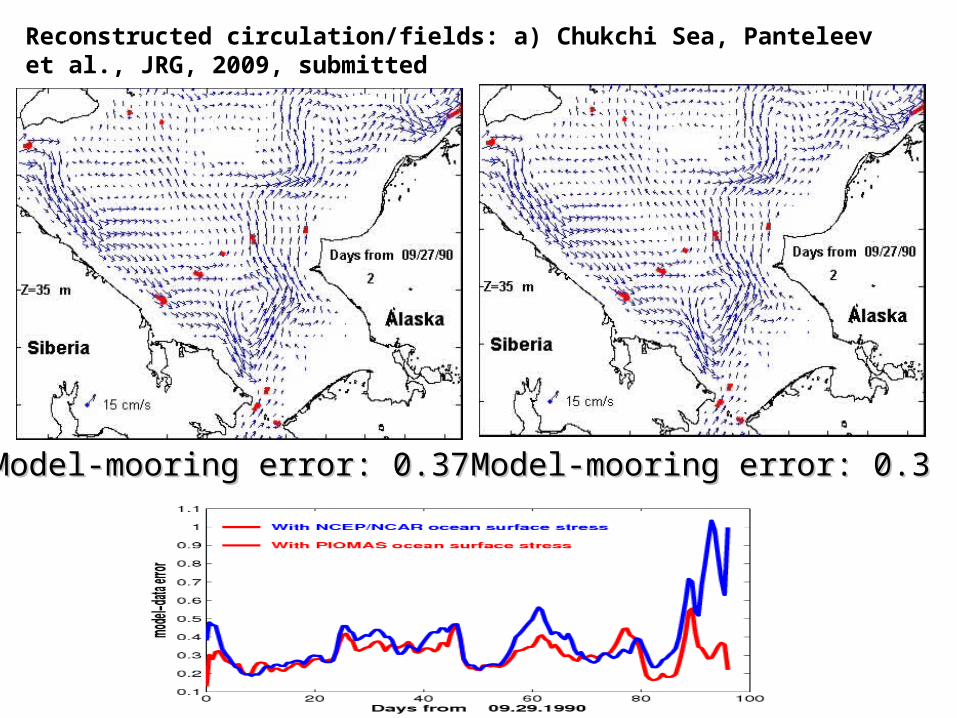
Model-mooring error: 0.37Model-mooring error: 0.37 Model-mooring error: 0.3Model-mooring error: 0.3
Reconstructed circulation/fields: a) Chukchi Sea, Panteleev et al., JRG, 2009, submitted

Circulation of the Kara Sea based on modeling with data assimilation, Circulation of the Kara Sea based on modeling with data assimilation, Panteleev et al., JGR, 2007.Panteleev et al., JGR, 2007.

Fram Strait fluxes, AWI

Bering Strait fluxes, T. Weingartner (UAF), R. Woodgate (UW)

Fresh water and heat content


