Arctic sea ice melt in summer 2007: Sunlight, water, and ice NSIDC Sept 2007.
23
Arctic sea ice melt in summer 2007: Sunlight, water, and ice NSIDC Sept 2007
-
Upload
allen-tucker -
Category
Documents
-
view
215 -
download
0
Transcript of Arctic sea ice melt in summer 2007: Sunlight, water, and ice NSIDC Sept 2007.

Arctic sea ice melt in summer 2007: Sunlight, water, and ice
NSIDCSept 2007

A long list of suspects
Examine the mass balance of the ice
• Warmer air temperature• Longer melt season• Winds• Export of perennial ice• Advection of ocean heat• Clouds• Enhanced solar heating• Ice albedo feedback
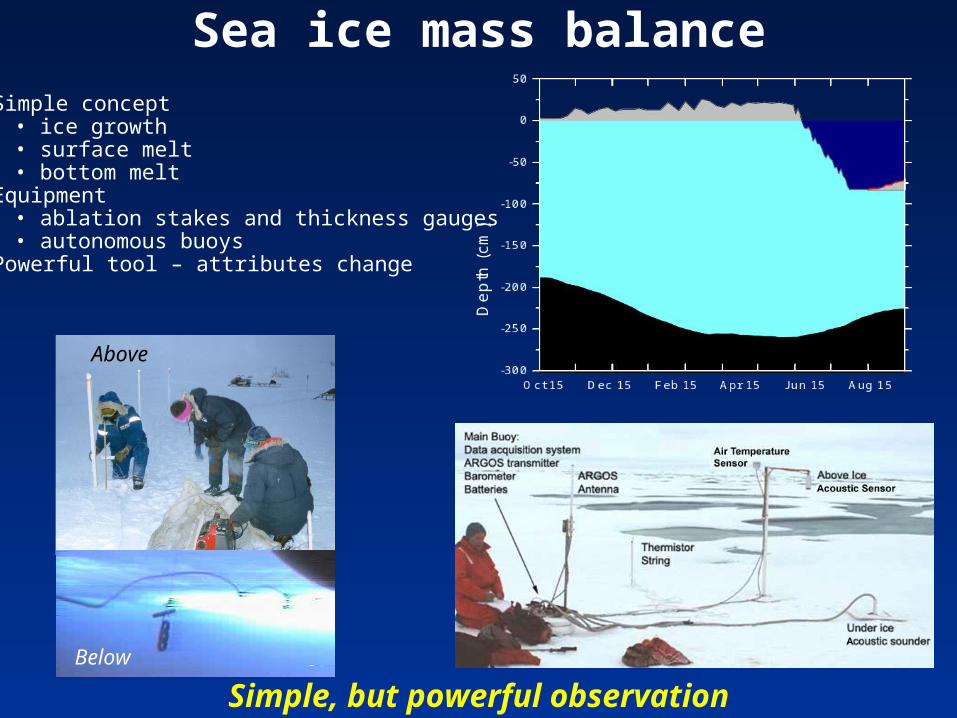
Sea ice mass balance
Simple, but powerful observation
• Simple concept• ice growth• surface melt• bottom melt
• Equipment• ablation stakes and thickness gauges• autonomous buoys
• Powerful tool – attributes change
Above
Below

Monitoring the mass balance
Observations in Beaufort and North Pole
http://www.crrel.usace.army.mil/sid/IMB

Summer ice melt
Interannual variability, latitude influence on surface melt

Summer ice melt
2007 at North Pole – typical melt
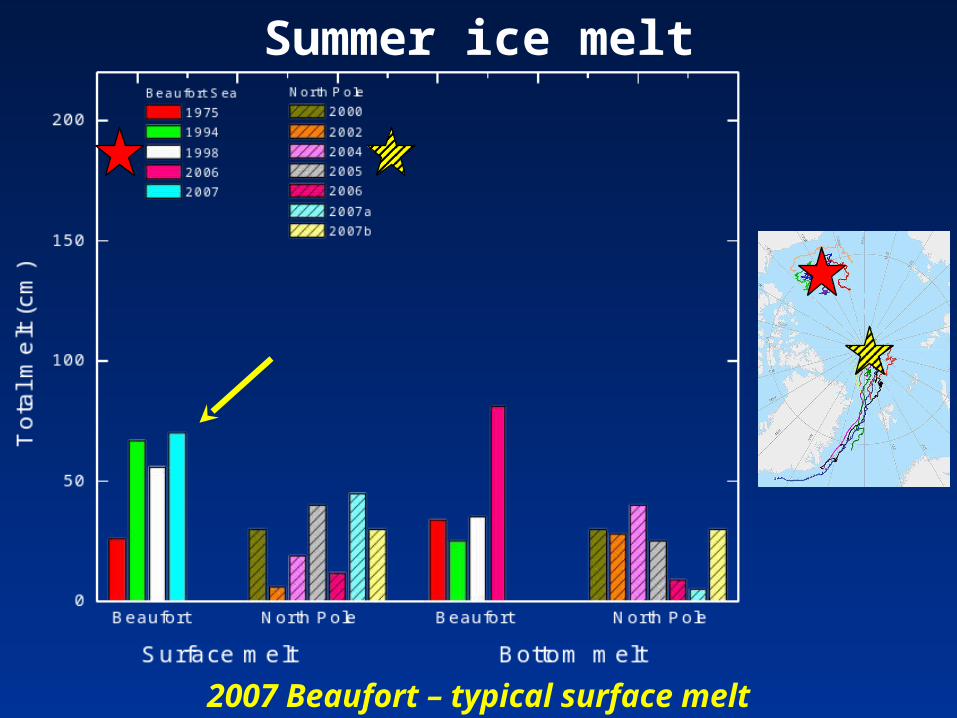
Summer ice melt
2007 Beaufort – typical surface melt
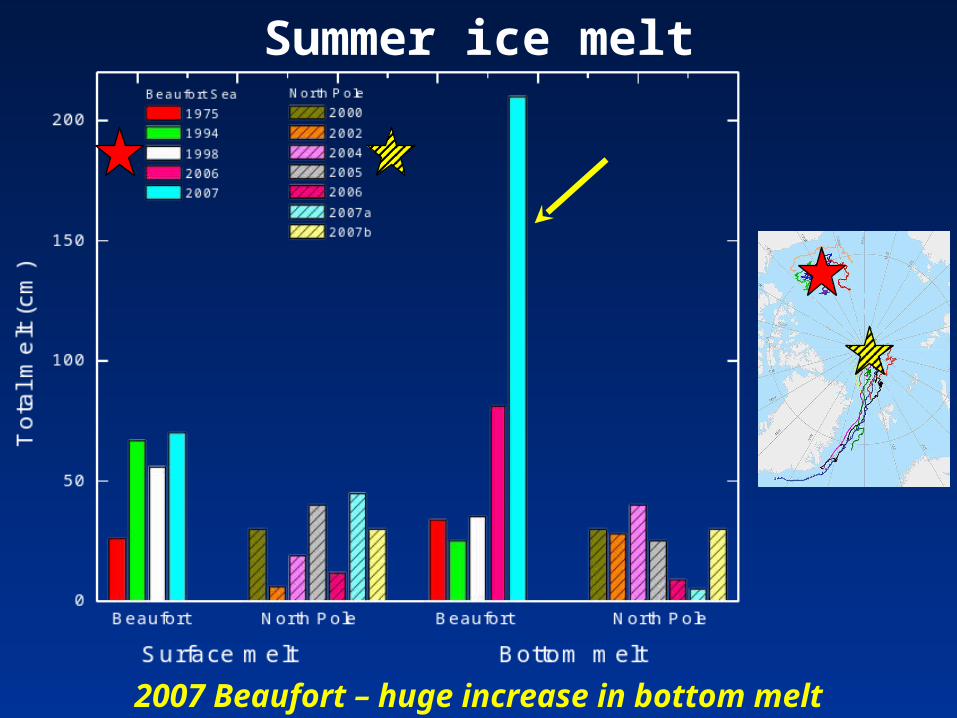
Summer ice melt
2007 Beaufort – huge increase in bottom melt

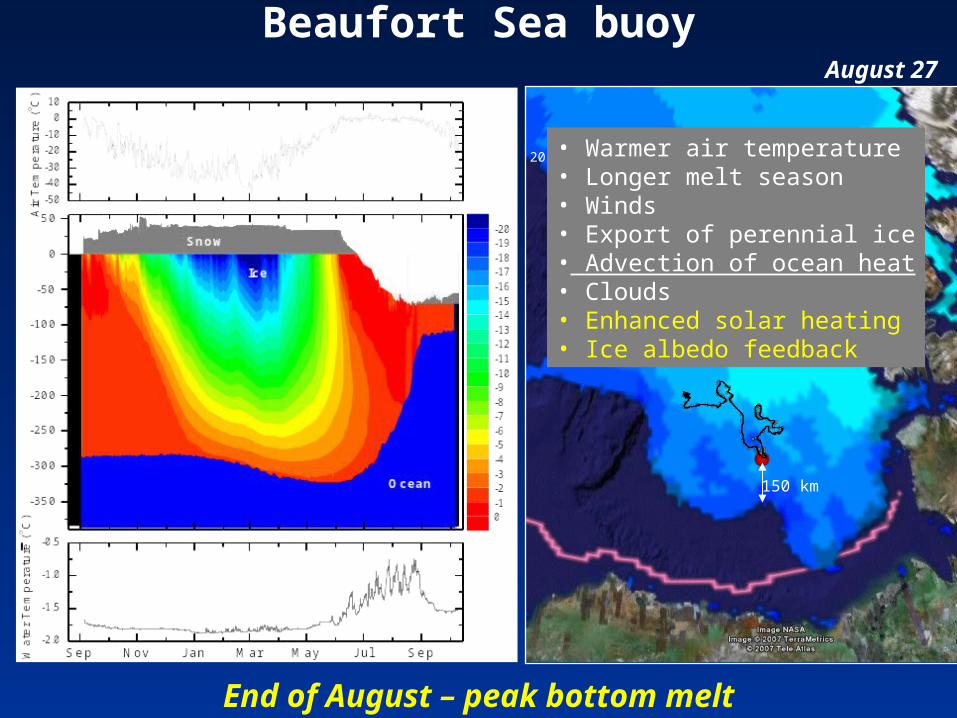
Beaufort Sea buoy
End of August – peak bottom melt
20-4040-60
60-80
80-100
150 km
August 27
Beaufort Sea buoy
End of August – peak bottom melt
20-4040-60
60-80
80-100
150 km
August 27
• Warmer air temperature• Longer melt season• Winds• Export of perennial ice• Advection of ocean heat• Clouds• Enhanced solar heating• Ice albedo feedback

Estimate of solar heating
Incident solar, ice concentration, and albedo -> heat input
Focn = Fr (1 – ) (1 – C)
Input:• 25 x 25 km equal area grid • Incident (Fr) from ERA-40, ECMWF• Ice concentration (C) - SSMI• Water albedo () = 0.07
Output:Solar input to the ocean (Focn)
Neglect ice for now
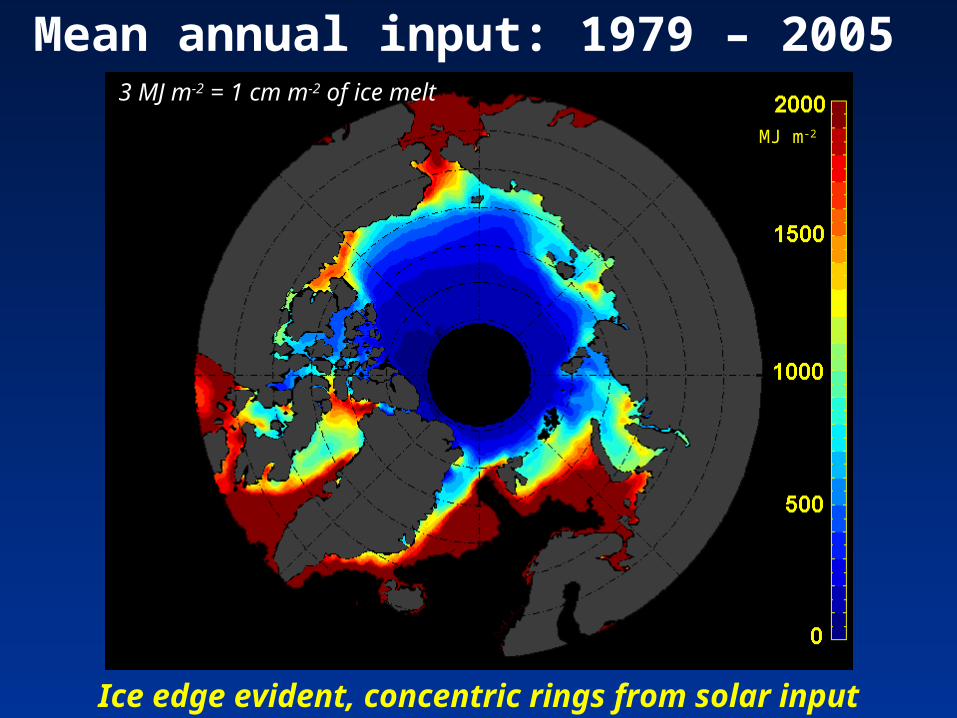
Mean annual input: 1979 – 2005
Ice edge evident, concentric rings from solar input
MJ m-2
3 MJ m-2 = 1 cm m-2 of ice melt

Percent anomaly in 2007
Heat input near buoy 400 to 500 % greater
through 22 Sept 800
700
600
500
400
300
200
100
0
-100
-200
-300
Percent

2007 vs “climatology”
Similar incident shortwave, but much less ice
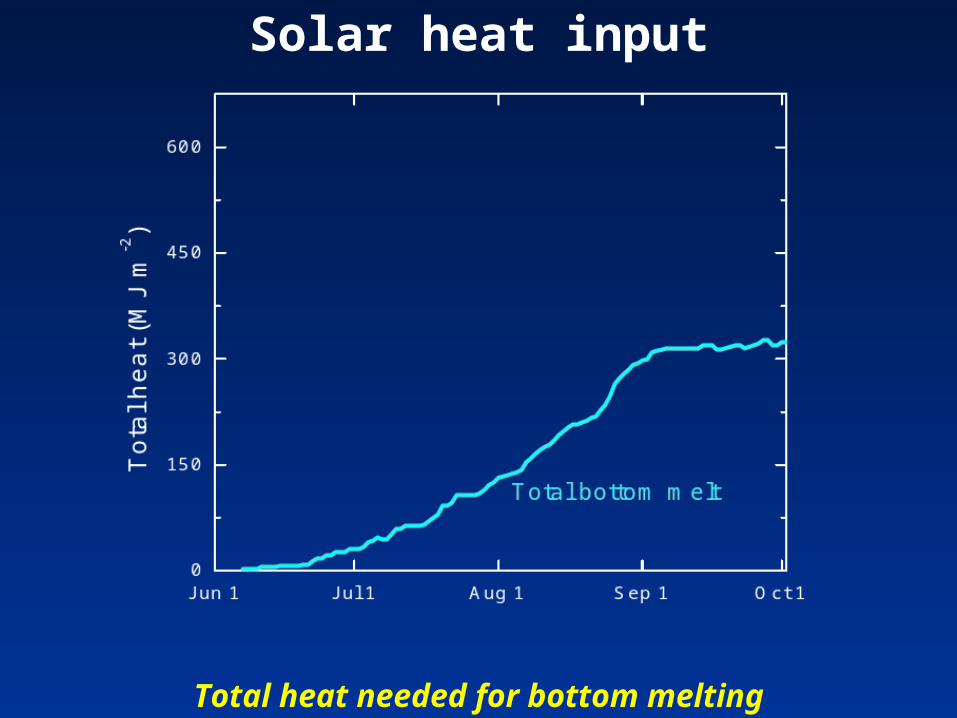
Solar heat input
Total heat needed for bottom melting

Solar heat input
Twice as much solar heat even without ice transmitted

Conclusions
Was there a trigger?
• North Pole• business as usual
• Beaufort Sea• typical surface melt• huge bottom melt
• Solar incident comparable• Ice concentration much less• Solar input twice melt• Ice albedo feedback

…

Solar heat input
Peak ocean heat flux with ice convergence/divergence

Total solar heat input to ocean
Heat input near buoy from 600 to 800 MJ m-2
through 22 Sept 2007Units = MJ m-2
3 MJ m-2 ~ 1 cm thinning

Percent anomaly in 2007
General increase

Incident shortwave anomaly
Not much of a difference
• Incident shortwave from reanalysis • Pan – Arctic Ocean• 25 x 25 km equal area grid• Average 1979 – 2005
(2007 – average) % anomaly
%

27 year trend of annual ocean solar heat input
Units are percent per year
Increasing solar heat input in 89% of area