Arctic Ocean play unexpectedly large role in removing nitrogen
12
News date: 26.10.2016 compiled by Dr. Alvarinho Arctic Ocean play unexpectedly large role in removing nitro Areas of the Arctic play a larger role than previously thought in the global nit cycle -- the process responsible for keeping a critical element necessary for lif flowing between the atmosphere, the land and oceans. The finding is reported new study of the continental shelf in the Arctic Ocean published in the journa Nature Communications. In the new study, marine chemists and biologists from The University of Texa Austin discovered that seabed microbes remove substantial quantities of nitro from the Arctic Ocean. Although the Arctic accounts for only a little more tha of the world's continental shelves (where most nitrogen is removed), this regio accounts for about 5% of the global ocean nitrogen removal, data researchers collected for the study show. Scientists think that, in the past, the oceans maintained a reliable balance betw nitrogen sources and nitrogen removal. This global nitrogen budget indicates overall ocean nitrogen levels are higher now than ever before due to human ac such as fertilizer run-off and sewage into the oceans. This perturbation throws budget out of balance. All living things need nitrogen for survival, but excess nitrogen can harm marine and terrestrial ecosystems. For example, excess nitr the ocean can fuel growth of algae blooms, including toxic blooms that are ha to marine life. Symptoms of nitrogen pollution include "dead zones," fish kill shellfish poisoning and loss of coastal habitats such as seagrass meadows and reefs. Natural bacteria in the ocean remove some of this extra nitrogen in the o by converting it to inert nitrogen gas in a process called "denitrification." Microbial nitrogen removal occurs across the globe, and we were interested in much of an impact it was making in the Arctic, said Amber Hardison, Prof at University of Texas at Austin who was an author on the paper. Hardison and her colleagues collaborated in the first-ever study in the Arctic r to measure several different processes that can remove nitrogen. The research conducted the study in the Chukchi Sea, a part of the Arctic Ocean adjacent to Pacific Ocean and Alaska. The area is of interest not only to scientists but also industry officials due to the potential for large reserves of oil and gas. The Ob administration has removed the area of Hanna Shoal in t he northeast Chukchi from consideration for future oil and gas leasing, and the new research adds to environmental case for protecting the region. The role of this region is critically important to understand as humans put mo nitrogen into the ocean via fertilizers, sewage and other sources, Hardison sai Arctic is also undergoing dramatic changes linked to climate change, includin rapid decline in sea ice. As sea ice shrinks, it disrupts the natural functioning o ecosystem, including potentially limiting the vital nitrogen removal process. The scientists also discovered that the animals living on and in the seafloor pl significant role in facilitating nitrogen removal. Animals such as worms and c make tubes and burrows in the seabed, creating a perfect space for bacteria to in denitrification. This study was a great example of the interplay of biology and chemistry and first time it was shown in the Arctic, Hardison said. She warns, however, that depleted sea ice will alter the system in unknown ways, including the animals on and in the seafloor and their facilitation of bacterial nitrogen removal. Source: University of Texas at Austin pdf reprint follows… o J. Luis ogen trogen fe d in a al as at ogen an 1% on ween that ctivity, s the ive rogen in armful ls, d coral ocean n how The region hers o the o to oil bama i Sea o the ore id. The ng a of the lay a clams o engage is the t s living ……
Transcript of Arctic Ocean play unexpectedly large role in removing nitrogen

News date: 26.10.2016 compiled by Dr. Alvarinho J. Luis
Arctic Ocean play unexpectedly large role in removing nitrogen
Areas of the Arctic play a larger role than previously thought in the global nitrogen cycle -- the process responsible for keeping a critical element necessary for life flowing between the atmosphere, the land and oceans. The finding is reported in a new study of the continental shelf in the Arctic Ocean published in the journal Nature Communications.
In the new study, marine chemists and biologists from The University of Texas at Austin discovered that seabed microbes remove substantial quantities of nitrogen from the Arctic Ocean. Although the Arctic accounts for only a little more than 1of the world's continental shelves (where most nitrogen is removed), this region accounts for about 5% of the global ocean nitrogen removal, data researchers collected for the study show.
Scientists think that, in the past, the oceans maintained a reliable balance between nitrogen sources and nitrogen removal. This global nitrogen budget indicates that overall ocean nitrogen levels are higher now than ever before due to human activity, such as fertilizer run-off and sewage into the oceans. This perturbation throws the budget out of balance. All living things need nitrogen for survival, but excessive nitrogen can harm marine and terrestrial ecosystems. For example, excess nitrogen in the ocean can fuel growth of algae blooms, including toxic blooms that are harmful to marine life. Symptoms of nitrogen pollution include "dead zones," fish kills, shellfish poisoning and loss of coastal habitats such as seagrass meadows and coral reefs. Natural bacteria in the ocean remove some of this extra nitrogen in the ocean by converting it to inert nitrogen gas in a process called "denitrification."
Microbial nitrogen removal occurs across the globe, and we were interested in how much of an impact it was making in the Arctic, said Amber Hardison, Prof at University of Texas at Austin who was an author on the paper.
Hardison and her colleagues collaborated in the first-ever study in the Arctic region to measure several different processes that can remove nitrogen. The researchers conducted the study in the Chukchi Sea, a part of the Arctic Ocean adjacent to the Pacific Ocean and Alaska. The area is of interest not only to scientists but also to oil industry officials due to the potential for large reserves of oil and gas. The Obama administration has removed the area of Hanna Shoal in the northeast Chukchi Sea from consideration for future oil and gas leasing, and the new research adds to the environmental case for protecting the region.
The role of this region is critically important to understand as humans put more nitrogen into the ocean via fertilizers, sewage and other sources, Hardison said. Arctic is also undergoing dramatic changes linked to climate change, including a rapid decline in sea ice. As sea ice shrinks, it disrupts the natural functioning of the ecosystem, including potentially limiting the vital nitrogen removal process.
The scientists also discovered that the animals living on and in the seafloor play a significant role in facilitating nitrogen removal. Animals such as worms and clams make tubes and burrows in the seabed, creating a perfect space for bacteria to engage in denitrification.
This study was a great example of the interplay of biology and chemistry and is the first time it was shown in the Arctic, Hardison said. She warns, however, that depleted sea ice will alter the system in unknown ways, including the animals living on and in the seafloor and their facilitation of bacterial nitrogen removal.
Source: University of Texas at Austin pdf reprint follows……
compiled by Dr. Alvarinho J. Luis
play unexpectedly large role in removing nitrogen
Areas of the Arctic play a larger role than previously thought in the global nitrogen essary for life
flowing between the atmosphere, the land and oceans. The finding is reported in a new study of the continental shelf in the Arctic Ocean published in the journal
he University of Texas at Austin discovered that seabed microbes remove substantial quantities of nitrogen
s for only a little more than 1% removed), this region
of the global ocean nitrogen removal, data researchers
Scientists think that, in the past, the oceans maintained a reliable balance between al. This global nitrogen budget indicates that
overall ocean nitrogen levels are higher now than ever before due to human activity, off and sewage into the oceans. This perturbation throws the
need nitrogen for survival, but excessive nitrogen can harm marine and terrestrial ecosystems. For example, excess nitrogen in the ocean can fuel growth of algae blooms, including toxic blooms that are harmful
n include "dead zones," fish kills, shellfish poisoning and loss of coastal habitats such as seagrass meadows and coral reefs. Natural bacteria in the ocean remove some of this extra nitrogen in the ocean
Microbial nitrogen removal occurs across the globe, and we were interested in how Prof at The
ever study in the Arctic region to measure several different processes that can remove nitrogen. The researchers
ctic Ocean adjacent to the Pacific Ocean and Alaska. The area is of interest not only to scientists but also to oil industry officials due to the potential for large reserves of oil and gas. The Obama
he northeast Chukchi Sea from consideration for future oil and gas leasing, and the new research adds to the
The role of this region is critically important to understand as humans put more zers, sewage and other sources, Hardison said. The
Arctic is also undergoing dramatic changes linked to climate change, including a rapid decline in sea ice. As sea ice shrinks, it disrupts the natural functioning of the
The scientists also discovered that the animals living on and in the seafloor play a significant role in facilitating nitrogen removal. Animals such as worms and clams
the seabed, creating a perfect space for bacteria to engage
This study was a great example of the interplay of biology and chemistry and is the Hardison said. She warns, however, that
a ice will alter the system in unknown ways, including the animals living
pdf reprint follows……

ARTICLE
Received 13 Jan 2016 | Accepted 7 Sep 2016 | Published 26 Oct 2016
Biotic and abiotic controls on co-occurring nitrogencycling processes in shallow Arctic shelf sedimentsN.D. McTigue1,w, W.S. Gardner1, K.H. Dunton1 & A.K. Hardison1
The processes that convert bioavailable inorganic nitrogen to inert nitrogen gas are prominent
in continental shelf sediments and represent a critical global sink, yet little is known of these
pathways in the Arctic where 18% of the world’s continental shelves are located. Moreover,
few data from the Arctic exist that separate loss processes like denitrification and anaerobic
ammonium oxidation (anammox) from recycling pathways like dissimilatory nitrate reduction
to ammonium (DNRA) or source pathways like nitrogen fixation. Here we present
measurements of these co-occurring processes using 15N tracers. Denitrification was
heterogeneous among stations and an order of magnitude greater than anammox and DNRA,
while nitrogen fixation was undetectable. No abiotic factors correlated with interstation
variability in biogeochemical rates; however, bioturbation potential explained most of the
variation. Fauna-enhanced denitrification is a potentially important but overlooked process on
Arctic shelves and highlights the role of the Arctic as a significant global nitrogen sink.
DOI: 10.1038/ncomms13145 OPEN
1 The University of Texas at Austin, Marine Science Institute, 750 Channel View Drive, Port Aransas, Texas 78373, USA. w Present address: NationalOceanographic and Atmospheric Administration, National Center for Coastal Ocean Science, 101 Pivers Island Road, Beaufort, North Carolina 28516, USA.Correspondence and requests for materials should be addressed to N.D.M. (email: [email protected]).
NATURE COMMUNICATIONS | 7:13145 | DOI: 10.1038/ncomms13145 | www.nature.com/naturecommunications 1
Since nitrogen is a key nutrient supporting marineprimary production, the controls on its removal andrecycling pathways are critical to understanding global
biogeochemical cycles. Nitrogen loss processes that transformfixed bioavailable nitrogen to inert dinitrogen gas (N2) are theprominent global nitrogen sink1. An estimated 44% of the world’sfixed N2 losses occurs on continental shelves2, which constituteonly 7.5% of the global seafloor3. The Arctic Ocean and itssurrounding shallow seas represent a disproportionate 18% of theworld’s continental shelves, despite only covering 2.6% of theglobal ocean3,4. Therefore, Arctic shelves may have a critical rolein the global nitrogen cycle, accounting for almost 10% of globalN2 losses.
The dominance of specific nitrogen transformation pathwaysin marine sediments determines whether a system removes fixednitrogen or retains it within the ecosystem. Canonical hetero-trophic denitrification (hereafter, denitrification), the microbiallymediated anaerobic transformation of nitrate (NO3
� ) to inert N2
gas, is the major removal pathway of nitrogen and is widespreadin continental shelf sediments5,6. Anaerobic ammoniumoxidation (anammox) is a chemoautotrophic pathway thatremoves inorganic nitrogen able to fuel primary production(NH4
þ and NO2� ) as N2. Although anammox is not an
ubiquitous process7, it can rival denitrification by producing upto 80% of the total N2 under certain conditions8,9. Dissimilatorynitrate reduction to ammonium (DNRA) is a microbiallymediated anaerobic pathway that retains bioavailable nitrogenwithin the system, using NO3
� and producing NH4þ . Lastly,
nitrogen fixation represents the microbial conversion of inert N2
to bioavailable nitrogen. The controls on the environmentallyvariable nitrogen fixation process are not well understood butappear to be regulated by nitrogen, phosphorus and ironavailability10. Without nitrogen fixation, an ecosystemrelies on either allochthonous delivery of dissolved inorganicnitrogen (DIN) or the recycling and release of bioavailablenitrogen from sediments by DNRA, ammonification(heterotrophic transformation of organic matter to NH4
þ ), ornitrification (aerobic microbially mediated transformation ofNH4
þ to NO3� ).
The extent and geochemical controls of denitrification andanammox are not necessarily predictable. Both denitrification andanammox require suboxic conditions but differences in theconcentrations of NO3
� , NO2� and NH4
þ , the presence of H2S,and the quantity and quality of organic carbon (OC) may favourone pathway over the other1,11–15. Thus, the fraction (%) of totalN2 production attributable to anammox (ra) is variable acrossenvironmental gradients1,12. Shallower locations that receivehigher and more labile OC loads favoured denitrification, whilemore stable and organic-poor sites, situated deeper than 700 m,exhibited ra of at least 67%, albeit with lower absolute rates ofboth potentially competing processes14. NO3
� concentrationsoften correlate positively with ra, although multipleenvironmental factors in concert, including sediment reactivity,can explain ra better than any one sole factor15. Temperaturemay also have a regulatory role for the two processes sincethe optimum temperature for polar-adapted denitrifying bacteriais 20–25 �C, while the optimum temperature for polar-adaptedanammox bacteria is lower, at 9–12 �C (refs 16,17). Whilethese data suggest that anammox may have a competitiveadvantage in perennially cold Arctic sediments, results fromtemperature block experiments showed ra at 2.5 �C was onlyB22% (ref. 16).
Abiotic environmental factors do not control biogeochemistryentirely. Biogeochemical processes can be enhanced by theactivities of bioturbating and tube-dwelling sediment infauna18.Since burrows effectively increase the sediment-water interface,
and some infauna actively ventilate their burrows subsequentlyamplifying solute exchange, bioirrigation can enhancedenitrification rates two to fivefold18–20. While abundance oftube dwelling organisms can suffice to describe bioturbationeffects20, a useful index of potential bioturbation (BPc)incorporates species abundance, biomass, mobility andsediment reworking mode into one metric21.
The Chukchi Sea is considered the Pacific ‘gateway’ sea to therest of the Arctic Ocean, serving as one of two connections to theglobal ocean. Through the Bering Strait, the Chukchi Sea receivesnortherly advected deep Pacific water containing relatively highconcentrations of NO3
� , which subsequently fuel some of thehighest primary production in all of the Arctic22,23. A largefraction of this primary production is deposited onto sediments,ultimately supplying food for benthic macrofaunal andmicrobial food webs24,25. The Hanna Shoal region is anecological hotspot since currents eddy around the shoal anddeposit organic matter to the seafloor26–28. The northeastChukchi Sea Shelf, which may contain 4100 billion barrels ofoil and 42.8 trillion m3 of natural gas, is an area of possiblefuture development29. Understanding the biogeochemicalfunction of the area is urgent. Relatively high rates ofdenitrification were measured in the neighbouring Bering Seashelf, which suggests that cold, high latitude sediments can havean important role in nitrogen cycling and ultimately modulateglobal elemental cycles30.
The goal of this research was to quantify denitrification,anammox, DNRA and nitrogen fixation rates simultaneously insediments near Hanna Shoal in the Chukchi Sea, and then relatethe interstation variability of these rates to environmental factorsthat may facilitate and regulate the processes along the shelf.Previous measurements of the net N2 flux from sedimentsindicate that Chukchi Sea sediments are a sink for bioavailablenitrogen31–33. However, without using 15N isotope additionexperiments, these studies could not simultaneously measuremultiple pathways, distinguish denitrification from anammox, ordistinguish denitrification fuelled by NO3
� from the watercolumn versus nitrification within the sediments. Furthermore,quantifying the recycling pathway of DNRA elucidates thedegree that sediments contribute DIN for primary productionversus serve as a net sink of nitrogen. These four nitrogentransformation processes have seldom been measuredsimultaneously, and never in the Arctic34–36. To our knowledgeonly denitrification rates have been reported in the Chukchi Sea,and DNRA rates have not yet been reported anywhere in theArctic at detectable levels. Here we show that denitrification is themajor removal pathway in the Chukchi Sea, dominatinganammox and DNRA, while nitrogen fixation was undetectable.The nitrogen cycling rates are highly correlated with BPc, whereaswe found no relationship with abiotic factors. Extrapolating ourresults, we argue that Arctic shelves have a significant role in theglobal nitrogen cycle.
ResultsSite characteristics. Physio-chemical characteristics of samplingstations were relatively uniform across stations (Table 1).Sampling stations (Fig. 1) ranged between depths of 41 and 66 m.Bottom water temperatures (� 1.7 to � 1.6 �C) and salinities(32.7–32.8) were similar across all stations. Surface (0–2 cm)sediment C:N ratios ranged between 8.2 and 9.6. Sediment OCconcentration spanned 0.65–1.79%, whereas total nitrogenconcentration ranged between 0.09 and 0.23%. Porewater NH4
þ
(0–5 cm) ranged from the lowest concentrations at CBL13(38.7±2.1 mM) to the highest concentrations at CBL11(85.5±35.2 mM). Ambient NO3
� concentrations of bottom waterranged between 4.7 and 6.8 mM, while NH4
þ concentrations were
ARTICLE NATURE COMMUNICATIONS | DOI: 10.1038/ncomms13145
2 NATURE COMMUNICATIONS | 7:13145 | DOI: 10.1038/ncomms13145 | www.nature.com/naturecommunications

lower, between 1.4 and 2.6 mM. Dissolved oxygen content ofbottom water reflected well oxygenated water, ranging from 74.3to 83.9% saturation.
Biogeochemical rates. Using the isotope pairing technique allowsus to report all nitrogen transformation processes in terms ofthe ambient 14N rates37, which is critical for two reasons: first,they reflect in situ rates of the study area and are not influencedby the addition of 15N tracers, and second, the different ratesare intercomparable. Denitrification, anammox and DNRA arereported, respectively, as D14, A14 and DNRA14.
D14 exhibited interstation variability across Hanna Shoal. Thelowest rates (mean±s.e.m.) were measured at H29(4.5±0.5 mmol N m� 2 h� 1), while CBL13 had the highest rateof 20.4±3.0 mmol N m� 2 h� 1 (Table 2, Fig. 2a). Across all fivestations, the mean D14 rate was 9.3±6.3 mmol N m� 2 h� 1. NO3
�
produced from sediment nitrification fuelled 58–92%of denitrification (Dn; Table 2, Fig. 2b). Although rates of
denitrification of the 15NO3� tracer (D15) are not
reflective of in situ denitrification, they do show potential deni-trification capabilities of the denitrifying microbial community38.D15 and D14 were correlated (r2¼ 0.81), thus D15 mirroredD14 rates in that the lowest rates (1.5±0.5 mmol N m� 2 h� 1)were measured at H29, whereas the highest rates(20.4±3.5 mmol N m� 2 h� 1) were observed at CBL13(Table 2). Therefore, total potential denitrification(Dtot¼D14þD15) peaked at 40.8 mmol N m� 2 h� 1 in CBL13sediments. A14 rates were one to two orders of magnitudelower than D14. The mean A14 rate across stations was0.22±0.02 mmol N m� 2 h� 1 (Table 2, Fig. 2c). A14 contributedbetween 1.4±0.1 to 3.2±1.1% of total N2 production (Fig. 2d).The highest ra values were observed where D14 was lowcompared with other stations. DNRA14, like A14, was one totwo orders of magnitude lower than D14 (Table 2, Fig. 2e).The average DNRA14 rate across all stations was0.23±0.05 mmol N m� 2 h� 1. DNRA14 was not detectable
Table 1 | Summary of station characteristics.
CBL11 CBL13 H17 H29 H33
Date occupied (month/date/year) 8/2/2013 8/6/2013 8/4/2013 8/9/2013 8/10/2013Depth (m) 47 50 41 66 50Latitude (�N) 72.1033 71.2982 71.9913 71.9286 71.8228Longitude (�W) 165.4556 161.6887 163.3834 158.3279 159.6097Sediment C:N (mol:mol) 8.2 9.0 8.2 8.6 9.6Sediment OC (%) 0.90 1.79 0.65 1.51 1.24Sediment TN (%) 0.14 0.23 0.09 0.21 0.15Porewater NH4
þ (mM) 85.5±35.2 38.7±2.1 70.5±6.8 61.6±3.8 76.5±7.7Bottom salinity 32.7 32.7 32.7 32.8 32.7Bottom temperature (�C) � 1.6 � 1.7 � 1.6 � 1.6 � 1.7Bottom NO3
� (mM) 5.2 4.7 5.1 5.5 6.8Bottom NH4
þ (mM) 2.6 1.6 1.7 1.4 2.4Bottom DO (% saturation) 83.9 74.3 82.8 79.2 75.5
Sediment C:N, organic carbon (OC), and total nitrogen (TN) for top 2 cm. Sediment porewater NH4þ (mean±s.e.m.) collected from top 5 cm (n¼ 2). Bottom water temperature, salinity, nutrients and
dissolved oxygen (DO) measured B3 m from seafloor.
HannaShoal
Barrow C
anyon
H33
H29H17
CBL13
CBL11
Barrow
Atqasuk
Point Lay
Wainwright
160° W165° W
72° N
71° N
70° N
0 10050 Kilometres
Study area
Bathymetry
Depth (m)
0
40
80
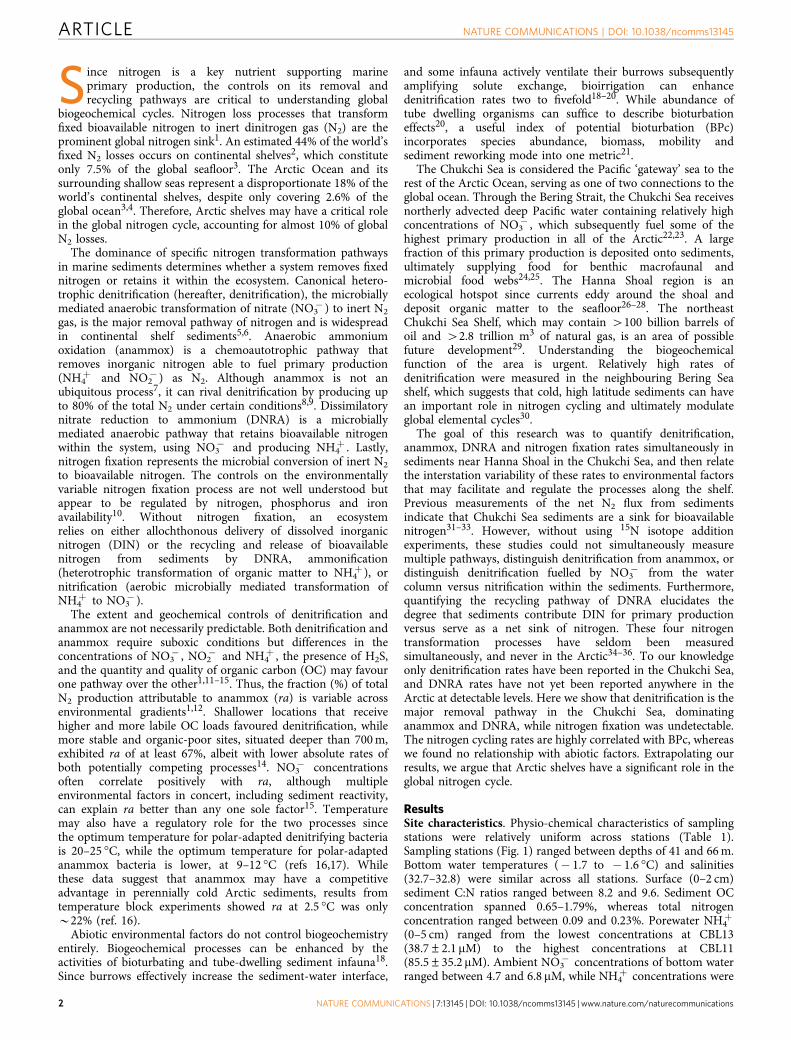
Figure 1 | Location of sampling stations in the northeast Chukchi Sea. Red circles represent the subset of stations from the Hanna Shoal Ecosystem Study
where cores were collected for nitrogen biogeochemistry experiments. Colour gradient represents bathymetry. Landmass (light green) is northwestern
Alaska, USA with villages labelled.
NATURE COMMUNICATIONS | DOI: 10.1038/ncomms13145 ARTICLE
NATURE COMMUNICATIONS | 7:13145 | DOI: 10.1038/ncomms13145 | www.nature.com/naturecommunications 3

during some sampling events, but was also as high as0.80 mmol N m� 2 h� 1 at CBL13. The mean sedimentoxygen demand (SOD) from dark incubations was� 290.8±33.3 mmol O2 m� 2 h� 1 (Table 2, Fig. 2f). Thisestimate varied across stations where the highest rates measuredat H33 were more than five times greater than the lowest rates,which were observed at H29. Nitrogen fixation was not detectedat any station.
Relationship between rates and environmental variables. Thesampling design of this study conserved several environmentalfactors that can control nitrogen transformations. Temperature,salinity, depth and latitude were uniform across the sampledstations and could not drive heterogeneous interstation variabilityof D14 (Table 1). Bottom water NO3
� , NH4þ and dissolved
oxygen concentrations, porewater NH4þ concentrations and
sediment carbon lability indicators (OC content and C:N) were
Table 2 | Station summary of biogeochemical rates.
Station n D15 D14 Dn (rate) Dn (%) A14 ra DNRA14 SOD
CBL11 6 7.8±0.5 7.3±0.4 5.5±0.3 75±0.4 0.24±0.03 3.2±0.4 0.09±0.06 � 207±7.2CBL13 4 20.4±3.5 20.4±3.0 16.1±2.2 79±0.7 0.29±0.05 1.4±0.1 0.53±0.18 �436±49.5H17 6 6.9±1.1 5.2±0.7 3.6±0.5 69±3.1 0.15±0.02 2.9±0.4 0.25±0.13 � 230±17.1H29 4 1.5±0.5 4.5±0.5 4.1±0.4 92±2.3 0.10±0.04 2.4±1.6 0.11±0.12 � 102±26.8H33 4 18.6±4.0 11.7±1.8 6.7±0.9 58±3.6 0.33±0.08 3.2±1.1 0.18±0.09 � 548±28.4
Rates (mean±s.e.m.) of denitrification of 15NO3� (D15), denitrification of 14NO3
� (D14), the proportion of D14 that is coupled to nitrification (Dn), anammox (A14), proportion of N2 produced byanammox (ra), dissimilatory nitrate reduction to ammonium (DNRA) and sediment oxygen demand (SOD). D15, D14, Dn (rate), A14 and DNRA14 expressed as mmol N m� 2 h� 1. SOD is expressed asmmol O2 m� 2 h� 1. Dn(%) and ra are percentages.
a
0
5
10
15
20
CBL11 CBL13 H17 H29 H33
Station
D14
(µm
ol N
m−2
h−1
)
c
0.0
0.1
0.2
0.3
0.4
CBL11 CBL13 H17 H29 H33Station
A14
(µm
ol N
m−2
h−1
)
f
−600
−400
−200
0
CBL11 CBL13 H17 H29 H33
Station
SO
D (
µmol
O2
m−2
h−1
)
e
0.0
0.2
0.4
0.6
CBL11 CBL13 H17 H29 H33
Station
DN
RA
14 (
µmol
N m
−2 h
−1)
b
0
5
10
15
CBL11 CBL13 H17 H29 H33
StationD
n (µ
mol
N m
−2 h
−1)
d
0
1
2
3
4
CBL11 CBL13 H17 H29 H33Station
ra (
%)
Figure 2 | Biogeochemical rates from sampling stations. Rates (mean±s.e.m.) of (a) Denitrification of 14NO3� (D14), (b) amount of D14 fuelled by
nitrification-derived NO3� (Dn), (c) anammox (A14), (d) proportion of N2 produced by A14, (e) dissimilatory 14NO3
� reduction to NH4þ (DNRA14)
and (f) sediment oxygen demand (SOD). Note different y axis scales.
ARTICLE NATURE COMMUNICATIONS | DOI: 10.1038/ncomms13145
4 NATURE COMMUNICATIONS | 7:13145 | DOI: 10.1038/ncomms13145 | www.nature.com/naturecommunications

variable among stations but showed no significant trends withany biogeochemical process rates (Table 3).
DiscussionDenitrification was the dominant nitrogen removal process, withrates exceeding anammox at all stations during summer sampling(Fig. 2a,c). Such low ra (1.4±0.1 to 3.2±1.1%) for the study areamight be explained by examining the sources of OC to thesediment. During the spring and summer in the Chukchi Sea, alarge fraction of the high primary production reaches the seafloorungrazed as a seasonal pulse22,39. This labile carbon source fuelsthe benthic food web, including heterotrophic microbial processeslike denitrification. Paradoxically, an unremarkable standingstock of OC (0.65–1.79%), though typical of Arctic shelves40,41,was observed at the time of sampling. Standing stock mayhave poorly assessed the dynamic delivery and subsequentbreakdown of organic matter on the seafloor given therelatively high rates of oxygen consumption (Fig. 2f).Regardless, the seasonally high organic matter deposition likelybenefits denitrifiers over anammox bacteria in summer monthssince denitrification typically favours sites with higher OCdelivery versus anammox, which tends to occur in organic-poorconditions8,42,43. Anammox may be more prevalent down-slopeor in the Arctic Ocean basin at deeper depths where organicmatter delivery is more attenuated44 and where denitrificationoccurs at lower rates32, following the trend of ra observed in othershelf-slope transects14; however, further studies are required tovalidate this hypothesis. Previous research suggests that net N2
flux from sediments did not change significantly between ice-freeand ice-covered seasons on the Alaskan Arctic continental shelf,indicating a lack of seasonality in the process32,40. How ra mightvary over an annual cycle as OC quantity and quality change inthe Arctic is unknown. Macrofauna subsist year-round fromthe intense and seasonally pulsed primary production sincepolar shelf sediments are long-term repositories of organicmatter25,45. Perhaps the microbial food web maintainsconsistent year-round levels of activity from this ‘food bank’.
DNRA, which is hypothesized to favour organic-richsediments42, may not be prevalent in Chukchi Sea shelfsediments that typically have o2% OC content23. Previousattempts by Gihring et al.41 were unable to measureDNRA at detectable levels in Svalbard fjords in summer(depth¼ 51–211 m, temperature¼ 1–2 �C, 0.30–1.45% OC). Wepresent here the first measurable rates of DNRA in the Arctic,albeit all were o1 mmol N m� 2 h� 1. Others have suggested thattemperature appears to be important for DNRA, as temperaturemodulates sediment oxygen consumption that ultimatelyprovides a favourable anoxic environment34,46. Although
DNRA has been reported as the primary NO3� reduction
pathway in tropical estuaries7 and negligible in coldsediments47, a linear temperature gradient cannot solely explainits global prevalence. For example, only one-third of studies intemperate marsh and tropical mangrove systems report DNRArates that exceed denitrification, which suggests other factorsbesides temperature have a role in its variability48. A high ratio ofOC versus NO3
� availability has been useful in predicting DNRAprevalence42,43,48, but not without exceptions. DNRA dominateddenitrification in hypoxic sediments in the Baltic Sea, wheresediment organic matter was low compared with relativelyhigh NO3
� concentrations49. Large salinity fluctuations can alsofavour DNRA over denitrification38,50. At our study site, lowsediment OC accumulations, year-round NO3
� availability inbottom waters, and a lack of drastic salinity changes likelycontrolled DNRA rather than temperature since SOD was high.Still, denitrification was one to two orders of magnitude greater,and DNRA does not appear to be quantitatively important in theHanna Shoal sediments.
No nitrogen fixation was detected in the Chukchi Seasediments. Some fixation is photoautotrophic, which would haveceased in our dark incubations. Low rates of nitrogen fixation,measured by acetylene reduction, occurred in Arctic continentalshelf sediments including 0.24 mmol N m� 2 h� 1 in the CanadianBeaufort Sea51, 0.04–0.33 mmol N m� 2 h� 1 in Elson Lagoon inthe Alaskan Beaufort Sea52, and 0–0.83mmol N m� 2 h� 1 inSvalbard fjords41. In comparison to N2 production, these rates areinconsequential. For example, the highest nitrogen fixation ratesreported by Gihring et al.41 were only B6% of the combined N2
production they measured from denitrification and anammox.High water column primary production in the Chukchi Sea is
driven by NO3� upwelled from the deep Pacific Ocean onto the
Bering Shelf and advected northward through the Bering Strait22.Yet the possibility of sediments recycling DIN for primaryproduction remained plausible. Sediments contributed littleNH4
þ to the water column via DNRA (Fig. 2e), but the amountof NH4
þ contribution from sediment remineralization was nottested and could be a source of DIN to the overlying water.Hanna Shoal sediments were a strong sink of nitrogen withdenitrification dwarfing DNRA. This corroborates observationsfrom the few other studies that have examined nitrogen cyclingin the Chukchi Sea, which showed a net N2 loss fromsediments31–33. We refrain from directly comparing ourdenitrification data to rates from these previous studies thatused different methodology. The isotope pairing techniqueconsistently produces rates that are less than those measured byN2:Ar flux, especially where bioturbation is prominent53;therefore, direct comparison would be misleading. Regardless ofcomparability, all measurements from multiple studies in theChukchi Sea converge on the same overall trend that thesediments are strong sinks for fixed nitrogen.
A large fraction of NO3� that is denitrified to inert N2 is
coupled to nitrification (Dn) of porewater NH4þ (Table 2). Given
moderately high porewater NH4þ concentrations and low bottom
water NO3� concentrations (Table 1), we demonstrate that at
least half of the DIN that fuels denitrification is from organicmatter remineralization and subsequent nitrification in thesediments, and not from the water column NO3
� that couldpotentially fuel primary production. Although we did notmeasure it directly, sediment nitrification must be relativelyactive given that Dn, which hinges on nitrification to provideNO3
� , was 58–92%.While our sampling stations spanned the northeast Chukchi
Sea shelf near Hanna Shoal, many environmental parameters thathave been reported to affect nitrogen cycling (for example,temperature, salinity, depth, season) were uniform and could not
Table 3 | Pearson correlation matrix relating stationcharacteristics to biogeochemical process rates.
D14 A14 DNRA14 SOD Dn (%)
BPc 0.97 0.59 0.95 0.66 �0.09Total abundance 0.95 0.56 0.97 0.64 �0.11Polychaete abund. 0.92 0.43 0.95 0.46 0.14Total biomass 0.78 0.94 0.54 0.99 �0.72Species richness 0.86 0.44 0.98 0.62 �0.14
Reported numbers are correlation coefficients (r-values). Bold values are correlations wherePo0.05. BPc, community-wide bioturbation potential; Total abundance, mean infaunalabundance; D14, denitrification of 14NO3
� ; A14, anaerobic 14NH4þ oxidation; DNRA14,
dissimilatory 14NO3� reduction to NH4
þ ; SOD, sediment oxygen demand; Dn, proportion of D14
fuelled by sediment nitrification. The following parameters were tested, but were notsignificantly correlated with biogeochemical rates: bivalve abundance, amphipod abundance,C:N ratio of sediment (0–2 cm), sediment organic carbon concentration, site depth,temperature, porewater ammonium concentration, and bottom water nitrate, ammonium anddissolved oxygen concentrations.
NATURE COMMUNICATIONS | DOI: 10.1038/ncomms13145 ARTICLE
NATURE COMMUNICATIONS | 7:13145 | DOI: 10.1038/ncomms13145 | www.nature.com/naturecommunications 5

control the variation in biogeochemical rates (Table 1).Temperature in the incubation chamber was maintained at4 �C, which was slightly warmer than the in situ seafloortemperature. While this could increase the biogeochemical rates,though not likely the partitioning between pathways, theinterstation rate differences were not temperature-induced.Moreover, some parameters that were variable among stations(for example, C:N, bottom water NO3
� , porewater NH4þ ) showed
no correlation with nitrogen transformation and oxygen demandrates (Table 3).
Organic matter stoichiometry (that is, elemental C:N ratios) isa strong predictor of ra in oxygen-deficient zones (ODZs) in theopen ocean where anammox is likely NH4
þ limited13. Since labileorganic matter (exhibiting lower C:N ratios) will yield moreNH4
þ than more refractory organic matter (exhibiting higherC:N ratios) upon heterotrophic breakdown, Babbin et al.13
demonstrated that ra was directly related to organic matterstoichiometry. It is difficult to directly compare the results of thecurrent study, which presents coarse measures of sediment C:Nratios (0–2 cm, Table 1) amalgamating the organic-rich surfacesediments with the narrow horizon of the nitrate reduction zone,to the trends reported by Babbin et al.13. Sediments may alsoviolate some of the assumptions made in using organic matterstoichiometry to predict ra. Unlike ODZs, in sediments there isoften incomplete oxidation of organic matter, NH4
þ canaccumulate in porewater (Table 1), and NH4
þ produced in thenitrate reduction zone can be advected into the oxic nitrificationzones or efflux into the overlying water. While our experimentaldesign did not explicitly test if the same controls on ra in ODZsapply to sediments, they are likely more related to alternativeenvironmental controls such as temperature15, NO2
� and NO3�
availability15,16, or sulfide concentration11,12 given appreciableconcentrations of porewater NH4
þ in sediments. Lastly, thepresence of benthic infauna could further alter the stoichiometryof sediment organic matter in unpredictable ways by altering thequality and quantity of OC and either concentrating or removingDIN from the nitrate reduction zone.
Because abiotic factors did not correlate with nitrogentransformation processes, biotic factors instead were explored asregulators, specifically infaunal bioturbation since it has pre-viously been shown to enhance P (ref. 54) and N (refs 20,55,56)cycling in other benthic ecosystems. Infauna were collected andcatalogued for a parallel research component of the Hanna ShoalEcosystem Study following the methodology described by
Schonberg et al.27. Infaunal abundance and biomass datapublicly available at http://arcticstudies.org/hannashoal/index.html(summarized in Supplementary Table 1) were explored as factorsthat might correlate with nitrogen transformation rates, and thenwere used to calculate a community index of potential bioturbation(BPc) for each station21. The BPc index weighs the abundance andbiomass of bioturbating organisms higher than those that do notmodify the sediment. Infauna abundance and biomass correlatedhighly with D14, A14, DNRA14 and SOD rates within our study site(Table 3, Fig. 3). BPc showed the strongest relationship with D14 andDNRA14 (r¼ 0.97 and 0.95, respectively) of all parametersmeasured. Polychaete abundance correlated with D14 and DNRA14
(r¼ 0.92 and 0.95, respectively), although total abundance had astronger relationship with the two processes (r¼ 0.95 and 0.97,respectively). A14 and SOD correlated with infaunal biomass(r¼ 0.94 and 0.99), but not abundance. SOD co-varied with A14
(Po0.05, r¼ � 0.91), suggesting anammox was most active in theleast oxic sediments, possibly modulated by fauna respiration.Bivalve and amphipod abundance alone did not significantly relateto any processes.
The strikingly high infauna abundance at CBL13 was driven bythe tube-dwelling polychaete Maldane sarsi, with densities of5,057±484 individuals m� 2, whereas the only other stationcontaining M. sarsi was H17 at a density of 3.3±5.8individuals m� 2 (Supplementary Table 1). The dense populationof the tubicolous polychaete M. sarsi at CBL13 physicallyamended the habitat for denitrifying and DNRA microbes(Supplementary Fig. 1). The tubes themselves functionallyincreased the sediment-water interface surface area, thus, creatingmore volume of sediment where denitrification or DNRA couldoccur. The tubes also acted as ventilated conduits for soluteexchange, which would accelerate the delivery of either NO3
�
from the water column to fuel DNRA and direct denitrification(Dw), or conversely, oxygen to fuel nitrification for Dn (refs 19,20).Since Dn was relatively high (58–92%), we postulate that infaunaincreased oxygen transportation and subsequently facilitatednitrification. The link between nitrification and fauna has beenobserved in the southeastern Chukchi Sea where relativelyhigh rates of sediment nitrification (41.7–50.0mmol N m� 2 h� 1)occurred in bivalve-dominated sediments relative tofauna-depauperate sediments57.
Top-down feeding polychaetes (for example, M. sarsi)consume oxygen in the sediment, expanding conduciveconditions for the suboxic processes of denitrification and
30
25
D14
(µm
ol N
m−2
h−1
) 20
15
10
5
0CBL11 CBL13 H17 H29 H33
0
2,000
Abu
ndan
ce (
ind.
m−2
) or
BP
c (0
.1 m
−2)
4,000
6,000
8,000
D14Total abundanceAmphipodaBivalviaPolychaetaBPc
Figure 3 | Station denitrification rates overlain by infauna abundance and bioturbation potential. Mean (±s.e.m.) abundance and index of potential
bioturbation (BPc) compared with denitrification (D14) rate at each station. Total infaunal abundance and BPc were calculated from all taxa collected at each station.
ARTICLE NATURE COMMUNICATIONS | DOI: 10.1038/ncomms13145
6 NATURE COMMUNICATIONS | 7:13145 | DOI: 10.1038/ncomms13145 | www.nature.com/naturecommunications

DNRA. Polychaete organic-rich secretions (for example, mucus,feces) are typically labile and converted readily to NH4
þ to bolsternitrification58. At stations H17 and H33, bivalves representedB70% of the total infauna abundance (Fig. 3, SupplementaryTable 1). In this case, activities associated with bivalve depositfeeding, not the physical presence of tubes, enhanceddenitrification. Therefore, a specific taxonomic group may notaffect rates as much as the abundance and biomass of seafloor-modifying organisms. A recent study has demonstrated thatbioturbation from meiofauna (invertebrateso1 mm) doubleddenitrification rates, and the additive effects of both meiofaunaand macrofauna enhanced DNRA and methane efflux56.Moreover, macrofaunal injection of organic-rich biodeposits(feces and pseudo-feces) enhance heterotrophic denitrificationby providing additional carbon substrate for heterotrophicprocesses59.
While the infaunal bioturbation index (BPc) was the strongestcorrelating factor in our study, it is possible that the trend is notubiquitous throughout the entire Chukchi Sea. For example,
Braeckman et al.55 recently showed that infaunal abundance wasa crucial predictor of biogeochemical processes at some sites inthe North Sea, while abiotic factors were more important inmuddy sediments.
To compare our measured rates of D14, A14 and DNRA14 toother systems globally, mean rates (with standard deviations ifgiven) were plotted against the temperature at which they werecollected, or incubated if provided (Fig. 4a, SupplementaryTable 2). In order to make meaningful comparisons, our literaturereview only included marine studies where sediment was notexperimentally amended except for the addition of 15N tracers,and denitrification rates were expressed as D14 (refs 37,60). Ifstudies reported rates on a volume or mass basis, they could notbe directly compared with our areal rates, but their proportions ofNO3
� reduction were deemed valid for comparison (Fig. 4b). TheD14 rates from the Chukchi Sea sediments fell within the range ofthe literature surveyed (Fig. 4a). Rates from our high latitudestudy and those from work conducted in Svalbard (B80 �N,0–2 �C) demonstrated that perennially cold Arctic shelves are atleast as important for denitrification as continental shelves inlower latitudes. A14 and DNRA14 rates were all relatively low inthe literature surveyed but of similar magnitude to the ChukchiSea rates, and no discernible trend with temperature wasapparent. There was an indication that ra can have an inverserelationship with temperature (Fig. 4b) as demonstrated by Brinet al.15, but there are many instances where ra was low at lowtemperatures. Comparatively, the Hanna Shoal region wasconsistently dominated by denitrification, with low ra andrelative DNRA proportions. Temperature block experimentshave demonstrated that denitrification rates of Arctic-adaptedmicrobes are highest at temperatures between 20 and 25 �C(ref. 17), but many other factors in situ can regulate the process.Thus, in the literature surveyed there is no clear temperatureregulation of denitrification, anammox, or DNRA. This evidencesuggests that temperature is not a limiting factor for nitrogencycling, and the disproportionately large continental shelf areasurrounding the Arctic Ocean is important for global modulationof elemental cycling.
Biogeochemical rate measurements are logistically complexand time-consuming, and often a few stations must represent anexpansive area. However, exploring correlative parameters canhelp reduce the error associated with interpolating data within astudy area by providing a finer resolution to estimate the process.For example, in their study that transected shelf, slope and basin,Chang and Devol32 derived a relationship between net N2 flux,depth and export production for the Chukchi Sea, andextrapolated the relationship to each Arctic sea to estimate aglobal contribution of 4–13% for Arctic denitrification. Theauthors emphasize the potential role of the Arctic Ocean in globaldenitrification and the need for much greater spatial andtemporal coverage of nitrogen cycling measurements.
Similarly, this current study faced a common challenge inscaling up measurements to the entire region. We utilized thestrong significant relationship between D14 rates and BPc(Po0.01, r¼ 0.97; Table 3) measured at Hanna Shoal toextrapolate our rates to the region. Calculating BPc across thenortheast Chukchi Sea was accomplished by utilizing data frompast multi-disciplinary, multi-year projects in the northeastChukchi Sea, where 4100 benthic stations were occupied,many of which include infauna abundance and biomass(http://www.arcticstudies.org). Using this previously reporteddata, we calculated BPc at over 50 stations and used the linearregression derived from our stations (D14¼ 0.0026�BPcþ 4.76)to predict D14 rates across the Chukchi Shelf as a spatiallyheterogeneous surface (Fig. 5). This approach alleviates the needto coarsely estimate an area’s denitrification contribution by using
30
25
20
15
10
5
0
0 10 20 30
Relative DNRA
Relative DNRA (this study)ra (this study)
40
35
30
25
20
15
10
Incu
batio
n te
mpe
ratu
re (
°C)
Incu
batio
n te
mpe
ratu
re (
°C)
5
0
0 20 40 60 80 100
ra or relative DNRA (%)
Rate (µmol N m−2 h−1)
ra
DNRA14
A14
D14
DNRA14 (This study)
D14 (This study)
A14 (This study)
a
b
Figure 4 | Survey of nitrogen transformation rates and ratios from
literature and this study plotted by temperature. (a) Rates of
denitrification (D14, circles), anammox (A14, triangles) and DNRA14
(squares), and (b) the proportion of anammox compared with total N2 flux
(ra) (triangles) or proportion of NO3� that underwent DNRA14 compared
with denitrification (squares) plotted by temperature. Rates from this study
(black symbols) were compared with surveyed literature. References and
values are listed in Supplementary Table 2. All values were determined
using the isotope pairing technique37,60. Rates and proportions are mean
values and error bars are s.d., if provided.
NATURE COMMUNICATIONS | DOI: 10.1038/ncomms13145 ARTICLE
NATURE COMMUNICATIONS | 7:13145 | DOI: 10.1038/ncomms13145 | www.nature.com/naturecommunications 7

a mean rate, which not only neglects the spatial variability of D14
but may severely overestimate or underestimate the ratesextrapolated across the study area.
Three different techniques were compared to estimate regionalbiogeochemistry and to demonstrate the advantage of correlatingbiogeochemical rates with other parameters (Table 4). First, weused the mean (±s.d.) rate derived from our five occupiedstations (9.25±6.27 mmol N m� 2 h� 1) to extrapolate D14 acrossthe study area (65,500 km2). For the second and third approaches,we used the relationship between D14 and BPcto estimate denitrification at 51 additional stations in thenortheastern Chukchi Sea. An interpolated, binned surface ofdenitrification rates (Fig. 5) was created by empirical Bayesiankriging. The second technique used the mean rate within each binas a representative rate for the designated area. The sum of allbins was used as an integrated estimate of D14 for the entire studyarea based on BPc. For the third technique, a randomly generatednumber within the specified range of each bin was assigned toeach m2 and summed across the area. This process was repeatedfor 100,000 iterations to obtain a mean rate.
The third technique produced a notably different estimate thanTechnique 1 and greatly reduced the uncertainty in theestimation (Table 4). If we assume that the strong relationshipbetween D14 and BPc occurs throughout the northeasternChukchi Sea, then we would expect lower denitrification inmuch of the western part of the region since infauna abundance
and biomass, thus BPc, were lower there than in the easternregion of the study area (Fig. 5). The region southeast of HannaShoal and near the mouth of Barrow Canyon were predicted byour model to have the highest denitrification rates in thenortheast Chukchi Sea due to the high benthic abundance ofinfauna, but spatially it is a small portion of the study area. Thus,in the first technique the higher rates measured at CBL13represent one-fifth of the area and are equally weighted againstthe low rates measured at H29. In the third technique, the highrates (420 mmol N m� 2 h� 1) only represented B5% of thestudy area, whereas rates o5.3 mmol N m� 2 h� 1 are predicted tooccur at B60% of the seafloor. This exercise provides both ageographic distribution of potential denitrification activity and abetter-approximated regional rate where little experimentaldata exist.
A major caveat for this procedure lies in the simplifyingassumption that D14 is equally related to BPc across the entirenortheast Chukchi Sea, since it has been demonstrated that thestrength of the relationship between BPc and biogeochemicalrates may vary over an entire region55. Infaunal abundanceintegrates various important ecosystem drivers (for example,primary production, hydrography, sediment type) making itsufficiently robust to represent the complexities across an entirecontinental shelf. BPc may not be a globally transcendentpredictor of denitrification, but was by far the most importantfactor in our study (Table 3), although all parameters should be
!
!
HannaShoal
Barrow C
anyon
Barrow
Atqasuk
Point Lay
Wainwright
160° W165° W
72° N
71° N
70° N
1000 50 Kilometres
Infauna stations
Predicted D14 rate(µmol N m–2 h–1)
4.9 – 5.96 – 7.98 – 10.210.3 – 12.412.5 – 15.315.4 – 1919.1 – 25.3
Figure 5 | Predicted denitrification rates in the northeast Chukchi Sea. Interpolated surface using empirical Bayesian kriging for predicted denitrification
rate (D14) across the northeast Chukchi Sea using the relationship D14¼0.0026�BPcþ4.76. Infaunal abundance and biomass data were collected at all
plotted stations for the calculation of a community-wide index of potential bioturbation (BPc).
Table 4 | Three techniques used to estimate the annual denitrification rate from the study site.
Technique Correlation variablewith D14
Spatial analysis Modelling approach Mean annual D14 rate(Gmol N yr� 1 study site area� 1)
1 None; used mean D14
for all stationsNone; used study area as a whole Propagated error 5.30±3.60
2 BPc for 51 stations Empirical Bayesian kriging; 7 bins Propagated error 4.65±0.163 BPc for 51 stations Empirical Bayesian kriging; 7 bins Randomly generated rates in each
bin for 100,000 iterations4.04±0.001
ARTICLE NATURE COMMUNICATIONS | DOI: 10.1038/ncomms13145
8 NATURE COMMUNICATIONS | 7:13145 | DOI: 10.1038/ncomms13145 | www.nature.com/naturecommunications

considered when creating relationships between rates and bioticor abiotic factors15,55.
Using the lowest and highest rates of denitrification wemodelled for the northeastern Chukchi Sea (Fig. 5) as boundsfor rates possible in Arctic shelves, a range of annual denitrifica-tion was extrapolated for the entire Arctic shelf area(5.052� 106 km2). Multi-seasonal work has indicated no differ-ence between summer and winter/spring denitrification32,40,so we assume the rates here are maintained over the course ofa year. Annual rates for the Arctic shelves were constrainedbetween 2.8 and 15.7 Tg N yr� 1, which account for between0.5 and 2.7% of global denitrification (573 Tg N yr� 1; ref. 2).These annual rates account for 0.8 to 4.6% of marinedenitrification despite only covering 1.4% of the global ocean2,4.Rates measured by the isotope pairing technique are often lowerthan those quantified by net N2 flux methods61, so these estimatesare conservative compared with approaches that use the lattermethodology. The higher range predicted here overlapswith other trans-Arctic annual denitrification estimates(6–29 Tg N yr� 1; ref. 32). Although these estimates arerelatively coarse due to the paucity of actual sampling that hasoccurred in the Arctic, the results indicate that the Chukchi Sea isan active site of nitrogen cycling, and we suspect that the rest ofthe Arctic shelves might exhibit a similar range of rates. Sincethere was no discernible difference between denitrification ratesin the Arctic compared with lower latitudes (Fig. 4a) and sinceArctic shelves constitute almost 20% of global continental shelves,the perennially cold shallow shelves surrounding the ArcticOcean should be recognized for their potentially critical role inthe global nitrogen cycle.
MethodsStudy site and sample collection. These experiments were a component of theHanna Shoal Ecosystem Study in the northeastern Chukchi Sea, Alaska(www.arcticstudies.org/hannashoal). Samples were collected between 2–10 August2013 aboard the USCGC Healy at five stations that spanned Hanna Shoal from158.3� W to 165.5� W but were latitudinally constrained between 71.3� N and72.1� N (Fig. 1). Six intact cores (7.6 cm diameter; 20 cm deep) were collectedfrom the seafloor of each station using a stainless steel HYPOX corer34 thatpreserved the integrity of the sediment-water interface. After collection, cores werestored in a 4 �C environmentally controlled chamber until the experiment began(o4 h). All samples were subjected to the same treatments. Sixty litres of near-bottom water (within 3 m) was collected from each station by conductivity-temperature-depth (CTD) rosette cast and aerated continuously.
Sediment core incubations. Cores were incubated shipboard in a 4 �Cenvironmentally controlled chamber to measure dissolved gas fluxes (28N2, 29N2,30N2, 32O2, 40Ar) and 15NH4
þ production at the sediment-water interface.Incubations were conducted in a flow-through system in which bottom water waspumped over cores using a multi-channel peristaltic pump that maintained1.0–1.4 ml min� 1 flow following Gardner and McCarthy34. An acetol plunger witha Viton o-ring was inserted into each core to B5 cm from the sediment-waterinterface, which leftB230 ml of overlying water. Polyetheretherketone (PEEK)tubing connected each plunger’s inlet port to unfiltered bottom water via a multi-channel peristaltic pump and the outlet port to a collection vessel. The 60 l ofbottom water was partitioned into three separate carboys so that one carboy fedtwo replicate cores. One carboy was enriched with 15N-NO3
� (98.2% 15N-KNO3)to final concentrations of 29.1–34.4 mM NO3
� depending on backgroundconcentrations (Table 1). The second carboy was spiked with 15N-NH4
þ (99.9%15N-NH4Cl) to final concentrations between 15.1–17.7 mM NH4
þ . The third carboywas left unamended as a control treatment. Cores were wrapped in aluminum foilto ensure darkness throughout the experiment.
Inflow and outflow samples were collected once every 24 h for 4 days after aninitial overnight pre-incubation to allow the experimental units to reachequilibrium. Samples for dissolved gases were collected in 13 ml Exetainers (LabcoLimited, United Kingdom) by allowing vials to overflow from the bottom threetimes, ensuring no air bubbles were captured. Each collected sample was injectedwith 200 ml of saturated ZnCl2 to halt microbial activity. Exetainers were capped,sealed with parafilm, and stored underwater at 4 �C. Approximately 30 ml ofoutflow water from the control and 15NO3
� treatment was collected to measure15NH4
þ production. Sample water was filtered immediately through a 0.2 mm filterinto a Whirl-pak bag and then frozen at � 20 �C. All samples were transported tothe University of Texas Marine Science Institute for analyses.
Benthic fluxes and nitrogen transformations. Duplicate samples for dissolvedgas concentrations (28N2, 29N2, 30N2, 32O2 and 40Ar) were measured usingmembrane inlet mass spectrometry62,63. Analytical replicates (n¼ 3) for dissolvedgases had a coefficient of variation o0.04%. H2O and CO2 were removedcryogenically in line with a liquid nitrogen trap before dissolved gas introduction tothe quadrupole mass spectrometer. The proportion of 15NH4
þ from the totalammonium pool was determined by ammonium isotope retention time shifthigh-performance liquid chromatography64. Duplicate samples were injected threetimes to measure average retention time shift in samples incubated with 15NO3
�
(coefficient of variationo5%). Dissolved gas and nutrient fluxes were calculated as
benthic flux mmol m� 2h� 1� �¼ Co �Cið Þ�F=A ð1Þ
where Co is the outflow concentration (mM), Ci is the inflow concentration (mM),F is the flow rate (l h� 1), and A is core surface area (m2). In this way, a positive fluxis out of the sediment into the water column, which we refer to interchangeably asproduction. Denitrification rates were calculated based on the relationship between14N-N2 and 15N-N2 production in the 15NO3
� treatments, following the isotopepairing technique37. Adding 15NO3
� increases overall denitrification rates, but theisotope pairing technique differentiates between denitrification of the added tracerand the in situ 14NO3
� . One of the major assumptions of the isotope pairingtechnique is that the added nitrate did not induce higher rates of 14NO3
�
denitrification by deepening the nitrate penetration depth in sediments. Testingthis assumption would require measuring rates at multiple nitrate concentrations.While this was logistically impossible for our project, the assumption is met inmost studies that use the isotope pairing technique at multiple nitrateconcentrations.
Denitrification of 15NO3� (D15) and 14NO3
� (D14) was calculated using theproduction of 29N2 (p29NO3
� ) and 30N2 (p30) from the 15NO3� treatment using the
equations
D15 ¼ p29NO3� þ 2 p30ð Þ ð2Þ
and
D14 ¼ D15�½p29NO3� =ð2�p30Þ�: ð3Þ
p29NO�3 was determined after removing the minor 29N2 contribution fromanammox (modified from Risgaard-Petersen et al.60; see Supplementary Methods).The proportion of in situ denitrification from the overlying water column nitrate(Dw) was determined with the following equation from Nielsen37:
Dw ¼ D15� 14NO�3� �
= 15NO�3� �
ð4Þ
The concentration of 14NO3� was determined from ambient bottom water, and
15NO3� was determined as the difference between NO3
� concentration after additionof 15N tracer and ambient levels. The remaining proportion of denitrification was,therefore, attributed to coupled nitrification-denitrification (Dn) and calculated as
Dn ¼ D14 �Dw ð5Þ
Total anammox (Atot) estimates were calculated from production of 29N2 in the15NH4
þ treatment (p29NHþ4) by
Atot ¼ p29NHþ4=FA ð6Þ
where FA is the ratio of 15NH4þ to total NH4
þ in the overlying water. We reportanammox as A14, or the contribution of 14NH4
þ and 14NO2� to anammox since the
15NH4þ tracer may induce higher than natural rates, using the equation
A14 ¼ Atot �A15 ð7Þ
where A15 equals p29NHþ4. This approach assumes that labelled ammonium is not
nitrified and subsequently denitrified (see Supplementary Methods). In the scenario ofnitrification–denitrification of 15NH4
þ , anammox rates would be overestimated sinceanammox and denitrification would produce 29N2.
Nitrogen fixation was measured using the procedure of An et al.62, which usesthe concentrations and fluxes of 28N2, 29N2 and 30N2 in the 15NO3
� treatment todetect simultaneous fixation in the presence of denitrification.
DNRA was calculated by measuring the production of 15NH4þ (p15NH4
þ ) fromthe 15NO3
� treatment. We report DNRA as:
DNRA14 ¼ p15NHþ4 =FN� �
� p15NHþ4 ð8Þ
where FN is the proportion of 15NO3� in the total nitrate pool65.
D14, A14 and DNRA14 are all conservative estimates of the true in situ rates sinceporewater, which could retain transformed nitrogen species, was not extractedfrom sediments. D14 also can underestimate denitrification in the presence ofbioturbators53, but we allowed for an overnight equilibration for 15NO3
� and15NH4
þ incorporation into the porewater and measured rates over 4 days.Furthermore, DNRA14 is conservative because cation exchange in sediments couldretain 15NH4
þ , and we did not extract porewater from the flow-throughexperimental design. By using terms that are standardized to the ambient 14Nconcentrations instead of those induced by the addition of the 15N tracer, the ratescan be compared as co-occurring processes.
NATURE COMMUNICATIONS | DOI: 10.1038/ncomms13145 ARTICLE
NATURE COMMUNICATIONS | 7:13145 | DOI: 10.1038/ncomms13145 | www.nature.com/naturecommunications 9

Sediment chemistry. Samples for surface sediment characterization were collectedseparately from each station by using a van Veen grab (0.1 m2). Samples forelemental C and N analysis were collected from the top 2 cm of sediment with a10 ml syringe barrel and immediately transferred to a container and frozen at� 20 �C. Two adjacent aliquots were sampled from the top 5 cm of undisturbedsediment by a 60 ml syringe barrel, placed in a Whirl-pak bag, and frozen at� 20 �C for sediment porewater NH4
þ analysis.To remove carbonates that would skew OC analysis, sediments were soaked in
1N HCl until bubbling stopped, then rinsed in deionized water and dried at60 �C to a constant weight. Sediment was analysed on an elemental analyser(CE Instruments, NC 2500). C:N values are presented as mol:mol ratios.
Nutrients. Samples for NO3� and NH4
þ concentrations from station bottom waterwere prepared using scaled down volumes of sample and reactants suitable for a96-well plate and read on a microplate spectrophotometer at 543 and 640 nm,respectively, following Mooney and McClelland66. NO2
� concentrations weredetermined by colorimetric spectrophotometric analysis67. NOx was measured afterCd reduction of NO3
� to NO2� following a modified procedure of Jones68. NO3
� isreported as the difference of NOx and NO2
� . NH4þ concentrations were measured
colorimetrically with the indophenol blue method69. To obtain samples forporewater NH4
þ , sediment was thawed and centrifuged while still cold at 5,000r.p.m. for 20 min. Supernatant was decanted and analysed on a ShimadzuUV-2401PC spectrophotometer.
Statistical analyses and data treatment. All statistics were computed using R 3.1.1(www.r-project.org). To ensure the isotope tracers had reached the zone of NO3
�
reduction after the overnight pre-incubation period, steady-state equilibrium wastested with a repeated-measures analysis of variance (lme function fromthe nlme package). For each station, dissolved gas or nutrient fluxes were thedependent variable, sampling time point was the group, and core was a random factor.The results underwent post-hoc tests using the glht function from the multcomppackage that performed multiple comparisons for linear mixed effects models usingTukey’s all-pair comparisons. Significantly different rates were excluded from analysissince they violated steady-state equilibrium assumptions. Before determining the ratesof A14 and DNRA14, we determined if the respective production of 29N2 and 15NH4
þ
was significantly higher than the control treatment using a one-way analysis of var-iance (aov function from the MASS package). A Pearson correlation matrix was cre-ated using mean rates and environmental parameters from each station by the rcorrfunction in the Hmisc package. Linear regressions were computed using the lmfunction from the MASS package. Values are reported as mean±s.e.m. For all tests,alpha was set at 0.05. Spatial analysis was completed in ArcMap 10.3 (Esri, Redlands,CA) using the Geostatistical Analyst Toolbox function empirical Bayesian kriging,which creates an interpolated surface by accounting for the error in estimating theunderlying semivariogram though iterative simulations70.
Data availability. The data that support the findings of this study are available athttp://arcticstudies.org/hannashoal or can be requested from N.D.M.
References1. Devol, A. H. Denitrification, anammox, and N2 production in marine
sediments. Ann. Rev. Mar. Sci. 7, 403–423 (2015).2. Seitzinger, S. et al. Denitrification across landscapes and waterscapes:
a synthesis. Ecol. Appl. 16, 2064–2090 (2006).3. Menard, H. W. & Smith, S. M. Hypsometry of ocean basin provinces.
J. Geophys. Res. 71, 4305–4325 (1966).4. Jakobsson, M. Hypsometry and volume of the Arctic Ocean and its constituent
seas. Geochem. Geophys. Geosystems 3, 1–18 (2002).5. Joye, S. B. & Anderson, I. C. in Nitrogen in the Marine Environment.
2nd edn (eds Capone, Douglas G., Deborah, Bronk A., Mulholland, Margaret R.& Carpenter, Edward J) 867–915 (Academic Press, 2008).
6. Devol, A. H. in Nitrogen in the Marine Environment (eds Capone, Douglas G.,Deborah, Bronk A., Mulholland, Margaret R. & Carpenter, Edward J) 263–301(Academic Press, 2008).
7. Dong, L. F. et al. Dissimilatory reduction of nitrate to ammonium, notdenitrification or anammox, dominates benthic nitrate reduction in tropicalestuaries. Limnol. Oceanogr. 56, 279–291 (2011).
8. Thamdrup, B. & Dalsgaard, T. Production of N2 through anaerobic ammoniumoxidation coupled to nitrate reduction in marine sediments. Appl. Environ.Microbiol. 68, 1312–1318 (2002).
9. Trimmer, M., Engstrom, P. & Thamdrup, B. Stark contrast in denitrificationand anammox across the deep Norwegian Trench in the Skagerrak. Appl.Environ. Microbiol. 79, 7381–7389 (2013).
10. Landolfi, A., Koeve, W., Dietze, H., Kahler, P. & Oschlies, A. A new perspectiveon environmental controls of marine nitrogen fixation. Geophys. Res. Lett. 42,4482–4489 (2015).
11. Lisa, J. A., Song, B., Tobias, C. R. & Duernberger, K. A. Impacts of freshwaterflushing on anammox community structure and activities in the New RiverEstuary, USA. Aquat. Microb. Ecol. 72, 17–31 (2014).
12. Plummer, P., Tobias, C. & Cady, D. Nitrogen reduction pathways in estuarinesediments: Influences of organic carbon and sulfide. J. Geophys. Res.:Biogeosciences 120, 1958–1972 (2015).
13. Babbin, A. R., Keil, R. G., Devol, A. H. & Ward, B. B. Organic matterstoichiometry, flux, and oxygen control nitrogen loss in the ocean. Science 344,406–408 (2014).
14. Dalsgaard, T., Thamdrup, B. & Canfield, D. E. Anaerobic ammonium oxidation(anammox) in the marine environment. Res. Microbiol. 156, 457–464 (2005).
15. Brin, L. D., Giblin, A. E. & Rich, J. J. Environmental controls of anammox anddenitrification in southern New England estuarine and shelf sediments. Limnol.Oceanogr. 59, 851–860 (2014).
16. Rysgaard, S., Glud, R. N., Risgaard-Petersen, N. & Dalsgaard, T. Denitrificationand anammox activity in Arctic marine sediments. Limnol. Oceanogr. 49,1493–1502 (2004).
17. Canion, A. et al. Temperature response of denitrification and anaerobicammonium oxidation rates and microbial community structure in Arctic fjordsediments. Environ. Microbiol. 16, 3331–3344 (2014).
18. Kristensen, E. & Kostka, J. E. in Interactions Between Macro- andMicroorganisms in Marine Sediments (eds Kristensen, E., Haese, R. R.& Kostka, J. E.) (American Geophysical Union, 2005).
19. Braeckman, U. et al. Role of macrofauna functional traits and density inbiogeochemical fluxes and bioturbation. Mar. Ecol. Prog. Ser. 399, 173–186(2010).
20. Pelegrı, S. P., Nielsen, L. P. & Blackburn, T. H. Denitrification in estuarinesediment stimulated by the irrigation activity of the amphipod Corophiumvolutator. Mar. Ecol. Prog. Ser. 105, 285–290 (1994).
21. Solan, M., Cardinale, B. J., Downing, A. L. & Engelhardt, K. A. M. Extinctionand ecosystem function in the marine benthos. Science 306, 1177–1180 (2004).
22. Sakshaug, E. in Organic Carbon Cycle in the Arctic Ocean (eds Stein, R.& Macdonald, R. W.) 57–81 (Springer-Verlag, 2004).
23. Grebmeier, J., Cooper, L. W., Feder, H. M. & Sirenko, B. I. Ecosystem dynamicsof the Pacific-influenced Northern Bering and Chukchi Seas in the AmerasianArctic. Prog. Oceanogr. 71, 331–361 (2006).
24. McTigue, N. D. & Dunton, K. H. Trophodynamics and organic matterassimilation pathways in the northeast Chukchi Sea, Alaska. Deep Sea Res. Pt II102, 84–96 (2014).
25. McTigue, N. D., Bucolo, P., Liu, Z. & Dunton, K. H. Pelagic-benthic coupling,food webs, and organic matter degradation in the Chukchi Sea: Insights fromsedimentary pigments and stable carbon isotopes. Limnol. Oceanogr. 60,429–445 (2015).
26. Weingartner, T. et al. Hydrographic variability over the northeastern ChukchiSea shelf in summer-fall 2008–2010. Cont. Shelf Res. 67, 5–22 (2013).
27. Schonberg, S. V., Clarke, J. T. & Dunton, K. H. Distribution, abundance,biomass and diversity of benthic infauna in the Northeast Chukchi Sea, Alaska:Relation to environmental variables and marine mammals. Deep Sea Res. Pt II102, 144–163 (2014).
28. Grebmeier, J. M. et al. Ecosystem characteristics and processes facilitatingpersistent macrobenthic biomass hotspots and associated benthivory in thePacific Arctic. Prog. Oceanogr. 136, 92–114 (2015).
29. Gautier, D. L. et al. Assessment of undiscovered oil and gas in the Arctic.Science 324, 1175–1179 (2009).
30. Horak, R. E. A., Whitney, H., Shull, D. H., Mordy, C. W. & Devol, A. H.The role of sediments on the Bering Sea shelf N cycle: Insights frommeasurements of benthic denitrification and benthic DIN fluxes. Deep Sea Res.Pt II 94, 95–105 (2013).
31. Christensen, J. P. Sedimentary carbon oxidation and denitrification on the shelfbreak of the Alaskan Beaufort and Chukchi Seas. Open Oceanogr. J. 2, 6–17(2008).
32. Chang, B. X. & Devol, A. H. Seasonal and spatial patterns of sedimentarydenitrification rates in the Chukchi sea. Deep Sea Res. Pt II 56, 1339–1350 (2009).
33. Souza, A. C., Kim, I.-N., Gardner, W. S. & Dunton, K. H. Dinitrogen, oxygen,and nutrient fluxes at the sediment-water interface and bottom water physicalmixing on the eastern Chukchi Sea shelf. Deep Sea Res. Pt II 102, 77–83 (2014).
34. Gardner, W. S. & McCarthy, M. J. Nitrogen dynamics at the sediment-waterinterface in shallow, sub-tropical Florida Bay: why denitrification efficiency maydecrease with increased eutrophication. Biogeochemistry 95, 185–198 (2009).
35. Hou, L., Liu, M., Carini, S. A. & Gardner, W. S. Transformation and fate ofnitrate near the sediment-water interface of Copano Bay. Cont. Shelf Res. 35,86–94 (2012).
36. Wenk, C. B. et al. Partitioning between benthic and pelagic nitrate reduction inthe Lake Lugano south basin. Limnol. Oceanogr. 59, 1421–1433 (2014).
37. Nielsen, L. P. Denitrification in sediment determined from nitrogen isotopepairing. FEMS Microbiol. Ecol. 86, 357–362 (1992).
38. Gardner, W. S. et al. Nitrogen fixation and dissimilatory nitrate reduction toammonium (DNRA) support nitrogen dynamics in Texan estuaries. Limnol.Oceanogr. 51, 558–568 (2006).
39. Campbell, R. G. et al. Mesozooplankton prey preference and grazing impact inthe western Arctic Ocean. Deep Sea Res. Pt II 56, 1274–1272 (2009).
ARTICLE NATURE COMMUNICATIONS | DOI: 10.1038/ncomms13145
10 NATURE COMMUNICATIONS | 7:13145 | DOI: 10.1038/ncomms13145 | www.nature.com/naturecommunications

40. Devol, A. H., Codispoti, L. A. & Christensen, J. P. Summer and winterdenitrification rates in western Arctic shelf sediments. Cont. Shelf Res. 17,1029–1050 (1997).
41. Gihring, T. M., Lavik, G., Kuypers, M. M. & Kostka, J. E. Direct determinationof nitrogen cycling rates and pathways in Arctic fjord sediments (Svalbard,Norway). Limnol. Oceanogr. 55, 740–752 (2010).
42. Burgin, A. J. & Hamilton, S. K. Have we overemphasized the role ofdenitrification in aquatic ecosystems? A review of nitrate removal pathways.Front. Ecol. Environ. 5, 89–96 (2007).
43. Hardison, A. K., Algar, C. K., Giblin, A. E. & Rich, J. J. Influence of organiccarbon and nitrate loading on partitioning between dissimilatory nitratereduction to ammonium (DNRA) and N2 production. Geochim. Cosmochim.Acta 164, 146–160 (2015).
44. Bates, N. R., Hansell, D. A., Moran, S. B. & Codispoti, L. A. Seasonal and spatialdistribution of particulate organic matter (POM) in the Chukchi and BeaufortSeas. Deep Sea Res. Pt II 52, 3324–3343 (2005).
45. Mincks, S. L., Smith, C. R. & DeMaster, D. J. Persistence of labile organic matterand microbial biomass in Antarctic shelf sediments: evidence of a sediment‘food bank’. Mar. Ecol. Prog. Ser. 300, 3–19 (2005).
46. Smyth, A. R. et al. assessing nitrogen dynamics throughout the estuarinelandscape. Estuar. Coasts 36, 44–55 (2013).
47. Crowe, S. A., Canfield, D. E., Mucci, A., Sundby, B. & Maranger, R. Anammox,denitrification and fixed-nitrogen removal in sediments from the lowerSt Lawrence Estuary. Biogeosciences 9, 4309–4321 (2012).
48. Giblin, A. et al. The importance of dissimilatory nitrate reduction toammonium (DNRA) in the nitrogen cycle of coastal ecosystems. Oceanography26, 124–131 (2013).
49. Jantti, H. & Hietanen, S. The effects of hypoxia on sediment nitrogen cycling inthe Baltic Sea. Ambio 41, 161–169 (2012).
50. Giblin, A. E., Weston, N. B., Banta, G. T., Tucker, J. & Hopkinson, C. S.The effects of salinity on nitrogen losses from an oligohaline estuarinesediment. Estuar. Coasts 33, 1054–1068 (2010).
51. Knowles, R. & Wishart, C. Nitrogen fixation in Arctic marine sediments: effectof oil and hydrocarbon fractions. Environmen. Pollut. 13, 133–149 (1977).
52. Haines, J. R., Atlas, R. M., Griffiths, R. P. & Morita, R. Y. Denitrification andnitrogen fixation in Alaskan continental shelf sediments. Appl. Environ.Microbiol. 41, 412–421 (1981).
53. Ferguson, A. J. P. & Eyre, B. D. Seasonal discrepancies in denitrificationmeasured by isotope pairing and N2:Ar techniques. Mar. Ecol. Prog. Ser. 350,19–27 (2007).
54. Davenport, E. S., Shull, D. H. & Devol, A. H. Roles of sorption andtube-dwelling benthos in the cycling of phosphorus in Bering Sea sediments.Deep Sea Res. Pt II 65–70, 163–172 (2012).
55. Braeckman, U. et al. Variable importance of macrofaunal functionalbiodiversity for biogeochemical cycling in temperate coastal sediments.Ecosystems 17, 720–737 (2014).
56. Bonaglia, S., Nascimento, F. J., Bartoli, M., Klawonn, I. & Bruchert, V.Meiofauna increases bacterial denitrification in marine sediments.Nat. Commun. 5, 5133 (2014).
57. Henriksen, K., Blackburn, T. H., Lomstein, B. A. A. & McRoy, C. P. Rates ofnitrification, distribution of nitrifying bacteria and inorganic N fluxes innorthern Bering-Chukchi shelf sediments. Cont. Shelf Res. 13, 629–651 (1993).
58. Karlson, K., Hulth, S. & Rosenberg, R. Density of Monoporeia affinis andbiogeochemistry in Baltic Sea sediments. J. Exp. Mar. Biol. Ecol. 344, 123–135(2007).
59. Smyth, A. R., Geraldi, N. R. & Piehler, M. F. Oyster-mediated benthic-pelagiccoupling modifies nitrogen pools and processes. Mar. Ecol. Prog. Ser. 493,23–30 (2013).
60. Risgaard-Petersen, N., Nielsen, L. P., Rysgaard, S., Dalsgaard, T. & Meyer, R. L.Application of the isotope pairing technique in sediments where anammox anddenitrification coexist. Limnol. Oceanogr.—Methods 1, 63–73 (2003).
61. Groffman, P. M. et al. Methods for measuring denitrification: diverseapproaches to a difficult problem. Ecol. Appl. 16, 2091–2122 (2006).
62. An, S., Gardner, W. S. & Kana, T. M. Simultaneous measurement ofdenitrification and nitrogen fixation using isotope pairing with membrane inletmass spectrometry analysis. Appl. Environ. Microbiol. 67, 1171–1178 (2001).
63. Kana, T. M. et al. Membrane inlet mass spectrometer for rapid high-precisiondetermination of N2, O2, and Ar in environmental water samples. Anal. Chem.66, 4166–4170 (1994).
64. Gardner, W. S., Bootsma, H. A., Evans, C. & St John, P. A. Improvedchromatographic analysis of 15N:14N ratios in ammonium or nitrate for isotopeaddition experiments. Mar. Chem. 48, 271–282 (1995).
65. Rysgaard, S., Risgaard-Petersen, N. & Sloth, N. P. Nitrification, denitrification,and nitrate ammonification in sediments of two coastal lagoons in SouthernFrance. Hydrobiologia 329, 133–141 (1996).
66. Mooney, R. F. & McClelland, J. W. Watershed export events and ecosystemresponses in the mission-aransas national estuarine research reserve, SouthTexas. Estuar. Coasts 35, 1468–1485 (2012).
67. Parsons, T. R., Maita, Y. & Lalli, C. M. A Manual of Chemical and BiologicalMethods for Seawater Analysis (Pergamon Press, 1984).
68. Jones, M. N. Nitrate reduction by shaking with cadmium. Water Resour. 18,643–646 (1984).
69. Solorzano, L. Determination of ammonia in natural waters by thephenolhypochlorite method. Limnol. Oceanogr. 14, 799–801 (1969).
70. Krivoruchko, K. Spatial Statistical Data Analysis for GIS Users (Esri Press,2011).
AcknowledgementsWe are grateful to captain and crew of the USCGC Healy for the safe and successfulvoyage during HLY1301. We thank Mark McCarthy and Anne Giblin for much help anddirection in analysing samples and nitrogen cycling rate calculations. Susan Schonbergwas the lead taxonomist for this project and provided infauna taxonomy and biomassdata. We thank Kaijun Liu for analysing ammonium isotope retention time shift samples,and Kim Jackson, Nick Reyna and Audrey Wohlrab for assistance with nutrient analyses.Bill Adams and staff constructed the stainless steel HYPOX corer. Three anonymousreviewers greatly improved the clarity and focus of this manuscript. This component ofthe Hanna Shoal Ecosystem Study was funded by the U.S. Department of the Interior,Bureau of Ocean Energy Management (BOEM), Alaska Outer Continental Shelf Region,Anchorage, Alaska under Cooperative Agreement M11AC00007 with The University ofTexas at Austin as part of the Chukchi Sea Offshore Monitoring in Drilling Area(COMIDA) Project and the BOEM Alaska Environmental Studies Program. This isUTMSI contribution 1713.
Author contributionsN.D.M., A.K.H., and K.H.D. performed the field sampling. N.D.M., W.S.G., and A.K.H.carried out the experiments, laboratory analysis and data processing. The research wasdesigned by all authors. N.D.M. wrote the paper but received essential guidance andfeedback from all co-authors.
Additional informationSupplementary Information accompanies this paper at http://www.nature.com/naturecommunications
Competing financial interests: The authors declare no competing financial interests.
Reprints and permission information is available online at http://npg.nature.com/reprintsandpermissions/
How to cite this article: McTigue, N. D. et al. Biotic and abiotic controls on co-occurringnitrogen cycling processes in shallow Arctic shelf sediments. Nat. Commun. 7, 13145doi: 10.1038/ncomms13145 (2016).
This work is licensed under a Creative Commons Attribution 4.0International License. The images or other third party material in this
article are included in the article’s Creative Commons license, unless indicated otherwisein the credit line; if the material is not included under the Creative Commons license,users will need to obtain permission from the license holder to reproduce the material.To view a copy of this license, visit http://creativecommons.org/licenses/by/4.0/
r The Author(s) 2016
NATURE COMMUNICATIONS | DOI: 10.1038/ncomms13145 ARTICLE
NATURE COMMUNICATIONS | 7:13145 | DOI: 10.1038/ncomms13145 | www.nature.com/naturecommunications 11