Archived Information Successful Plans and Practices 2nd Annual National High School Leadership...
50
Archived Information Archived Information Successful Plans and Successful Plans and Practices Practices 2nd Annual National High 2nd Annual National High School Leadership Summit School Leadership Summit December 2, 2004 Dr. Joe A. Hairston, Superintendent, Baltimore County Public Schools
-
Upload
lucas-gallagher -
Category
Documents
-
view
213 -
download
0
Transcript of Archived Information Successful Plans and Practices 2nd Annual National High School Leadership...

Archived InformationArchived InformationSuccessful Plans and PracticesSuccessful Plans and Practices
2nd Annual National High School 2nd Annual National High School Leadership SummitLeadership Summit
December 2, 2004
Dr. Joe A. Hairston, Superintendent, Baltimore County Public Schools

Our Future WorldOur Future World
Our future sits in our classrooms Our future sits in our classrooms today – today –
A world of – A world of –
– High wage, high skills employmentHigh wage, high skills employment
– Economy dependent on research and Economy dependent on research and developmentdevelopment

Cognitive & Technological Cognitive & Technological KnowledgeKnowledge
““The Leaders in our most successful The Leaders in our most successful high schools today … recognize that high schools today … recognize that students and adults must continually students and adults must continually learn new things and that some of the learn new things and that some of the skills we teach and use today will soon skills we teach and use today will soon be as outdated as the skills needed to be as outdated as the skills needed to operate a typewriter and a slide rule.”operate a typewriter and a slide rule.”
~Willaird R. Daggett~Willaird R. Daggett


Variables in Variables in Baltimore County, MD Baltimore County, MD
Seismic ShiftsSeismic Shifts:: Baltimore CountyBaltimore County Our Communities and FamiliesOur Communities and Families Our Public SchoolsOur Public Schools
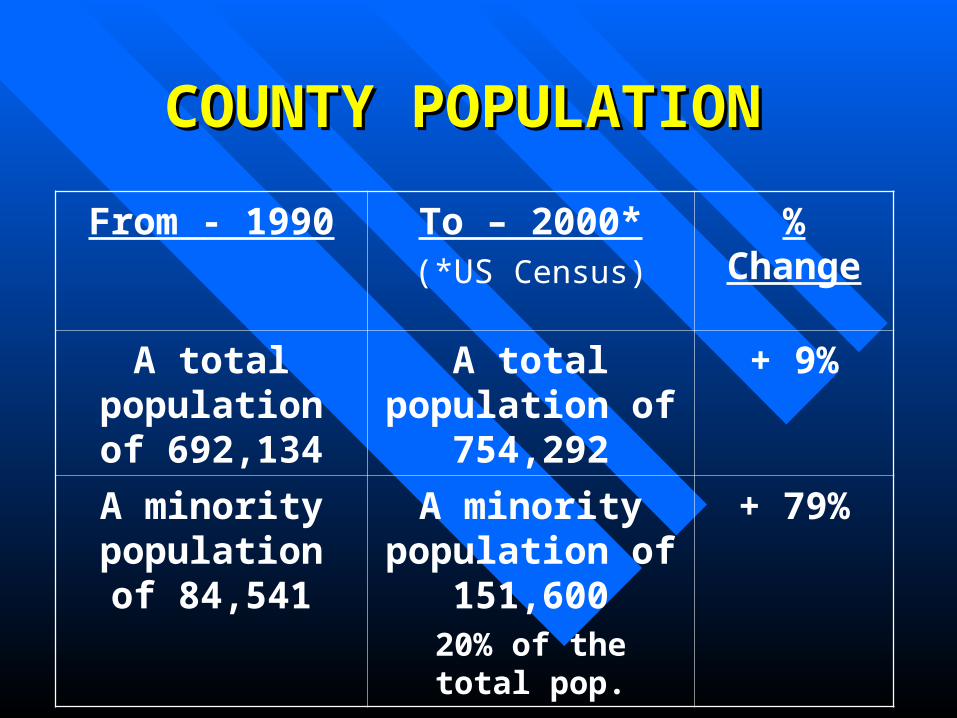
COUNTY POPULATIONCOUNTY POPULATION
From - 1990 To – 2000*(*US Census)
% Change
A total population of
692,134
A total population of 754,292
+ 9%
A minority population of
84,541
A minority population of
151,60020% of the total pop.
+ 79%

From
A median household income of $44,502 in year 1990
ToA median household income of $52,868 in year 2000 (an increase of 19%).
INCOME LEVELINCOME LEVEL

BALTIMORE COUNTY BALTIMORE COUNTY PUBLIC SCHOOLSPUBLIC SCHOOLS
OPERATING BUDGETOPERATING BUDGET
Fiscal Year 2005 Revenue and Fiscal Year 2005 Revenue and Expenditures:Expenditures:
$1,067,015,417$1,067,015,417

STUDENT ENROLLMENTSTUDENT ENROLLMENT
From - 1990 To - 2004 % Change
Total student enrollment of
86,841
Total student enrollment of
108,792
+ 25%
Minority enrollment of
18,069
Minority enrollment of
42,928
39% of total pop.
+ 165%

ESOL ENROLLMENTESOL ENROLLMENT
From
An ESOL enrollment of 873 students in year 1990
To
An ESOL enrollment of 2,272 students in year 2004 (an increase of 160%.)

FREE/REDUCED FREE/REDUCED
PRICED MEALSPRICED MEALS FromFrom
12.6% of students receiving 12.6% of students receiving free/reduced priced meals in free/reduced priced meals in 19901990
To To
28.3% of students receiving 28.3% of students receiving free/reduced priced meals in free/reduced priced meals in 2003.2003.

From
146 schools in Baltimore County in the year 1990
To162 schools in Baltimore County in the year 2004.
PUBLIC SCHOOLSPUBLIC SCHOOLS

FromFrom
A total of 5,300 full time A total of 5,300 full time equivalent teachers in 1990equivalent teachers in 1990
ToTo
A total of 7,058 full time A total of 7,058 full time equivalent teachers in 2004 (an equivalent teachers in 2004 (an increase of 33%.)increase of 33%.)
TEACHERSTEACHERS

Responding to the Variables:Responding to the Variables:Articulating A PlanArticulating A Plan
Envision and share the vision of Envision and share the vision of effective instructioneffective instruction
Put in place – and continue to refine – Put in place – and continue to refine – management based on accountability management based on accountability and decision making at the closest and decision making at the closest level of participationlevel of participation

SMART GoalsSMART GoalsSSpecificpecificMMeasurableeasurableAAttainablettainableRResults orientedesults orientedTTime-boundime-bound

Baltimore CountyBaltimore CountyPublic SchoolsPublic Schools
Blueprint for Progressoutlines the vision, mission, belief statements, performance goals, performance indicators and key strategies of the Baltimore County Public Schools

By 2012 all students will reach high By 2012 all students will reach high standards, as established by the Baltimore standards, as established by the Baltimore County Public Schools and State County Public Schools and State performance level standards, in performance level standards, in reading/language arts, mathematics, reading/language arts, mathematics, science, and social studiesscience, and social studies
Blueprint Goal 1 – Blueprint Goal 1 – Student AchievementStudent Achievement

Blueprint Goal 1 - Blueprint Goal 1 - Student AchievementStudent Achievement
Indicator 1.1:Indicator 1.1: All diploma-bound students grades 3-8 All diploma-bound students grades 3-8
and 10 will meet or exceed MSA and 10 will meet or exceed MSA standardsstandards

Blueprint Goal 1 – Blueprint Goal 1 – Student AchievementStudent Achievement
Key Strategies:Key Strategies:» Implementing consistent reading Implementing consistent reading
programs at the elementary, middle, and programs at the elementary, middle, and high school levelshigh school levels
» Review of Math and Science Program Review of Math and Science Program K-12K-12

Maryland School Assessment Maryland School Assessment
READINGREADING
69.6
59.8 62.766.2 67.563.3
73.175.4
0
20
40
60
80
100
Grade 3 Grade 5 Grade 8 Grade 10
Percentage
2003 2004
40.047.5
42.749.9
43.0 45.6 42.9 45.5

MSA MATHEMATICSMSA MATHEMATICS
39.5 42.0
61.6
47.842.9
52.2
66.273.1
0
20
40
60
80
100
Grade 3 Grade 5 Grade 8 Grade 10
Percentage
2003 2004
47.4
35.4
49.8
38.3
19.022.7 20.9
27.5

Blueprint Goal 1 – Blueprint Goal 1 – Student AchievementStudent Achievement
Indicator 1.2:Indicator 1.2: All diploma-bound students will All diploma-bound students will
participate in the PSATparticipate in the PSAT
Indicator 1.3:Indicator 1.3: All students scoring 55 or above on All students scoring 55 or above on
verbal/math PSAT will counseled into verbal/math PSAT will counseled into honors or gifted and talented level courseshonors or gifted and talented level courses

Blueprint Goal 1 – Blueprint Goal 1 – Student AchievementStudent Achievement
Key Strategies:Key Strategies:
» College Board PartnershipCollege Board Partnership
» 1010thth grade PSAT Participation grade PSAT Participation
» AP PotentialAP Potential

PSAT Participation Grade 10PSAT Participation Grade 10
81.1 82 83.5
100
0
20
40
60
80
100
Percentage
2002 2003 2004 County Standard
BCPS System RESULTS
2002 2003 2004 County Standard
PSAT PARTICIPATION RATE GRADE 10

PSAT Participation Grade 10 PSAT Participation Grade 10 Disaggregated by Ethnic GroupDisaggregated by Ethnic Group
6864
80 8084 84
77 79 7984 84
87
60 60
70
0
20
40
60
80
100
Percentage
AmericanIndian
Asian AfricanAmerican
White Hispanic
BCPS System RESULTS
2002 2003 2004
PSAT PARTICIPATION RATE GRADE 10 BY RACE/ETHNICITY

Indicator 1.9:Indicator 1.9: Each middle school will meet or exceed the State Each middle school will meet or exceed the State
average student participation rate in Algebra Iaverage student participation rate in Algebra IIndicator 1.10:Indicator 1.10: All students will pass the Algebra I Maryland All students will pass the Algebra I Maryland
High School Assessment (HSA) by the end of High School Assessment (HSA) by the end of grade 9grade 9
Blueprint Goal 1 – Blueprint Goal 1 – Student AchievementStudent Achievement

Blueprint Goal 1 – Blueprint Goal 1 – Student AchievementStudent Achievement
Key Strategies:Key Strategies:
» Elimination of low level courses at Elimination of low level courses at the middle and high school levelsthe middle and high school levels

HSA Algebra I Grade 9HSA Algebra I Grade 9
33.9
50.154.3
0
20
40
60
80
100
Percentage
2002 2003 2004
BCPS System RESULTS
2002 2003 2004
HSA ALGEBRA 1 GRADE 09 PASS RATE

Indicator 1.13:Indicator 1.13: All high schools will meet or exceed All high schools will meet or exceed
national average of a 7% participation national average of a 7% participation rate on the Advanced Placement (AP) rate on the Advanced Placement (AP) examinationexamination
Indicator 1.14:Indicator 1.14: All high schools will have at least 70% All high schools will have at least 70%
of their students who take AP of their students who take AP examinations achieving passing scoresexaminations achieving passing scores
Blueprint Goal 1 – Blueprint Goal 1 – Student AchievementStudent Achievement

Key Strategies:Key Strategies:» CollegeEd for all in 7CollegeEd for all in 7thth grade students grade students» AVIDAVID» Smaller learning communitiesSmaller learning communities» Vertical teams (clusters)Vertical teams (clusters)» SpringBoardSpringBoard» AP Teacher ConferencesAP Teacher Conferences
Blueprint Goal 1Blueprint Goal 1
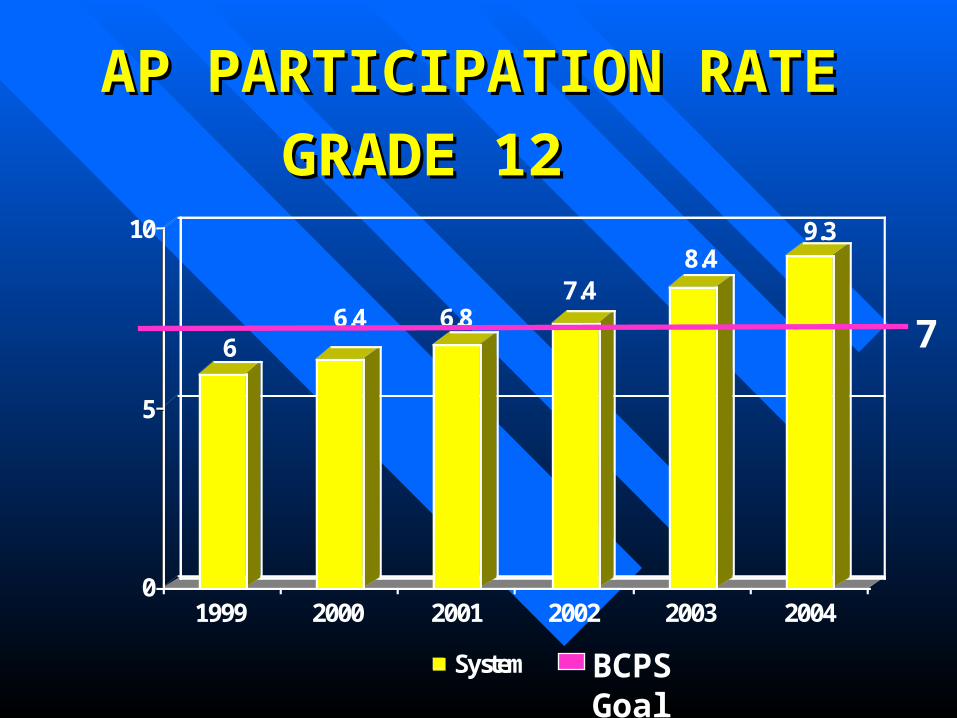
AP PARTICIPATION RATE AP PARTICIPATION RATE
GRADE 12GRADE 12
66.4 6.8
7.48.4
9.3
0
5
10
Percentage
1999 2000 2001 2002 2003 2004
System
7
BCPS Goal

AP PASS RATE GRADE 12AP PASS RATE GRADE 12
67.071.0 69.071.0 71.468.971.7 71.0 70.668.0 71.2
66.8
0
20
40
60
80
100
Percentage
1999 2000 2001 2002 2003 2004
System State

Indicator 1.17:Indicator 1.17: All high schools will meet or exceed the All high schools will meet or exceed the
national average for participation in the national average for participation in the SAT or the ACTSAT or the ACT
Indicator 1.18:Indicator 1.18: All high schools will meet or exceed the All high schools will meet or exceed the
national average for critical reading, national average for critical reading, mathematics, and writing scores on the mathematics, and writing scores on the SAT or the ACTSAT or the ACT
Blueprint Goal 1 – Blueprint Goal 1 – Student AchievementStudent Achievement

Key Strategies:Key Strategies:
» New SAT OnlineNew SAT Online
» SAT Readiness ProgramsSAT Readiness Programs
» ScoreWriteScoreWrite
Blueprint Goal 1 – Blueprint Goal 1 – Student AchievementStudent Achievement

SAT PARTICIPATION RATE SAT PARTICIPATION RATE
GRADE 12 GRADE 12
49.043.0
55.044.0
52.044.0
50.046.0
50.548.052.2
48.0
0
20
40
60
80
100
Percentage
1998 2000 2001 2002 2003 2004
System National


SAT COMBINED SCORE SAT COMBINED SCORE GRADE 12GRADE 12
997
1019 102110201037
1020
1034 1026 1027 1026
950
970
990
1010
1030
Scores
2000 2001 2002 2003 2004
System National Mean

All Students will Graduate from All Students will Graduate from High SchoolHigh School
Blueprint Goal 5 – Blueprint Goal 5 – Student AdvancementStudent Advancement

Indicator 5.3:Indicator 5.3: All graduates will meet the college course All graduates will meet the college course
entrance requirements for the University entrance requirements for the University System of Maryland or the Maryland career and System of Maryland or the Maryland career and technology education career completer technology education career completer requirements or bothrequirements or both
Blueprint Goal 5 -Blueprint Goal 5 -Student AdvancementStudent Advancement

Key Strategies:Key Strategies:
» Rigorous Graduation RequirementsRigorous Graduation Requirements
» Quality Course Offerings (elimination Quality Course Offerings (elimination of low level courses)of low level courses)
» Increasing AP OfferingsIncreasing AP Offerings
» Expansion of IB Programs and AVIDExpansion of IB Programs and AVID
Blueprint Goal 5 -Blueprint Goal 5 -Student AdvancementStudent Advancement

GRADUATES MEETING THE GRADUATES MEETING THE UNIVERSITY OF MARYLANDUNIVERSITY OF MARYLAND
REQUIREMENTSREQUIREMENTS62.6
60.9 59.7 57.7 59.9
0
10
20
30
40
50
60
70
Percentage
2000 2001 2002 2003 2004

GRADUATES MEETING THE GRADUATES MEETING THE Maryland Career and Technology Maryland Career and Technology
Education Career CompleterEducation Career Completer
29.0
40.6
46.6 48.3
30.3
0
10
20
30
40
50
Percentage
2000 2001 2002 2003 2004

Effective Leadership – Effective Leadership – The Goal and Plan in MotionThe Goal and Plan in Motion
To be effective, a leader must To be effective, a leader must own the results and all own the results and all
behavior must be aligned with behavior must be aligned with the goal and plan.the goal and plan.

Leadership BehaviorsLeadership Behaviors
VisionaryVisionary PurposefulPurposeful DirectiveDirective CollaborativeCollaborative EvaluativeEvaluative Supportive of Continued Supportive of Continued
Improvement and GrowthImprovement and Growth

Powerful School StructuresPowerful School Structures Strong master scheduleStrong master schedule Effective personnel decisionsEffective personnel decisions Understanding of student strengths and Understanding of student strengths and
weaknessesweaknesses Ensuring curriculum is aligned with Ensuring curriculum is aligned with
assessmentassessment Assessment supported by effective use of Assessment supported by effective use of
technologytechnology

SUPERINTENDENT
BOARD OF EDUCATION
CURRICULUM &
INSTRUCTION
BUSINESS
SERVICESPRINCIPALS
EXECUTIVE DIRECTOR OF SCHOOLS
RESULTS - STUDENT ACHIEVEMENT
SERVICE FOR THE SCHOOLS
SERVICE
SERVICE
Commitment to
Achievement


Thank You