Archived Content Contenu archivé - Public Safety Canada 9110.p71 f5 no.2... · Contenu archivé...
294
ARCHIVED - Archiving Content ARCHIVÉE - Contenu archivé Archived Content Information identified as archived is provided for reference, research or recordkeeping purposes. It is not subject to the Government of Canada Web Standards and has not been altered or updated since it was archived. Please contact us to request a format other than those available. Contenu archivé L’information dont il est indiqué qu’elle est archivée est fournie à des fins de référence, de recherche ou de tenue de documents. Elle n’est pas assujettie aux normes Web du gouvernement du Canada et elle n’a pas été modifiée ou mise à jour depuis son archivage. Pour obtenir cette information dans un autre format, veuillez communiquer avec nous. This document is archival in nature and is intended for those who wish to consult archival documents made available from the collection of Public Safety Canada. Some of these documents are available in only one official language. Translation, to be provided by Public Safety Canada, is available upon request. Le présent document a une valeur archivistique et fait partie des documents d’archives rendus disponibles par Sécurité publique Canada à ceux qui souhaitent consulter ces documents issus de sa collection. Certains de ces documents ne sont disponibles que dans une langue officielle. Sécurité publique Canada fournira une traduction sur demande.
Transcript of Archived Content Contenu archivé - Public Safety Canada 9110.p71 f5 no.2... · Contenu archivé...

ARCHIVED - Archiving Content ARCHIVÉE - Contenu archivé
Archived Content
Information identified as archived is provided for reference, research or recordkeeping purposes. It is not subject to the Government of Canada Web Standards and has not been altered or updated since it was archived. Please contact us to request a format other than those available.
Contenu archivé
L’information dont il est indiqué qu’elle est archivée est fournie à des fins de référence, de recherche ou de tenue de documents. Elle n’est pas assujettie aux normes Web du gouvernement du Canada et elle n’a pas été modifiée ou mise à jour depuis son archivage. Pour obtenir cette information dans un autre format, veuillez communiquer avec nous.
This document is archival in nature and is intended for those who wish to consult archival documents made available from the collection of Public Safety Canada. Some of these documents are available in only one official language. Translation, to be provided by Public Safety Canada, is available upon request.
Le présent document a une valeur archivistique et fait partie des documents d’archives rendus disponibles par Sécurité publique Canada à ceux qui souhaitent consulter ces documents issus de sa collection. Certains de ces documents ne sont disponibles que dans une langue officielle. Sécurité publique Canada fournira une traduction sur demande.

Hy 9110 .P7f F5
I
no.?
GROUPE DE RECHERCHE SUR L'INADAPTATION JUVÉNILE
UNIVERSITÉ DE MONTRÉAL
THE HUMAN RESOURCE
A Description of the Treatment Staff of Shawbridge Youth Centers
Final Report No. 2
by
Marge Reitsma and Ron Brill
June 1978
BOYS' FARM RESEARCH PROJECT
Directeur: Marc LeBlanc, Ph.D. (Crim.)

0 P '71
P.7.5 ,
LIURARY PMI= 0:3. THE SOLICITOR,
MAR 4 1913t
Dlet.loTt-'QUE MINIS•IRE DU SOLLICITEUR GMRAL
THE HUMAN RESOURCE
A Description of the Treatment Staff
of Shawbridge Youth Centers/
Final Report No. 2
by
Marge Reitsma and Ron Brill
June 1978
This research is funded by:
Le Ministère des Affaires Sociales du Québec
Le Ministère du Solliciteur Général du Canada
Shawbridge Youth Centers Foundation
The opinions expressed herein are solely those of the authors
and do not necessarily reflect the views of the funding groups
or the agency under study.

ACKNOWLEDGEMENTS
We would like to sincerely thank those individuals who
have made this report possible. Thanks to the personnel of
Shawbridge Youth Centers who willingly answered the many
questionnaires and who participated in the interviews so that
we could gain an understanding of the persons who work with
troubled and delinquent youth.
Special thanks to our colleagues for their invaluable
assistance; to Bruce Duncan for analyzing the data, to
Marc LeBlanc and Elizabeth Harvie for their support and
suggestions, and to Joann Jones for her excellent typing and
preparation of the report.

TABLE OF CONTENTS
Page
Introduction 1
CHAPTER I - Personality Characteristics and Professional Orientations of SYC Staff 9
SYC Staffing Patterns 12 Data Collection and Staff Samples 14 General Background Characteristics 19 Palmer's Classification of Worker Characteristics 24
Hunt's Classification of Worker Characteristics 51 General Behavior Characteristics 56 Stability of Worker Characteristics 64 Chapter Summary and Conclusions 73
CHAPTER II - Matching in Practice 78
Differences between the Worker Positions in the Three Settings 81
Comparisons of Teams within Settings 93 Matched Worker-Youth Relationships 99 Worker-Youth Matching: I-Level Theory 101 Worker-Youth Matching: Conceptual Level Theory 108
CHAPTER III - Selection of and Caring for "Good" Staff ....II]
Selection of "Good" Staff 118 "Care for the Caregivers" 139 Overall Summary and Conclusions 149
REFERENCES 159 APPENDICES 165

List of Appendices
Page
1. Description of Instruments 166
(a) Position Qualifications 167
(b) A Brief Description of the I-Level
Classification System 169
(c) Research Interview Protocol 173
(d) Scale Items used to Assess SYC Workers' Personality Characteristics and Professional
Orientations 176
(e) Description of Staff Intervention Subscales 181
2. Characteristics of SYC Staff: Initial Measurement • 184
3. Characteristics of SYC Staff: Second Measurement 199
4. Analysis of Significant Differences between the
Characteristics of SYC Staff at I1 and 1
2 214
5. Summary of the Significant Differences at 12 between
the SYC Staff in Different Settings, Positions,
and Teams on Background and Personal Characteristics •. 230
6. SYC Staff Ratings on the "Treater-Matching" Interview Scales 236
7. SYC Staff Ratings on the Staff Intervention Scales 249
8. SYC Youths' Satisfaction with their Workers 25 8
9. Staff Turnover 261
10. Distribution of Workers and Youth in each Unit by 263
11. Comparison of the Characteristics of High and Lower
Conceptual Level SYC Staff
12. Comparison of the Characteristics of Versatile and Non-
Versatile SVC Staff 275
13. Comparison of the Characteristics of Stayers and
Leavers
I-Level and Conceptual Level
270
280

I NTRODUCT I ON

2
No matter how comprehensive the conceptual ideas and physical
resources of a social service agency are, it is the people who are
the most important resource. In a residential and community-based
agency such as Shawbridge Youth Centers, which services youths
considered delinquent or unmangeable, the workers are expected to
carry out the strenuous, often paradoxical task of controlling,
caring, and treating difficult youth. Winnicott (1964, 1970)
believes that "the essential skill in residential treatment lies
in the workers' ability to create a way of living for a group of
individuals" (cited in Berry, 1975, p. 118), while the focus of
experienced practitioners who usually work from a community base
"commonly develop treatment-programs on the shared assumption that
the nature and quality of their relationship to a client is
essential to the process and outcome of treatment" (Palmer, 1963,
vii). Although the staff in the residential and community
settings of SYC may bring different skills and orientations to
their work, it is the Agency's ability to select good staff and
care for them that will make treatment of youth possible.
What makes a person a good worker with youth? In 1962,
Walther studied the characteristics of people working in
institutions for youth who are considered delinquent and emotionally
disturbed. The supervisory personnel in 45 short- and long-term
American institutions were first asked to describe their sub-
ordinates in reference to 30 different qualities a , and then to
evaluate their employees' proficiency with children and with staff.
a A list of these 30 position qualities can be found in Appendix 1.
1,000 employees were rated.

3
Walther found that all the characteristics did relate to good
work with children and staff.
The composite profile is not necessarily descrip-tive of any individual group workers nor is it necessarily descriptive of the most desirable combination of factors for any given institution.
The profile is offered as a generalized summary of the relationships that most frequently tend to be associated with superior proficiency with children and staff.
The composite superior group worker in this study would be a male under 55 years of age with a college degree. He would have an inquiring, open mind. He would remain calm and poised under pressure and would be able to keep emotional or personal interests from influencing decisions. His attitude would be enthusiastic, constructive, optimistic, and loyal. He would have a knowledge of the functional skills needed to carry out the duties of his job. He would be self-reliant, taking new developments in stride. He would display assured bearing and have inner securities. He would receive loyalty and cooperation from others. He would be able to manage and motivate others to full effective- ness. He would have an open mind. He would have been employed in the institution for less than eight years. (Walther, 1962, 78, 79.)
Two important findings of this study were: in the first
place, Walther demonstrated that staff characteristics can be
reliably and efficiently measured; secondly, certain characteris-
tics are related to good work with children. Walther hypothesized,
however, that not all these characteristics could or should be
found in one person or position, as diffèrent types of people
are needed to do different types of jobs. Thus, the question is
not only who are the good staff, but which staff are good for
which types of children undpr which conditiong.
It has long been recognized that workers have different
strengths and vulnerable points, and this should be taken into

4
account in the selection, placement, and supervision of staff
(Adams and Hopkinson, 1964; Bettleheim, 1950; Bowlby, 1953;
Jung, 1964; Palmer, 1963, 1967; Silverman, 1967). Ted Palmer, in
his work with the California Community Treatment Project (CTP)
from 1961 to 1973, has intensively explored how, to.differentiate
and measure the worker characteristics that relate to the most
effective treatment of different youth types (Palmer, 1963, 1965,
1967a, 1967b, 1968 -a, 1968b, 1973).
To "match up" worker and youth characteristics so that
treatment and control needs of troubled and delinquent youth are
effectively met, Palmer felt that three conditions must be ful-
filled: (a) the worker's personality must bring out a positive
response and a general acceptance by 'the youth; (b) the worker's
natural style of interacting and intervention must be appropriate
to the youth's needs; and (c) the characteristics of the youth
should please and satisfy the worker.
Matching workers' and youths' characteristics can affect
youth behavior change measured by parole failures, number of
arrests and convictions, and type of offense. . In his experimental
research comparing the parole failure of youths matched to their
parole agents to the parole failure of youth assigned to regular
agents, Palmer found that experimental youths had a 30 percent
failure rate of parole, while control youths had a failure rate
of 64 percent within 15.49 months of community expOsure (1967a,
p. 32) a• Experimental youths were on the small caseloads of
a The difference was significant: X
2 = 60.53; df = I; 2.‹.01.

5
specially matched workers who had access to extensive supervision
and training. Control youths were part of the large caseloads
of agents offering regular types of probation/parole services.
Both experimental and control youths had the same parole agent
for a minimum of 15 months.
A second finding supporting the value of matching workers and
youth was that the failure rate during 15 months' parole follow-up
was 43 percent for experimental youths who were not closely
matched, and only 19 percent for the youths who were closely
matched to their workers. Both grouPs of youth had been handled
by CTP agents, using CTP methods and program facilities. The
•difference was significant beyond the .01 level (Palmer, 1968a,
p. 12).
More recently, Palmer (1977a, h) re.analyzed the effectiveness
of matching youth to agents in relation to number of arrests
during approximately 6.8 years of community exposure. Most
experimental youth had fewer arrests than control youth, both
during time on parole as well as after discharge, although worker
matching and CTP treatment approaches were more effective for
some youth types than for others.
When Boys' Farm and Training School (later known as
Shawbridge Youth Centers) adopted an important re-orientation in
treatment philosophy and organizational structure in 1968, careful
selection of good staff and matching workers to appropriate youths

6
(and units) became one of the initial ten goals set out by
Wylie and Hanna (1971, P. 5, 27). This goal was based on
Palmer's rationale that:
workers at given points in their personal and professional development would probably have areas of greater and lesser ability, and of
differential interest as well. [Therefore], it appeared plausible to regard the idea of matching-up certain workers with certain youths as being, at base, simply one way of capitalizing upon the special talents, sensitivities, and areas of greatest concern on the part of the workers and of minimizing possible effects of
the worker's areas of lesser sensitivity, talent, and relative disinterest on certain kinds of
problems. (1967a, p. 8)
In 1975, Boys' Farm was still believed to have a policy that
matched personnel to youths. The Batshaw Committee reported that
the differential treatment philosophy at Boys' Farm "implies
careful selection of staff and the diagnosis of the children by
the Sullivan, Grant, and Grant criteria. Staff and children are
then matched for optimal therapeutic effect" (Batshaw Report,
1975, P. 10 35).
In the fall of 1975, the Provincial and Federal Governments
and the Boys' Farm Foundation funded a Research Team from Le
Groupe de Recherche sur l'Inadaptation Juvenile (GRIJ) a to research
the evolution of the treatment programs at Shawbridge Youth
Centers (SYC), and to analyze possible reasons for youth change.
As "matched" staff and appropriate milieu characteristics are
considered the two main elements of SYC's treatment approach,
youth change would be analyzed in relation to different milieu
and staff characteristics.
a A research institute which is sponsored by the Université de
Montréal, P.Q.

7
In order to understand the characteristics of SYC workers
and their contributions to youth change, this report first
addresses the following questions:
1. What are the personality characteristics and professional
orientations of SYC staff during 1976 and 1977?
2. Are the strengths of the personality characteristics
and professional orientations of SYC workers maximized, and the
weaknesses minimized? That is, are workers differentially
assigned and "matched" to the appropriate setting, unit, and
youths?
Although the impact of matching SYC workers and youths on
youths' personality and behavior change is not analyzed in this
reporta , the worker characteristics that affect more immediate
concerns such as turnover, versatility, and youths' general
satisfaction are explored. Furthermore, environmental conditions
such as clarity of job expectations, supervision, team cohesive-
ness, and leader support, which contribute to the effectiveness
of SYC staff, are discussed. Therefore, this report goes on to
answer one more question:
3. What worker characteristics and environmental conditions
would increase the probability of staff working effectively with
troubled and delinquent youth?
a See Brill, R., Factors Related to Client Change, Final Report
No. 5, 1978.

8
By answering these three questions it is possible to learn
(a) how much SYC has fulfilled the specific staffing needs
inherent in its commitment to differential treatment, and (h)
what factors would increase the effectiveness and efficiency of
individuals selected to work at Shawbridge Youth Centers.

CHAPTER
Perso.nality Characteristics and
Professional Orientations of SYC Staff

10
Shawbridge Youth Centers, formerly known as Boys' Farm, have
cared for wayward and delinquent boys for 70 years. In the last
eight years, and especially the last two years, this agency has
greatly expanded in size, complexity, and scope of responsibilities.
It now has the mandate to care for and treat 250 youths between
the ages of 12 and 18, of whom 210 are boys and approximately 40
are girls. The agency provides residential, group home, and
community services in its 17 treatment units. There are three
locked facilities (two short-term, one long-term), five open
residential units, six group homes in the greater Montreal
community, two city centers for day-care and casework, and one
short-term community detention facility. Centralized educational,
recreational, food and maintenance services are part of the agency's
residential services.
Boys' Farm management endorses a philosophy of differential
treatment which is based primarily on the Interpersonal Maturity
Classification system (Sullivan, Grant and Grant, 1957; Warren,
1966) and the experimental research completed by Ted Palmer from
1961 to 1973 in the California Treatment Project. Hunt's
Conceptual Level Matching Model (1971) was also introduced to
supplement I-Level theory and practice. In brief, these theories
claim that (a) youths, workers, and treatment units need to be,
and can be, differentiated into groups, and (h) that differential
treatment is more effective than non-differential treatment.
Il
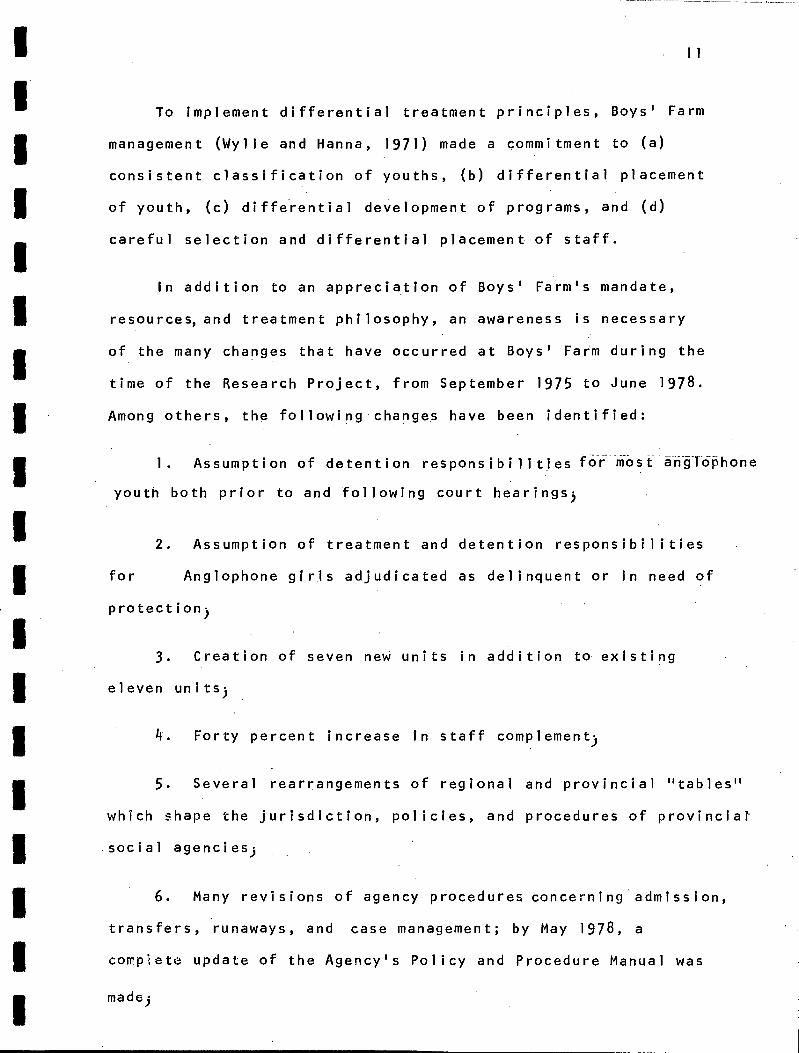
To implement differential treatment principles, Boys' Farm
management (Wylie and Hanna, 1971) made a commitment to (a)
consistent classification of youths, (b) differential placement
of youth, (c) differential development of programs, and (d)
careful selection and differential placement of staff.
In addition to an appreciation of Boys' Farm's mandate,
resources, and treatment philosophy, an awareness is necessary
of the many changes that have occurred at Boys' Farm during the
time of the Research Project, from September 1975 to June 1978.
Among others, the following changes have been identified:
1. Assumption of detention responsibilities for most angibphone
youth both prior to and following court hearings)
2. Assumption of treatment and detention responsibilities
for Anglophone girls adjudicated as delinquent or in need of
protection)
3. Creation of seven new units in addition to existing
eleven units.
4. Forty percent increase in staff complement)
5. Several rearrangements of regional and provincial "tables"
which shape the jurisdiction, policies, and procedures of provincial
social agencies)
6. Many revisions of agency procedures concerning admission,
transfers, runaways, and case management; by May 1978, a
complete update of the Agency's Policy and Procedure Manual was
made;

12
7. Move of management and chief administrative services
from the residential campus in Shawbridge to a downtown Montreal
office;
8. Change of agency's name from 'Boys' Farm and Training
School to Shawbridge Youth Centers (SYC)3 and
9. Beginnings of policy and procedure reorientation in
compliance with the new Youth Protection Act (Bill 24), effective
April 1, 1978.
SYC Staffing Patterns
Management
The upper management group is made up of the directors of
Residential Group Life, Community Services, Finance and Maintenance,
Personnel, and Professional Services, supervised by the Executive
Director, a man who has run the agency since 1968. Formerly, the
directors of Group Life and Community Services supervised the
centralized educational program, but in September 1977, the
Protestant School Board of Greater Montreal took over this
responsibility. Management is responsible to a Board of Directors
as legislated in Bill 48, an act in respect to Health Services and
Social Services, 1971.
There are also three intermediate management positCons:
Residential Treatment Supervisor of Open Units, Residential
Treatment Supervisor of Closed Units, and the Supervisor of Group
Homes. However, these positions do not seem as determinate as
other upper management positions: no one filled these positions

1 3
in May 1978, and the positions themselves were under review.
Residential Teams
A coordinator, who holds an undergraduate university degree,
heads a team made up of six child care workers and one and two-
fifths night supervisors. The closed units have two more child
care positions than the open units. Two open cottage teams also
have a community-oriented caseworker. Each team works with 10 to
14 youths; one of the five open unit teams and one of the closed
units are responsible for girls.
Community Teams
The two city project centers are staffed by caseworkers who
have undergraduate or graduate degrees in the social sciences.
Each worker is responsible for 10 to 12 youths, both boys and
girls. A Community Treatment Supervisor supervises each team. In
this report, the position "supervisor" includes cottage and group
home coordinators and the Community Treatment Supervisors.
Group Home Teams
Full-time houseparents form the nucleus of a group home team.
Each team is responsible for six to eight youths. At the beginning
of the research, a relief set of houseparents and a coordinator
(who supervises another home as well) were also part of the four
group home teams in existence. After a time, a group home case-
worker and then a child care worker (who replaced one of the
relief houseparents) were added to the teams. During the project
one group home closed down and three homes opened up; of the six
homes, four became co-educational.

14
Other Services
Two full-time and one part-time nurse, as well as a part-time
doctor, staff the campus medical center. There had been a
consulting psychiatrist until 1977, but after he left no one
replaced him. Community and group home youths generally use
community health, educational, and recreational services.
SYC has two school centers. On the residential campus, 20
teachers, some having special education degrees, provide schooling
to 60 to 80 youths. In the city, five teachers provide classes
four days a week to 20 to 30 youths. In addition, a program
specialist has recently set up a work training program for six to
eight youths.
Finally, four recreation counsellors provide daily classes
and evening supervision to campus youths.
Data Collection and Staff Samples
The measures chosen to describe the personality characteristics a
and professional orientations of SYC staff include: (a) Social
and Professional Identity Questionnaire, (h) Byrne's Health and
Opinion Survey (1961), (c) Jesness' Staff Preference Survey
(1972-74), (d) Paragraph Completion Test measuring Conceptual
Level (Hunt, 1978), (e) Palmer's Treater-Matching Interview and
Rating Inventory (1967a), and (f) the Staff Intervention
Questionnaire (Ménard, Cusson, and LeBlanc, 1974).
a Due to limited research resources, the closed unit, upper management and central services staff were not included in the research.

15
The rationale behind choosing these measures, especially
Hunt's Conceptual Level and Palmer's Interview and Rating
Inventory, was based on the conceptual relevance as well as the
documented validity and reliability of the instruments a .
Therefore, after describing background characteristics such as
education, experience, mobility, and general personal adjustment,
we aim to capture the constellation of personality traits that are
most relevant to SYC's specific staffing needs.
In the first place Palmer's classification system identifies
worker types which best "match" the delinquent youth types as
classified by the I-Level Diagnosis. (As complementary data, we
have included Jesness' simple pen-and-paper questionnaire which
tries to identify a worker's preference for the approach appropri-
ate to a specific I-Level subtype in order to see if there is a
correlation between a worker's self-rated preference and observer
ratings of his suitability according to Palmer's system.) Secondly,
even though SYC is more explicitly committed to differential
selection of staff in the context of Palmer's classification
system, the introduction of Hunt's Conceptual Level classification
system into SYC's youth assessment process in 1972 makes the
classification of SYC staff on this dimension also relevant and
interesting. This is especially true given the strong validity
and reliability of the Paragraph Completion Test (which measures
Conceptual Level), and the research documenting the value of
a Conceptual Level: Gardiner and Schroder, 1972; Hunt, Butler,
Noy, and Rossor, 1978. Palmer's Interview and Rating Inventory: Grenny, 1971; Palmer, 1967a.

16
matching up workers' and youths' need for structure.
Palmer's, Jesness', and Hunt's measures attempt to predict
variations in workers' characteristics which are relevant to the
treatment interactions between themselves and youths in their
care. The Staff Intervention Questionnaire, our final measure,
tries to capture what SYC workers actually do in their regular
interactions and interventions with youth.
The original research proposal (LeBlanc, Hanna, and Brill,
1975) proposed that all SYC staff be tested at the beginning and
end of the project on these six measures. The purpose of the
two testing points was not only to describe the personality
characteristics and professional orientations of staff, but also
to establish whether or not this profile changed over time. The
determination of constancy or stability in staff characteristics
was considered essential so that it would be clear whether or not
the staff input influencing youth change was a stable or variable
input. If staff input was relatively stable, and if the milieu
input into youth change was also relatively stable, and if youth
types did not change much, it would be possible to explain youth
change (or lack of it) in relation to specific milieu and/or staff
input.
For a variety of reasons,discussed by the director and
senior researcher of the project (LeBlanc and Brill, 1976) the
evaluative goals of the research project were changed in August
1976 to descriptive and exploratory ones. One consequence of this
r.eorientation was to collect information on staff at

17
points in time on only four of the six measures. The Staff
Intervention Questionnaire and the time-consuming interview
scored by Palmer's Rating Inventory were administered only once
during the course of the project.
Table 1 summarizes how many workers filled out which measures
at what points in time. The Total Staff Sample is made up
of several smaller samples on which different data were collected
at different points in time.
The subsequent sections describe in the first place the
general background characteristics of SYC staff based on the
results of the Social and Professional Identity Questionnaire
and Byrne's Health and Opinion Survey using the Total Sample of
workers. Next, Palmer's method of classifying worker character-
istics is used to describe 72 workers (Sample 2) followed by a
description of workers' self-stated preferences for treatment
approaches based on the Total Sample's responses to Jesness'
Staff Preference Survey. Again using the Total Sample, workers
are described according to Hunt's classification system. The
final measure, the Staff Intervention Questionnaire, surveyed 64
workers' and supervisors' ratings of daily interactions and
interventions (Sample 4).
Chapter I ends with a presentation of a statistical analysis
comparing the characteristics of T 1 staff (Sample 1) with those
of T 2 staff (Sample 5) in order to determine the constancy of
SYC's worker profile.

18
Measures
TOTAL March 1976 - Oct. 1977
137
Table 1
Summary of Measures, Staff Samples, and Testing Dates
Sample Date
1 March 1976 Social & Professional Identity Ques. 64 (T 1 ) Byrne's Health & Opinion Survey (R-S) 60(4) a
Jesness' Staff Preference Survey 63(1) Hunt's Classification of Workers (CL) 62(2)
64
II 2 Sept. 1976 Palmer's Classification of Workers 72 March 1977
II 3 In Between Social & Professional Identity Ques. 18 T 1 & T 2 Byrne's Health & Opinion Survey (R-S) 9(9)
Jesness' Staff Preference Survey 11(7)
II Hunt's Classification of Workers (CL) 11(7)
18
II 4 April 1977 Staff Intervention Questionnaire - Self 61(3)
- Observer 64
II O 64
5 Oct. 1976 Social & Professional Identity Ques. 8 0 ( 1 2 ) Byrne's Health 6 Opinion Survey (R-S) 69(11)
II Jesness' Staff Preference Survey 72(8) Hunt's Classification of Workers (CL)
71(9)
80
• Social & Professional Identity Ques. 137 Byrne's Health & Opinion Survey (R-S) 114(23) Jesness' Staff Preference 122(15) Hunt's Classification of Workers (CL) 121(16) Palmer's Classification of Workers 72(65) Staff Intervention Questionnaire - Self 61(76)
- Observer 64(73)
Numbers in parentheses indicate missing cases.
Includes Samples 1, 2, 3, 4, and 5. As the same 25 people are included
in both Samples 1 and 5, the Total Sample is calculated as follows:
64 (s.1) + (18 (s.J) + 8o(s.5) 25 = 137.

19
General Background Characteristics
SYC staff as a group could not be easily characterized; that
is, it is not a homogenous group. Two-thirds of the staff are
male. Almost one-third are single and a few are divorced. The
age averages from 22 to 38, with a mean of 30.3 years. Over
three-quarters of the staff had permanent employment before they
were engaged by SYC. Of those who had been previously employed,
approximately 60 percent worked in the health and social services
field. SYC's Personnel Department supplied data concerning the
workers years of related experience a which ranged from 0 to 18
years with a mean of 4.7 years.
Almost 80 percent of SYC staff have completed post-secondary
studies. This stands in contrast to the 55.3 percent of the
personnel in 62 reception centers in Quebec who have some certifica-
tion (Batshaw Report, 1975, Annexe 3). Of those SYC staff who are
certified, one-quarter hold a CEGEP diploma in either Special Care
Counselling or. Child Care Work, while approximately one-third of
the staff group have undergraduate degrees, generally in the social
sciences field. The remaining individuals have either graduate
degrees in social work, counselling, or psychology, or certifica-
tion from the legal, medical or teaching professions. One-quarter
of the staff are either studying for a CEGEP diploma or an under-
graduate degree, while almost one-half of the workers have
a Based on number of months a person held a permanent position in
a hospital, social service, teaching, or supervisory work, plus
half the number of months the person worked in other types of jobs.

20
Characteristic Percent Mean SD
Demographic Male Female
66.4 33.6
35.0 57.7 7.3
Single Married Divorced/Separated
1
78.1 21.9
61.1 38.9
4.7 3.63
22.6 26.3 32.1 12.4 6.6
72.3 10.9 12.4 4.4
45.3 54.7
Table 2
Background and Social Characteristics of SYC Staff a
Age in Years 30.3 8.19
Employment Previously Empl.
,Not Previously Empl.
Previous Related Empl. No Previous Related Empl.
Yrs. of Related Experience
Education No Diploma/Degree CEGEP Undergraduate Graduate Other
Certification Program None CEGEP Undergraduate Graduate
Staff Development Courses Participa tedb Did not Participate
Work History at SYC Months with SYC 22.3 24.13 Months in Present Unit 11.8 12.61 Previous Units .9 .87 Previous Positions .6 .81
a n 137
Staff who participated during the last six months.

21
participated in staff development courses in the last six months.
Types of courses taken: 1-Level Classification Training, Parent
Effectiveness Training, Reality Therapy Workshops, as well as
undergraduate psychology, sociology, social work, and management
courses.
Staff stay with the Agency a little less than two years,
although the variability of stay is very high (SD 24.13 months).
SYC staff's average length of stay is a little less than the 2.9
years .Vinter (1976) reported in his study of 749 institutional
staff, while the Quebec Batshaw Report found that 71 percent of
the frontline staff in 62 institutions have worked in their
present agency less than three years. Although persons may stay
with SYC for two years, their average length of stay in any one
unit is less than one year. Again the range is very high (SD
12.61 months). Almost half of the staff group previously worked
in another unit and held another position.
In summary, SYC staff as a group are relatively young, well
educated, mobile, and experienced. However, this profile must be
tempered by a recognition of the variations in background
characteristics.
Res•onse to Anxiet and Measure of Ad'ustment
Another background characteristic can be deduced from
workers' responses to Byrne's Health and Opinion Survey (1961,
1964), a 120-item True and False questionnaire, which produces a
score placing an individual on the Repression-Sensitization scale.

22
I
Byrne found that individuals may be placed along a Repression-
Sensitization continuum with respect to their characteristic
response to threatening stimuli. Avoiding mechanisms such as
denial, projection, and rationalization are characteristic of
individuals on the repressing end of the scale while approaching
mechanisms such as intellectualization and constant worrying are
found among persons scoring on the sensitizing end of the scale.
It was considered important to understand how SYC workers would
respond to anxiety and stressful stimuli and how this response
would affect interactions with youth, colleagues, and supervisors.
Furthermore, this measure gives an indication of overall
personality adjustment or maladjustment. Feder (1967) and Byrne
citing his own and his colleagues' work (1964, pp. 195, 196 and 199)
concluded that very high sensitization is correlated with
emotional disturbance, while repression with healthier osvcholoalcal
functioning.
1.
Hi
Persons with predominantly repressing reactions to stress and
those persons with predominantly sensitizing approaches to anxiety
operate differently. Therefore, in a team situation, workers
with either one of these styles have different strengths as well
as different problems in anxiety-provoking situations. For
example, Krohne (1970) and Krohne and Schroder (1972) found that
repressers searched for significantly less information than
sensitizers or non-defensive subjects under stress conditions.
Furthermore, repressors process less information when the ambiguity
of the stimulus situation is increased. On the other hand, although
sensitizers actively seek information in stressful situations,

2 3
their form of defense markedly reduces their ability to integrate
the information under arousal conditions. Non - defensive persons
were found open to and could integrate information in different
situations of increasing environmental complexity.
Another difference between sensitizers and repressers that
Baldwin (1974) found is that sensitizing people talked more about
personal and social problems in therapy, while repressers presented
vocational and educational concerns. Furthermore, repressers
expected more structured, formal sessions than sensitizers who
considered spontaneous talking and self-disclosure important in
psychotherapy.
Table 3
Frequency Distribution on the Repression-Sensitization Scale
of Byrne's Normative and the SYC Staff Samples
Normative Sample a SYC Staff
Score Range
100-109 3 .2 o 0
90- 99 14 1.1 o o •
80- 89 4 0 3.1 o o
70- 79 76 5.7 1 .9
6 0 - 69 115 8.2 0 0
5 0 - 59 185 14.2 5 4.4
4 0 - 49 238 18.2 4 3.5
30- 39 269 20.6 18 15.8
20- 29 221 16.8 38 33.3
Io- 19 123 9.4 34 29.8 o- 9 20 1.5 14 12.3
n 1,304 114 — M 42.25 23.39
SD 20.10 12.25
n
a Byrne, Barry, and Nelson, 1963, p. 327.

24
Table 3 states that three-quarters of SYC staff have a
predominantly repressing reaction to stress situations, while only
one person has a sensitizing score higher than Byrne's average
range. Generally then, SYC staff are on the "more healthy" end of
the R-S scale.
However, SYC staff with low R-S scores or higher R-S scores
may respond differently to the same situation and therefore need
distinctive supervision. For example, those workers who can
absorb, avoid, or "repress" a fair amount of stress may sometimes
need to examine the information that provokes anxiety in order to
effectively change a situation. Too much repression or aLsorption
decreases openness to important information. On the other hand,
those workers who continually look for information, and worry,
talk, and "sensitize" to every piece of "news" need to slow down
so that they can integrate and use information rather than overload
themselves.
Palmer's Classification of Worker Characteristics
Having briefly described the general background characteris-
tics of the total SYC staff sample, we can now look in depth at
the personality characteristics and professional orientations of
parta
of this total sample. This section presents results based
on Palmer's method of classifying worker characteristics into
"subtype specialists" àppropriate for effective treatment of the
live I-Level youth .subtypes b . The method . was influenced by a
a Sample 2, n 72.
Appendix 1 contains a brief description of the five youth types.
2 5
number of studies with probational/parole officers and psycho-
therapists (Grant & Grant, 1959; Palmer, 1963; Sundland & Barker,1962)..
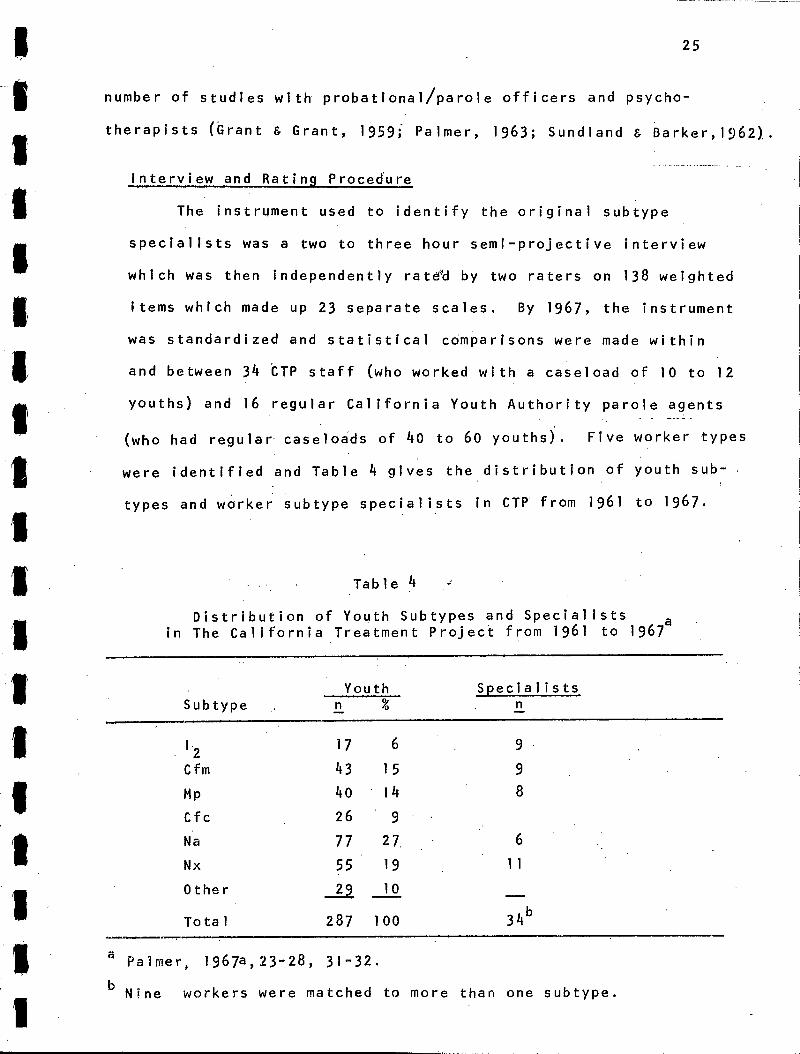
Interview and Rating Procedure
The instrument used to identify the original subtype
specialists was a two to three hour semi-projective interview
which was then independently rate'd by two raters on 138 weighted
items which made up 23 separate scales. By 1967, the instrument
was standardized and statistical comparisons were made within
and between 34 CTP staff (who worked with a caseload of 10 to 12
youths) and 16 regular California Youth Authority parole agents
(who had regular caseloads of 40 to 60 youths). Five worker types
were identified and Table 4 gives the distribution of youth sub-
types and worker subtype specialists in CTP from 1961 to 1967.
Table 4
Distribution of Youth Subtypes and Specialists
in The California Treatment Project from 1961 to 1967a
Youth Specialists Subtype n.
%
1-2 17 6 9.
Cfm 43 15 9
Mp 40 • 14 8
Cfc 26 9
Na 77 27 • 6
Nx 55 19 • 11
Other 29- 10
Total 287 100 34b
a Palmer, 1967a,23-28, 31-32.
Nine workers were matched to more than one subtype.

1
1
1
1
In 1971, SYC began using the formal matching procedures as
developed by CTP, to select workers for its first community-based
treatment unit in Montreal. The GRIJ Research Team decided to
adapt the CTP interview schedule and to score the interviews on the
105 items of the revised Rating Inventory (Palmer, 1968; Howard,
1972) a . All full-time, frontline staff and supervisors working
in the five cottages, six group homes, and two project centers of
SYC from September 1976 to March 1977 were interviewed. The
community workers who had been "matched" upon hiring were not re-
interviewed provided their scores and rating sheets were available.
Information was collected on 72 workers, 17 of whom had been previ-
ously rated upon hiring.
Each interview was tape-recorded. The interviewer relistened
to the tape and used the information to rate 104 a items; this
process was repeated independently by another rater. Seven tapes
were also rated by a third person. The total process of inter-
viewing, rating, second-rating, and scoring took from 12 to 15
hours per subject.
The first 35 items of the rating inventory are rated on a
5-point scale from far more to far less than the average person
of the same sex. The next 18 items use the same 5'-point scale
but in comparison to the average probation/parole/helping agent
of the same sex. An absolute 5-point scale froM very true to very
untrue is used for the next 32 items. The final 19 items use an
71------7 a The interview schedUle and the 105 items from the Rating Inventory.
are in Appendix 1.
We dropped one item from the inventory as there was not enough information in most interviews to rate it.

27
absolute 4-point scale. Obviously, this rating system is compli-
cated, with much room for subjectivity, especially as the meaning
of the items and the reference groups are not completely clear
or standardized. This is one of the limitations of the instrument,
in addition to the time and training needed to master the interview
schedule and rating scheme. Therefore, the two independent
ratings and a high inter-rater reliability are prerequisites to
minimizing the vagaries of this instrument. a
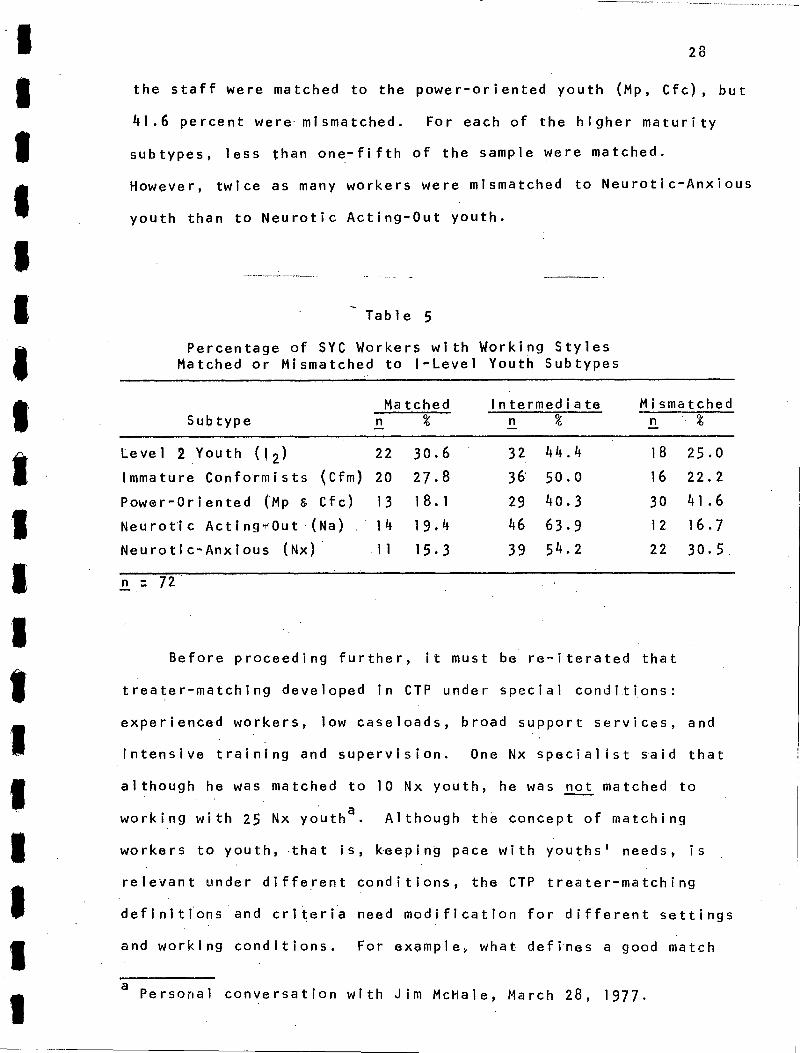
Findings on 72 SYC Staff
Tables 5 and 6 present the percentage of SYC workers who were
matched or mismatched to specific subtypes, and the percentage who
were matched to more than one subtype. Matching means that a
worker's weighted scores on the 104 items of the rating inventory
produced a final score that indicated a significant openness and
ability to work with a certain 1-Level youth subtype. A mismatch
means that the score was low on a scale, signifying a marked
inappropriate orientation for effective work with a youth type.
Original and revised criteria for a match and a mismatch for each
youth type are presented in Appendix 6, Table A. As only two of
the 72 workers were matched to Mp/Cfc's according to Palmer's
original cutoffs, the criterion was lowered in order to include 11
more workers. Three of the five mismatch cutoffs were raised in
order to take the distribution of SYC's staff scores into account.
Almost one-third of the 72 workers were matched to dependent,
immature, conforming youth (1 2 and Cfm), while one-quarter were
mismatched. Even with a lowered criteria, only 18.1 percent of
a On 38 interviews we had a significant correlation on the five
pairs of final subtype scores, and on 91 out of the 104 pairs of
items (Appendix 6, Tables B and Cl. The original independent ratings were not available on the remaining interviews.
Matched Intermediate Mismatched n % n % n % _ Subtype
28
the staff were matched to the power-oriented youth (Mp, Cfc), but
41.6 percent were mismatched. For each of the higher maturity
subtypes, less than one-fifth of the sample were matched.
However, twice as many workers were mismatched to Neurotic-Anxious
youth than to Neurotic Acting-Out youth.
- Table 5
Percentage of SYC Workers with Working Styles
Matched or Mismatched to I-Level Youth Subtypes
Level 2 Youth (! 2) 22 30.6
Immature Conformists (Cfm) 20 27.8
Power-Oriented (Mp g Cfc) 13 18.1
Neurotic Acting , Out (Na) 14 19.4
Neurotic-Anxious (Nx) 11 15.3
32 44.4
36 50.0
29 40.3
46 63.9
39 54.2
18 25.0
16 22.2
30 41.6
12 16.7
22 30.5
72
Before proceeding further, it must be re-iterated that
treater-matching developed in CTP under special conditions:
experienced workers, low caseloads, broad support services, and
intensive training and supervision. One Nx specialist said that
although he was matched to 10 Nx youth, he was not matched to
working with 25 Nx youth a . Although the concept of matching
workers to youth, that is, keeping pace with youths' needs, is
relevant under different conditions, the CTP treater-matching
definitions and criteria need modification for different settings
and working conditions. For example, what defines a good match
Personal conversation with Jim McHale, March 28, 1977.

29
for a residential worker in a unit for 14 Cfm youth or for a case-
worker with 25 and not 12 youth? Modifications of the matching
cut-offs were tried for the CTP workers in a residential unit
during the third and final phase of the CTP research, and in
a conversation with Palmer , he said it was possible to select a
reasonably good worker type by sllghtly lowering the original
criteria.
Secondly, it must also be pointed out that although matching
workers to youths may be highly desirable, it may be even more
important and probably more feasible to avoid mismatches.
Therefore, it is recommended that when each of the matched worker
types are described in the following pages on the interview
personality characteristics and professional orientation scales,
the opposite description or low scores on the relevant scales
should be kept in mind.
Table 6 demonstrates that 41.7 percent of SYC workers were
not matched to any youth type; almost 20 percent were matched to
one type and 40 percent were matched to more than one subtype.
Table 6
Percentage of SYC Workers Matched to More than One Youth Subtype
Ntimber of Matches
0 30 41.7 1 14 19.4 2 22 30.6
3-5 6 8.3
72 100.0
a October 17, 1977.

Subtypes.
30
Even though it would be desirable to select workers who are matched
to more than one subtype, for the purposes of describing each of
the different types of matched SYC workers, a breakdown was made
of their predominant match as shown in Table 7. Thus, out of 42
matched workers, there were eight individuals appropriate for 1 2
youths, 11 matched to the Immature Conformist youth, 8 at least
moderately suitable for work with Mp and Cfc youth, 6 Na
specialists, and 9 Nx specialists. In eight cases, workers were
equally well matched to two subtypes. The match chosen was •based
on an evaluation of the workers' complete interview profiles.
Table 7
Percentage of Matched Workers by Strongest Match
I2
8 19.0
Cfm 11 26.2
Mp/Cfc 8 19.0
Na 6 14.3
Nx 9 21.5
SYC Matched Workers
In the original rating inventory, 138 items broke down into
23 personality and professional orientation scales. Palmer
analyzed the differences between worker specialists on both the
items and scales. The revised inventory, which we used to rate
and compare matched workers, was made up of 105 items and 21 scales.
Figure 1 contains a brief description of the scales: A list of
the items making up each scale can be found in Appendix 1.

31
Figure 1
Personality Characteristic and Professional Orientation Scales
1. SOCIALLY DESIRABLE QUALITIES include characteristics such as pleasantness, friendliness, patience, self-confidence, and resourcefulness.
2. ATTRIBUTES MOST ADOLESCENTS WOULD LIKE include a sense of
humour and quickness, an ability to talk their language; "been around"; an enjoyment of youths' activities.
3. By a QUICK, SHARP MENTALITY is meant a quality of inquisitive-
ness and originality as compared to the average person, and a broad perspective and intellectual flexibility as compared to the average person in the helping profession.
4. BOLDNESS relates to directness, outspokenness, and taking chances.
5. FORCEFULNESS connotates a strong presentation of emotions and ideas.
6. SOCIALLY UNDESFRABLE QUALITIES include stubbornness, impatience,
unpleasantness, , and à temper.
7. Covert or overt AGGRESSION refers to the threatening nature of the worker (including size and first impression); his/her competitiveness and unpleasantness, as well as involvement in conflicts with others.
8. PAST DIFFICULTIES concerns the amount of personal struggle and conflict worker feels he has gone « through and overcome.
• 5. PRESENT PROBLEMS reflects the obsen:fer's rating of the worker's anxiety, fears, self-esteem, inner peace, and resolution of personal problems.
10. MORALISTIC ORIENTATION relates to concern with.right and wrong; law and order; operates in terms of abstract standards as contrasted to expediency, pragmatics, and consensus.
11. SATISFACTION WITH WORK refers to enjoyment in work and accomplishments with youth.
12.. SATISFACTION WITH THE WORLD/AGENCY means a basic acceptance of society's values and a feeling that this country (and the agency) are general "OK" places to be in.

32
Figure 1 (Cont'd.)
Personality Characteristic and Professional Orientation Scales
13. FAMILIARITY WITH CLIENTS refers to a view of being a friend
or a Big Brother/Sister to the youth, as well as to a style
that permits the youth to set the pace in a relationship.
14. UNDERSTANDING AND DIFFERENTIATION OF CLIENTS connotates an awareness of personal emotional responses to clients; a differentiation between face value and inner meanings; and
an understanding of youths' behaviors and emotions.
15. USE OF SELF AS A FRAME OF REFERENCE pertains to a belief that youth can benefit from experiences, satisfactions, goals, and conquering •of inner problems somewhat similar to one's own.
16. The ATMOSPHERE of a relationship is based on eleffients of
trust, acceptance, consistency, explanation, and confidentiality.
17. Concern with NEGATIVE REACTIONS refers to being aware and working through angry, guilty, aggressive feelings in oneself and in the clients.
18. INNER FOCUS relates to the development of a strong "casework" relationship in order to focus on and clarify , inner feelings, and to work on anxiety and self confidence concerns.
19. A strong orientation toward CHANGE AND ACTIVITY includes a
style that prefers action, excitement and change to thought,•acceptance, and waiting.
20. FIRMNESS — FINALITY refers to an inclination for strictness• and straightforwardness, tough-mindedness, and certainty.
21. Concern with CONTROLS AND LIMITS suggests a focus on authority, rules, obedience, and consequences.

33
Of the five final subtype scores (which indicate how "matched"
an individual is to a youth type) all significantly differentiated
the workers. Out of the personality scales, 13 significantly
differentiated the five worker types. These 13 scales are:
(1) Alertness, (2) Boldness, (3) Forcefulness, (4) Socially
Undesirable Qualities, (5) Aggression, (6) Moral Orientation,
(7) Agency/World Satisfaction, (8) Familiarity, (9) Understanding
and Differentiating, (10) Atmosphere, (11) Inner Focus,
(12) Firmness, and (13) Concern with Control. The bar graphs in
Figure 2 diagrammatically present these 13 differences between
the five worker types while Table 8 gives the median scores each
worker type had on all 21 scales.
In essence, then, our research supports two of Palmer's
findings: In the first place, characteristics of workers can be
reliably identified and measured; and secondly, workers can be
differentiated from each other. Furthermore, the 13 scales
differentiating our five worker types are quite similar to the
differences Palmer found between his specialists (1967a). Thus,
the following descriptions of each worker type are remarkably
similar to his descriptions of the subtype specialists (1967b).
Besides describing. a matched worker, the characteristics
of a mIsmatched worker for each youth type is presented. These
descriptions are not based on statistical comparisOns between
matched and.mismatched workers for every subtype.. Appendix 6,

Mp
Cfm •••■•■•••■•
2
Na
Nx
8
7 ••••■
o o
I 6 0
m 5 ru
a) 11 •■■
co o
3
(3) a
171;
Cfm
1 2
Afertness
Mp Nx
• ■■■•■•■■■■
Boldness (4) 8
7
6
5
4
3
Mp 1•■■•••••11
Na
Nx
Cfm
5
4
3
2
Socially Uddesirable Qualities (6)
7
Mp
2
Na
Nx .1•■■•+, Cfm
1■••••••••••
Forcefulness (5)
5
3
2
8
7
34
Figure 2
Differences between SYC Matched Workers On Interview Scales
Matched Workers Matched Workers
, p‹.001 .
Matched Workers Matched Workers p<.001 p<. 001
a The third of the 21 interview scales.

35
Na 2 Cfm
Ille■•••■••11
Matched Workers Matched Workers p<.001 p‹.001
World Satisfaction (12) Familiarity (13)
12
Mp
Cfm
7
2
8 .2,
Na Cfm Cfm
Na
•••■•■ 5
3
Mp
8
-7 o .•■■
6 o
.0 5
0 4
,•■••
v.) 3
8
7
6
5
4
3
2
Na .11.11■,
6
5
4
3
2 ■■••••■••••••••
Mp fi x
Mp 1•■■••■•1
Figure 2 (Cont'd.)
Differences between SYC Matched Workers On Interview Scales
Aggression (7) Moral Orientation (10)
Matched Workers Matched Workers p<.01

9
8 •••■•••■•
7
Mx 1 2 Cfm
Mp
Na ri•••■•••■■yr
6 3 Figure 2 (Cont'd.)
Differences between SYC Matched Workers On Interview Scales
0 0 ••-• -
Sc
a 1
e R
an
ge
o
- 8
I 7
6
5
3
Understanding and Differentiation (14)
Nx
2 gr'Irl
6
5
4
3 Matched Workers Matched Workers
p‹.05 p<.01
Atmosphere (16)
•■■■••••• Mp
Cfm Nx r-]
Inner Focus (18)
9
8
7
6
4
3 Matched Workers
p 05

fm
Firmness (20) Concern with Control (21)
81
Mp
Na
2 Cfm .
8
7
6
5
4
3
2
Nx
6
Figure 2 (Cont'd.)
Differences between SYC Matched Workers On Interview Scales
37
0 0 •••••■
o
Sc
a 1
e
Ra
ng
e
Matched Workers p<.001 p<.001
Matched Workers

Ile 11011 MD 11111 11011 111111 us MI ea MO
Table 8
_Comparison, of the Medjan Scores of SYC Matched Workers_ on Interview Scales
Scales
Total Staff Matched 'Workers a (n=72) I - -2 Cfm Mp Na . Nx Kruskal-Wallis M SD (n=8) (n=11) .(n=8) (n=6) (n=9) XL .2.
1. Soc. Des. Quai. 62.3 11.3 64.6 68.1 70.1 70.1 73.6 5.6 0 .231 2. Attr. Adol. Like 57.8 10.7 63.6 59.0 63.5 61.5 54.2 3.76 .439 3. Alertness 6 0 .8 14.3 58.8 55. 0 65. 0 81.3 69.4 12.06 .017 4. Boldness 56.1 15.7 40.6 43.9 72.7 61.5 50.0 18.37 .001 5. Forcefulness 48.2 11.4 44.8 36.8 6 0 .4 49.9 44.3 17.93 .001 6. Soc. Undes. Quai. 43.1 13.1 36.4 27.6 54.2 43.8 32.8 24.26 .001 7. Aggress. 37.7 14.2 27.1 27.8 52.9 34. 0 20.8 23.07 .001 8. Past Diffc. 61.9 16.7 71.9 62.5 61.5 71.9 74.5 4.64 .327 9. Present Prob. 41.1 16.2 50.0 42.2 25.7 31.3 33.3 9.39 . 0 52 10. Moral Or. 37.2 14.3 34.1 31.2 48.5 35.9 18.7 19.17 .00 1 11. Work Sat. 75.2 13.3 70.8 82.3 85.4 72.9 82.3 4.09 .393 12. World Sat. 51.9 13.1 53.5 62.5 52.1 35.4 48.9 17.09 .002 13. Familiarity 63.0 12.1 79.2 64.9 58.7 61.5 52.1 15.47 .o 0 4 14. Und. & Diff. 69.7 14.5 72.4 74.2 70.3 71.9 90.6 12.29 .015 15. Use of Self 64.6 14.9 76.6 58.8 61.5 57.1 71.3 3.24 .519 16. Atmosphere 78.5 8.7 79.4 85.0 74.5 81.6 85.8 13.97 .007 17. Con. Neg. Re. 57.5 10.1 55.1 55.6 64.1 58.0 60.8 3.25 .517 18. Inner Focus 73.0 13.2 80.9 78.7 75.9 69.6 85. 0 9.72 .045 19. Chg. & Act. 45.0 6.0 42.1 42.7 43.1 43.6 43.3 2.57 .632 20. Firmness 44.5 15.3 35.9 34.4 60.9 42.2 28.9 25.07 .00 1 21. Con. Control 43.1 15.5 38.2 34.5 61.8 39.1 29.5 17.32 .002
Subtype Scores
1 2 Cfm Mp/Cfc Na Nx
4.3 6.5 9.8 9.3 2.5 3.0 9. 0 17.06 .002
• 3.8 11.3 9.5 15.0 - 8.0 4. 0 11.1 29.33 .00 1 -5.8 10.7 - 12.5 - 12.0 7.5 6.5 - 9.7 24.50 .001
3.7 4.7 5.3 2.9 7.8 10.5 5.3 17.39 .002 -4.8 17.9 3.5 9.8 - 11.5 - 2.5 18.0 28.85 .001
CO
a Statistical analysis of the differences between the matched workers.

39
Tables E through 1, contain the figures for matched, intermediate,
and mismatched workers for each youth subtype, and comments are
made only on the more obvious differences between a matched and
mismatched worker type.
Workers appropriate to lower maturity, dependent youth (1 2 's,
Cfm's). These workers tend to be pleasant, patient, accommodating,
and non-threatening individuals who can let a lot "run off their
backs". They feel they need to protect the youth at times, and
are more interested in understanding the situation from the
youth's point of view than the right or wrong of an incident. An
easy-going, rather lenient, playful attitude characterizes their
relationship with youths. An atmosphere of trust, consistency,
and acceptance is considered essential to treatment progress.
1 2 specialists are more playful, enthusiastic, familiar and
friendly in their interactions with youth, while Cfm workers are
more retiring and "homey". Secondly, Cfm specialists are more
optimistic and satisfied with the Agency/world/culture than all
other specialists.
• According to Tables D and E in Appendix 6, workers mis-
matched to either 1 2 or Cfm youth are far more likely than matched
workers to have higher scores on the Socially Undesirable Qualities,
Aggression, Moral Orientation, Firmness, and Concern with Control
scales.

40
Workers appropriate to lower maturity, assertive, power-
oriented youth (Mp's, Cfc's). This type of worker is less likely to
be hired by SYC than any other worker type. Even with a lowered
cut-off point, only 18.1 percent of SYC staff could be seen as
moderately matched Mp workers while 41.6 percent were definitely
mismatched (Table 5). However, as only 4.6 percent of the 217
youths in SYC (1977) were diagnosed as Mp and Cfc, the need for
this worker type is not high.
An Mp worker is least like a Cfm or 1 2 worker. More than any
other specialist, he is firm, direct, bold, and forceful. He has
a higher score than others on Socially Undesirable Qualities and
Aggressiveness, although his score is average in relation to the
normal adult. On the Present Problem scale, he scores lower
than other workers. Again, more than other specialists, the Mp
worker is concerned with the rights and wrongs of the situation,
society's rules, and the importance of authority. He tends to
put some social distance between himself and his youths, especially
during the initial phase of treatment. In common with the other
workers, the Mp specialist emphasizes a working atmosphere of
trust and consistency, understands the meaning of a youth's
behaviors, and focuses on building a youth's self-esteem. The
seemingly contradictory phrase of "caring, sensitive, hard-nosed
individual" may capture the essence of an Mp specialist.
Workers considered inappropriate for power-oriented,
assertive youth score 15 to 20 points a lower than matched workers
a 51 from 0 to 100.

on the scales of Alertness, Boldness, Forcefulness, Aggression,
Socially Undesirable Qualities, Moral Orientation, and Firmness
(Appendix 6, Table F).
Workers appropriate to Higher Maturity, Assertive Youth (Na's).
In some ways Na workers share the characteristics of Mp workers:
they tend to be bright, bold, rather firm, interesting types of
individuals. However, Na workers tend to be less bold, directive,
competitive, forceful, and concerned with controls than Mp
workers, but more likely to be intellectually flexible. Further-
more, they emphasize a friendly adult relationship, avoiding a
distant authoritative stance (familiarity and atmosphere scales).
These worker différences seem to revolve around the fact that
although both Neurotic Acting-Out youth and Power-Oriented youth
tend to be assertive, independent types of individuals, the former
are of higher maturity than the latter. Hence, controls, authority,
and firmness would be more necessary for the lower maturity
children, while quick-thinking and some sharing are essential with
the higher maturity youths.
The three scales most differentiating matched from mismatched
Na workers are Socially Desirable Qualities, Alertness, and
Present Problems with the mismatched worker having lower scores
on the first two scales, and a higher mean score on the latter
scale. A number of other scales indicate trends: matched workers
tend to have higher scores on Attributes most Adolescents Like,
Boldness, Work Satisfaction, Understanding, and Differentiating,
Use of Self, Concern with Negative Reactions, and Inner Focus
(Appendix 6, Table G).

42
As only 18 out of the 105 items are weighted for the Na
subtype score, it is not surprising that few people were neither
matched nor mismatched to the Na youths, while the majority of
SYC staff (63.9 percent) would be considered intermediately
appropriate for Na youths. However, research findings show that
selection of matched, not just intermediate Na workers is vital
for effective casework with Na youths in the community (Palmer,
1977a).
Workers appropriate for higher maturity, dependent youth (Nx's).
Although 37.3 of SYC's clientele in 1977 were diagnosed as Nx,
only 15.3 percent of SYC people were matched while 30.5 percent
were considered mismatched to Nx youth (Table 5).
In many ways, Nx specialists have similar profiles to workers
appropriate for the lower maturity, dependent youth. They tend
to be retiring, non-forceful, patient individuals, who enjoy
cooperation rather than confrontation, exploration rather than
structure, and leniency rather than firmness. They, have a lower
score than all other subtype specialists on Moral Orientation,
Firmness, and Concern with Control. In contrast to the 1 2 and
Cfm worker, Nx specialists have higher scores on the Understanding
and Differentiation, Inner Focus, and Alertness scales and lower
scores on the Familiarity scale.
There are a number of scales that differentiate the matched
from the mismatched Nx worker. Matched workers have much higher
scores on Socially Desirable Qualities, Alertness, Understanding
and Differentiation, and Inner Focus scales; on the other hand,

voided, while matching a
43
they have lower scores than mismatched workers on Socially
Undesirable Qualities, Aggression, Moral Orientation, Firmness,
and Concern with Control scales (Appendix 6, Table H).
A comment is needed about the Nx workers and their low
scores on Firmness, Moral Orientation, and Concern with Control.
Palmer a has recently mentioned that the original conception of
the Nx worker had to be revised so that the control demands of the
correctional agency under which the agent worked could be met.
Therefore, it would be important for SYC to take into account a
worker's scores on the Firmness, Moral Orientation, and Concern
with Control scales as the scores could indicate his/her
orientation to control and authority. Just as important would be
the individual's openness to supervision concerning controls,
and a willingness to accept the law and authority demands of his•
or her job as an SYC worker.
Summary Comments
We have seen that although a fair proportion of SYC workers
were matched to at least one subtype, 41 percent were not matched
to any youth type. Although 15 to 30 percent of the workers
were matched to either one of the five youth types, 16 to 40
percent were mismatched. This situation implies that a SIC
youth could either have a matched or mismatched worker unless
mismatchins relatiohships were specificall
principles stressed.
Personal conversation, October 17, 1977.

44
Thus, in the next chapter we analyze whether or not the
workers with characteristics best suited to the needs of
different youth are actually assigned to the appropriate setting,
unit and caseload. Furthermore, appropriate characteristics and
assignment do not preclude the need for continual supervision and
support services and therefore these issues are discussed in
Chapter III.
Self-Rated Preferences for Treatment Approaches
Do SYC workers feel they are open to and enjoy using the
treatment approaches appropriate to the youth types they are
working with? Is there a correspondence between the orientations
and strengths of an individual as rated by an observer using the
previously described Palmer's classification system, and the self-
rated preferences and opinions of that individual, measured by
Jesness' Staff Preference Questionnaire? Answers to these
questions have conceptual and functional implications. For
example, if a person's preferences correspond closely to an
observer's ratings of strengths, it may be feasible to attempt
establishing a worker's "matchedness" in the context of I-Level
theory on the basis of a simple questionnaire rather than a
lengthy interview process. This is one area we would like to
explore in the following section.
The Staff Preference Surve/ as developed by Car! F. Jesness
(1972-1974) a was the measure chosen to explore personal preferences
- C. Jesness, Youth Centre Research Project, NRCC, Sacramento, Calif.

45
for the five a different treatment approaches appropriate to the
five major delinquent youth subtypes as determined by the I-Level
Classification system. A worker's raw scores for each of the
preferences are based on weightings given to his responses to the
60-item questionnaire. Raw scores are converted to standard
scores based on Jesness' work with a norm sample of 95 California
Correctional Institutional Staff and 88 highschool staff
(September 1974).
We labelled the five treatment approaches that Jesness
identified In the following manner:
1. "Accepting Friend" for 1 2 youth.
2. "Big Brother" for Cultural Conforming youth (Cfm).
3. "Control Structure" for Power-Oriented youth (Mp and Cfc).
4. "Behavior Reality" for Neurotic Acting-Out youth (Na).
5. "Insight Reality" for Neurotic-Anxious youth (Nx).
The first three approaches are more externally oriented, with
the focus on behaviors, environment, rules, activities, and
learning skills. The external orientation is seen as more appropri-
ate for immature, less socialized youths, while the internal
treatment style, which emphasizes understanding and personality
change, better matches the more complex, higher maturity youths.
a Actually, Jesness described six approaches. However, we
collapsed the Mp score and Cfc score into one score, as the
similarities outweighed the differences. Furthermore, this
merger would correspond to the Mp/Cfc California Treatment
Project Subtype Specialist.

External Focus Accepting Friend (for I 2 's) Supportive Big Brother (for Cfm's) Control Structure (for Mp/Cfc's)
Internai Focus Behavior Reality (for No's) Insight Reality (for Nx's)
52.3 52.2 57.3
8.6 11.2 9.2
55. 0 9.9 54. 4 9.3
46
Table 9
The Preference of SYC Staff for Treatment Approaches
Standard Approach Mean Deviation
n = 122•
Table 9 states that the total staff sample has similar scores
for the five approaches, but Figure 3 demonstrates that a certain
proportion of the workers have strong preferences for particular
approaches while other workers have weaker preferences. A strong
preference means that a worker has a score higher than 75 percent
of the norm population while a weak preference is based on a score
lower than 25 percent of the norm population (Jesness, n 183,
1974). Workers can have several strong or weak preferences at the
same time.a
In general, more workers have a strong preference than a•
weak preference for each approach. Nonetheless, there is a
variation as demonstrated in Figure 3. Approximately one-third
of the workers prefer the "Accepting Friend" approach. This means
they say they have the patience, compassion, and interest to work
a This situation occurs frequently, due to many questionnaire
items contributing to several preference scores.

46.7
60
55
Figure 3
Strength of Preference that 120 SYC Staff have for Different Treatment Appraches
11 Strong Preference Moderate Preference
Weak Preference
47
50
45
4-
4.) (f)
35' 4_ 0
0 m 30' 0
u 25 -
20 -
15
10
5
ACCEPTING FRIEND
BIG BROTHER
CONTROL STRUCTURE
BEHAVIOR REALITY
INSIGHT REALITY
Preferred Approach
/48
with youths who are seen as clumsy, helpless, aimless, demanding
attention, and slow to understand instructions. These workers
feel they need to protect a youth from the consequences of his
uncontrolled behaviors. Group activities are preferred to
individual counselling. This approach is considered appropriate
for the very primitive, unsocialized youths (1 2 )•
Workers who indicate a preference for the "Big Brother"
approach (43.4 percent) like to work with average, dependent
youths, who are not highly delinquent, Also, these staff would
not be frustrated working with those youth who have little
ability to verbalize their problems or who seem to have no
apparent aim in life. Clinically, this supportive, directive
approach is seen as beneficial for the Immature Conformist youth
(Cfm).
Thirty-eight percent of the workers prefer situations where
the structure is clear and the limits are tight while only 13
percent did not like this approach. Relationships are more
formal at first and the focus is on behaviors and consequences.
Some of these workers agree that they can deal with persons who
are emotionally disturbed and tend to repeatedly manipulate
people and situations. Other "Control-Structure" oriented workers
like dealing with group-oriented youths 'w ho are rather composed
and keep their problems to themselves.
Almost onerhalf of the workers prefer both the "Behavior
Reality" and "Insight Reality" approaches, while only 14 percent
49
do not prefer these approaches. Although the establishment of a
relationship with a youth who can verbalize somewhat and who has
some insight is important to both internal treatment approaches,
the workers who score high on the Behavior Reality orientation
prefer relating to the type of youth who acts independently and
at times aggressively. Individual counselling, in which
confrontation and shared decision-making concerning daily behaviors
and future plans occurs, is fundamental to this approach.
On the other hand, workers who prefer the Insight Reality
approach feel they can operate in a permissive climate with
youths who are very verbal and questioning. These workers tend
to see delinquent youths as emotionally disturbed and in need of
a lot of attention, encouragement, and a chance to talk. Neurotic-
Anxious youths are seen as best benefitting from this type of
approach.
In summary, more SYC workers have preferences for the
Behavior Reality, Insight Reality and Big Brother approaches,
than for the Control-Structure and Accepting Friend approaches.
Nonetheless, at least one-third of the workers prefer each
approach, and not more than one-quarter of the group do not prefer
each approach. Therefore, on the whole, over 75 percent of SYC
workers say that they prefer, or at least do not mind the
different approaches considered appropriate for the five I-Level
delinquent subtypes. This raises at least one important question:
Cana worker concretely implement his preference? The findings

Approach Appropriate for 1 2 Cfm Mp/Cfc Na
SD M SD M SD M SD M SD Matched Workers
Nx
50
suggest that most of SYC staff would be open to trying the treat-
ment approaches and interventions appropriate for the major SYC
youth types. a Whether or not this openness is capitilized upon
will depend on the caseload/group assignment, the supervision,
training, and support of the environment in which a worker finds
himself.
A second question posed at the beginning of this section
concerned the correspondence between an individual's self-rated
preferences and his ratings on the subtype score scales emerging
out of Palmer's classification system. To address this question,
Table 10 presents the mean preference scores of the SYC subtype
specialists.
Table 10
SYC Matched Workers' Preferences for Treatment Approaches
1 2 8 48.5 6,8 51.4 9.5 53.4 7.6 51.4 4.3 54.4 9.4
Cfm 11 52.7 8.9 52.3 11.6 48.5 8.8 59.5 13.0 51.8 18.0
Mp/Cfc 8 49.8 11.4 44.1 20.9 58.1 7.9 54.9 12.6 50.6 6.8
Na 6 51.8 9.7 48.3 5.2 57.8 10.6 50.3 12.5 50.7 13.1
Nx 9 54.1 9.0 51.4 11.4 54.2 5.8 57.1 8.2 >6.8 u2
The trends in Table 10 do not suggest any correspondence
•• o. It
between.observel's' ratings of matchedness and self-rated
a Cfm 22.6 2 ; Na = 32.7%; Nx = 37.3%; Other 7.4% (n 1. 217,
Harvie and Brill, 1978).

51
preferences, except for Mp workers. The four remaining matched
worker groups do not have very high scores on the preference
appropriate to the youth type to which they are matched. Although
the Nx workers do have a relatively high score on the Nx preference
scale, they also score high on the 1 2 , Cfm, and Na preferences.
Therefore, it is unlikely an individual worker's preference score
can reliably predict his appropriateness to an 1-Level youth type,
(except to Mp's) as determined by Palmer's method of "treater-
matching". One implication of our findings is that Jesness' Staff
Preference Survey cannot substitute for, or predict the outcome of
Palmer's more time-consuming method determining worker strengths
and weaknesses.
Hunt's Classification of Worker Characteristics
When SYC added the measure of Conceptual Level, refined and
researched by Hunt (1971, 1977, 1977-78), to the intake assessment
process of youths at SYC, in effect, a second classification of
youths and potentially of staff as well, was introduced into the
agency. As 1-Level theory classifies delinquent youths according
to their different motivations, response patterns, and treatment
needs, which can be matched by Palmer's five subtype specialists,
so too Conceptual Level theory differentiates individuals
according to their needs for structure and clarity for which a
parficular milieu and teacher/counsellor approach is appropriate.
As mentioned in the beginning of this chapter, the Conceptual Level
measure was chosen to assess staff characteristics because like

52
Palmer's classification of worker characteristics, it also captures
relevant to SYC's a constellation of personality traits that is
specific staffing needs.
Definition and Research Findings
"Conceptual Level is a characteristic based on a developmental
personality theory (Harvey, Hunt, and Schroder, 1961) that
describes persons on a developmental hierarchy of increasing
conceptual complexity, self-responsibility, and independence"
(Hunt, 1977-78, p. 78).
Persons lowest in CL are seen as being poorly socialized, egocentric, impulsive and cognitively simple. At the next stage, they are dependent on authority, compliant and con- cerned with rules. At the third level, they are independent, questioning and self-assertive. Finally, persons highest in CL are inter-dependent, empathic and cognitively complex. (McLachlan, 1974, p. 25)
Lower CL workers generally accept that certain cultural
norms and standards determine how an individual should behave.
Perspectives are limited and decisions are more categorical.
According to McLachlan, the overall style of a lower CL therapist
is directive, while the approach of the higher CL therapist is more
non—directive (1974). Heck and Davis (1973) found that high CL
counsellor trainees expressed a significantly higher level of
empathy toward clients than low CL trainees. In another study,
Murphy and Brown (1970) found that high CL teacher trainees were
much more likely to give positive rewards for students' searching
and hypothesizing while low CL trainees were more likely to give
directions and criticize.

53
As Conceptual Level indicates how a person interacts with
people, as well as his accessibility to situations and experiences,
CL gives an important clue to a person's needs, whether he be a
student, a teacher, a delinquent youth, or a child care counsellor.
In brief, research indicates that lower CL youth and adults profit
and learn most from a more structured, well-defined milieu/approach,
while high CL persons benefit from an environment promoting
independent exploration (Brui, 1977; Hunt, 1971, 1977-78;
McLachlan, 1974).
terms of the.needs of SYC youth, 31.7 percent of the 189
youth in October 1977 (Harvie and Brill, 1978) had very low
Conceptual Level scores and therefore would need a great deal of
structure and support in order to survive and grow. It is
essential to provide the appropriate environment for these youth,
especially as the lowest CL youth tend to be more maladjusted
and fail more miserably than do higher . CL youth •in an inappropriate
milieu (Brill, 1977; Brill and Reitsma, 1978).
One element of the environment is the worker-youth relation-
ship. A Neurotic-Anxious youth with a low CL would theoretically
benefit more from a clearly defined, somewhat directive therapeutic
relationship, while a higher CL Neurotic-Anxious youth could
profit Ifrom a less structured environment and exploratory type of
relationship. Thus, it would be instructive to ascertain the
effects of matching SYC workers to their youths in terms of CL
Matching Theory. To date, most research on CL matching has been

54
in terms of matching students, youths, clients, teacher trainees
to the appropriate environment. However, Carr (1970) and
McLachlan (1974) have explored the beneficial effects of matching
clients to their therapists in terms of CL. McLachlan reported
that after initial detoxification, 77 percent of the alcoholics
who were matched both to the style of their therapist and the
aftercare environment were fully abstinent after one year
following treatment. When clients were mismatched to the
therapist and aftercare milieu, only 38 percent recovered. (Five
therapists averaging 4.2 years experience in group therapy and
94 patients were involved in this study.)
In the final report on factors relating to youth change,Brill
(1978)analyzes the differential effectiveness of matching SYC
workers to youth in terms of the Conceptual Level matching model.
It would be an important issue for further research to explore
the effectiveness of matching workers to appropriate training and
supervision situations.
Instrument and Results
. To arrive at an individual's Conceptual Level score, two
ratersa
independently score a person's written reactions to
topics such as rules, criticism, au.thority, uncertainty, and dis-
agreement, using the Conceptual Level Scoring Manual as developed
by Hunt, Butler, Noy and Rosser (1978). An average is taken of
a .Our inter-rater reliability on 83 pairs of scored adult responses
was r = .74; on 189 pairs of scored youth responses, r = .88.

c.%) Score Range n CL Stage
55
the five a topic scores to produce the final CL score.
Table Al
Conceptual Level of SYC Staff
Unsocialized 0- .84 0 0 Norm-Oriented .85-1.65 30 24.8 Exploration-Oriented 1.65-2.10 69 57.0 Independent 2.11-2.89 22 18.2 Interdependent 2.9 + 0 0
n 121
Table 11 demonstrates that SYC staff are divided into three
of the five stages of conceptual development. Over half of the
stafffàll into the middle Exploration-Oriented stage of conceptual
development: these workers rely less on rules and standard
expectations and have begun to tentatively formulate personal
values. Twenty-four percent of the workers are in the Norm-
Oriented stage and are relatively , compliant and unquestioning of
basic social values and norms, even though they may sometimes
rebel against authority and standard expectations. The remaining
staff (18.2 percent) are in the assertive, self-defined
Independence-Oriented stage. The mean •CL of the complete group is
1.86. Hunt etal (1978) reports that the mean CL of 16 adult
groups including university students, teacher trainees, and
graduate students ranged from a low of 1.55 to a high of 2.05.
Therefore, the SYC staff mean CL does not differ much from the
mean of several other adult samples.
a The topic, "What I think about parents", had been dropped from
the original six topics.

56
In summary, according to both Palmer's and Hunt's classifica-
tions of worker characteristics, SYC selects different types of
staff. Whether or not SYC capitalizes upon the benefits of this
differential selection of workers by the appropriate assignment
and placement of workers is the topic of Chapter II.
General Behavior Characteristics
The previous sections described the personality characteris-
tics and professional orientations of SYC staff from a variety
of perspectives. Having established what the staff are like, it
• is time to explore what frontline workers actually do, keeping
in mind that the personality characteristics described influence
the manner in which an individual interacts with troubled and
delinquent youths. Yet, it is also important to recognize that
an individual worker's behavior is not only a product of who he
is, but also what is expected of him, and what resources are
available to him. Therefore e this section provides in the first
place a description of what SYC workers say they do and what their
supervisors think they do. Secondly, the findings provide a
basis for a beginning discussion in this chapter (and expanded
upon in Chapter III) concerning characteristics of the environment
in which SYC staff work.
The Instrument
For the Boscoville Evaluation Research Project a , Ménard, _
Cusso.n, and LeBlanc (1974) developed an instrument which attempted
to evaluate the quality of the interactions and interventions that
a Boscoville is a Centre de Réadaption for approximately 100
francophile delinquents.

57
occur regularly between workers and youths. Bélanger (1977)
discusses the theoretical background, the reliability, and the
validity of the instrument. In a summary report on the
Boscoville milieu, Cusson (1977) says that despite the limitations
of the Staff Intervention instrument, that is, the range possible
in interpreting the meaning of each item and the lack of standards
to rate against, the instrument measures what it proposed to
measure. The results may not validly demonstrate the quality of
interventions, but they do indicate that Boscoville staff live
up to their expectations of themselves and each other, and that the
staff follow the treatment principles that guide them (Cusson, 1977,
p. 19). In our experimentation with the instrument, we hoped to
collect information on what SYC workers emphasize in their work, the
quality of work, and a correlation between the perceptions of
supervisors and frontline workers about the level and type of
treatment interactions and interventions occurring in SYC units.
Moronval, Reitsma, and Brill translated and adapted the 111
item L'intervention des Educateurs questionnaire to SYC
conditions. The Staff Intervention Questionnaire (March 1977)
consists of 97 items each rated on a 7-point scale from never to
always. The items composed the following 17 scales a :
I. KNOWLEDGE: Well informed of youth needs and appropriate treatment interventions; ability to communicate in writing.
2. RELATIONSHIP: Ability to engage in quality relationships . .
3. MOTIVATION: Ability to interest youth in reaching objectives.
a Appendix I contains a more complete description of these 17
scales.

58
4. INDIVIDUALIZATION: Adapts goals and methods to youth
capabilities and interests.
5. SUPPORT: Gives appropriate help and encouragement.
6. VALUES: Approves and encourages appropriate behavior
and progress.
7. JUSTICE: Gives fair consequences for inappropriate
behavior.
8. INDIFFERENCE: Has excessive tolerance for unacceptable
conduct.
9. AUTONOMY: Encourages initiative and independence.
10. WORK WITH THE GROUP: Creates harmonious environment for youth; mediates conflict; integrates youth into group.
11. AUTHORITY: Controls the situation; is obeyed by youth.
12. FREE TIME: Organizes special activities; assists youth in structuring free time.
13. RESPONSIBILITIES: Appropriately delegates responsibilities; aids in meeting tasks.
14. PUNCTUALITY: On time when required.
15. TEAM WORK: Shares with and supports team members; assists team in achieving team goals.
16. GROUP MEETINGS: Effectively directs and participates in group meetings.
17. CHILD CARE: Organizes meals, wake-ups, etc, in a treatment perspective.
Findings
In the spring of 1977, 61 frontline workers e filled out the
self-rating form of the Staff Intervention Questionnaire, and 12
supervisors completed observer ratings. Table 12 gives SYC staff
scores as well as the scores of the Boscoville staff (May 1975).
Sample 4. (See Table 1)
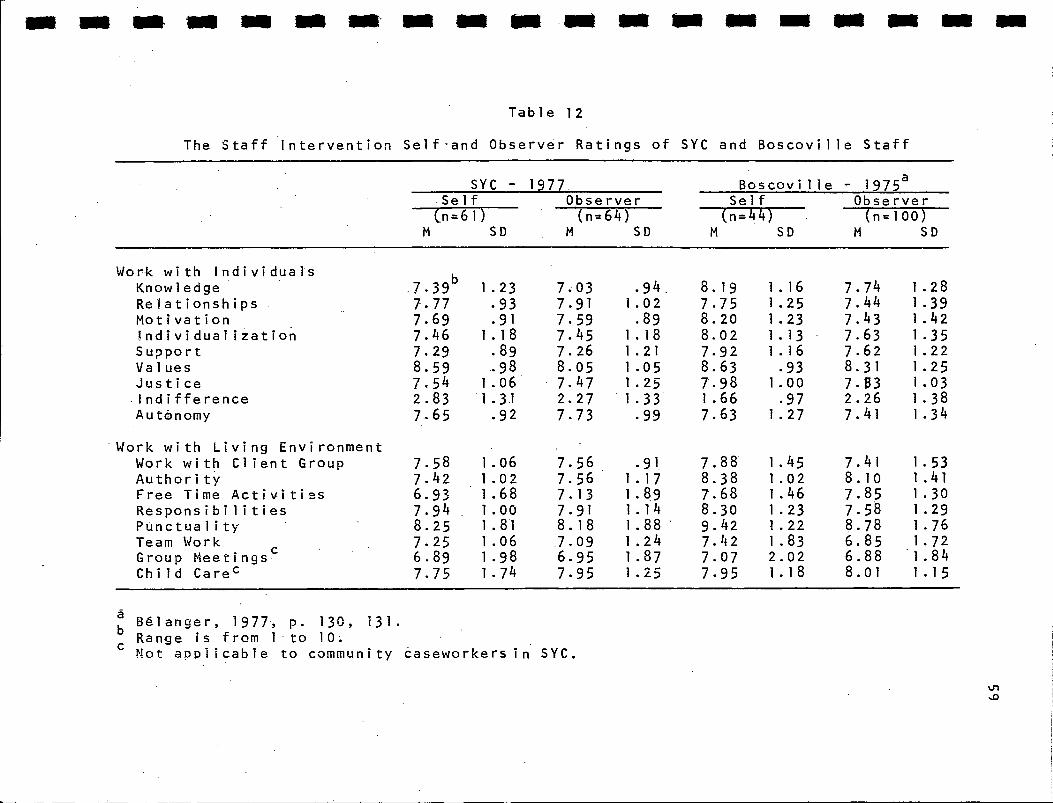
ea MS MS 1111111 MI 11011 BM 011111 MS MI 111011 110111 MS MI UM OM 110111
Table 12
The Staff Intervention Self - and Observer Ratings of SYC and Boscoville Staff
SYC - 1977 Boscoville - 1975 a Self Observer (n=61) (n=64)
Self Observer (n=44) . (n=100)
SD M SD M SD M SD
Work with Individuals Knowledge 7.39
b 1.23 7.03 .94 8.19 1.16 7.74 1.28
Relationships 7.77 .93 7.91 1.02 7.75 1.25 7.44 1.39 Motivation 7.69 .91 7.59 .89 8.20 1.23 7.43 1.42 Individualization 7.46 1.18 7.45 1.18 8.02 1.13 7.63 1.35 Support 7.29 .89 7.26 1.21 7.92 1.16 7.62 1.22 Values 8.59 .98 8.05 1.05 8.63 .93 8.31 1.25 Justice 7.54 1.06 7.47 1.25 7.98 1.00 7.03 1.03 Indifference 2.83 1.31 2.27 1.33 1.66 .97 2.26 1.38 Autânomy 7.65 .92 7.73 .99 7.63 1.27 7.41 1.34
Work with Living Environment Work with Client Group Authority Free Time Activities Responsibilities Punctuality Team Work Group Meetings c Child Carec
7.58 1.06 7.56 .91 7.88 1.45 7.41 1.53
7.42 1.02 7.56 1.17 8.38 1.02 8.10 1.41
6.93 1.68 7.13 1.89 7.68 1.46 7.85 1.30
7.94 1.00 7.91 1.14 8.30 1.23 7.58 1.29
8.25 1.81 8.18 1.88" 9.42 1.22 8.78 1.76
7.25 1.06 7.09 1.24 7.42 1.83 6.85 1.72
6.89 1.98 6.95 1.87 7.07 2.02 6.88 1.84
7.75 1.74 7.95 1.25 7.95 1.18 8.01 1.15
à Bélanger, 1977, p. 130, 131.
- Range is from 1 . to Not applicable to community caseworkersin SYC.

6 0
In general, SYC workers and their supervisors scored fairly high,
averaging between 7 and 8 out of a scale of 10. The Value scale
(which says that workers support and encourage youth who do well)
and the Punctuality scale were given the highest ratings by SYC
staff, while the lower ratings were given to Organizing Free-Time
Activities, Group Meetings, and Team Work scales. On the whole,
SYC workers and supervisors rated themselves somewhat lower than
did Boscoville staff.
The standard deviations per scale of both SYC and Boscoville
staff would suggest that there is a range in the quality of worker
interventions. Based on an overall assessment of the scores a
person gave himself or his employee on the 17 scales, three
levels of quality were established. Approximately one-quarter of
the staff fell into the lower level of quality, that is, their
individual scale scores were mainly lower than 7; one-half of the
staff were in the medium range from 7 to 8; and one-quarter of
the workers zonsidered themselves and were considered by super-
visors to be in the high quality level (>8). The difference
between self and observer groupings of quality appears negligible
(See Figure 4).
Can one conclude that there are some good workers, some
medium workers, and some poor workers? Unfortunately, this is not
self-evident. The difficulty in interpreting the data comes when
one examines the correlation between the observer and self-rating.
The correlation on all the scales was very low to almost non-
existent. Even though statistically seven out of the 17 scales

illîSelf (n=61)
Observer (n..:64)
27 .6 23.1
55
50
45
50.8 50.7
M 40 4-1
te.. 35 o
o .30 1
25 C O 20
a 15
26.2
21.5
1 0
5
High (Scores?.:8)
Medium (Scores 7 — 8)
. Lower (Scorese7)
6 1
Figure 4
SYC Staff Range of Quality on Staff Intervention Scales
OVeRALL RATINGS
had significant côrrelations . (Appendix 7, Table 1), not one
correlation was higher than .5. What does it mean? It suggests
that although the self-rating and observer scores in Table 12 and
Figure 4 seem similar, there is not a predictable correspondence
between how an individual worker rates himself and how he is
rated by his supervisor. For example, two supervisors consistently
rated their workers lower than the workers did themselves, while
two other supervisors consistently rated their workers higher. A
second example: one supervisor rated one employee very high on

62
all the scales, while the worker rated himself very low on all
but one scale; the same supervisor gave another employee much
lower ratings, while that worker gave himself high scores.
Discussion
Although self and observer scores on the subscales are quite
high, which could be interpreted as reasonably quality work, the
very , low correlation between self and observer ratings suggests
that SYC workers and supervisors are not rating themselves and
• each other from a common viewpoint. For example, a worker may
believe he has a good relationship with a youth while a super-
visor does not think so; both the worker and supervisor are•
measuring a nebulous task by different standards. It appears that
SYC workers broadly interpret what their jobs are and how to do
them.
Two other pieces of, evidence support this hypothesis.
the first place, the Staff Task Questionnaire, which was answered
by 53 frontline staff in April 1976, asked workers how they saw
their primary responsibilities, their approaches to particular
treatment tasks, and the time they allocated to certain responsi-
bilities. The range of answers was remarkable. For example,
team approaches to preparation for new clients ranged from no or
minimal preparation, to comprehensive, specific procedures. The
Staff Tasks report (Reitsma and Brill, 1977) concluded that there
was considerable variability in the conception of treatment and
the specificity of treatment methods, both within and between
teams.

ri
63
Secondly, in August 1976 the GRIJ Research Project concluded
that the "current state of the program development at the Boys'
Farm and Training School was so variable from one living unit to
another as to make continued applications of the stated research
model to the total set of programs not worthwhile" (LeBlanc and
Brill, 1976, p. 5). The major structural changes needed to provide
treatment services to anglophone girls and detention services to
both boys and girls exacerbated even further the problems of
maintaining stable program variables. This variability between
and within units made scientific evaluative research impossible
and the Research Project changed its focus from evaluation to
description and exploration.
In summary, the changed focus in the research project
(August 1976), the conclusions of the Staff Tasks report
(September 1977), and the results of the Staff Intervention
Questionnaire all point to the considerable variability that
exists among the SYC workers and supervisors in their perceptions
concerning the definition of treatment tasks and the level at which
they are carried out.
Given this variability and discrepancy in perceptions we
conclude that our information does not really indicate what SYC
workers do with youths. Although this variability in perceptions
about treatment tasks may be a logical outgrowth of a focus on
(a) different youths need different approaches, and (h) the
individual units and/or workers are the primary treatment

A4
resources and thereby quite autonomous, the amount of variability,
persisting over time and existing between a worker and his direct
supervisor, is disconcerting. What are the common standards and
reference points in treating youths? Can too many opportunities
for creative, flexible and autonomous action give rise to
inconsistencies and confusion? Can workers effectively treat
and control youths when they are not very sure what is expected
of them?
These questions raise troubling issues. A differential
treatment agency needs different types of staff to do different
types of jobs. The challenge lies in discovering, communicating,
and acting on the specified knowledge of what are the different
types of staff and jobs. In this first chapter we have reported
on the results of instruments that were designed to identify and
differentiate types of staff, and we conclude that SYC does hire
specific types of different staff. The next chapter explores
whether these different types of staff are then assigned to the
setting, unit, and caseload that their personal characteristics
and professional orientations are best matched to. The final
chapter picks up these issues about specificity or variability
in job expectations, as one of the conditions in a working
environment that can promote, or hinder, effective work with youth.
Stabilit of Worker Characteristics
.Total Agency
Before completing this chapter it is necessary to ascertain
the stability of SYC worker characteristics so that the staff

71.9 28.1
37.5 56.3 6.3
30.2 8.23
75.0 25.0
58.3
41.7
5.1(1) a 3.82
71.8 14.1 9.4 4 . 7
No
No
51.3 48.7
1 65
1
Table 13
Comparison of SYC Staff between 1 1 (March 1976) and T 2 (October 1976)
on Background and Personal Characteristics
Characteristic
T 1 (n = 64) T 2 (n 80) Sign.
SD SD Diff.
17.2 29.7 32.8 9.4 10.9
I Demographic Male Female
II Single Married Div./Sep.
II Age in Yrs.
Employment Prev. Empl. II Not Prev. Empl.
Prev. Related Empl'. No. Prev. Related
Empl.
Yrs. Related Exp.
Education No Diploma/Degree CEGEP Undergraduate Gradua te Other
II Certification Program . None CEGEP Undergraduate - Graduate
62.5 No 37.5
35.0
60.0 No 15.0
31.3 8.13 No
80.0 No 20.0
60.0 No
40.0
5.5 3.77 No
20.0 27.5 32.5 13.7 6.3
73.7 7.5 12.5 6.3
1
1 II Staff Devel. Courses
Participated 42.2 Did not .participate 57.8
1 1
No
1 Cont'd....

Work History at SYC Mos. with SYC Mos. in Present Unit Prey. Units Prey. Positions
Pref. for Treatment Approaches
Accepting Friend Big Brother Control Structure Behavior Reality Insight Reality
27.6 26.4 25.5 27.1 .001
14.6 13.3 13.1 13.8 <.001
.7 .9 .8 .9 No
.6 .8 .6 .9 No
49.8(2) 8.5 52.8(8) 8.5 ‹.10
51.0(2) 12.6 51.6(8) 9.3 No
53.3(2) 8.3 53.6(8) 8.2 No
55.8(2) 11.1 54.5(8) 10.3 No
54.4(2) 10.2 54.5(8) 8.4 No
a
66
Table 13 (Cont'd.)
Comparison of SYC Staff between Ti (March 1976) and 1 2 (October 1976)
on Backriround and Personal Characteristics
T1 (n .-... 64) T 2 (n 80) Sign.
SD M SD Diff.
Factors Influencing Style
Conceptual Level 1.99(1) .38(1) 1.85(9) .29 <.01 Repression-Sensitization 21.9 (4) 11.7 (4) 23.6(11) 12.31 No
Number,s in parentheses indicate missing cases:
Characteristic

67
contribution to youth change can be reliably interpreted. Although
we could not collect and compare all six measures over time, it
is still feasible to draw inferences about the change or
stability of the SYC staff profile from the statistical comparison a
of four instruments which tap 20 personal and background
characteristics of the 64 people at T. (Sample 1) and the 80
individuals at T 2 (Sample 5).
Table 13 presents the results and demonstrates that there
were significant differences over time on only three of the 20
variables. In general then, 1 2 staff were flot that different
than T 1 staff except T 2 workers were newer both to their units
and the agency than were T 1 workers; secondly, the 12
staff group
had a lower Conceptual Level score.
Having established the relative stability of the characteris-
tic profile of the total SYC staff group, it is still necessary
to determine the constancy of the profiles of worker characteristics
in the three settings ; four positions, and thirteen teams.so that
we can go on in Chapter 11 to describe and compare workers in the
different settings, positions, and teams. Tables 14 and 15
summarize the significant changes occurring over time.
Settings
There were few changes in the characteristics of the workers
in each of SYC's three treatment settings from March 1976 to
October 1977. Both residential and group home staff were newer .
0 Non-parametric analysis of two independent groups; Chi-square
for nominal data and Mann Whitney U for interval data.

_*
_* _ *
68
Table 14
Summary of Significant Differences between T1 and T2 on the Background and Personal Characteristics of the SYC Staff
in Three Settings and Four Positions
Setting Position
Characteristic Res. Comm. G.H. CCW CW Hp Sup
Demographic Sex Marital Status(Divorced) Age
Employment History Prey. Empl. Related Prey. Empl. Yrs. Related Ex.
• .Education Qualifications • Certification P.rog. Staff Dey. Courses
Work History at SYC Mos. with SYC Mos. in Pres. Unit Prey. Unit Prey. Positions
Preferences for : Treatment Approaches Accepting Frien.d. Big Brother. Control-Structure' Behavior Reality Insight Reality
Conceptual Level Repression-Sensitiz-ation
-*** -* _* _*** _*** _** * _*** 4.* 4.*
Note. Data on characteristics for each group . at 1 1 and 12 can be found in Appendices 2 and 3; analysi.s of difference in
Appendix .4.
d increase from 1 1 to 12 while — = a decrease.
b *** K.001; ** p<.01; *p<A5; no star p<.10.
6 9
at 12
and spent less time with the agency and in their present
positions than I1
staff. At 12
residential workers were signfi-
cantly more involved in staff development courses, while the
biggest change in the group homes was the increase in staff
numbers from T1
to T2 • There were four group homes at T
I
staffed by 18 workers, while at T 2 , 28 staff made up the teams
of six group homes. Furthermore, each group home at T 2 had an
attached caseworker, while this was not the case at 1 1 . Despite
the change in staff numbers, there was a significant change on
only two out of 20 variables: months in present unit and number
of units worked in. There also were only two significant changes
in the workers from the community setting: lower scores on
Conceptual Level and preference for Behavior Reality treatment
approach.
Positions
On 20 characteristics, child care workers, caseworkers,
houseparents, and supervisors changed on few variables. Child
care workers changed on the same four variables as had workers in
residence while caseworkers changed on the same two variables as
had workers in the community. Also e caseworkers were less likely
to be separated . or divorced at 1 2 than were caseworkers at T1
. In
addition to the changes in group home workers previously
mentioned, houseparents also changed on two preferences for treat-
ment epproaches: at T2
houseparents were Significantly more
open to the Accepting Friend approach and somewhat more open to
the Insight Reality approach. Lastly, 12 supervisors were newer

70
to the agency and to their present unit than were T i supervisors.
The only other significant change from T 1 to 1 2 was the supervisors'
marital status: three of the 11 supervisors at T 1 were single
and none were divorced or separated, while at 12 there were no
single supervisors,and three of the ten were separated or divorced.
Teams
A brief glance at Table 15 will demonstrate that in the five
residential teams, two community teams, and two group home teams a
there also was very little change from T. to 1 2 . Changes included:
the workers in all but one residential team had spent significantly
less time in their present unit at T 2 as compared to T
1; team 3
workers participated in more staff development courses than
previously; team 4 workers had lower Repression-Sensitization
scoresatT 2 ;team 5 workers had significantly lower Conceptual
Level and significantly higher Repression-Sensitization scores at
12 ascomparedtoTocommunity team 6 workers had a lower mean
Conceptual Level score than previously; team 7 workers had a
higher preference score for the Accepting Friend treatment
approach; at T 2 group home 10 had members who were quite new to
their jobs; on the other hand, the mean length of stay of the
team 11 workers had doubled from I1
to T 2' and their preference
score for the Insight Reality approach appropriate for Neurotic-
Anxious youths had significantly increased over time.
a Three group homes had not been open at Tl; four positions were
vacant in the fourth group home at 1 2, so it was not included in T1 and 12 comparison.
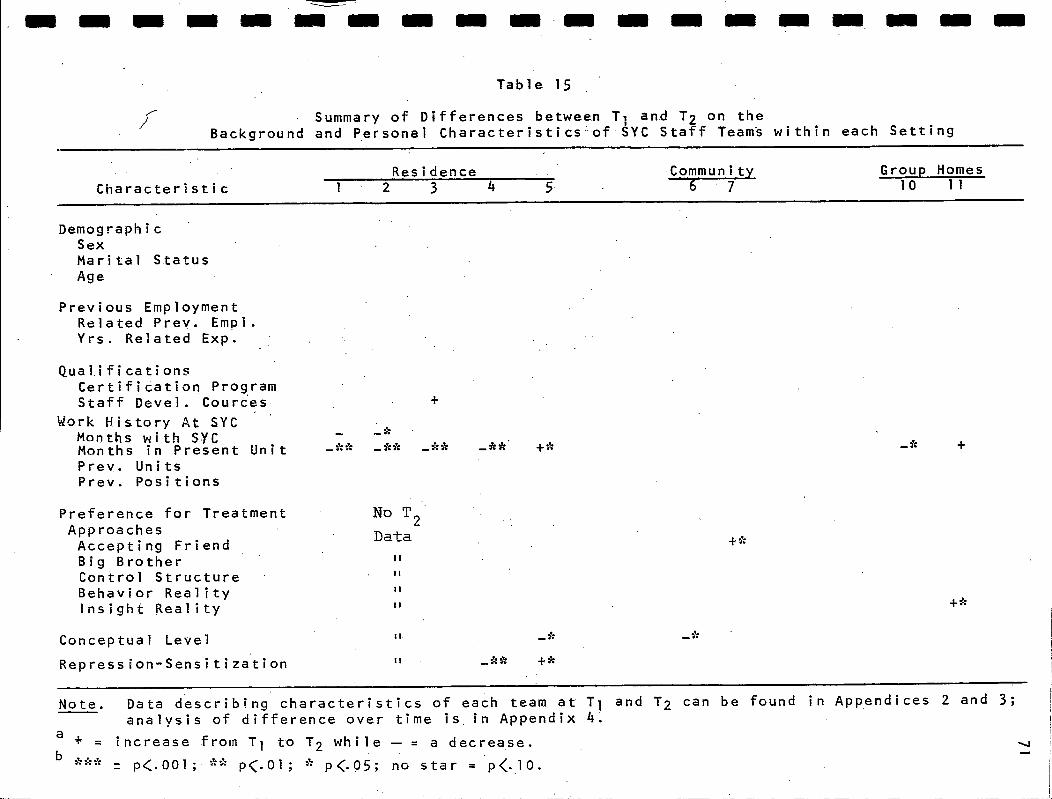
-
_** _** _** _**•
No T 2 Data
II
II
_*
+ *
+ *
Conceptual Level
Repression-Sensitization
I.
II • _** _*
Note.
a
* * *
.111111111111111111111111111.111111110111•11111111111111111111111111111111111311111111111111111111111111111111111111111111
Table 15
Summary of Differences between T 1 and T2 on the Background and Personal Characteristics of•SYC Staff TeamS within each Setting
Residence Community
2 3 4 5 67 Group Homes
10 11 Characteristic
Demographic Sex Marital Status
Age
Previous Employment Related Prey. Empl. Yrs. Related Exp.
Qualifications Certification Program Staff Devel. Cources
Work History At SYC Months with SYC Months in Present Unit Prey. Units Prey. Positions
Preference for Treatment Approaches Accepting Friend Big Brother Control Structure • Behavior Reality Insight Reality.
Data describing characteristics of each team at T1 and T2 can be found in Appendices 2 and 3;
analysis of difference over time is in Appendix 4.
increase from T1 to 1 2 while — = a decrease.
= p<.001; ** p<.01; * p<.05; no star = p<.10.

t-tests 1 2
72
Individual Change Over Time
There were 25 workers who were in the Aoencv at
both T1 and T
2• Did these workers change? Obviously, their
background characteristics would be similar and they would have
stayed with the Agency for 18 months longer. Therefore of the
seven characteristics that may have changed it is i nterest i ng
that on Conceptual Level, the staff at T 2 had significantly lower
scores than they did at T 1 , but their Repression-Sensitization
scores had increased. Although this staff group had collected
more experience with youth, and had remained in the Exploration
stage of conceptual development and in the "normal" range of
response of anxiety, their significantly lower CL scores and
higher R-S scores could indicate that these workers' increased•
sense of anxiety and use of sensitizing defence mechanisms against
stress may have lessened their ability to differentiate and
integrate information.
Table 16
• Individual Change Over Time
Characteristic M SD M SD t df p
Conceptual Level . 2.03 .33 1.91 .31 2.12 24 .044
Repression- Sensitization(l) a 21.42 0.29 26.71 12.35 -3.07 23 .005
Preferences for . Treatmeni Approaches:
Accepting Friend 50.0 8.5 50.2 8.6 - .11 24 .912 Big Brother 50.7 10.0 47.9 8.1 1.64 24 .113 Control-Structure 52.9 9.5 54. 0 8.0 - .63 24 .535 Behavior Reality 56.6 13.0 57.3 11.4 - .3 0 24 .768 Insight Reality 54.4 10.5 55.2 7.7 - .38 24 .708
a Number in parenthesis indicates a missing case.

73
This interpretation will remain at the level of an hypothesis
until further research verifies or refutes it. However, Krohne's
and Schroder's research discussed earlier (1970, 1972) would
indicate that this hypothesis is quite feasible. That is,
individuals who are more likely to sensitize and worry have a
harder time integrating information, especially while under stress.
It is more than curious that both the T 2 staff group and the
staff who stayed with the Agency have a significantly lower
ability to conceptualize and integrate information, and a higher
tendency a to sensitize and worry about anxiety-provoking situations
than did T 1 staff. Whether or not these are personality changes
and/or responses to environmental characteristics is worth debating.
Summary Comments
Despite minor variations, one can conclude that during an 18-
month period there was relative stability in the characteristic
profile of the total agency staff groups, as well as in the
profile of the workers in each of the positions, settings and
teams of SYC. Given this stability we can assume staff input
into youth change can be reliably analysed.
The T 1 and T 2 comparisons suggest three other conclusions. In
the first place, T 2 staff have not been with the agency and in
their units as long as T 1 workers. This would imply that the
agency has hired a fair amount of new, albeit not differenttypes
a s ighly significant increase in R-S scores of the 25 staff who staYed from T1 .to 12 but only. a non-significant upward trend in the shole group from Ti to 1 2.

7 1
of people in the last year and one half. Secondly, both the
workers who have remained with the agency and those who have
recently been hired have a significantly lower ability to con-
ceptualize and integrate information, and a higher tendency to
become anxious. This turnover:A:if, staff and undesirable change in
the characteristics of workers who stayed could imply an unfortunate
reaction to agency working conditions. The many changes which had
taken place in the agency during the past two years, as mentioned
previously, may have increased workers' general anxiety and
confusion, and overloaded normal coping mechanisms. A third
conclusion is that as a group, SYC staff have not "developed" very
much. Many new staff were hired (who had similar characteristics
to those individuals who left) and therefore overall experience
and education levels of the staff remained the same. The few
workers who remained gained experience but they also became less
effective conceptually and in handling stress. Should not this
lack of staff development and growth be questioned? Is the quality
of staff inadequate to the job and therefore many leave? What
effect does training, supervision, and other environmental factors
have on staff development or lack of it? We hope to look more
carefully at these important questions in Chapter
Ehmter_Summary and Conclusion
The staff of Shawbridge Youth Centers in the years 1976 and
1977 could'be considered of relatively high quality. Three-
quarters of the staff have formal certification, mostly in the
social sciences discipline. Three-quarters of the staff were

.75
previously employed, the majority in related employment. Average
years of related experience is quite high, approximately five
years. One-quarter of the staff are involved in obtaining
certification, and almost one-half of the workers have participated
in staff development courses in the last six months. Workers
remain with the agency approximately two years, and in their
present units only one year.
The majority of the staff have an openness to the treatment
approaches appropriate for the Shawbridge Youth Centers' types of
youths. Three-quarters of the staff were either average or above
average in their ability to conceptualize and integrate information.
Response to anxiety and stress was normal. Over 50 percent of SYC
staff have a significant openness to, and ability to work with at
least one I-Level youth subtype according to treater-matching
concepts and ratings. Almost 40 percent of the staff have the
ability to work with two subtypes. Regular treatment interventions
with youth were judged to be of medium or high quality by three-
quarters of the frontline workers and their supervisors.
This general profile has remained relatively stable over an
18-month period. Therefore staff input into youth change could be
considered relatively constant and thereby measurable in a valid
manner. However, inherent in this picture of stability is the lack
of development in the SYC staff group, either because of staff
turnover and/or reactions to a undn-developing" working environment.
Besides the stable and moderately high level of SYC workers'
personality.and professional qualities, the other feature which

76
characterizes the staff group is heterogeneity. Some workers have
much education; others have little. Some individuals have had
experience working with youth; others have not. Some workers
prefer to work with primitive, immature children; others do not.
Some workers are "matched" to Neurotic-Anxious youth, others are
mismatched. Some staff have sensitizing defenses against anxiety;
others have repressing defenses. Some workers enjoy group work
and do it well; others prefer individual counselling. Some workers
are bold and assertive; others are mild-mannered and retiring.
And, the list of variations could go on.
Given the speçific staffing of a differential treatment
organization, it is hoped that the workers hired would not make
a homogeneous group. SYC's staffing policy clearly endorses
hiring individuals with different "worker styles" (Wylie and Hanna,
1971, p. 5) and we have found that SYC does indeed hire different
types of staff. Whether or not this differential selection is
according to the needs of the youth population is less clear. For
example, although one-third of the youth are classified as Neurotic-
Anxious, only 15 percent of the workers hired are matched to this
subtype while 30 percent were mismatched.
Not only is planned selection of certain types of individuals
implied in SYC's staffing policies, appropriate assignment is as
well. If, however, inappropriate assignment occurs, the
selection of different types of staff will only result in
indiscriminate, even unfortunate differences at the unit level.
For example, if a worker prefers to work with Neurotic Acting-Out
youth and has some ability to do so, but is placed in a unit for

77
immature, conforming youth, his possible strengths are thwarted
and a mismatch could occur. As there are indications in this
first chapter that the different types of staff that SYC hires
may not be directly in relation to the characteristics and needs
of SYC clientele (especially in the context of I-Level theory),
careful attention to appropriate assignment, that is "matching",
and avoiding inappropriate assignments is especially important.
Thus, Chapter II explores whether or not the heterogeneity of SYC
worker characteristics is capitalized upon.

CHAPTER 11
Metching in Practice

79
It is of importance to note that matching staff
to type of youth relates to the entire cottage staff treatment team. That is, in addition to their specialized skills of child care, education, or social work, all staff in a particular cottage
must also have the appropriate treater style
(Wylie and Hanna, 1971, p. 27).
This quotation clearly illustrates SYC's intent in 1971 to
differentially select and "match" workers to the appropriate
residential unit. In the following years, the policy of worker
matching extended to include the new units in the community and
group home settings as well.
Matching can be defined as the appropriate assignment of a
worker to a situation and client type which maximizes the worker's
personality and professional strengths and minimizes his weaknesses.
At SYC, this appropriate assignment can take place at the general
level of setting and unit as well as at the more specific level of
caseload assignment.
At the general level, the practice of matching at SYC is
explored by examining information which may support two hypotheses:
1. Workers in the three settings are different from each
other.
2. Workers in the teams within each setting are different
from each other.
At the more specific worker-youth level, confirmation is sought
for two more hypotheses:
3. Workers in each team have the characteristics appropriate
to the youths in their unit.

80
4. Individual workers have the characteristics appropriate
to the youths on their caseloads.
The matching of youths and workers at the team and individual level
is explored in the context of I-Level theory, to which SYC is
explicitly committed, and in the context of the Conceptual Level
Matching Model as well.
It is necessary to make two comments concerning the data
used to examine these four hypotheses. In the first place, as
the stability of the characteristic profile of workers in the
settings, positions, and units was established in the last
section of Chapter I, the most recent data available on workers can
now be used to statistically a compare groups of workers. This
data includes 12
information on four measures (20 variables) as
well as information from the interview ratings (26 variables) and
the Staff Intervention Questionnaire (17 variables).
Secondly, workers' self-rated scores, and not the observers'
scores from the Staff Intervention Questionnaire are included in
the analysis. The ratiOnale for this decision is that workers
made more differentiations between how they carried out one task
as compared to another, than did supervisors who rated workers
generally good, medium or poor on all tasks.b
Thus, comparing
a Non-parametric tests used which compare two or more small and
independent groups: Chi-square and Fishers' Exact Test of Significance analyzed nominal data; One-Way ANOVA analyzed interval data.
Table B in Appendix 7 indicates that on a Spearman's correlation matrix between intervention scales using observers' ratings, 119 of 136 pairs correlate significantly (p<.05). Table C presents a
correlation using self-ratings: 92 of 136 pairs correlate signifi- cantly.

8 1
workers' scores on the 17 Intervention scales would bring out more
differences between staff groups than would comparing observers'
scores.
Differences between the Worker Positions in the Three Settings
The staffing pattern illustrated in Table 17 indicates that
residence is made up predominantly of child care workers; all
but two of the workers in the community setting are caseworkers,
and 19 out of 28 workers in the group home setting are houseparents.
This means one type of position dominates each setting, and the
supervisor position is common to all three settings. Therefore,
it is not surprising that a similar pattern of differences occurred
between the workers in each setting and in each position, and
that the pattern of differences is more pronounced by posjtion
than by setting a . Thus, it is more appropriate to concentrate on
describing and comparing the workers in each of the four positions
than on the workers in the three settings.
Table 17
Staffi .ng Patterns in.Three SYC Settings at 1 2
Position Residence Setting
Community Group Homes
Child Care Workers Caseworkers Houseparents Supervi sors
Total:
30 0 0
,3 12 6
0 0 19
5 2 3
38 14 • 28
See Appendix 5, Tables A and B; Appendix 6, Tables I . and J.

82
The following sections describe the four positions, high-
lighting the many differences between them. Tables 18 and 19
contain a summary of the 37 characteristics out of a possible 67
variables that significantly differentiated the four positions.
Child Care Workers (CCW's)
Of the 30 CCW's at T 2' a slight majority were men. One-half
were single, the other half were married. More CCW's were single
than were workers in other positions; also, they were younger.
Over four-fifths of the CCW's had been employed before coming to
SYC; of these, 68 percent had held related types of jobs. Years
of related experience was 4.5, which was less experience than
caseworkers or supervisors had. Seventy percent of the CCW's
were formally certified; 40 percent held a CEGEP diploma, while
the remainder had undergraduate or other degrees. More CCW's
were studying for certification than were individuals in other
positions. Even though significantly more counsellors participated
in staff development courses at T 2 than at T fewer CCW's
participated in courses than did caseworkers or supervisor. CCW's
have remained with the agency a little less than two years, and
in their present unit approximately one year; furthermore, CCW's
have worked in fewer other units and positions than had caseworkers
or supervisors.
CCW's were predominantly in the exploration stage of
Conceptual development with a mean CL score of 1.79. Their
average was similar to the houseparents' score, but significantly

83
Table 18
Summary of the Significant Differences
between the Characteristics of Four SYC Staff Positions at 1 2
CCW Hspt CW Sup Sign.
(n.30) (n.19) (n.21) (n.10) Level
Background %. Single % Married % Sep./Div.
Age in Years
% Prey. Empl. % Related Empl. Yrs. Related Exp.
% No Degree/Diploma % CEGEP % Undergraduate % Graduate % Other
5 0 . 0 31.6 38.1 0.0
5 0 . 0 63.2 61.9 70. 0 <.01
0.0 5.3 0.0 30.0
28 . 7a 35.5 30.4 33.4 <. 0 5
83.3 94.7 61.9 8 0 . 0 ‹.10
68. 0 26.3 76.9 87.5 <.01
4.5 4.3 6.6 8.5 ‹.01
3 0 . 0 36.8 0.0 0.0
40.0 36.8 14.3 0.0
23.3 15.8 57.1 4 0 . 0 .001
0.0 5.3 23.8 5 0 . 0
6.7 5.3 4.8 10.0
% Not studying for Certification 63.3 73.7 85.7 8 0 . 0
% Studying for CEGEP 10.0 15.8 0.0 0.0 .10
% Studying for Undergraduate 23.3 10.5 4.8 0.0
% Studying for Graduate 3.3 0.0 9.5 20.0
% Participated in Staff Devel. 46.7 21.1 76.2 70.0 .01
Mos. with SYC 20.6 12.5 39.8 34.6 .001 Mos. in Present Unit 11.8 7.8 20.7 10.8 .05 Prey. Units .6 .5 1.1 1.4 . 0 5 Prey. Positions .3 .2 1.1 1.5 .001
Factors Influencing Style: Conceptual Level 1.79 1.72 1.93 2. 0 7 ‹.05
Approach Preferences: Control-Structure 55.7 50.5 52.3 57.3 <.1 0
Note. A complete 'profile of the positions andthe statistical enalysis can be found in Appendices. 3 and 5.
a If not in percentages, figures in the table are means; the standard
deviations can be found in Appendix 3.

8.0 Not
8.1 Relevant 7.0 6.9 6.8 8.8 8.6
(.10 (.05 <.10 <.10 (.01 (.01 (.05
7.5 7.3 7.9 7.6 7.6 7.8 8.3
7.2 8.1 8.o 7.7 6.0 7.5 9.5
84
Table 19
Summary of Significant Differences between the Four SYC Positions on Interview and Intervention Scales
CCC Hspt CW Sup Sign.
Characteristic (n=28) (n=11) (n=23) ( 11 =10) Level
Interview Subtype Score: 12 6.3 a - 1.0 6.0 8.2 <..05 Cfm - .8 3.0 9.3 9.5 <.10 Na 4.5 .7 6. 0 5.5 <.001 Nx -12.0 -17.0 8.0 6.0 (.001
Interview Scales:
Social. Des. Quai. Alertness Social. Undes. Quai. Pres. Problems Moral Orientation Work Satisfaction Und. & Diff. Atmosphere Con. Neg. Re Inner Focus Firmness Con. Control
56.9 56.9 68.9 68.9 ‹.001
52.9 5 0 .8 66.7 61.3 ‹.001
51.6 43.7 37.5 39.6 <.05
53.8 34.3 33.2 33.9 ‹.001
37.5 49.2 28.1 32.7 (.01
74.3 70.8 81.8 81.3 (.10
62.5 62.5 75.8 76.6 <.001
76.4 77.2 81.2 84.2 110
55.4 54.9 6 0 .8 52.6 <Jo
75.3 59.8 8 0 .8 77.5 <.01
46.9 44.3 37.5 35.9 (.05
43.2 55.6 36.2 37.5 <:05
(n=28) (n=10) (n=21)
Intervention Scales:
Individualization Autonomy Wk. Group Authority Free Time Responsibility Punctuality
Note. A complete profile of the positions and the staOstical analysis can le found in Appendices 6 and 7.
a Figures for interview and intervention scores are medians.

8 5
lower than the supervisors' and caseworkers' scores. All
positions scored similarly on the Repression-Sensitization scale.
Of the five treatment approaches determined by the Jesness
Preference Survey, only one differentiated slightly between the
four positions.
A good many of the interview ratings differentiated between
the four positions. On the subtype score the only similarity
between positions was on the Mp scores. CCW's had intermediate
scores on the 12 and Na scales while on the Cfm scales, CCW's
had lower scores than the other four positions. CCW's mean score
on the Nx scale approached the average mismatched cut-off which
is -12; also CCW's had a significantly lower score on this scale
than did caseworkers or supervisors. On the interview personality
scales, counsellors scored around average or above on the Work
Satisfaction, Present Problems, Understanding and Differentiation,
Atmosphere, and Inner Focus scales, but had lower scores than
caseworkers or supervisors. A reverse trend was noted on the
Firmness and Concern with Control scales: CCW's, although average
in relation to the general parole/helping person, had higher scores
than caseworkers and supervisors.
Of the seven Intervention scales that clearly differentiated
between positions, - CCW's gave.themselves significantly higher
ratings than did the caseworkers and houseparents on the
organizing Free Time activities scale, but lower than both
positions on the promoting Autonomy scale. On the Individualizing

86
Responsibility, Authority, and Working to create a harmonious
Client Group s'cales, CCW's and houseparents rated themselves
higher than did caseworkers.
Houseparents
In many ways houseparents had similar personality character-
istics to the child care workers, although background character-
istics were dissimilar. More houseparents than CCW's were
married, and they tended to be older. Like CCW's, almost all the
houseparents had been employed before coming to SYC; the difference
is that one-quarter of the houseparents worked in related jobs
compared to 68 percent of the CCW's. Educational background and
present study program were similar between the two groups.
However, houseparents were less likely, than all other staff
positions to have engaged in staff development courses in the last
six months. Furthermore, houseparents have stayed with the agency
for only a year and in their present unit approximately eight
months. They were less likely than all other positions to have
worked in other units or in other positions.
On factors influencing worker style, houseparents had a
similar profile to child care workers on the Conceptual Level and
Repression-Sensitization dimensions. Houseparents also had
similar preferences as CCW's did for four of the five Jesness
treatment approaches.
Table 20 shows that houseparents were less likely than the
other positions to be matched to any of the youth subtypes and

Counsellor (n . 28) Matched Intermediate Mismatched
Houseparent (11) Matched Intermediate Mismatched
Caseworker (n-23) Matched Intermediate Mismatched
Supervisor (n=10) Matched Intermediate Mismatéhed
35.7 21.1 7.1 14.3 3.6
35.7 46.4 53.6 71.4 57.1
28.6 32.1 39.3 14.3 39.3
9.1 9.1 9.1 0.0 13.5
36.4 63.6 54.5 63.6 16.2
54.5 27.3 36.4 36.4 70.3
30.4 39.1 34.8 34.8 30.4
56.5 43.5 21.7 52.2 56.5
13.0 17.4 43.5 13. 0 13.0
40.0 50.0 20.0 20.0 30.0
50.0 50.0 40.0 70.0 6 0 . 0
10.0 0.0 40.0 10. 0 10.0
87
more likely to be mismatched. Also, compared to workers in other
positions, houseparents had significantly lower mean scores on the
I2'
Na, and Nx subtype scales.
Except for five scales, houseparents and CCW's had similar
profiles on the 21 interview personality scales. Houseparents
Table 20
Percentage of Staff in Four SYC Positions Matched or Mismatched to the I-Level Subtypes
Subtype
Cfm Mp/Cfc Na Nx
said they were less likey to have had Past Difficulties, and
were observed to have fewer Present Problems than the CCW's.
Houseparents were more likely than all other positions to have
higher scores on the Moral Orientation and Concern with Control
scales, even though their scores fell in the middle range of
Position

88
the scale. Finally, houseparents were less likely than other
positions to focus on inner feelings and issues.
Houseparents gave themselves higher ratings than did CCW's
and CW's on the Authority and Work with the Group scales from the
Staff Intervention Questionnaire. The Work with the Group scale
means the houseparents felt they contributed to creating a
harmonious living environment and helped the youths to get along
with each other. However, houseparents felt they spent much less
time and energy than CCW's organizing free time activities. In
comparison to community caseworkers, houseparents believed they
had less ability , to individualize treatment goals and responsi-
bilities according to a youth's needs and interests.
Caseworkers (CW's)
A slight majority of caseworkers were married and their
• average age was 30. Fewer caseworkers than other positions had
worked before coming to SYC but of those who had worked, three-
quarters worked in related jobs. Years of related experience was
6.6, an average higher than that of CCW's and houseparents, but
lower than the supervisors' average years of experience. All
caseworkers had some certification, predominantly undergraduate
degrees in the social sciences. One-quarter had graduate or
other degrees. Very few caseworkers were presently studying for
further formal certification, although three-quarters had
participated in staff development courses in the last six months.
Caseworkers remained with the Agency for a relatively long time,
averaging three years. They stayed with their unit approximately

89
two years, and were more likely than CCW's and houseparents to
have had experience in another SYC unit and position.
Caseworkers had a mean Conceptual Level score that was
higher than that of the CCW's and houseparents, and lower than
the supervisors' mean score. CCW's Repression-Sensitization
score and preferences for different treatment approaches were
similar to other positions.
On the interview *ratings, caseworkers had significantly
higher scores than other positions on all subtype scales except
the Mp scale. One-third of the caseworkers were matched to each
youth subtype, while less than one-fifth were mismatched to
any of the five subtypes. Caseworkers had higher scores than
CCW's and houseparents on the Work Satisfaction, Understanding and
Differentiation, Atmosphere, Inner Focus, and Concern with Negative
Reaction interview scales, while on the Firmness and Concern with
Control scales, CW's had lower scores.
On the Intervention Scales, caseworkers rated themselves
lower than CCW's on the Work with the Group, Organizing Free
Time, and Authority scales; they had higher scores than either
CCW's or houseparents on the INdividualization, Autonomy, and
Responsibility Scales.
Supervisors
Supervisors stood out as a group. They were older than
caseworkers or CCW's,•and a little younger than houseparents.
Only one supervisor was a woman. Before coming to SYC, most

9 0
supervisors had worked in related jobs and they had more years
of related experience than all other positions. One-half of
the supervisors had graduate degrees in the social sciences,
while the other half had undergraduate or other degrees. Few
supervisors were continuing their formal studies at T 2 , but
three-quarters had participated in staff development courses in
the last half year. Supervisors at 12
have been with the Agency
approximately three years but only one year with their present
unit. This is significantly different than the supervisors at T 1
who had been with the agency approximately four years and in their
present unit slightly less than two years. More than all other
positions, supervîsors at both T 1 and T 2 tended to have experience
in other SYC units and positions.
Asa group, supervisors had more ability to conceptualize
and integrate Information and act independently than workers in
other positions, A good proportion of the supervisors were
matched to at least one of the subtypes on the interview ratings
while few were mismatched, except to Power-Oriented youths. On
the 21 interview personality scales, supervisors had a remarkably
similar profile to the caseworkers.
Discussion
The many statistically significant differences discovered
between the characteristics of the chief position in each of
SYC's three treatment settings confirm the first hypothesis:
differential selection and assignment occurs at the general level
of setting.

91
It remains to confirm the appropriateness of the character-
istics. That is, are the characteristics of the counsellors in
residence, the houseparents in group homes, and the caseworkers
in community appropriate to the characteristics of the youths in
each setting? Strangely enough, this seems to be a "non-issue"
as, contrary to expectations, there are few differences between
the youths in the three settings. Harvie and Brill (1978) report
that only five of the 41 personality and behavior measures which
describe SYC clientele indicate significant differences between
the youths in the three settings. Of these five differentiating
variables, four are related to age: current age, age upon
admission, length of stay, and grade equivalent.
This is a puzzling situation. On the whole, residential,
group home, and community youth are fairly similar while the
workers in each setting are different. Why? What are the criteria
for youth movement from one setting to another? Is age the main
placement criterion? Are youths transferred because they "can't
stay forever" and they "look ready"? Are the differences between
the workers in the positions intended to "match" youth character-
istics or to meet job demands?
Evidence would suggest that the differences between position
characteristics are more related to job demands than to youth
characteristics. For instance, counsellors and houseparents said in
both March 1976 and April 1977 a that they emphasized parenting,
group living, environmental and authority concerns, while
a Staff Tasks Report, Reitsma and Brill, 1976; Staff intervention
Questionnaire, 1977.

92
community caseworkers stressed individual relationships and
autonomy issues. Moreover, the job descriptions of the positions
state that residential counsellors and group home houseparents
have 24-hour daily care concerns for a group of youths living in
one place, while community caseworkers coordinate the activities
and development of several youths who live either independently,
in foster/group homes, or in their own homes. From these indica-
tions one may conclude that the tasks of the main positions in
each setting are quite distinct.
Therefore, it is highly probable that the differences found
between the staff in SYC's three settings resulted from a selection
procedure designed to differentiate staff types appropriate to the
job demands of a setting, and not necessarily to the characteristics
of the youth in that setting. Moreover, a differential staffing
policy intending to match the needs of youth in each setting would
not have beeen relevant, as the characteristics of the youth
populations in the three settings were quite similar.

93
Comparison of Teams within Settings
In looking at the data which could confirm the second
hypothesis concerning the differences between characteristics of
teams within each setting, we find the opposite type of lag
between the implementation of two official policies. This time,
there were differences between the types of youth characteristics
in the various units within settings •(Harvie and Brill, 1975,
Appendix 6), but there were almost no differences between the
worker characteristics of the teams in residence and group homes.
The exception is that there were differences in the characteristics
of both youths and workers in the two community units.
Residential Teams
Of the 63 variables included in the statistical analysis
comparing the five residential teams, only five significantly
differentiated the teams. A slight difference was noted on two
other variables (see Table 21). As it was not possible to
collect complete information on team 2 workers at T 2 due to a
crisis situation in that unit, the comparison between some of the
1 2 characteristics will be between 4, not 5 teams.
The many similarities between the teams do not suggest any
clear pattern of selection or assignment according to differential
selection principles, although there were variations between the
teams, which included the following: (a) team 3 workers have
remained with their present unit much longer than either team 1
or 2 workers, and somewhat longer than team 4 or 5 workers; (b) at
T 2 both teams 1 and 5 had a higher preference score than teams 3
or 4 for the two internal types of treatment approaches, Behavior
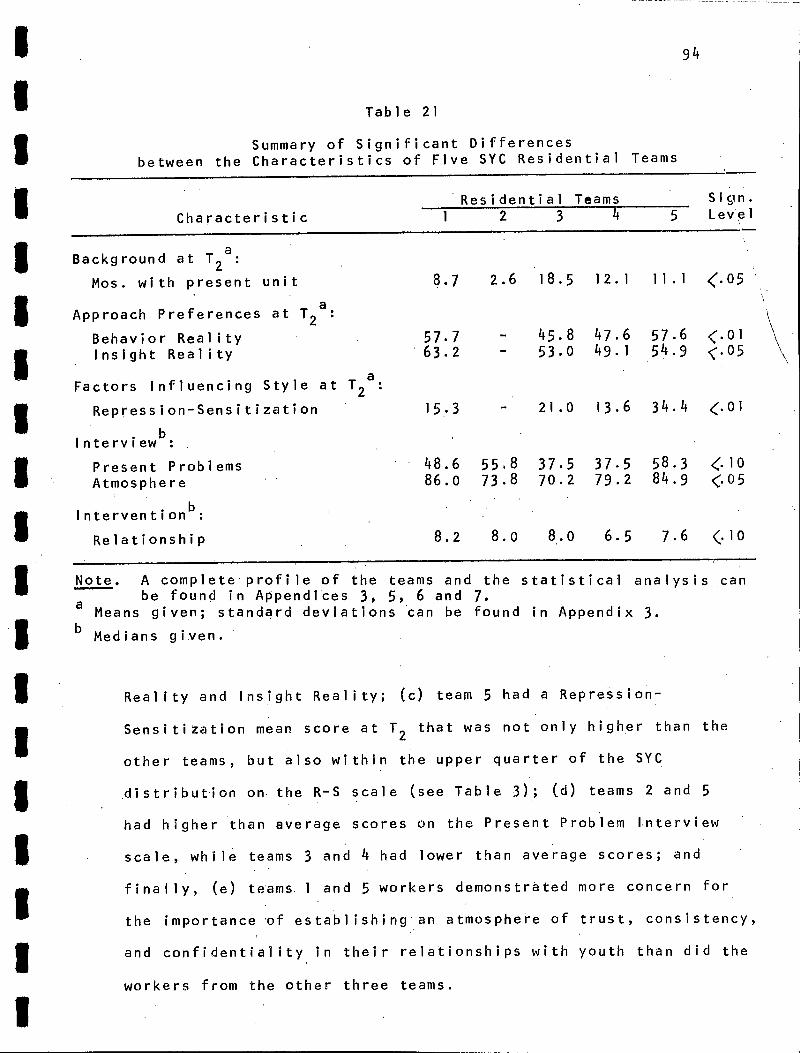
94
Table 21
Summary of Significant Differences
between the Characteristics of Five SYC Residential Teams
Characteristic
Residential Teams Sign. 1 2 3 1, 5 Level
Background at 1 2 a :
Mos. with present unit 8.7 2.6 18.5 12.1 11.1 <.05
Approach Preferences at T 2 a :
Behavior Reality 57.7 - 45.8 47.6 57.6 ‹.01 Insight Reality 63.2 - 53.0 49.1 54.9 <.05
Factors Influencing Style at T 2 a :
Repression-Sensitization
Interviewb :
Present Problems • Atmosphere
15.3 - 21.0 13.6 34.4 <.01
• 48.6 55.8 37.5 37.5 58.3 <J 0 86. 0 73.8 70.2 79.2 84.9 ‹.05
Interventionb
Relationship 8.2 8. 0 8. 0 6.5 7.6 (.10
Note. A complete profile of the teams and the statistical analysis can be found in Appendices 3, 5, 6 and 7.
a Means given; standard deviations can be found in Appendix 3.
Medians given.
Reality and Insight Reality; (c) team 5 had a Repression-
Sensitization mean score at 12
that was not only higher than the
other teams, but also within the upper quarter of the SYC
distribution on the R-S scale (see Table 3); (d) teams 2 and 5
had higher than average scores on the Present Problem Interview
scale, while teams 3 and 4 had lower than average scores; and
finally, (e) teams 1 and 5 workers demonstrated more concern for
the importance of establishing an atmosphere of trust, consistency,
and confidentiality in their relationships with youth than did the
workers from the other three teams.
95
Community Teams
Although SYC supports the differential selection and plce-
ment of staff, it is only in the community project centers as of
1971 that specific selection procedures have been used in order
to achieve this goal. A community worker must be "treater
matched" to either Na or Mp/Cfc youth types (assigned to one unit)
or Nx or Cfm youth (assigned to second unit). Secondly, a
preference is given to workers who will give a time commitment
of at least two years to the Agency. Hence, it is not surprising
that the workers in the two project centers differed significantly
from each other on all of the five subtype scores and on 10 of
the 21 interview scales, although on the 20 background variables,
they differed on only one characteristic.
On the interview subtype scores, team 6 workers had•
significantly higher mean scores on the 1 2 , Cfm,and Nx scales.
On the interview personality characteristics and professional
orientation scales, team 6 workers were rated as having more
current troubles (although less than the average person), a
higher concern for establishing an atmosphere of trust and
confidentiality, and a greater concern for dealing with inner
feelings and issues than did team 7 individuals. On the other
hand, team 7 workers were considered bolder, more forceful, firmer,
more aggressive, stubborn, and competitive than team 6 workers.
Furthermore, team 7 workers had a greater concern with the right
and wrong of an issue and society's standards than did team 6
workers.

£.05 <.01 <.001 (.01 <.05
5.5 - 3.5
6.5 9.5
- 6.5
10.0 15.0
-13.8 2.7
13.0
<.01 (.01 <.10 <.05 <.01 <.01 c.05 <.01 <.01 <.01
73.8 54.9 41.7 49.5 25.0 42.2 75.2 70.4 53.1 39.8
44.7 38.0 29.2 25.0 41.6 21.9 84,9 84.2 28.2 28.7
8.5 8.3 7.2
7.2 6.4 6.0
<.05 4.05 <.10
96
Table 22
Summary of Significant Differences
between the Characteristics of Two SYC Community Teams
Characteristics Commu_nity Teams Sign.
6 7 Level
Background at T a
2 ' Previous Units
Subtype Scoresb
:
12 Cm Mp Na Nx
Interview Scalesb
:
Boldness Forcefulness Soc. Undes. Quai.
Aggress ion Present Problems
Moral Or. Atmosphere Inner Focus Firmness Con. Control
Interventionb
:
1 .3 3(1 .4 ) 1.00(1.0) 4.05
Support Authority Free Time
Note. A complete profile of the teams, and the statistical analysis can be found in Appendices 3, 5, 6 and 7.
a Means given; standard deviation in brackets. Medians Oven.

97
1 1
1
• 1
1
Background at T 2a :
Mos. in present unit
Subtype Scoresb :
Mp
Interview Scales:
Aggression Moral Or. World/Ag. Sat.
6.8 14.0 - 13.3 5.0 5.7 i.10
-5.0 -7.5 5 -9.5 -22.5 -3.0 4.10
30.6 34.7 54 • 9 37.5 31.9 40.3 C.10
34.4 37.5 57.8 34.4 36.5 46.9 Z.10
58.3 47.9 43.8 54.2 40.3 62.5 4.05
Characteristic Group Home Teams
10 11 12 13 14 Sig. Level 15
a
Three of the 17 Staff Intervention scales significantly
differentiated the two teams. Team 7 workers rated themselves
higher than did team 6 on the Support (which means giving youths
appropriate help and encouragement for treatment goals), Authority,
and Organizing Free Time Activities.
In esummary, although the background and personal character-
istics of team 6 and team 7 workers were similar, the many
significant differences between the two teams on the interview
subtype scores and personality scales indicate that SYC does
differentially select workers for its community teams. Further-
more, there is some evidence that the workers in each team
believed they interacted with youth differently.
Group Home Teams
Table 23 indicates that only one variable significantly
Table 23
Summary •of Significant Differences between the
Characteristics of Six SYC Group Home Teams
Note. A complete profile of the teams and the statistical analysis can be found in Appendices 3, 5, 6 and 7.
Means given; standard deviations in Appendix 3, Table J. Me4lans given.

98
differentiated and four other variables slightly differentiated a
between group home teams. Thus, it is evident that differential
selection and assignment of specific types of individuals for
each group home does not occur in SYC group homes.
Summary and Discussion
The above description of the significant differences between
the teams of workers within each setting partially confirms and
partially refutes hypothesis number two: differential selection
and assignment of workers does occur in the community settings,
but not in the residential or group home settings.
This lag between policy and practice seems directly related
to the specific actions taken by management to implement its
matching policies. That is, using Palmer's instruments to
identify and differentiate worker characteristics to hire SYC
community caseworkers has resulted in selecting specific and
different types of workers for SYC's two project centers.
Selection procedures for residential counsellors and group home
houseparents are less specific and sophisticated. It is not clear
why specific procedures are not at least attempted in these two
settings. Given the shorter time counsellors and especially house-
parents remain with a un i t b, SYC management probably concentrated
on filling the positions quickly in order to keep programs afloat,
rather than carefully selecting and differentially assigning workers
a 46 instead of 63 variables are included in this analysis as the 17 intervention scales were omitted due to the small number of respondents in each team.
Turnover of staff is discussed more thoroughly in Chapter III.

99
to appropriate units. Furthermore, for the group homes, there was
no "waiting list" or "reserve bank" of individuals willing and
able to take on the demanding houseparent job. Finally, SYC
management also became committed to expansion and co-educational
policies within the last two years. It is likely that implementa-
tion of these policies pre-empted a focus on policies such as
specific matching selection procedures for child care workers and
houseparents.
Nonetheless, SYC is specifically committed to a matching
policy in all its settings. We found that practice lags far
behind this policy in the residential and group home settings.
This becomes more evident as the information relating to specific
worker-youth matching, that is, hypotheses three and four , are
examined.
Matched Worker-Youth Relationships
SYC management and frontline personnel stress the
importance of the worker-youth relationship as an essential
vehicle for promoting youth growth and change (Batshaw, 1975;
Reitsma and Brill, 1977a; Wylie and Hanna, 1971; Wylie, 1972). •A
"matched" worker-youth relationship means that the worker's
personality, interaction style, and personal desires balance and
keep pace with the needs and demands of a particular youth.
While the matched worker-youth relationship is considered
important in each of the three treatment settings of SYC, the job
expectations of residential counsellors, houseparents in group

100
homes, and community caseworkers are not the same. Therefore,
the chief worker in each setting gives a different emphasis and
brings varying resources to the worker-youth relationship.
In the open residential units, each youth is assigned to a
primary child care counsellor (CCW). The CCW insures the youth's
personal clothing and hygiene needs are met, and he (or she) helps
to create and implement the residential part of the youth's treat-
ment plan. As the responsibilities of the CCW's are manifold
and often group-centered, the relationship a primary CCW builds
with the two or three youths he has assigned to him, can vary from
week to week, and from counsellor to counsellor.
Although a group home youth has more regular contact with
his houseparents than with the group home caseworker (or assigned
community worker), agency policy and practice, especially in the
last year, considers the caseworker as the primary worker.
Therefore, we do so as well in our analysis.
Both the community and group home caseworkers design and
coordinate •the treatment and control plan for 8 to 12 youths, who
may be working or going to school, and who may be living
independently, at home, or in a foster/group home.
The next two sections examine whether or not worker-youth
relationships follow matching principles, first in the context of
I-Level theory, and secondly according to the Conceptual Level
Matching Model. After clarifying matching criteria, each section
begins with a presentation of the predominant youth type in each
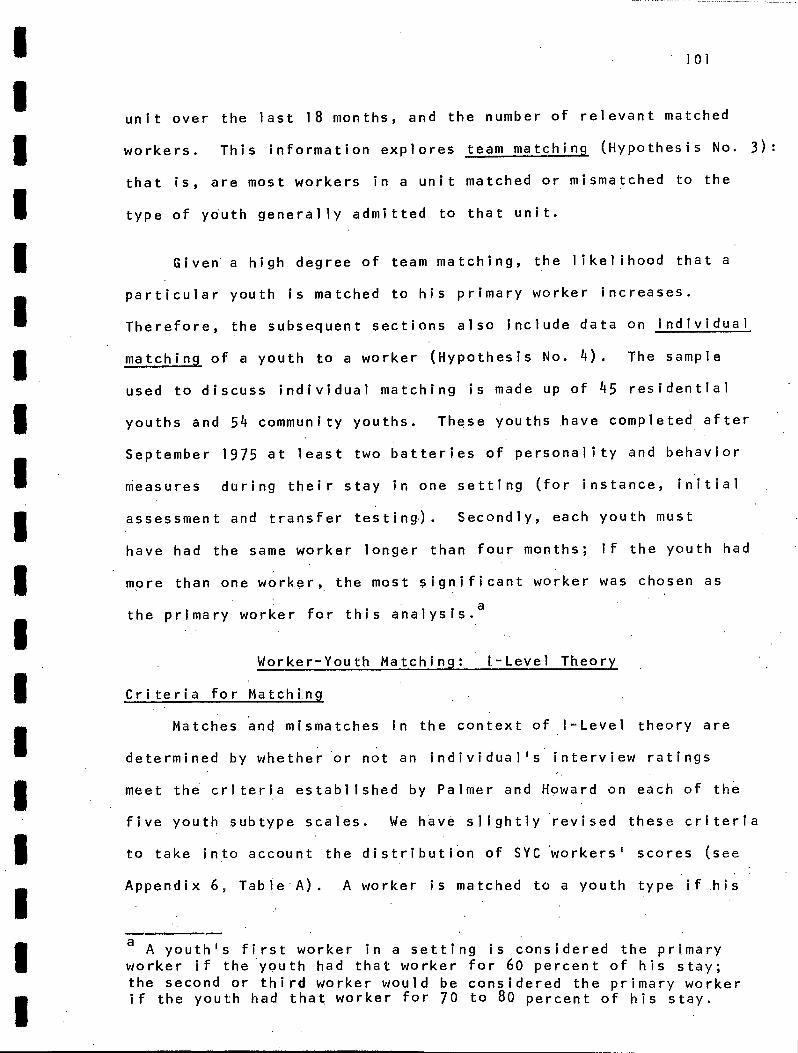
101
unit over the last 18 months, and the number of relevant matched
workers. This information explores team matching (Hypothesis No. 3):
that is, are most workers in a unit matched or mismatched to the
type of youth generally admitted to that unit.
Given a high degree of team matching, the likelihood that a
particular youth is matched to his primary worker increases.
Therefore, the subsequent sections also include data on individual
matching of a youth to a worker (Hypothesis No. 4). The sample
used to discuss individual matching is made up of 45 residential
youths and 54 community youths. These youths have completed after
September 1975 at least two batteries of personality and behavior
measures during their stay in one setting (for instance, initial
assessment and transfer testing). Secondly, each youth must
have had the same worker longer than four months; if the youth had
more than one worker, the most significant worker was chosen as
the primary worker for this analysis. a
Worker-Youth Matching: 1-Level Theory
Criteria for Matching
Matches and mismatches in the context of 1-Level theory are
determined by whether or not an individual's interview ratings
meet the criteria established by Palmer and Howard on each of the
five youth subtype scales. We have slightly revised these criteria
to take into account the distribution of SYC workers' scores (see
Appendix 6, Table A). A worker is matched to a youth type if his
a A youth's first worker in a setting is considered the primary
worker if the youth had that worker for 60 percent of his stay; the second or third worker would be considered the primary worker if the youth had that worker for 70 to 80 percent of his stay.

102
subtype score is higher than a minimum cut off; he iS mismatched
if his score is lower than another cut-off.
To illustrate what an I-Level "match" entails, following is
a brief description of how a matched worker interacts with a youth
classified as Neurotic Acting-Out.
An Na youth likes to be treated as an adequate, independent,
cool" adolescent. As authoritarian, formal, or mothering types
of adults do not validate his self-image, this youth would either
avoid, manipulate, or attack these types of adults. Despite the
youth's portrayal of adequacy, he or she senses an inner turmoil
consisting of the usual adolescent urges which are intensified by
neurotic, ambivalent feelings of inadequacy, anger, and guilt.
This turmoil can build up and erupt, especially under stressful
situations. The severity of the youth's acting-out will be in
relation to the intensity of his inner feelings and the external
provocation.
A matched Na worker will respect and honour the youth's self-
image of adequacy. The worker presents himself as someone
interesting and worthwhile, who does not need to control or
mother the youth, but enjoys a friend-adult relationship. This
worker must also enjoy and be able to quickly capitalize on
crisis situations, whether they be small or large, such as when
the youth acts out or fails to measure up to his own standards.
These situations become openings for the worker to make himself
useful and important to the youth; successful, positive resolutions

103
of these crisis situations will enable the youth and worker to
develop a deeper, more therapeutic relationship.
Team Matching
An examination of Table 24 (and Tables A, B and C in
Appendix 10) indicates that SYC's policy of matching workers and
youth is borne out in practice in its community units, but not
in its residential or group home units.
Residence. In Unit 1, the major youth type was Nx. Only one
of the seven workers was a matched Nx worker, while three were mis-
matched. In Unit 2, most of the boys were Na's, and one worker
was Na matched while another was. mismatched to this youth type.
For Cfm youths in Unit 3, the team had one worker whose inter-
view scores indicated a Cfm match and one worker whose scores
indicated a mismatch. It is difficult to establish what type of
worker or workers are appropriate for Unit 4 as three types of
youths were found in this unit at T p and then at 1 2 there had been
a significant change in the types of youth assigned to this unit.
More Unit 4 workers were matched to the Na and Mp type of youth,
while only one was matched to the dependent, lower maturity youth
type. Finally, at both T 1 and 1 2 the majority of the girls in
Unit 5 were classified either Na or Nx. Not one of the workers
(all interviewed before January 1977) was matched to the Na youth
type, while two were mismatched; only one worker was matched to
the Nx youth and two were mismatched.
Community.. In contrast to a residential youth, a community
youth was much more likely to have a matched than a mismatched

Predominantb
Youth Type No. of Workers
Relevant Workers c Matched Mismatched Unit
7
7
7
Residence
1
2 Na
3 Cfm
4 Mixed
1 3
1 1
•1 1
0 2 1 2
7 5 7
Na Nx
10
11
4 12 4
13
4 2 14 4 1
4 1 15 4 1
0 1 0 2
0 2
0 2
Na Nx
Mixed
Na Nx
Mixed
Na Nx
Na Nx
104
Table 24
Matching of Workers and Youth in SYC Units: I-Level Theory a
Community
6
7
Nx 9 4 0 Cfm 9 7 0
Na 7 5 0 •
Gr'oup 'Homes
For more specific data see tables in Appendix 10.
From February 1976 to October 1977.
From September 1976 to March 1977.

105
worker. Youths in unit 6 at both T 1 and 12
were classified either
Cfm or Nx. Of the nine workers in team 6, seven were matched to
the Cfm youth type and four to the Nx youth type; not one worker
was mismatched to either type.
In the second community unit, 30 percent of the youths at 1 1
were classified as Nx and in all likelihood would have had a mis-
matched worker, as three of the workers in Unit 7 were mismatched
to Nx youth. However, at 1 2 three-quarters of the youths were
classified as Na's and five of the seven workers were matched to
this youth type while none were mismatched.
Group Homes. Each of the six group homes cared for at least
two youth types and there was a significant difference in the types
of youth sent to Unit 13 at T1
as çompared to T 2 . On the whole,
the coordinators, houseparents, and group home caseworkers were
more likely to be intermediate or mismatched than matched to
the youth type found in their . homes. The exception would be
Unit 13 at 12
(see Table C in Appendix 10).
In summary, as with Hypothesis Two so Hypothesis Three is
partially confirmedeld partially refuted: workers in residential
and group home units are just as likely to be mismatched as matched
to the main youth types in their units; on the other hand, the
majority of community workers are matched or intermediate to
their unit's clientele.

106
Individual Matching
Information concerning Hypothesis Four convincingly confirms
what the three previous sections have been indicating: in two of
SYC's three treatment settings, the practice of matching workers
and youths lags far behind the policy.
Table 25
Individual Worker-Youth Matching: I-Level Theory
• Worker-Youth Residence Community and Group Homes
a Total
Relationship -n % n . %
Matched Intermediate Mismatched
Total:
6 15 19 47.5 15 37.5• 40 100
24 44.4
30 55.5
0 0.0
54 100.0
30 31.9 49 52.1 15 15.9
94 100.0
Analysis by settings was not possible due to variations in the assignment of who was a group home youth's primary worker. During the first year of the project it was the community caseworker; in the remaining time either a group home caseworker or later an "independent" caseworker became the primary worker.
Almost one third of all the youths in our total sampleb
had
matched workers, and 16 percent had mismatched workers. Just
under one-half of the community or group home youths had a
matched worker, while none had a mismatched worker. However, in
residence, twice as many youths had a mismatched worker (37.5 percent)
• than a matched worker (15 percent).
This sample is not necessarily representative. Total research client sample is 246. Of these, 141 clients had completed two batteries of tests within the same setting after September 1975. Then, 47 more clients had to be excluded as these youths did not have one primary worker during their time under care.

107
Summary and Discussion
In the context of I-Level theory, the differential assignment
f individual workers to a specific team (Hypothesis Three) and to
certain youths (Hypothesis Four) occurred in only two of SYC's
13 open treatment units.
Given that workers selected for residence and group homes
need group management, daily caring, and team work skills, in
addition to individual counselling and casework abilities, it
may be more feasible to avoid inappropriate assignment of workers,
as to insure optimum, appropriate assignment. Unfortunately,
this was not the case. There were workers mismatched to the main•
youth type in both residential and group home units. Secondly,
although group home youths may not have lived in units staffed by
matched houseparents, they had a good chance of being •assigned to
a group home or community caseworker who was either matched or
intermediate. However, residential youths not only lived in
units staffed by all types of workers, who may or may not have
been appropriate, but also one-third of , the residential youth had
primary counsellors whose personality characteristics and
professional orientations were markedly inappropriate to their
needs, according to I-Level theory.
This situation conclusively illustrates that matching
policies, in the context of I-Level, are not implemented in the
selection and assignment of SYC's residential and group home
workers. Furthermore, the opposite is more prevalent in residence:
that is, mismatching is more prevalent than matching.
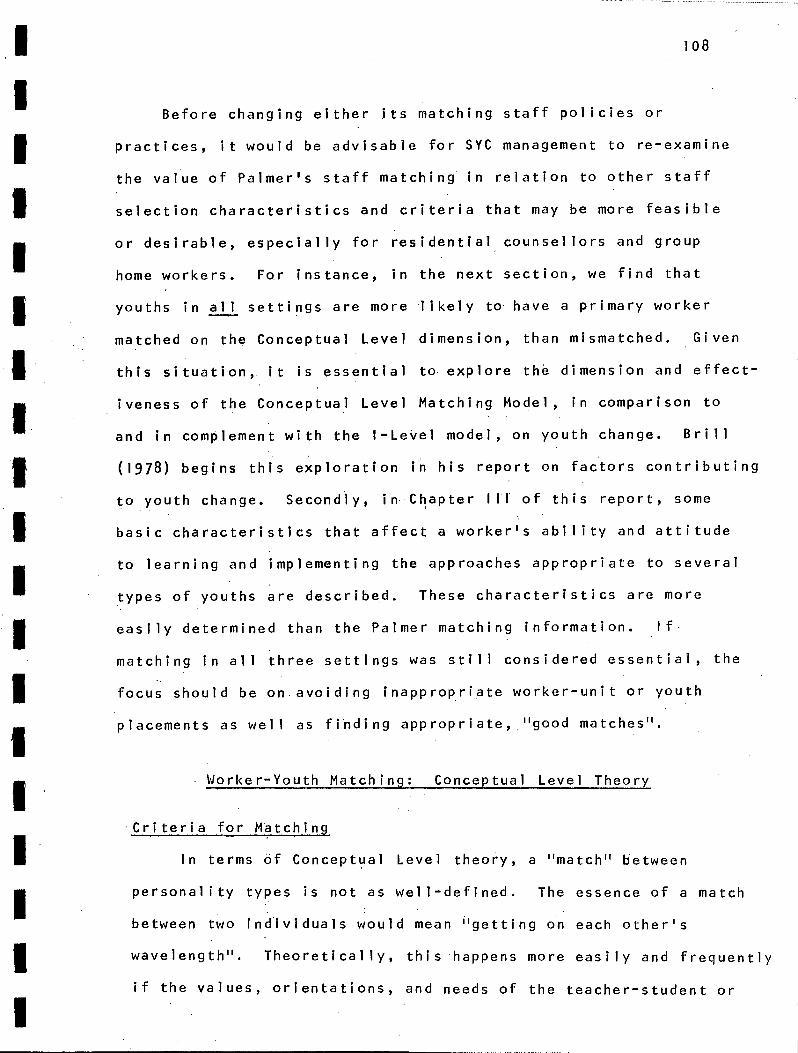
108
Before changing either its matching staff policies or
practices, it would be advisable for SYC management to re-examine
the value of Palmer's staff matching in relation to other staff
selection characteristics and criteria that may be more feasible
or desirable, especially for residential counsellors and group
home workers. For instance, in the next section, we find that
youths in all settings are more likely to have a primary worker
matched on the Conceptual Level dimension, than mismatched. Given
this situation, it is essential to explore the dimension and effect-
iveness of the Conceptual Level Matching Model, in comparison to
and in complement with the I-Level model, on youth change. Brill
(1978) begins this exploration in his report on factors contributing
to youth change. Secondly, in Chapter Ill of this report, some
basic characteristics that affect a worker's ability and attitude
to learning and implementing the approaches appropriate to several
types of youths are described. These characteristics are more
easily determined than the Palmer matching information. If
matching in all three settings was still considered essential, the
focus should be on avoiding inappropriate worker-unit or youth
placements as well as finding appropriate, "good matches".
. Worker-Youth Matching: Conceptual Level Theor
• Criteria for Matching
In terms of Conceptual Level theory, a "match" between
personality types is not as well-defined. The essence of a match
between two individuals would mean "getting on each other's
wavelength". Theoretically, this happens more easily and frequently
if the values, orientations, and needs of the teacher-student or

109
counsellor-client are not too far apart. For example, a counsellor
who enjoys teaching and guiding in a patient, simple, repetitive
way gets along better with the youth who needs repetitive, simple
guidance than with a youth who needs challenging and exciting
confrontation.
We would therefore hypothesize the matching of workers and
youth in terms of Conceptual Level theory in the following way:
a match occurs when a worker is one CL stage higher than the
youth for whom he is responsible; if a worker is two stages
higher, or lower than the youth, a mismatch occurs; if the worker
and youth are in the same stage of Conceptual development, an
intermediate positive relationship is possible. Figure 5 illustrates
this hypothesis.
Team Matching
According to the above proposed criteria, more matches than
mismatches in worker-youth relationships could have occurred in
all the units as demonstrated by Figure 6. Therefore, Hypothesis
Three concerning the appropriateness of a team's characteristics
to the youths in its unit is partially confirmed.
Most units had some Norm-oriented workers (Stage B) who
could match up with the Stage A youths, as well as Exploration-
oriented workers (Stage B-C) who could match up with Stage B
youths. Eight units had a few higher Conceptual Level youths
(Stage B-C's) while six units had the appropriate Independence-
oriented staff (Sta g e C). The types of mismatched relationships

A B B-C
Low CL
1/.1
1:›1 H 1g
A B B-C
Low CL 8
Worker
Youth
1g
B B-C
Low CL
A B B-C
Low CL
Worker
Youth
1g
A B B-C
High CL
Worker
Youth
Low
Low CL High CL
1 JO
Figure 5
Hypothetical Youth-Primary Worker Matching in Context of Conceptual Level Matching Model
Matched Relationships
Intermediate Relationships
Mismatched Relationships
A B B-C

1 A B-C
2 A
3 A B-C
4 A B-C
1 5 BC B-C
2 B-C B-C
6 p-c
r-A B-C
iii
Figure 6
CL Stage Distribution a of SYC Youths and Workers
Unit
CL Stage Distribution of Youth (Feb. 76 to Oct. 77)
CL Stage Distribution of Workers (Mar. 76 to Oct. 77)
Residence
Community .
B-C
Group Homes
10
11
B-C
1B-1 B-C Cont'd...

1 13
A
A
A
BC
A
B-C
B-C
B-C
B-C
B-C
112
Figure 6 (Cont'd.)
CL Stage Distribution a of SYC Youths and Workers
Unit
CL Stage Distribution of Youth (Feb. 76 to Oct. 77)
CL Stage Distribution of Workers (Mar. 76 to Oct. 77)
12
14
1 5
a See Appendix 10, Tables D, E, and F for exact distribution.
Change in youths' CL scores from T i to T , , but not significant.
Significant change in workers' CL Scores from 7 1 to T 2.

113
that could occur would be, for example between the Stage A youths
in Units 6 and 7 and the higher Stage C staff. However, the
negative effects of this type of mismatch may be circumvented, if
the worker uses his ability (inherent in his higher Conceptual
Level) to both clearly see the needs of the Stage A youth and
adopt the suitable treatment approach.
Individual Matching
The data in Table 26 confirm that one-half of the youths in
residence and community were matched to their workers, while only
11.1 and 16.7 percent respectively were mismatched. In large
measure this information supports Hypothesis Four, that is, SYC
workers had the appropriate characteristics and approaches for
the youths in their caseloads in the context of the Conceptual
Level theory.
Table 26
Indiyidual Worker Youth Matching: CL Theory
Worker Youth Relationship
Community & Residence Group Homes Total
% n %
Matches Intermediate Mismatches
Total:
22 48.9 23 42.6 45 45.5
18 40.0 22 40.7 4 0 40.4
5 11.1 9 16.7 14 14.1
45 54 99
Char Summary and Conclusion
Appropriate assignment of workers who have been differeniially
selected is the second part of the staffing requirement of a
differential treatment agency. Having established in theprevious

114
chapter that different types of staff were selected by SYC in
1976 and 1977, this chapter explored the appropriate assignment
or "matching" of workers at the general level of setting (Hypothesis
One), unit level (Hypothesis Two), and at the specific level of
worker-youth relationships (Hypotheses Three and Four).
Workers were different between the three settings and thus
Hypothesis One was confirmed. However, the Differential assign-
ment that occurred at the setting level appeared more related to
meeting the different task demands of the counsellor, houseparent,
and caseworker positions, than matching the characteristics of
residential, group home, or community youth, as there were few
differences between the youths.
The evidence concerning the differences of workers within
settings and their appropriateness to their unit's clientele
partially confirmed and partially refuted Hypothesis Two, Three,
and Four. Within the community setting, the differential and
appropriate assignment of workers to the clientele was both a
policy and a practice. This situation occurred in the context of
the 1-Level and Conceptual Matching Models. As one-half of SYC
youths are helped by community workers, we conclude that matching
of workers to youth characteristics affected a good proportion of
SYC youth. However, in group homes and even more in residence,
there was not a clear pattern of differential worker assignment
to units. Although almost one-half of the residential and group
home youth had a matched primary worker in the context of CL
theory, twice as many residential youths had mismatched rather
than matched workers in the context of I-Level theory.

115
In conclusion, SYC's policy of differential selection and
matching workers is differentially implemented. In the community
units, practice pretty well "matches" SYC's staffing policies.
In group homes and residence, a substantial lag is observed, more
soin relation to the predominant I-Level classification of youths
and workers, than in relation to the subsidary Conceptual Level
classification system.
One may well ask what is the staffing policy in residence
and group homes? Why is Palmer mismatching so prevalent in
residence? What criteria are used to select a worker for a unit?
How does each team assign a worker to a youth? Our findings
suggest that these questions do not have reliable answers. In
residential and group home units, differential staffing exists on
a position basis. Besides the two community teams, the remaining
SYC teams look more similar to each other than different. This
situation is contrary to official policy. However, it is
interesting that when we focus on Conceptual Level as the classifi-
cation and matching model, we see that within each unit there
are youths and workers at different stages of accessibility. In
effect, this means the SYC staffing situation as it existed in
1976 to 1977 would theoretically have satisfied the CL Matching
Model. In other words, practice lagged behind official staffing
policy using Palmer's classification and matching criteria, but
was congruent with a possible policy based on Hunt's classification
and Matching Model.

116
Yet, the most important question remains unanswered. How
important is "matching" workers to youth by either Palmer or Hunt
criteria? This report began with evidence concerning the
relevance of this specialized worker matching in a community case-
work setting, given low caseloads, available resources, supportive
training and staff stability. Even if all these conditions are
met (and we see later in this report that they are not), how
important is worker-youth matching in either group homes or
residence? Is residential treatment primarily a holistic environ-
mental approach or an individual worker-youth approach? What is
the importance of a matched milieu for a residential youth?
Truly, "matched" environments and "matched" worker-youth relation-
ships would be ideal. However, which would be the priority?
Finally, if it were not feasible to select and assign "matched"
workers in SYC's residential or group home setting, what other
criteria should be used in staff selection? These, and other
issues, are the subjects of the next chapter and of Brill's•
final report which has been referred to several times.

CHAPTER III
Selection of and Caring for "Good" Staff

118
Adequate staffing policies and practices of a differential
treatment agency would consist of three components: (a) selection
of a pool of competent and compassionate workers; (h) differential
selection and assignment of workers with characteristics "matched"
to certain jobs and youth types; and (c) creation and maintenance
of a supportive working environment for staff.
The previous chapter of this report discussed the second,
more specialized component of these staffing policies: differential
selection and assignment of specific worker types. Now it is
important to look at some basic personality characteristics that
would be relevant in the initial stage of staff selection. How
can "good", effective workers be identified? The last component
of an adequate staffing policy also needs examination. What is
a supportive working environment for staff and how can it be
created? This final chapter attempts to provide a few answers
to these two questions.
Selection of "Good" Staff
Staff Turnover
The children who come to SYC often have had troubling,
inconsistent, and unstable backgrounds. They have a strong need
to be cared for by stable, mature adults who are committed to
seeing them through". Although SYC workers may want to commit
themselves to a long term involvement with the youths on their
caseloads, the turnover rate illustrated in Table 27 suggests
that unfortunately many workers resign or transfer after a

ri o
UM UM MI MI 011111 11111111 Oat all IMO MI UM OM IMF MO 11/0 UM MU
Table 27
SYC Staff Turnover from March 1976 to October 1977
Group
Workers who Transferred or
Resigned
Original Workers at T 1
New Workers who Workers Hired
a Transferred or Workers
Between1
& T 2 Resigned at T 2
Total by Position 64 50 78.1 94 28 29.8 80 Counsellor 27 22 81.5 35 10 28.6 30 Houseparent 14 14 100.0 32 13 40.6 19 Caseworker 12 6 50.0 16 1 6.3 21 Supervisor 11 8 72.7 11 4 36.4 10
Residential Teams 33 27 81.8 43 11 25.6 38 1 7 6 85.7 5 0 0.0 6 2 7 7 100.0 11 4 36.4 7 3 7 4 57.1 5 0 0.0 8 4 7 6 85.7 11 3 27.3 9 5 5 4 80.0 11 4 36.4 8
Community Teams 13 7 53.8 8 0 0.0 14 6 9 5 55.6 5 0 0.0 9 7 4 2 50.0 3 0 0.0 5
Group Home Teams 18 b 16 88.9 43 c 17b 39.5
28c
9 3 3 100.0 Closed
10 5 5 100.0 10 5 50.0 5
11 6 4 66.7 5 1 20.0 6
12 5 4 80.0 3 2 66.7 2
13 Not included 9 3 33.3 6
14 Not open 10 4 4 0 . 0 6
15 Not open 9 3 33.3 6 1 i a 18 new positions added - , 1 b - , One supervisor coordinates two homes. He is counted in each home and once in the total. 1.0 c
Three supervisors coordinate six homes.

120
relatively short stay in a unit. Over three-quarters of the
original workers in our sample (March 1976 a ) had left their units
by October 1977. Furthermore, of the 94 workers who were hired
to fill the empty positions (and the 18 new positions) during
this 18-month period, one-third had either resigned or transferred
by October 1977. The turnover rate on a yearly basis would be
between 50 and 60 percent.b
Is this turnover rate "normal" for a social service agency?
British (Monsky, 1963; Tollen, 1967; Williams' Committee, 1967;
Berry, 1975), American (Vinter, 1976), and Canadian (Batshaw, 1975;
Cusson, 1977) studies indicate that staff turnover rates of
residential and community staff working with children is between
25 and 35 percent each year. This means that SYC's turnover rate
of its frontline and supervisory staff in the open residential,
group home, and community settings seems higher than "normal"
during the last 18 months.
Before pursuing what worker and/or milieu characteristics
contributed to this high turnover, two pieces of evidence
indicating the unfortunate effects of this situation • should be
mentioned. In the first place, of the 141 youths in our sample
that completed two batteries of personality and behavior measures
a Included are workers from two units who had been measured in
July 1977.
See Table A in Appendix 9.

121
while in one setting, one-third did not have a primary worker a
for longer than four months. Because workers transferred or
resigned, a substantial number of these youths had two or three
workers, each for several months.
Figures 7 and 8 present the second piece of evidence: In
residential units with higher staff turnover, fewer youths were
satisfied with their workers. Youths' satisfaction was based on
the percentage of youths in a unit who responded positively to
several questions from the Unit Milieu Questionnaire (Légendre,
1975). This questionnaire was administered five times to
residential and group home youths during the research's data
collection period. The relevant questions asked a youth if he
liked his worker, if he got along with his worker, and if his
worker helped him to change. Our findings show that the youths
in Unit 3 (which had the lowest staff turnover) were twice as
satisfied with their workers than youths from Unit 2 (which had
the highest staff turnover). The relationship between youths'
satisfaction and worker turnover followed a similar pattern in the
other three units.
What does this all mean? Creating an appropriate treatment
environment and establishing healthy relationships with youths
takes time and consistency. Predictability, stability, safety,
a A primary worker is the person with chief responsibility for
coordinating and implementing a youth's treatment plan.

4 2
3.0 _ o
— 2.5_ cr) 0 a_ I- 2.0 H a.
1.5_
o 1 _
ni a)
Figure 7
Residential Youths' Satisfaction with their Workers a (March 1976 to October 1977)
122
94.9
82.6
69. 6 67.2
47.5
100
90
80
• 70
o • 6o >- t4 • 50
4o
30
1 5
a Residential Units
Tables A and B in Appendix B contain specific figures.
3
Figure 8
Workers Needed to Fill Residential Positions (March 1976 to October 1977)
2.6
2.1 2.1
1 . 9
1 5 11 2
Residential Units
3
1.8

1 23
and continuity of care for both workers and youths can only
occur if the same workers and supervisors remai , n in their
positions for at least a certain amount of time. Turnover of
staff, especially high turnover of staff, makes it difficult to
establish treatment environments and relationsh4s conducive to
long-term growth and change. Thus, it is important to know what
are the characteristics of the staff who are able and willing to
remain in a unit working with adolescent, delinquent, and troubled
youth, and secondly, what environmental characteristics help
people stay.
Characteristics of Stayers and Leavers
In the first place, a statistical analysisa was made comparing
the characteristics of the 31 staff who had stayed in a unit more
than two years ('the Stayers") and the 25 staff who had left
within a year ("the Leavers").
Although there were not many significant differences between
the two groups, a few of the differences are important. More
Stayers were married than Leavers; secondly, more Leavers were
divorced or separated. Twice as many Stayers participated in
staff development courses in the last six months compared to
Leavers. Although Stayers were in their mid-thirties while
Leavers were in their late twenties, this difference did not
approach significance (p < .120). However, stayers had signifir
cantly more related work experience than Leavers had.
a Using Chi-square for nominal data and Mann-Whitney U for inter-
val data.

38.5(3) a 15.7
78.4(3) 12.8
5 5.1 (3) 12.3
51.2(11) 15.9
67.3(11) 16.0
46.1(11) 13.3
<.05
<.05
124
Table 28
Summary of the Significant Differences between the Characteristics of SYC Staff who Stay with a Unit
Two Years or More and Those who Leave Before a Year
Characteristics
Stayers Leavers
(n=31) (n=25) Sign. SD M SD % Level
Marital Status Single 35.5 4o Married 65.3 4 0 ‹.10 Div./Sep. 3.2 20
Education Took courses in Last 6 months 61.3
Did not take courses in Last 6 Months 38.7 68
Work Experience Mos. Related Exp. 93.2 49.1 37.2 35.4 <!.001 Mos. with SYC 54.1 29.5 13.2 13.8 ‹.001 Mos. with present
unit 32.7 16.3 7.2 3.4 (.001 Units worked in
previously .9 .9 .5 .9 <.05
32 <.10
Interview Scales (10 to 10 0 ) Present Problems Work Satis. Agency/World
Satis.
Intervention Scales (1 to io) Justice Group Meeting
7.6( 8) 1.0 6.6(2 0 ) .9 <.10 7.7(16) 1.9 4.2(23) 1.2 ‹.05
Note. Complete listing of the characteristics of Stayers and Leavers
---- and the analysis of difference can be found in Appendix 13.
a Numbers in parentheses indicate missing cases.

125
Three of the 21 interview scales significantly differentiated
the two groups. Stayers were significantly less anxious and
uptight than Leavers who had as much anxiety and present problems
as the average adult. Workers who stayed with SYC
units were more satisfied and optimistic about the world and
society, as well as about the Agency itself. In fact, Stayers
enjoyed their work far more than the average parole/helping agent,
and significantly more than staff who left.
In summary, if SYC wants to hire individuals who will in all
likelihood remain for approximately two years in a unit, older,
experienced, mature, and settled individuals should be considered.
Reasons for leaving. People do not work in a vacuum. A
person's behavior and work is a product of the interaction between
his characteristics and abilities, and the environment in which
he lives and works. Was there something in the working environment
at SYC that made it more difficult for individuals, especially
those with certain characteristics, to remain? Why did so many
people resign or transfer?
Two senior supervisors, a personnel officer, and a researcher
were asked to choose one of five broad reasons why 78 staff either
transferred or resigned in the 18-month period. Table 29 presents
the results. Of the 60 staff who resigned, a third left for
something new, either another job, a study program, or another
lifestyle. Another third left to get away from an untenable or
unhappy situation, a few due to health and personal problems or
because of poor pay, while others resigned because of personnel,

• MI MI MI • MS MI OM ill Ole IIIIIIII all OM MI MI
Table 29
Most Important Reason SYC Staff Transferred or Resigneda (March 1976 to October 1977)
Poor Health; Personnel Agency Fired or
New Job; School; Poor -Pay Conflicts; Pressured N Another Lifestyle Benefits Had it" to Leave Do Not Know
n % n % n % n % n % _ _ - _
Total Agency • Resignations Transfers
78 31.5 4 0 .4 6 0 20.8 34.7 18 10.7 59.4
8.8 11.3
7.0 11.7
1.8 10.0
18.3 23.5 10.8 13.8 8.6 11.0
15.3 25.5 10.1 16.8 6.8 11.3
3. 0 16.7 .7 3.9 1.8 10.0
Residential Teams 38 15.5 40.6 3,3 8.8 8.3 21.8 6.3 16.7 4.6 12.1 Resignations 29 8.8 30.5 3.0 10.3 7.3 25.2 5.6 19.2 4.3 14.8 Transfers 9 6.7 74.5 .3 3.3 1.0 11.1 .7 7.8 .3 3.3
Group Home Teams 33 10 •30.3 5.5 16.7 9 27.3 4.5 13.6 4. 0 12.1
Resignations •25 7 28. 0 4 16.0 7 28. 0 4.5 18. 0 2.5 10.0 Transfers 8 3 37.5 1.5 18.7 2 25.0 0 0 1.5 18.7
Community Teams 7 6 85.7 1 14.3 Resignations 6 5 83.3 1 16.7 Transfers 1 1 100.0 0 0
a Based on average of two or three raters.

1 27
agency, or job conflicts and pressures. One-sixth of the workers
were asked to leave because of their unsuitability. That leaves
unknown reason for 11.3 percent of the staff group. Of the 18
staff who transferred rather than resigned, almost 60 percent
transferred because they wanted or were offered a new job, while
one-quarter transferred away fron untenable situations.
Not only is there a striking difference between the rate of
turnover in the community teams as compared to the residential
and group home teams (Table 27), but also between the reasons
why residential and group home staff left compared to community
workers. The latter were far more likely to leave "to" a new job,
school, or other lifestyle, while residential and group home
workers were just as likely to get "away" from an unsatisfactory
situation, as to.go "to" another one.
In conclusion, SYC's relatively high turnover of staff has
some negative effects on youths and programs. Although the
turnover rate is related to certain personality characteristics
of individuals, evidence suggests that environmental factors are
also involved. Furthermore, general working conditions may have
been problematic, not only for the younger, less experienced or
"put together" workers in residence and group homes, but also for
those 25 experienced individuals who remained with the agency
throughout the research period. These people had a lower ability
to conceptualize and integrate information at the end of the
project than at the beginning, while they had a higher tendency
to worry and become anxious (Table 16). As it is very unlikely that
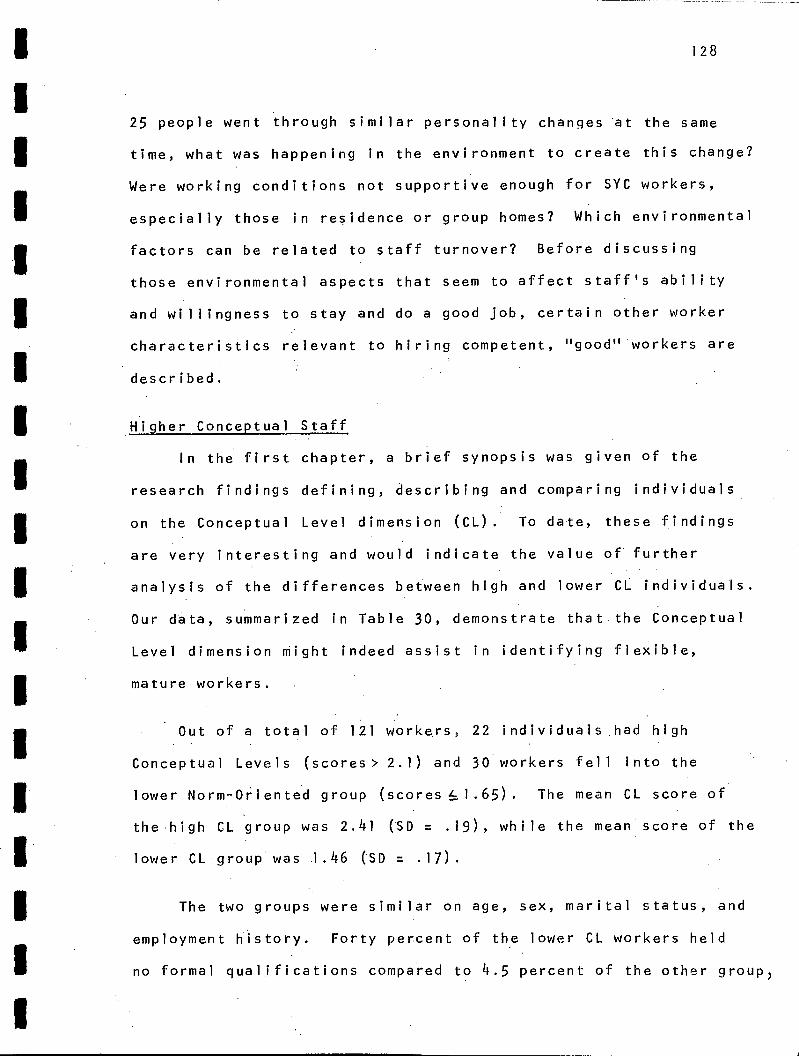
128
25 people went through similar personality changes •at the same
time, what was happening in the environment to create this change?
Were working conditions not supportive enough for SYC workers,
especially those in residence or group homes? Which environmental
factors can be related to staff turnover? Before discussing
those environmental aspects that seem to affect staff's ability
and willingness to stay and do a good job, certain other worker
characteristics relevant to hiring competent, "good" workers are
described.
Higher Conceptual Staff
In the first chapter, a brief synopsis was given of the
research findings defining, describing and comparing individuals
on the Conceptual Level dimension (CL). To date, these findings
are very interesting and would indicate the value of further
analysis of the differences between high and lower CL individuals.
Our data, summarized in Table 30, demonstrate that the Conceptual
Level dimension might indeed assist in identifying flexible,
mature workers.
•
Out of a total of 121 workers, 22 individuals had high
Conceptual Levels (scores> 2.1) and 30 workers fell into the
lower Norm-Oriented group (scores L 1.65). The mean CL score of
the high CL group was 2.41 (SD r. .19), while the mean score of the
lower CL group was 1.46 (SD = .17).
The two groups were similar on age, sex, marital status, and
employment h sistory. Forty percent of the lower CL workers held
no formal qualifications compa'red to 4.5 percent of the other group)
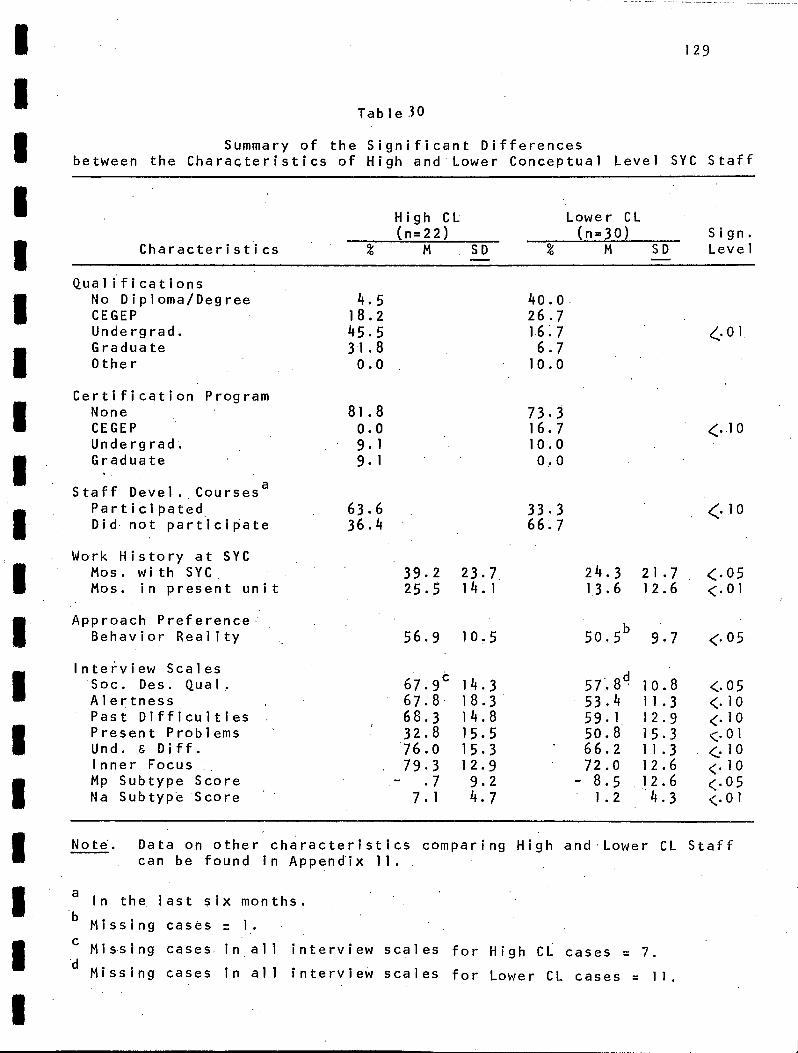
33.3 66.7
129
Table 30
Summary of the Significant Differences between the Characteristics of High and Lower Conceptual Level SYC Staff
Characteristics
High CL Lower CL (n=22) (n=30) Sign.
% M SD % M SD Level .1■•■■
40.0 26.7 16.7 6.7 10.0
73.3 16.7 10.0 0.0
Qualifications No Diploma/Degree CEGEP Undergrad. Gradua te
Other
Certification Program None CEGEP Undergrad. Graduate
Staff Devel. Courses a Participated Did not participate
Wark HIstory at SYC Mos. with SVC. Mos. in present unit
Approach Preference Behavior Real ity
Interview Scales Soc. Des. Quai. Alertness Past Difficulties Present Problems Und. & Diff. Inner Focus Mp Subtype Score Na Subtype Score
4.5 18.2 45.5 31.8 0.0
81.8 0.0 9.1 9.1
63.6 36 .4
39.2 23.7
25.5 14.1
56.9 10.5
67.9 c 14.3
67.8 18.3
68.3 14.8
32.8 15.5
76.0 15.3
79.3 12.9 - .7 9.2
7.1 4.7
<.10
<JO
24.3 21.7 <.05
13.6 12.6 <.01
50•5 9•7 <•05
57.8d
10.8 <.05
53.4 11.3 (.10
59.1 12.9 <.10
50.8 15.3 <.01
66.2 11.3 <: 10
72.0 12.6 <.10
- 8.5 12.6 (.05
1.2 4.3 (.01
Noté. Data on other characteristics comparing High and.Lower CL Staff can be found in Appendix 11.
a In the last six months.
Missing cases 1.
Missing cases in all interview scales for High CL cases = 7. d
Missing cases in all interview scales for Lower CL cases = 11.

130
and high CL staff were much more likely than lower CL workers to
have an undergraduate or graduate degree. Although twice as many
high CL workers had engaged in staff development courses in the
last six months, more lower CL workers were engaged in formal
certification programs.
Even though the former analysis comparing Stayers and
Leavers did not find a statistical difference on their Conceptual
Level scores, this present analysis states that high Conceptual
Level workers remain significantly longer both in their present
unit and with the agency than did lower CL staff.
Although lower Conceptual Level workers scored somewhat
lower on Jesness' internally focused preferences,
their mean score on the Behavior Reality Approach, considered
appropriate for Neurotic Acting-Out youth, was significantly lower
than the mean score of the higher CL staff.
Ratings of Palmer's interview scales strongly suggest that
higher Conceptual Level staff, although not necessarily "matched"
to specific youth types, are more open to the approaches appropri-
ate for every I-Level youth subtype. On all subtype scales,
high CL staff had higher scores than lower CL workers, and signifi-
cantly higher scores on the Mp/Cfc and Na subtype scales.
On the personality and professional orientation scales, four
scales significantly differentiated between the two groups of
staff, while four other scales made somewhat less significant
differentiations. High CL staff were_more likely than the lower

131
CL staff (and more likely than the average adult) to have
socially desirable qualities such as patience, pleasantness,
considerateness, self-confidence, and sensitivity. Furthermore,
the raters considered the former group to be sharper, more
inquisitive, and more intellectually flexible than the latter
group. Lower CL staff saw themselves as having as many problems
in their past as the average person, and were seen by the raters
to have an average amount of anxiety and concern over the present
and the future. This stands in contrast to the higher Conceptual
Level staff who saw themselves as having had more than the average
amount of personal problems to overcome in their past, while the
raters saw them in the present as being less anxious and more self-
confident than the average adult. Finally, on two professional
orientation scales, High CL staff were more likely than lower CL
staff to focus on youths' inner emotional needs and desires. Also,
high CL staff were more able to differentiate between behavior•
and emotional changes in youths, between rejecting youths'
behavior and rejecting the youth, and not interpreting people's
words and behaviors at face value. Although the higher CL staff
had the higher scores on these Inner Focus and Understanding and
Differentiating scales, both groups of workers were rated somewhat
higher than the average probation/parole agents.•
In summary, our findings suggest that higher CL persons are
"pretty together", sharp individuals who are open to learning
and integrating a range of information, which may not be congruent
with their own beliefs and knowledge. This capacity enables them
to see and tolerate the differences between youths, and respond
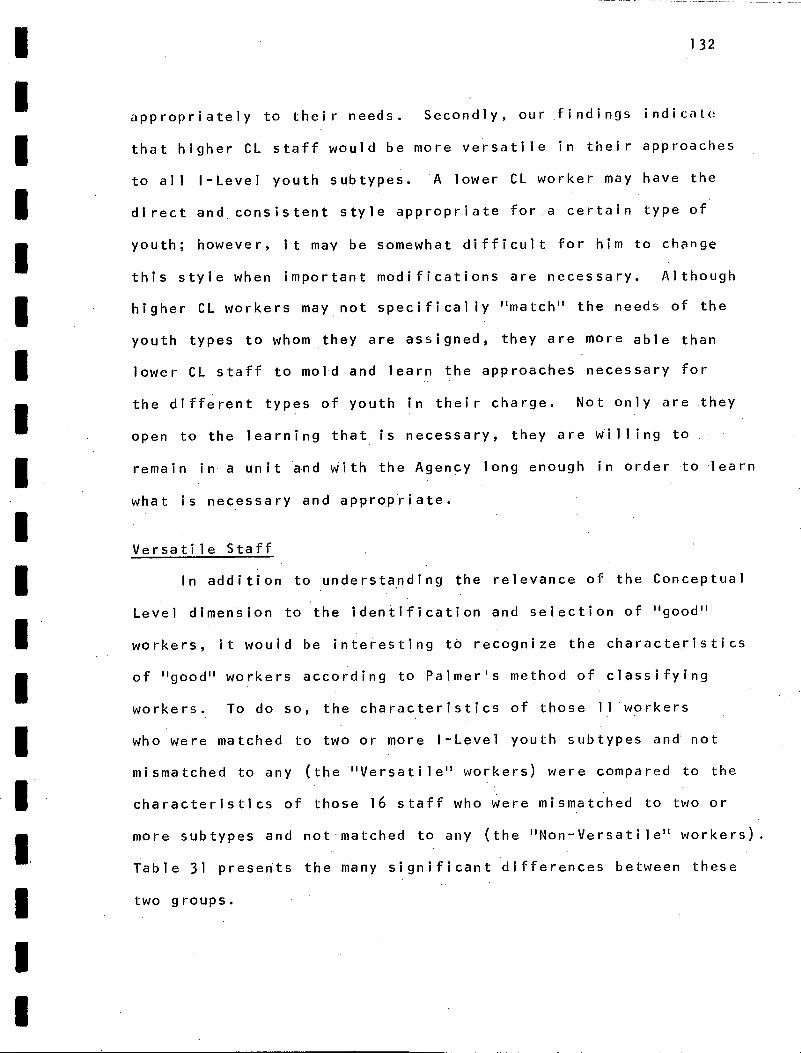
132
appropriately to their needs. Secondly, our findings indicate
that higher CL staff would be more versatile in their approaches
to all I-Level youth subtypes. A lower CL worker may have the
direct and consistent style appropriate for .a certain type of
youth; however, it may be somewhat difficult for him to change
this style when important modifications are necessary. Although
higher CL workers may not specifically "match" the needs of the
youth types to whom they are assigned, they are more able than
lower CL staff to mold and learn the approaches necessary for
the different types of youth in their charge. Not only are they
open to the learning that is necessary, they are willing to
remain in a unit and with the Agency long enough in order to learn
what is necessary and appropriate.
Versatile Staff
In addition to understanding the relevance of the Conceptual
Level dimension to the identification and selection of "good"
workers, it would be interesting to recognize the characteristics
of "good" workers according to Palmer's method of classifying
workers. To do so, the characteristics of those 11 workers
who were matched to two or more 1-Level youth subtypes and not
mismatched to any (the "Versatile" workers) were compared to the
characteristics of those 16 staff who were mismatched to two or
more subtypes and not matched to any (the "Non-Versatile" workers).
Table 31 presents the many significant differences between these
two groups.
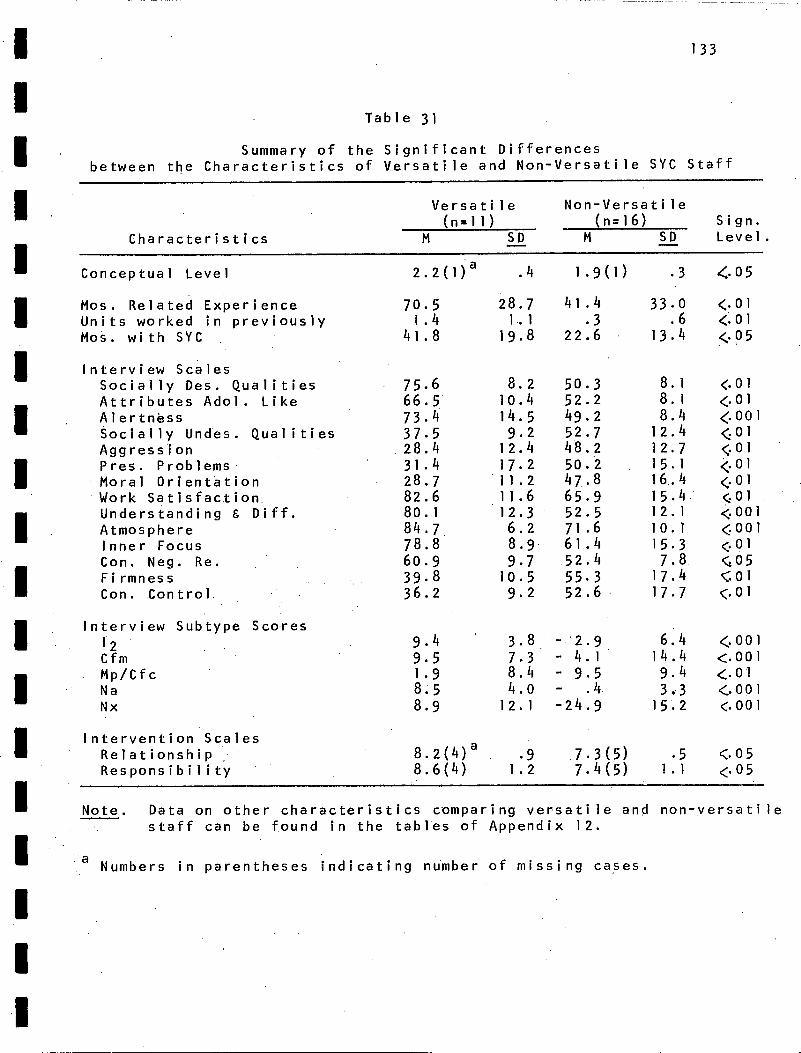
133
Table 31
Summary of the Significant Differences between the Characteristics of Versatile and Non-Versatile SYC Staff
Characteristics
Versatile Non-Versatile (n=11) (n=16) Sign.
SD M SD Level.
Conceptual Level 2.2(1) a .4 1.9(1) .3 4 05
Mos. Related Experience 70.5 28.7 41.4 33.0 <.01 Units worked in previously 1.4 1.1 .3 .6 <.01 Mos. with SYC S 41.8 19.8 22.6 13.4 <.05
Interview Scales Socially Des. Qualities Attributes Adol. Like Alertnèss Socially Undes. Qualities Aggression Pres. Problems Moral Orientation
• Work Satisfaction Understanding & Diff. Atmosphere Inner Focus Con. Neg. Re. Firmness Con. Control
75.6 8.2 50.3 8.1 401
66.5 10.4 52.2 8.1 <Al
73.4 14.5 49.2 8.4 ‹.001
37.5 9.2 52.7 12.4 <01
28.4 12.4 48.2 12.7 401
31.4 17.2 50.2 15.1 <.01
28.7 11.2 47.8 16.4 401
82.6 11.6 65.9 15.4 401
80.1 12.3 52.5 12.1 4001
84.7 6.2 71.6 10.1 4001
78.8 8.9 61.4 15.3 401
60.9 9.7 52.4 7.8 Ç 0 5
39.8 10.5 55.3 17.4 <.01
36.2 9.2 52.6 •17.7 <.01
Interview Subtype Scores
12 9.4 3.8 - 2.9 6.4 <.001 Cfm
0 9.5 7.3 -. 4.1 14.4 <.001
Mp/Cfc 1.9 8.4 ••• 9.5 9.4 <.01 Na 8.5 4.0 - .4 3.'3 (.001 Nx 8.9 12.1 -24.9 15.2 (.001
Intervention Scales Relationship , Responsibility
8.2(4) a .9 7.3(5) .5 <.05 8.6(4) 1.2 7.4(5) 1.1 <.05
Note. Data on other characteristics comparing versatile and non-versatile staff can be found in the tables of Appendix 12.
Numbers in parentheses indicating number of missing cases.

134
First of all, Versatile staff had a significantly higher
Conceptual Level mean score than Non-Versatile staff had. This
finding would support the notion suggested above that an individual's
CL score would help predict his ability to work with several
types of youths.
The more Versatile workers had almost six years of related
experience in comparison to the three and a half years of the
other group; the former group have remained longer than the latter
with SYC, and have had experience in more than one SYC unit.
As our present definition of versatility has been derived
from an individual's interview subtype ratings, the many signifi-
cant differences between the Versatile and Non-Versatile workers
on the interview scales is not surprising. On the five subtype
scale scores, Versatile workers score significantly higher than
Non-Versatile staff. Furthermore, 14 out of the 21 interview
scales differentiate between the two groups.
Versatile workers tended to be patient, interesting, sensitive,
and quick-thinking. They were not stubborn, manipulative,
threatening, or competitive. The raters considered these workers
to have less anxiety than the average person and more than the
average self-assurance and confidence. On the professional
orientation scales, Versatile workers had a pragmatic, innovative
approach to their job, and were less concerned than both the
Non-Versatile workers and the average parole/probation officer in
telling the youth whdt to do, using their authority with youth,

135
and being concerned with laws and rules. Versatile workers were
significantly more concerned with creating an atmosphere of
consistency, trust, confidentiality, understanding, and acceptance,
and with focusing on the youth's inner needs and desires as well
as on negative feelings such as guilt, anger and aggression than
were Non-Versatile workers. The latter were fairly satisfied
with their work, while Versatile workers were very satisfied, far
more so than the average parole/probation officer.
Only two out of 17 self-rated intervention scales differen-
tiated between the two groups of workers. Versatile workers rated
themselves as having a better relationship with their youths and
said they gave more appropriate responsibilities and assistance
to their youths than did Non-Versatile workers.
Summary and Implications
Our findings indicate that a number of measurable background
and personality characteristics would be relevant to the selection
and keeping of competent, versatile workers. The most important
characteristics include:
1. less than average personal anxiety;
2. higher than average ability to conceptualize and integrate information;
3. relevant educational background and continuing interest in staff development;
4. experience in the social services field;
5. above average satisfaction and pleasure in work as a helping agent.
Other relevant characteristics that could be considered are:
6. marital status as one indication of an individual's possible mobility;

136
7. socially desirable qualities such as patience,
sensitivity, and resourcefulness;
8. ability to understand the subtle and motivating dynamics
of youths' behaviors;
9. intellectual creativeness;
10. comfortability with innovative approaches to helping.
Characteristics that may be relevant to the treatment aspects
of a SYC worker's job, but potentially problematic to the control/
authority aspects of this job, are a less than average concern
with firmness, directness, structuring youths' experience, and
conforming to society's expectations of rights and wrongs. It is
interesting that higher CL individuals did not score below
average on these characteristics, while the versatile specialists
identified by Palmer's Classification System did so, Clear
expectations, regular supervision, and a worker's openness to
execute both aspects of his job would reduce the problematic
nature of these "treatment-not-control" professional and personal
orientations.
Is it possible to economically identify these ten worker
characteristics? Furthermore, are people with these characteris-
tics "so special" that there are not many around to hire?
The first five and most of the remaining relevant characteris-
tics can be identified from a regular job application form (for
educational and work background), the 20-minute Paragraph Completion
Measure (measuring Conceptual Level), and a one- to two-hour
interview (measuring personal anxiety, self confidence, and work
satisfaction as well as sensitivity, resourcefulness, and

137
creativity). The interview protocol found in Appendix 1 would
be a useful format for this selection interview. If more
detailed information is desired, the Palmer's rating inventory
could be used to rate an individual on various other characteris-
tics which are relevant to general, competent work. These
ratings also provide specific information about a worker's
suitability for intensive work with certain I-Level youth subtypes.
For valid ratings, this instrument demands trained raters and two
independent ratings on each individual. Both the initial training
and the ongoing need for two independent ratings entail a substantial
time and financial commitment (10-13 hours, per interview).
Given a commitment and the expertise to identify at least
some of these ten character clusters can the agency find people
with them? Obviously it would be harder to find persons with all
the ten characteristics than to locate individuals with at least
a few of them. Generally, SYC hires a more educated, experienced
type of worker than do provincial reception centers in general
(Batshaw, 1975). Of SYC's workers in 1976 and 1977, only one-
quarter were considered in the quite experienced, flexible, higher
Conceptual Level, "Staying" category. Even fewer workers were
identified as very versatile specialists who interestingly enough
had a professional orientation to their work that emphasized the
treatment aspects above the control demands of their jobs. Figure
9 clearly illustrates the decreasing availability of staff types
when more special characteristics are sought. However, given the
undesirable consequences of SYC's high turnover rate on youths'
satisfaction and growth, and the pressure on management to

138
Figure 9
Rough Distribution of Staff Types
Very versatile specialists
Good, experienced and flexible workers
Most SYC staff (1976-1977)
Most staff in provincial reception centers
\\\\\\\ • •
•
General population
continually find people to fill empty positions may it not be wiser
to search more carefully for specific individuals who are "pretty
together", relatively experienced, educated, self-confident, and
conceptually flexible and independent?
Finally, the personality characteristics identified as
relevant to the selection of good staff also indicate how to
Ilwork with the worker". For, no matter how excellent are the
workers who have been selected, their ability to remain and to do
an efficient, effective job with children in large measure depends
on the environment in which they work.

139
"Care for the Caregivers"
In her extensive exploration of the children and "caregivers"
in 44 English residential places, Berry (1977) concluded that the
milieu in which caregivers find themselves both directly and
indirectly affect how the staff work with children. Furthermore,
she writes:
the personal qualities of caregivers apparently matter less than the availability of supportive experience within the work situation — a hopeful finding since it is obviously easier to provide the latter than to attempt to change the former. (p. 144)
Three aspects of the SYC work situation are discussed:
clarity of job expectations, supervision services, and team
characteristics.
Clarity of Expectations
Knowing what one is expected to do is an essential ingredient
of an efficient, goal-oriented, and satisfying working environment.
If workers do not know, or know only vaguely what they are supposed
to do, they can become confused, frustrated, and ineffective.
Obviously, this does not mean every situation needs a defined
response; however, general standards, values, objectives, and
routines need to be clear and accepted.
Two pieces of evidence collected by the research suggest
that there was a considerable variation in the clarity and
specificity, treatment standards, objectives, and routines at the
individual unit and worker level.

140
The first piece of evidence comes from the Staff Tasks
report (Reitsma and Brill, 1977) which discussed what SYC workers
saw as their chief responsibilities and how they carried out these
responsibilities. The report was based on a compilation and
summary of responses to a semi-structured questionnaire.
We found that the variation of responses increased in relation
to the specificity of the questions. All workers placed a priority
on providing youths with opportunities for growth and change;
custody and controlling behavior was listed by only seven out of
the 53 respondents. Residential workers stressed unit structure
and activities while community workers more often rhentioned
family and court work as important responsibilities. When asked
how these responsibilities are specifically carried out, and what
proportion of time is allotted to each, the variation in answers
increased. Our conclusion at the time was that:
The range in answers that workers gave to how much
time they spent in certain tasks may stem from
real diversity within and between teams, or from a
remarkable diack of clarity and awareness of how they
break their responsibilities into time commitments. (Reitsma and Brill, 1977, p. 42)
A year later, more evidence emerged to indicate the
considerable variation in clarity of expectations. Workers and
their supervisors were asked to rate the quality of their regular
interventions with youth on the Staff Intervention Questionnaire.
As previously mentioned, although overall scores seemed similar,
there was little to no correlation between observer and self
ratings. There was very little correspondence between a supervisor's
and a worker's interpretation and evaluation of routine treatment

141
tasks such as treatment planning, writing reports, group work,
planning activities, etc.
Our interpretation of these two findings would be that
although SYC staff endorse similar long-range goals and dreams,
at the individual unit and worker level great variation exists
over objectives and interpretations of expectations. Is this
variation a result of unclear expectations or poorly communicated
and interpreted expectations? Whatever the case, the variation
can contain the seeds of flexibility and creativity as well as a
potential for confusion, inconsistencies, and discord in staff's
working environment, especially if supervision is infrequent and
non-directed.
Supervision
Staff need relatively frequent opportunities for both formal
and informal consultation and sharing. In effect, when staff are
listened to, and supported, and helped to solve their
professional and at times personal problems, then they in turn
will listen to, support, and help youths. How caregivers are
cared for determines how the youths are cared for. Berry (1977)
found that this was very much the case in her study of 44
residential institutions. The residential workers in the more
positive and good enough units were far more likely to have
opportunities for internal and external consultation than did
workers in the more negative units.

142
Do SYC workers have adequate opportunities for consultation
and sharing? Once again, variation exists between units and
settings both in quality and quantity of supervision. Although
most workers in all but one SYC team said they received at least
some supervision in March 1976 (see Table 32), residential workers
in April 1978 were not very satisfied. In our analysis of 30
child care workers' responses a to the adequacy of supervision,
37.3 percent of the CCW's felt supervision was adequate or at
least good enough; the remaining 63.3 percent said supervision
occurred infrequently and was of inadequate quality.
Furthermore, the focus of supervision varied greatly. In
March 1976 workers said supervision ranged from spontaneous, non-
directional talking to specific discussion of treatment issues
about youths and personal and professional growth (Reitsma and
Brill, 1977, p. 30). Two years later, counsellors were saying
that: "Supervision has improved greatly, but I would like to
see more direct, personal supervision"; "Supervision has been very
inconsistent because of many changes in personnel"; "Supervision
is irregular and of inconsistent quality".
In summary, opportunities for consultation and sharing in
supervision varied considerably over time and between units.
Residential workers were least satisfied. The important point
is that even though management may believe that workers are given
supervision, a substantial proportion of workers do not feel they
a Questionnaire given out in May 1978 by the Child Care Counsellors
Committee, E. King, Chairman.

1 43
receive it. It is likely that both management and frontline
personnel do not have common expectations about supervision.
For instance, a workermay not feel an informal "chat" is super-
vision. Secondly, supervision may not be reaching some workers
as the approach is inappropriate. Throughout this report
comments have been made concerning the personality characteristics
of a worker which indicate how best to "work with the worker". A
lower Conceptual Level worker needs much more directive, advice-
giving supervision than a high Conceptual Level individual who
would benefit more from creative, mutual exploration supervision.
Table 32
Amount of Time Spent in Supervision (March 1976) a
Hours of Supervision each Month
Team No. of
Respondents Mean Median Range
Total 39 8.9 6. 0 o-4 0
Residence 1 6 9 7.5 3 - 30 2 6 o o o 3 5 6 6 4- 8 4 6 2.7 1.5 o- 8
Community 6 5 9 8 4-13 7 3 6 6 4-8
Group Homes
9 10
2 20 20 16-24 4 19 9 8-4o
Source: Reitsma, 1976, p. 30.

144
An individual who tends to "repress" or absorb information needs
guidance to examine, not avoid the implications of anxiety-
provoking information. Baldwin's research (1974) would also
indicate that repressers expect fairly formal, structured, task-
focused supervision sessions. On the other hand, a person who
worries and "sensitizes" needs assistance in integrating
information rather than overloading. Therefore, for the working
environment to be supportive to staff, there needs to be
adequate supervision conducted in a style appropriate to the
needs and expectations of each worker.
Team Characteristics
Job expectations and supervision are two of the more "formal"
aspects of an individual's working environment. As SYC's
organization is decentralized and the units are fairly autonomous,
an individual's working milieu is substantially influenced by the
atmosphere, cohesiveness, and supportiveness of his team. This
is especially true for residential and group home workers, as
good team work is essential in 24-hour group living situations.
Five times SYC teams were asked to characterize their team
milieus on Moos.' and Humphrey's Group Environment Scale (1974).
The items of the questionnaire make up ten scales which are grouped
into three dimensions: Relationship, Personal Growth, and System
Maintenance and Change. In Environments Facilitating Change, Brill
(1978a) describes the scales and the findings in detail. For our
purposes, Table 33 summarizes the overal team atmosphere in each
of SYC's five residential units. (At the time of writing, analysis
of the data on other SYC teams was not available.)

111.1 1111111 MS IIle OM MI all am ire 1•1111 Me OM
Table 33
Overall Working Milieu of SYC Residential Teams
Team
Scale 1 2 3 4 5
SD M SD M SD M SD M SD
Relationship Cohesion Leader Support Expressiveness
8.2 2.0 5.4 3.3 8.5 1.5 8.3 1.6 7.8 2.0
6.9 2.5 4.9 3.7 8.3 1.6 8.5 1.0 7.9 1.1
6. 0 1.4 5.6 2.2 7.1 1.4 6.1 1.9 6.4 1.7
Personal Growth Independence 7.5 1.6 6.7 1.5 7.5 1.2 7.7 1.5 7.6 1.0 Task Orientation 8.2 1.7 7.4 1.9 8.2 1.3 8.0 1.0 7.2 1.5 Self-Discovery 4.2 1.7 4.7 2.6 5.5 2.3 5.5 1.4 5.7 1.9 Anger and Aggression 2.9 2.2 6.4 2.0 3.3 1.7 3.5 2.1 5.0 2.0
System Maintenance Order & Organization 7.4 2.3 5.0 2.7 7.1 2.0 6.0 2.3 4.9 2.5 Leader Control 4.5 1.7 2.9 2.0 4.3 1.4 3.9 1.7 4.7 2.3 Innovation 5.1 1.8 5.1 1.8 4. 0 2.8 5.8 1.9 7.4 1.2
No. of Administrations
No. of Respondents
5 4 5 5 3
37 27 4 0 42 26

146
The working milieu of all the teams was characterized by high
Task Orientation, that is, a priority was placed on getting the
job done. The goal of personal growth and discovery was rated as
much less important. The freedom to act independently and in an
innovative way was average to above average in all the teams.
On the relationship dimension of Cohesion, Leader Support,
and Expressiveness, it is striking that Team 2, who had the least
favourable scores and the greatest variability in scores
(indicating marked changes in the working atmosphere and/or
differences in team members' perceptions) was the team that had
the highest turnover of staff. Conversely, Team 3 members
consistently rated their working milieu as supportive and cohesive;
their overall scores on the relationship scales were higher than
the other teams and they had the lowest runover rate. Figure 10
clearly illustrates this relationship.
Two other characteristics of the team's milieus are worth
noting: the two teams with the higher order and organization
scores had the lower anger and aggression. A relationship
between high anger and aggression (which indicates that hostile
feelings and criticisms are openly expressed) and lower order
and organization in a milieu has been previously noted by Duncan
and Brill (1977) in their study of group home milieus. It is
feasible that workers (and youths) become more dissatisfied and
critical when team purposes and processes are unclear and contra-
dictory.

High
Low
2 3 1 4
Figure 10
Rough Presentation of Relationship between Supportive Team Milieu and Turnover a
147
Team
Supportive Working Milieu
• , Turnover
a For Team Milieu data see Table 33; for Turnover figures see
Table 27 and Figure 8.
Although our information cannot prove a causal link between
non-supportive working milieu and low staff morale or high
turnover, the various pieces of data strongly suggest that
residential workers are more likely to remain in a unit, and both
they and their clients will be more satisfied if the working
environment is reasonably orderly, purposeful, challenging, and
supportive. Satisfaction does • ot necessarily lead to effective

i48
treatment. However, youth and staff dissatisfaction and high
staff turnover will certainly not promote effective treatment
conditions for SYC youths.

SUMMARY, CONCLUSIONS, and IMPLICATIONS

149
Summary
Shawbridge Youth Centers cares for 250 anglophone delinquent
boys and girls in its residential, group home, and community
center facilities. The Agency's philosophy of differential
classification and treatment of youth, as influenced primarily by
the 1-Level classification system, and secondarily by the
Conceptual Level Matching Model, has led to a clearly specified
policy of selecting different staff types and "matching" worker
and youth personality characteristics.
This research on staff characteristics aimed to learn to
what extent SYC fulfills the specific staffing needs inherent
in its commitment to differential treatment, and what factors
would increase the effectiveness and efficiency of individuals
selected to work for the Agency. The following five points
summarize our findings:
(1) Description of Staff. During 1976 and 1977, 137 individuals
filled the supervisor, community caseworker, residential child care
counsellor, and group home houseparent positions in SYC's 13 open
treatment uni ts. Generally, SYC hired young, reasonably qualified
and relatively mobile men and women. Three-quarters of the workers
had formal certification, mostly in the social science discipline.
One-quarter of the group was involved in obtaining certification;
almost one-half had participated in staff development courses in
the last six months.
Seventy-five percent of the workers were previously employed
before coming tb SYC; of these, the majority held jobs in the

150
"helping" profession.
SYC workers remained with the Agency approximately two years,
and in their present units, only one year.
The majority of the workers had an openness to the treatment
approaches appropriate for SYC youth types as measured by the
Jesness' Staff Preference Study. Over 50 percent of the workers
were average in their ability to conceptualize and integrate
information and experience as rated by Hunt's measure of
Conceptual Level; one-fifth were above average. Response to
anxiety and stress was normal for the vast majority of workers
(using Byrne's measure of Progression-Sensitization).
(2) Staff Change and Development. When the characteristics
of the SYC staff working in March 1976 were compared with those
of individuals working in October 1977, the statistical analysis
indicated only minor changes in the composite profile of the
staff group. That is, workers' levels of education, experience,
general aptitude, personal preferences, and time with the Agency
had not changed. One interpretation of these findings is that
overall there was minimal professional development in the SYC
staff group. A second interpretation is that turnover of workers
at SYC was quite high. Further examination indicated both
interpretations are correct. Staff turnover was high, and the
changes in the individuals who remained were not positive; in
fact, these workers' ability to conceptualize and handle stress
had decreased significantly over time.

151
(3) Appropriate Assignment of Staff. The second aspect of
SYC's staffing policy, that is, the appropriate assignment of
selected staff according to youth needs and job demands, was
partially implemented. Although many significant differences in
personality and professional characteristics were noted between
the chief staff position in each setting (child care counselors in
residence, group home parents in group homes and community workers
in project centers), there were few differences between the teams
within two of the three treatment settings. Only the two community
teams had distinctive and different worker profiles.
When the appropriateness of worker assignment to particular
youths was examined in the context of 1-Level theory, we found
that almost 50 percent of the community and group home youths
had matched workers; the remaining youths had "in-between"
(unmatched) workers and none had a mismatched worker. However,
only 15 percent of residential youths had matched primary workers,
while 30 percent had mismatched ones.
This picture changes substantially if worker appropriateness
is considered in the light of Hunt's theoretical Conceptual Level
Matching Model. Then, almost 50 percent of the youths had matched
workers and less than one-fifth were in mismatched relationships.
Another important and disturbing finding was that one-third
of the sample youths did not have a primary worker for longer
than four months. That is, these youths either had several
workers for various periods of time, due to case transfer or

15 2
worker turnover, or they did not stay in a unit long enough to
make a significant connection with a worker. (This excludes the
change of workers that usually occurs when a youth transfers
from residence to a group home or community setting.) The factors
that lead to this situation need attention, especially as an
important tenet of SYC's treatment philosophy is the quality of
the individual relationship between a youth and 'his/her worker.
Staff turnover and program changes prevent almost one in three
youths from participating in this essential aspect of treatment.
(4) Characteristics of "Good" Workers. Besides examining the
implementation of SYC's special staffing policy, an exploration
was conducted into general factors influencing individual's work
with SYC's youths. In the first place, a comparison of several
types of staff groups helped to isolate certain personal and
professional characteristics which could be useful in the
selection of basically "good" workers. An interrelated set of
characteristics were found which included the following:
( 1) Less than average personal anxiety;
( 2) Higher than average ability to conceptualize and
integrate information;
( 3) Relevant educational background and continuing
interest in staff development;
( 4) Experience in the social services field;
( 5) Above average satisfaction'and pleasure in work as a
helping agent;

153
( 6) Marital status as one indication of an individual's
possible mobility;
( 7) Socially desirable qualities such as patience,
sensitivity, and resourcefulness;
( 8) Ability to understand the subtle and motivating
dynamics of youths' behaviors;
( 9) Intellectual creativeness;
(10) Comfortability with innovative approaches to helping.
(5) Factors Influencing Turnover Rate. One marked and
disconcerting characteristic of the complete SYC staff group was
the turnover rate. Over three-quarters of the workers who were
with the Agency in March of 1976 had either transferred or resigned
before October 1977. Also, one- third of the people hired to
fill vacant and new positions had also left or transferred before
October. Turnover was higher in the residential and group home
settings than in the community.
To help explain the high turnover rate, we explored both
personality and environmental influences. The analysis of the
personality and professional differences between "Stayers" and
"Leavers" indicated that if the Agency wants to hire individuals
who will in all likelihood remain for approximately two years in
a unit, experienced, mature l ligh CL , personally confident, and
optimistic individuals should be considered.

154
The environmental influences which appeared to have some
effect on staff stability and satisfaction included (a) regular
supervision in a style appropriate to a person's needs and
learning patterns; (h) clear job expectations and principles of
treatment; and (c) a supportive, cohesive, task-oriented working
milieu. High turnover, low staff morale, and low youth satisfaction
(which has been related to higher self-reported delinquency by
Brill and Reitsma, 1978) were more prominent in units with minimal
supervision and an inconsistent, relatively unsupportive team
atmosphere.
Conclusions and Implications
(1) Staff Selection. Shawbridge Youth Centers hires reasonably
qualified individuals who stay for one to two years in a given
treatment unit. Certain characteristics have been identified
that could reliably predict workers who are basically competent,
and capable of working for relatively long periods of time with at
least several types of youths.
These findings have obvious implications for the selection
and supervision of SYC staff. Some of these characteristics can
be identified by existing selection procedures. Other
characteristics, such as a person's conceptual ability, can be
deduced from the results of the 20-minute Paragraph Completion
Measure. As conceptual ability was significantly related to
personal maturity, flexibility, and job stability of the persons
in our sample, this instrument would be a most helpful addition
to the selection procedures. Secondly, a shortened version of

155
Palmer's interview protocol and personality ratings would also
provide assistance in selecting competent, durable workers. The
more time-consuming specialized interview and rating procedures
would obviously give in-depth, specific "matching" information
in the context of I-Level theory.
(2) Caring for Staff. Not only do the findings have
implications for the selection of staff for SYC (and for other
treatment agencies), but the information also indicates how to
care for the caregiver". Good staff can be identified and
appropriately assigned. That is only the first step. People
cannot do an adequate, effective job if they are not cared for
and supported. Elements of good care include: regular supervision
in a manner appropriate to the individual; clarity of job
expectations and of treatment principles; a supportive, cohesive
team environment; and opportunity for professional and personal
development. As'ideal or even adequate staff cannot always be
found, especially when there is pressure to fill a position, it
is of particular importance that the working environment for
existing and future SYC staff be given close attention. Further-
more, changes in the working envi ronment will have a more
immediate impact, while the effects of a revised selection
procedure will be experienced at a later date.
(3) Staff Matching. One of the three theoretical pre-
requisites of the differential treatment process for maladjusted,
delinquent youth is the appropriate selection and assignment of
specific staff types. This is SYC's staffing policy.

15 6
Although the Agency makes no claims to match staff with
clients using CL theory, it is quite interesting to note that a
far greater percentage of youths in all units had a theoretically
matched worker according to this scheme than according to the I-
Level model. Appropriate assignment of "specialist" staff
according to the I-Level theory occurs in SYC's community treatment
unit, but not in the residential or group home units. Although
50 percent of the youths are served in the community units,
theoretically the more "needy", severely maladjusted youths who
require a stabilizing, "turning around" experience are put into
the residential units. Rather than having "matched" workers,
during the past two years residential youths were more likely to
have either an unmatched worker, or one considered very
inappropriate to their needs (from the point of view of I-Level
theory).
It is important to recognize that this report has not evaluated
the usefulness of matching by either of these two theoretical
models. This evaluation is reported in Brill's report on
Factors Contributing to Client Change (1978). As well as comparing
the relative merits of matching workers to clients using these
models it also looks at the usefulness of matching clients to
the program environment rather than to individual workers. Even
without these results, this report suggests there are many aspects
of SYC policy regarding selection and supervision of its staff
which need to be immediately addressed.

157
In conclusion, it is evident that there exists grave problems
at SYC with regard to several aspects of hiring, placement, and
maintaining suitable staff to deal with their delinquent clients.
Rather well qualified staff are hired but do not stay; the very
best are placed with those youths who should theoretically need
them the least. In the residential and group home settings, it
seems clear that the working conditions contribute very
substantially to the high turnover rate, which may in turn be
reflected in high client dissatisfaction and further program
instability. Some implications are abundantly clear: satisfaction
among staff and clients must be increased and turnover must be
substantially decreased.
An immediate increase in the amount and specificity of guidance
and coordination for staff regarding all aspects of treatment
activities would appear to be imperative. Over the longer term,
creation of teams composed of the most versatile, conceptually
complex individuals available would appear to facilitate team
functioning as well as to heighten each team's ability to work
with a variety of youths — especially those who are most maladjusted.
We suggest that although the specialized selection and
matching of staff is an admirable goal, it is an unrealistic and
inappropriate goal if basic selection and working environment
issues are not addressed. In our opinion, the conscientious
selection, development, training, and "caring for" competent
individuals is a more feasible and important objective at this

158
point in SYC's existence. We recommend Shawbridge Youth Centers
take smaller steps in designing and implementing its staffing
policies. Walking comes before running.
il
1

REFERENCES

160
REFERENCES
Adams, S., and Hopkinson, C. aj Eveluation of the Intensive Supervision Caseload Project (Report No. 12). Los Angeles: County Probation Department, May, 1964.
Baldwin, B. A. Self-Disclosure and expectations for psychotherapy
in repressors and sensitizers. Journal of Counselling
Psychology, 1974, 21, 455-456.
Batshaw, M. (President). Rapport du Comité d'étude sur la
réadaptation des enfants et adolescents placés en centre d'accueil (vol. 2 et Annexe 3a). Québec, P.Q.: Ministère des Affaires Sociales, Novembre, 1975.
Bélanger, P. L'intervention des éducateurs à Boscoville (Rapport No. 17). Montréal: Université de Montréal, Groupe de Recherche sur l'inadaptation Juvénile, Août, 1977.
Berry, J. Daily Experience in Residential Life. London:
Routledge and Kegan Paul, 1975.
Bettelheim, B. Love is Not Enough. London: Collier-MacMillan,
1950. .
Bowlby, J. Child Care and the Growth of Love. London: Penguin
Books, 1953.
Brill, R. Effects of Residential Program Structure and Conceptual
Level in Treatment of Delinquent Boys, Unpublished
doctoral dissertation. University of Toronto, 1977.
Brill, R. Environments Facilitating Treatment (Final Report No. 4). Montreal: Université de Montréal, Groupe de Recherche sur l'Inadaptation Juvénile, 1978.
Brill, R. Factors Related to Client Change (Final Report No. 5). Montreal: Université de Montréal, GRIJ, in process.
Brill, R.,and Reitsma, M. Action-Research in a Treatment_AmmI for Delinquent Youth (Final Report No. 1). Montreal: Université de Montréal, GRIJ, May, 1978.
Bryne, D. Repression-Sensitization as a dimension of personality.
In B. A. Maher (Ed.) Pro ress in Ex erimental Personality Research Vol. 1), New York: Academic
Press, 1964.
Bryne, D., Barry, J., and Nelson, D. Relation of the revised Repression-Sensitization scale to measures of self-
description. Psychological Reports, 1963, 13, 323-334.

161•
Carr, J. E. Differentiation similarity of patient and therapist and the outcome of psychotherapy. Journal of Abnormal Psychology, 1970, 76, 361-369.
Cusson, M. Boscoville: Portrait d'un milieu de rééducation (Rapport technique No. 15). Montréal: Université de Montréal, GRIJ, Novembre 1977.
Dinnage, R., and Kellmer, M. L. Residential child care: Facts and Fallacies. New York: Humanities Press, 1967.
Feder, C. Z. Relationship of Repression-Sensitization to Adjustment Status, Social Desirability, and Acquiescence Response Set. Journal of Consulting Psychology, 1967, 31, 401 - 406.
Gardiner, G. S., and Schroder, H. M. Reliability and validity of the Paragraph Completion Test: Theoretical and Empirical Notes. Psychological Reports, 1972, 31, 959-962.
Grant, J., and Grant, M. Q. A group dynamics approach to the treatment of nonconformists in the Navy. Annals of American Academy of Political and Social Science, 1959, 322, 126 - 135.
Grenny, G. W. The Relationship of Treater Personality to MtIbods of Bqhm1.21- 011ageu_FLIjambLofjpifferential Treq1Me.M.1_111_1lig_Iliit2=1.§_ID.M.11_AMIL2.111.Y. Unpublished Doctoral Dissertation. Berkeley: University of California, 1971.
Harvey, O. J., Hunt, D. E., and Schroder, H. M. Conceptual
Systems and Personality Organization. New York: Wiley, 1961.
Harvie, E.,and Brill, R. Client Characteristics (Report No. 3) Montreal: Université de Montréal, GRIJ, March, 1977.
Harvie, E., and Brill, R. Final Report on Client Characteristics
(Report No. 3). Montreal: Université de Montréal, GRIJ, 1978.
Heck, E. J., and Davis, C. S. Differential expression of empathy in a counselling analogue. Journal of Counselling Psychology, 1973, 20, 101-104.
Hunt, D. E., Butler, L. F., Noy, J. E., and Rossor, M. E. Assessing Conceptual Level by the Paragraph Completion Method. Toronto: Ontario Institute for Studies in Education, 1971.
162
Hunt, D. E. Matching Models in Education: The Coordination of
Teaching Methods with Student Characteristics. Toronto:
Ontario Institute for Studies in Education, 1971.
Hunt, • E. Conceptual Level Theory and research as guides to
Educational Practice. Interchange, 1977-78, 8(4), 78-90.
Jung, C. G. Man and His Symbols. New York: Doubleday & Company,
Inc., 1964, 58-66.
Krohne, H. W. The influences of defense mechanisms on complex
information processing. Unpublished doctoral dissertation, Princeton, N.J.: University of Princeton,
1970.
Krohne, H. W., and Schroder, H. M. Anxiety Defense's Complex Information Processing. Unpublished Manuscript, Princeton, N. J.: Princeton University, 1972.
LeBlanc, Hanna, W., and Brill R. An Evaluation Study Proposal of a Differential Treatment Program at the Boys' Farm and Training School. Shawbridge, March, 1975.
LeBlanc, M., and Brill, R. Revised Boys'Farm Research Project. Document submitted to Boys'Farm Management. Montreal: August, 1976.
-
Legendre, G. Méthodologie d'analyse de la structure des groupes
à Boscoville (Rapport No. 9). Montréal: Université de Montréal, GRIJ, 1975.
McLachlan, J. F. C. Therapy strategies personality orientation and recovery from alcoholism. Canadian Psychiatric Association Journal, 1974, 19, 25-30.
Ménard, R. Identité des éducateurs de Boscoville (Rapport technique
No. 4). Montréal: Université de Montréal, GRIJ, Août, 1974.
Monsky, S. F. Staffing of local authority residential homes for children. The Social Survey. 1963, 200-205.
Moos, R. J., Meel, P. M., and Humphrey, B. Combined Preliminary Manual: Family, Work and Group Environment Scales. Consulting Psychologists Press, Inc., Palo Alto, California, 1974.

163
Murphy, P. D., and Brown, M. M. Conceptual systems and teaching
styles. American Educational Research Journal, 1970,
7, 529-540.
Palmer, T. Types of Probation Officers and Types of Youth on
Probation: Their Views and Interactions. Los Angeles:
University of Southern California, Youth Studies
Center, 1963.
Palmer, T. Types of treaters and types of juvenile offenders.
Youth Authority Quarterly, Fall 1965, 18(3).
. Personality Characteristics and Professional
Orientations of Five Groups of Community Treatment
Project Workers: A Preliminary Report on Differences
Among Treaters. California: Community Treatment
Project, 1967a.
Palmer, T. Relationships between Needs of Youngsters and
Characteristics of Treaters: Illustrations of Factors
which Bear Upon Matching. Paper presented at the
National Meeting of the Big Brothers of America,
Anaheim, California, June 21, 19671).
Palmer, T. An Overview of Matchint in the Communit Treatment
Project. Paper presented at the Annual Meeting of
the Western Psychological Association, San Diego,
California, March 30, 1968a.
Palmer, T. Revision by Howard, G. Rating Inventory for the
Selection and Matching of Treatment Personnel,
California: California Treatment Project, 19684,1972.
Palmer, T. The Group Home Project (Final Report). California
Youth Authority and National institute of Mental
Health (Grant No. MH 14979), 1972.
Palmer, T. The community treatment project in perspective:
1961-1973. Youth Authority Quarter1/, 1973, 26(3).
Palmer, T. Recent Research Findings in I-Level. Paper presented
to the International Differential Treatment Association, Rensellerville, New York, March 28, 1977a.
Palmer, T. Matching of Workers and Clients: Some Observations
on Dynamics. Presentation at the I.D.T.A. Conference,
Rensellerville, New York, March 29, 19776.
Palmer,

164
Reitsma, M., and Brill, R. Staff Characteristics (Report No. 2). Montréal: Université de Montréal, GRIJ, December, 1977.
Reitsma, M., and Brill, R. Staff Tasks,(Report No. 1). Montréal: Université de Montréal, GRIJ, September, 1977.
Silverman, J. Personality Trait and "Perceptual Style" Studies of the Psychotherapists of Schizophrenic Patients. The Journal of Nervous and Mental Disease, 1967, 145, 5-15.
Sullivan, C. E., Grant, M. Q., and Grant, J. D. The Development of Interpersonal Maturity: Applications to Delinquency. Psychiatry, 1957, 20, 373-385.
Sundland, R. M., and Barker, E. N. The orientations of psycho-
therapists. J. Consult. Psychol., 1962, 26, 201-212.
Vinter, R. D., cd. Time Out - A National Study of Juvenile Correctional Programs. Ann Arbor, Michigan: The National Assessment of Juvenile Corrections, 1976.
Walther, R. The Evaluation of Youth Workers in Institutions for Juvenile Delinquents. Unpublished doctoral thesis, Denton, Texas, January, 1962.
Warren, M. Q. Interpersonal Maturity Level Classification: Juvenile. Diagnosis and Treatment of Low, Middle and High Maturity Delinquents. Sacramento, California: Department of Youth Authority, 1966.
Williams Committee. Caring for people: staffing in residential homes (National Council of Social Service Report). London; Allen g Unwin, 1967.
Wylie, R. An Alternative to Institutional Expansion (Boys' Farm and Training School, Shawbridge, Que.). A report prepared for a program approval submitted to the Department of Social Affairs, Que., April, 1972.
Wylie, R., and Hanna, W. Treating Delinquent Youth: The Boys' Farm (Shawbridge) Develops an I-Level Program. Review of the Childhood and Youth Welfare Services, March, 1971, 11(1).

APPENDICES

List of Appendices
Page
1. Description of Instruments 166
(a) Position Qualifications 167
(h) A Brief Description of the I-Level Classification System 169
(c) Research Interview Protocol 173
(d) Scale Items used to Assess SYC Workers' Personality Characteristics and Professional Orientations 176
(e) Description of Staff Intervention Subscales 181
2. Characteristics of SYC Staff: Initial Measurement 184
3. Characteristics of SYC Staff: Second Measurement 199
4. Analysis of Significant Differences between the Characteristics of SYC Staff at T . and T 2
214
5. Summary of the Significant Differences at T 2 between the SYC Staff in Different Settings, Positions, and Teams on Background and Personal Characteristics 230
6. SYC Staff Ratings on the "Treater-Matching" Interview Scales 236
7. SYC Staff Ratings on the Staff Intervention Scales 249
8. SYC Youths' Satisfaction with their Workers 258
9. Staff Turnover 261
10. Distribution of Workers and Youth in each Unit by I-Level and Conceptual Level 263
11. Comparison of the Characteristics of High and Lower Conceptual Level SYC Staff 270
12. Comparison of the Characteristics of Versatile and Non- Versatile SYC Staff 275
13. Comparison of the Characteristics of Stayers and Leavers 280

APPENDIX 1
Description of Instruments
166

1. Acceptance
2. Accomplishment
3. Acuteness
4. Administration
5. Attitude
6. Capacity
7. Creativeness-
8. Dependability
9. Drive
10. Flexibility
POSITION QUALIFICATIONS a
1 67
Gains confidence of others; earns respect.
Effective use of time. Amount of work produced.
Mentally alert. Understands instructions, explanations, unusual situations and circumstances quickly.
Organizing own work and that of others. Delegation, follow-up, control of position activities.
Enthusiastic, constructive, optimistic, loyal.
Mental depth and breadth; reservoir of mental ability.
Original ideas. An inquiring mind. Fresh approaches to problems.
Meets schedules and deadlines. Adheres to instructions and policy.
Works with energy. Not easily discouraged. Basic urge to get things done.
Adaptable. Adjusts rapidly to changing conditions. Copes with the unexpected.
Analysis & Judgement---Critical observer. Breaks problems into components; weighs and relates; arrives at sound conclusions.
11. I 12. Breadth of Knowledge---Range of interests. Use of information
and concepts from other related fields.
Developes competent successors and replacements.
14. Human Relations Skill--Ability to motivate people and get them to work together.
15. Intellectual Ability---Ability to solve problems, adapt to new situations, analyze.
16. Personal Characteristics The total of temperament characteristics
bearing on job functioning.
a Walther, 13()2, 102-103.
13. Developing Others

29. Verbal Facility
30. Vision
168
POSITION QUALIFICATIONS (Cont'd.)
17. Position Performance---1-10w well the individual carries out
the duties of present job.
18. Self-Confidence Assured bearing. Inner security.
Self-reliant. Takes new developments
in stride.
19. Self-Control Calm and poised under pressure.
20. Technical Knowledge The knowledge of functional skills
needed to carry out position
requirements.
21. Initiative Self-starting. Prompt to take hold
of a problem. Sees and acts on new
opportunities.
22. Leadership Receives loyalty and cooperation
from others. Manages and motivates
others to full effectiveness.
23. Motivation Has well planned goals. Willingly
assumes greater responsibilities. Realistically ambitious.
24. Objectivity Has an open mind. Keeps emotional
or personal interests from influencing decisions.
25. Planning Looking ahead. Developing programs
and work schedules.
26. Quality Accuracy and thoroughness. High
standards.
27. Sensitivity Has a "feel" for people; recognizes
their problems. Quick to pick up
"the way the wind is blowingTM. Is
considerate of others.
28. Socialness Makes friends easily. Works "comfortably" with others; has sincere interest in people.
Articulate. Communicative - generally
understood by persons at all levels.
Has foresight; sees new opportunities.
Appreciates, but not bound by tradition or custom.
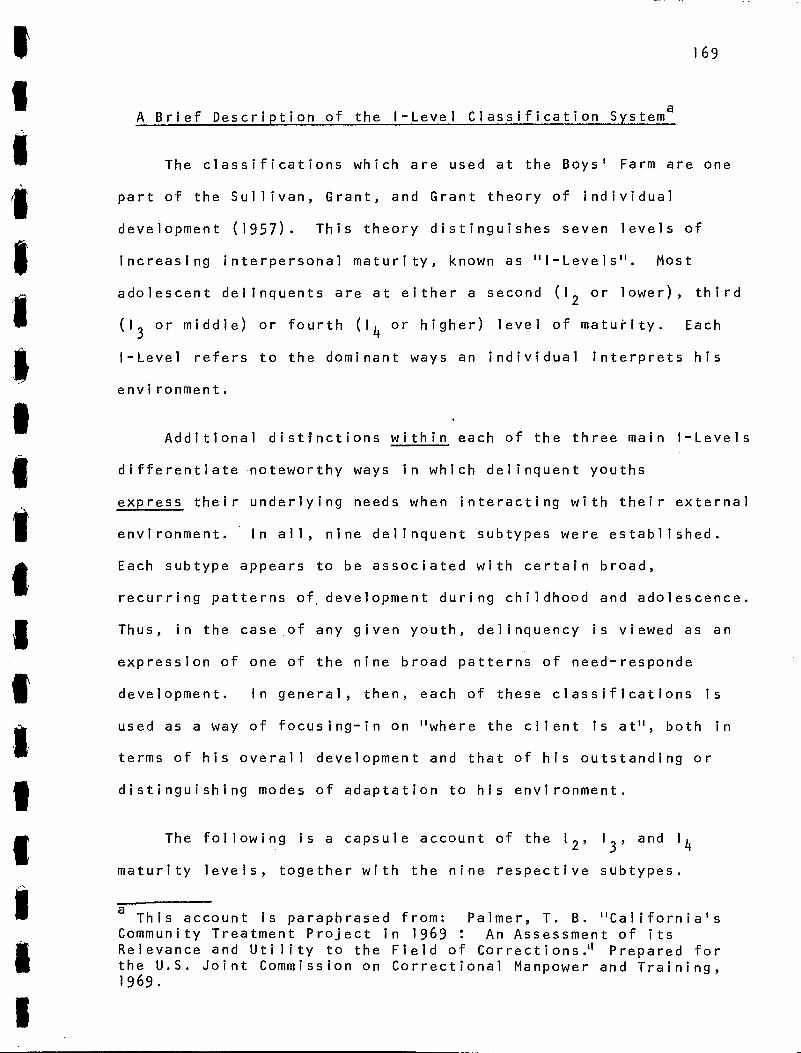
169
A Brief Description of the 1-Level Classification System a
The classifications which are used at the Boys' Farm are one
part of the Sullivan, Grant, and Grant theory of individual
development (1957). This theory distinguishes seven levels of
increasing interpersonal maturity, known as "1-Levels". Most
adolescent delinquents are at either a second (1 2 or lower), third
(13 or middle) or fourth (I
4 or higher) level of matui-ity. Each
1-Level refers to the dominant ways an individual interprets his
envi ronment.
Additional distinctions within each of the three main 1-Levels
differentiate noteworthy ways in which delinquent youths
express their underlying needs when interacting with their external
environment. In all, nine delinquent subtypes were established.
Each subtype appears to be associated with certain broad,
recurring patterns of development during childhood and adolescence.
Thus, in the case of any given youth, delinquency is viewed as an•
expression of one of the nine broad patterns of need-responde
development. In general, then, each of these classifications is
used as a way of focusing-in on "where the client is at", both in
terms of his overall development and that of his outstanding or
distinguishing modes of adaptation to his environment.
The following is a capsule account of the 1 2 , 1 3 , and 1 4
maturity levels, together with the nine respective subtypes.
a This account is paraphrased from: Palmer, T. B. "California's
Community Treatment Project in 1969 : An Assessment of its Relevance and Utility to the Field of Corrections. d Prepared for the U.S. Joint Commission on Correctional Manpower and Training, 1969.

• 17 0
Maturity Level Two (1 2 ): An individual whose overall devel-
opment has not progressed beyond this level views events and
objects primarily as sources of short-term pleasure or else
frustration. He distinguishes among individuals largely in terms
of whether they give or withhold, he has little conception of
interpersonal refinement beyond this. He has a very low level of
frustration -- tolerance together with a poor capacity to under-
stand many of the basic reasons for the behavior or attitudes of
others toward him. The delinquent subtypes are:
1. Asocial, Aggressive (Aa) - often responds with active
demands, open resistance, "malicious mischief", or verbal and
physical aggression when frustrated by others.
2. Asocial, Passive (Ap) - often responds with passive
resistance, complaining, pouting, or marked withdrawal when
frustrated by others.
I
Maturity Level Three (I3): More than the 1 2 an 1
3 individual ig '
IIrecognizes that aspects of his behavior have a good deal to do with
whether or not he will get what he wants from others. An 1 youth 3
interacts primarily in terms of oversimplified rules and formulas. It
He only dimly understands the feelings and motives of other
individuals. More often than the 1 4 he assumes that peers and
'
II adults operate on a rule-oriented or intimidation/manipulation
I/ ("power") basis. The delinquent subtypes are:
1. Immature Conformist (Cfm) - usually fears and responds
with strong compliance and occasional passive resistance to peers
and adults whom he thinks have "the power" at the moment. He sees

171
himself as deficient in social "know how", and usually expects
rejection.
2. Cultural Conformist (Cfc) - likes to think of himself as
delinquent and tough. He typically responds with conformity to
delinquent peers or to a specific reference group.
3. Manipulator (Mp) - often attempts to undermine or
circumvent the power of authority figures, and/or usurp the power
role for himself. He typically does not wish to conform to peers
or adults.
Maturity Level Four (1 4 ): More than the 13
, an 1 4 individual
has internalized one or more sets of standards in terms of which
he frequently attempts to judge the behavior and attitudes of
himself as well as others. He recognizes the interpersonal
interactions in which individuals attempt to influence one another
by means other than promises of monetary reward, compliance,
manipulation, etc. He shows moderate to much ability to understand
underlying reasons for behavior and has some ability to respond
to complex expectations of others on a moderately long-term basis.
The delinquent subtypes are:
1. Neurotic, Acting-Out (Na) - often makes active attempts
to deny and distract himself as well as others from his conscious
feelings of inadequacy, rejection, or self-condemnation. He
sometimes does this by verbally attacking others or by "gaming"
and conning.

172
2. Neurotic Anxious (Nx) - frequently manifests various
symptoms of emotional disturbance -- psychosomatic complaints,
etc. -- which result from conflicts produced by feelings of failure, ,
e
3. Situational-Emotional Reaction (Se) - responds to
immediate family, social, or personal crisis by acting-out --
although his childhood and pre-adolescent development seem fairly
normal in most respects.
4. Cultural Identifier (Ci) - expresses his identification
with an anti-middle class or with a non-middle class value system
by occasionally acting-out his delinquent bel iefs and/or by
"living-out" in commonly unacceptable ways. Often sees himself
as competent and, sometimes, as a leader among peers.
These subtype classifications have undergone continuous
operational and conceptual refinement since 1961. While many
CTP youths show few changes in I-Level over a period of years,
change from one level to the next higher level is not at all rare
— at least among I2
1 s and I3
1 s. The treatment plan and overall
operation must be flexible enough to reflect changes and growth
which take place among youths — in I-Level and otherwise — while
in the program.
inadequacy, or conscious guilt.

173
Research Interview Protocol a
SYC Research Project
1. What basic goals, and what kind of intermediate or secondary goals, do You set for yourself when working with youngsters?
2. What Boys' Farm policies, practices, and modes of organiza-
tion are you most satisfied with - in that they seem to facilitate your work and the achievement of your goals - and which ones you are the most dissatisfied with - in that they seem to interfere with your work and the achievement of your goals?
3. What policies and procedures of your unit facilitate your work and which ones hinder the achievement of your goals?
4. I would like you to think of the best and worst supervisors
you have ever had or known. Would you briefly describe what these individuals were like and also tell me why you think one was the best and the other the worst?
5. (a) What would you say a youngster does and does not have a right to expect from you?
(h) How about the community - police, probation, and so on - what does it have and not have a right to expect from you?
6. What do you regard as the most crucial factors contributing to the development and persistence of delinquency?
7. What do you regard as the key ingredient(s) involved in bringing about a youngster's behavioral or attitudinal change in a positive direction?
8. What are the broad outlines and methods involved in your treatment-approach with most youngsters? That is, what general strategy (or strategies) do you usually prefer to follow, and what basic techniques do you find to be helpful in carrying out this strategy?
9. How is your approach influenced by your work and responsibil-ities to the client group as a whole?
a Palmer, T. Open-Ended Interview Schedule with Parole Agents.
CTP, 1961, 1967. Revisions by M. Reitsma and R. Brill, July, 1976.

174
10. What are the general strategies and methods involved in
your team's treatment approach with most clients?
11. How do you see your approach and methods in relation to
those of the rest of the team?
12. The next two or three questions will try to get at certain differences encountered by nearly everyone who works with
youngsters. The first question is: What kind of youngsters
do you find the easiest to work with? ... Why do you think
they are easiest to wurk with? ... And what basically do you
do or not do with these youngsters - as a result of their
being easier to work with - that you do differently with other
individuals?
13. What kind of youngsters do you find the most difficult to
work with? Again, why do you think this is so? And what basically do you do or not do with these youngsters - as a
result of their being more difficult to work with - that you do differently with other individuals?
14. Are there other groups or types of youngsters whom you have
encountered in your work who seem to require rather definite modifications so far as your general approach or goals are concerned?
15. What qualities and characteristics (personal, educational,
and so forth) do you feel are really essential for doing a
good job as a CCC, CW, Coordinator, Houseparent?
16. I would like you to think of the individual whom you consider the worst CCC, CW, Coordinator you have ever known.
Would you briefly describe that person and tell me why you would say he (or she) was the worst.
Note. As you probably can see, one of the things this interview is working toward involves getting a fairly detailed or well-rounded picture of SYC workers, and of yourself, as a functioning personality. You'll notice that most of the questions thus far - and some of the questions later on - concentrate on how you as an individual relate to your work, on your professional views and approaches, and so on. Now to help me get another kind of perspective on you as an individual and on the experiences of individuals who go into this kind of work, I'm going to ask some questions which have a somewhat different and in some ways more personal focus.

175
17. What aspects of your upbringing, your adolescence, your
academic training, and so on, do you see as contributing to
your work as a helping person? Would you share a little
about your upbringing, your childhood and adolescence?
The themes? The issues?
18. In what main ways would you compare or contrast your own adolescence to that of the youngsters you usually work with? The second part of this question is: Do you think some of these similarities and/or differences (that you mentioned) have influenced the way you work with these individuals - the approaches you use or the goals that you work toward?
19. How or why did you enter this type of work? What are the main satisfactions you find in your work? What are the main dissatisfactions?
20. What do you consider to be the chief factor - professional, personal, or otherwise - that limits you in your work, so far as your goals with youngsters are concerned? And how do you see this as actually influencing the work that you do?
21. What do you feel was the most difficult treatment-decision you ever had to make, and what was it that made that decision especially difficult?
22. What do you feel was the poorest treatment-decision you ever made - or theone that you regretted most later on - and how did it come about?
Note. Now the tone will be on some broader ideas and goals.
23. Professionally, what plans or goals do you have for the future?
24. In the years that you've been a CCC, Social Worker, CW, Coordinator, do you feel that you as a person have changed in ways that you might not have changed if you had not been a CCW, CW, Social Worker, or Coordinator?
25. If you were head of the Ministry of Social Services, what overall changes would you want to see brought about as far as the services for delinquents was concerned? Just as an example, could you rough-out the type of long-range plans and/or perhaps the kind of immediate plans and priorities that you might think most seriously of trying to establish?
26. What are the needs and wants of most youth, and generally, how do you feel society, parents, community, satisfy the wants and needs of most youngsters?

176
Scale Items Used to Assess SYC Workers' Personality Characteristics and Professional Orientationsa
1. Socially desirable qualities
- pleasant (VS unpleasant) - friendly (VS unfriendly) - affected (VS unaffected) - patient (VS impatient) - interesting (VS uninteresting) - self-confident (VS lacking in self-confidence) - resourceful (VS helpless) - sensitive (VS misses meanings) - feels comfortable with youngsters (VS feels ill at ease)
2. Attributes most adolescents like
- has sense or humor (VS humorless) - has "been around" (VS rather sheltered) - enthusiastic (VS bored) - quick, sharp mentality (VS intelligent but cautious, more
roundabout) - understanding of youths' wortd; can talk their language; is
"up" on things (VS is not) - enjoys youths' activities (hobbies, sports, etc.) (VS not
very interested in them)
3. Quick, sharp mentality
- inquisitive (VS uninquisitive) - conceptually original (VS unoriginal, imitative) - intelligent - intellectually flexible (VS intellectually rigid) - has a broad perspective (VS does not)
4. Boldness •
- outspoken (VS reticent to express his views) - direct (VS indirect) - would "shoot the works" if he felt it necessary
5. Forcefulness
- overdramatizes (VS underplays) - conveys quaLity of force, ardour (VS passive, lethargic) - conveys sense of haste, urgency, impatience (VS ease,
leisure, calm) - typically makes relative or qualified statements (VS
absolute or unconditional statements) - displays emotional ups and downs (VS stability of moods) - rapid pace of speech (VS slow pace of speech)
a Paimer, T., and Howard, G. Items of the Rating Inventory for
the Selection and Matching of Treatment Personnel. CTP, 1968, 1972. Revisions by M. Reitsma and R. Brill, July, 1976, and were discussed with and approved by Palmer, October 18, 1977.

177
6. Socially undesirable qualities
- stubborn (VS pliable) - pleasant (VS unpleasant) - modest (VS immodest) - tactful (VS tactless) - has a temper (VS does not) - patient (VS impatient)
7. Covert/overt aggression
- friendly (VS unfriendly) - competitive (VS non-competitive) - aggressive (VS is not) - "asks for" submission from others (VS does not) - "asks for" conflict from others (VS does not)
- manipulates youths/clients (VS does not) - deprives youths/clients of things they want (VS does not) - vindictive, retaliative in relations with youths/clients
(VS is not) - threatening (VS non-threatening)
8. Past personal difficulties
- sees self as having overcome much personal struggle, conflict (VS not much)
- sees self as having gone through much personal struggle, conflict (VS not much)
9. Present personal troubles
- frightened (VS is not) - feels anxiety about his own life (VS does not) - self-depreciating (VS is not)
10. Moralistic orientation a
- has moralistic approach to job (VS pragmatic, expedient approach)
- wants to protect youths/clients against society (VS protect sociéty against youths/clients)
- views his role as: Policeman - rater's view of role: Policeman
11. Satisfaction with work
- enjoys his work (VS does not) - satisfied with his work (VS frustrated) - feels his work is or can be of value (VS disillusioned
with its value)
a Omitted item re Effect of Religious Beliefs due to insufficient
evidence base for a rating.
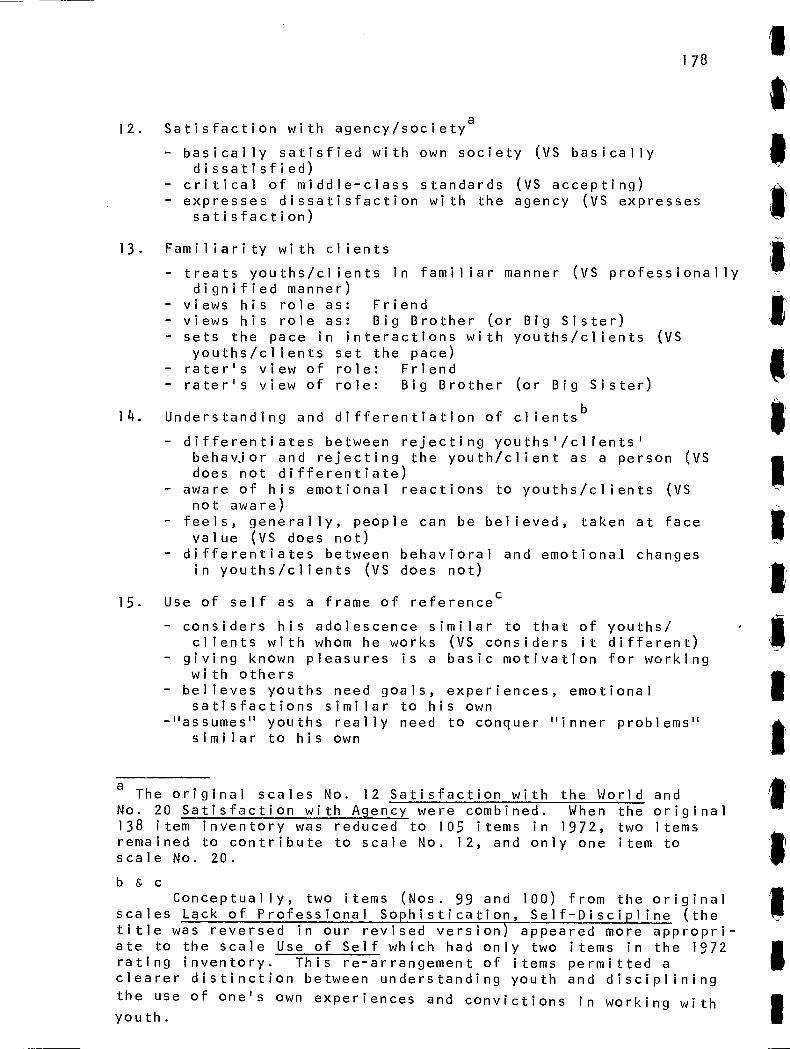
178
12. Satisfaction with agency/society a
- basically satisfied with own society (VS basically dissatisfied)
- critical of middle-class standards (VS accepting) - expresses dissatisfaction with the agency (VS expresses
satisfaction)
13. Familiarity with clients
- treats youths/clients in familiar manner (VS professionally dignified manner)
- views his role as: Friend - views his role as: Big Brother (or Big Sister) - sets the pace in interactions with youths/clients (VS
youths/clients set the pace) - rater's view of role: Friend - rater's view of role: Big Brother (or Big Sister)
14. Understanding and differentiation of clientsb
- differentiates between rejecting youths'/clients' behavjor and rejecting the youth/client as a person (VS does not differentiate)
- aware of his emotional reactions to youths/clients (VS not aware)
- feels, generally, people can be believed, taken at face value (VS does not)
- differentiates between behavioral and emotional changes in youths/clients (VS does not)
15. Use of self as a frame of reference c
- considers his adolescence similar to that of youths/ clients with whom he works (VS considers it different)
- giving known pleasures is a basic motivation for working with others
- believes youths need goals, experiences, emotional satisfactions similar to his own
-" assumes" youths really need to conquer "inner problems" similar to his own
a The original scales No. 12 Satisfaction with the World and
No. 20 Satisfaction with Agency were combined. When the original 138 item inventory was reduced to 105 items in 1972, two items remained to contribute to scale No 12, and only one item to scale No. 20.
b c Conceptually, two items (Nos. 99 and 100) from the original
scales Lack of Professional Sophistication, Self-Discipline (the title was reversed in our revised version) appeared more appropri-ate to the scale Use of Self which had only two items in the 1972 rating inventory. This re-arrangement of items permitted a clearer distinction between understanding youth and disciplining the use of one's own experiences and convictions in working with youth.

179
16. Concern with atmosphere
- explains why things are done or not done (VS does not) - has concern for creating proper atmosphere for the
relationship - tries to build youths'/clients' trust in himself/herself
- believes in importance of "confidentiality" (as a
significant factor in treatment or change) - accepts youths' feelings - believes in importance of "consistency" (as a significant
factor in treatment or change)
17. Concern with negative feelings
- believes in importance of working with anger (as a significant factor in treatment or change)
- believes it is crucial to work with "guilt" in treatment
- believes it is crucial to work with "aggression" in treatment
- believes it is crucial to work with "sex" in treatment
- "Contempt": Explicitly verbalizes, or otherwise manifests concern with, theme/concept of "contempt"
- "Defiance": Explicitly verbalizes, or otherwise manifests concern with, theme /concept of "defiance"
18. Inner Focus
- focuses upon youths/clients doing things (VS upon thinking about things)
- believes in importance of working with "anxiety" (as a
crucial factor in treatment or change)
- tries to clarify youth's striving§ and needs; increase self-
understanding. - tries to work with inner, emotional needs or desires
- believes in importance of building youths' self-confidence
(as a significant factor in treatment or change)
- tries to develop strong dependency relationships
lg. Firmness and final ity
- exacting (VS easy-going) - has tolerance for ambiguity (VS demands certainty)
- touch-minded (VS tender-minded)
- strict (VS lenient)
20. Orientation toward change and activity
- interested in adventure and excitement
- interested in security - prefers to move slowly with youths/clients (VS prefers to
move quickly) - focuses upon youths/clients doing things (VS upon thinking
about things) - important for him to feel youths/clients improve (VS not
important) - resigned to agency working conditions (VS trying to change
working conditions) - expects rapid, major (relatively permanent) changes in
youths in connection with treatment

1 No. 3.
180
20. Orientation (Cont'd.)
- believes in importance of "time" in developing a desirable
working relationshipa
21. Concern with authority and controls
- uses his authority with youths/clients (VS does not)
- tells youths/clients what to do and what not to do (VS does
not) - concerned with youths/clients as individuals (VS concerned
with laws and rules)
- "Obedience": explicitly verbalizes, or otherwise manifests
concern with, theme/concept of "obedience"
- "Punishing": explicitly verbalizes,or otherwise manifests concern with, theme/concept of "punishing"
a The original scale No. 13, Personal Involvement with
Youngsters, had only two items7-177777-177TD-7777737-7ontributed to the Moral Orientation scale. The remaining item (No. 52),
"Important for him to feel youth is improving" fitted into the Orientation toward change and activity. Therefore, we dropped original scale

181
DESCRIPTION OF STAFF INTERVENTION SUBSCALES
WORK WITH INDIVIDUALS
This section includes nine categories: knowledge, relationships, motivation, individualization, support, values, justice, indifference, and autonomy.
(1) Knowledge means the worker knows the problems and capabilities of the clients and he/she is aware of the effect of his/her interventions on the clients. This dimension also relates to the worker's ability to trans-mit this knowledge to other workers via clinical reports, unit logs, clinical files, etc. (10 items)
(2) Relationships. The worker is engaged in quality inter-personal relationships with the youth. He/she gets along well with the youths, is loved and respected by them, and can communicate easily with them,(10 items)
(3) Motivation. The worker is able to get the youths to pursue and to reach their goals. "Motivation" consists in convincing the youth to engage ina process that will lead him/her to real changes. This assumes that the worker trusts in the capabilities of the youths to change. (7 items)
(4) Individualization. The worker gives goals to the youths that are adapted to their levels of development, their capabilities, their interests and their problems. (5 items)
(5) Support. This includes the help and assistance of the worker who advises and directs the youth in his/her efforts to change. Furthermore, support means the worker's interventions are given at the right moment, answers the needs of the clients concerned, and produces the results hoped for. (9 items)
(6) Values. The worker approves and encourages the boys and girls who behave well, and who show progress toward their goals. (3 items)

(7) Justice. The "fair" worker is even-handed toward the
inappropriate behavior of the youths and establishes
consequences for inappropriate behavior. (6 items)
(8) Indifference. The behavior of the worker shows excessive tolerance towards unacceptable conduct. (3 items)
(9) Autonomy. The worker's interventions favour initiative,
autonomy, and independence in the youths. The staff
member lets the clients decide for themselves as often as possible and does not assist them when he/she feels they can overcome difficulties on their own. (9 items)
WORK WITH THE LIVING ENVIRONMENT
There are six scales that apply to community,
group home and cottage workers: work with the client and
his/her group, authority, free time activities, responsibilities, punctuality, and team work. Group meetings and child care needs are the two scales that apply more to residential workers in the group home and cottage units.
(10) Work with the Client and His/Her Group. The worker contributes to creating harmonious relationships among the youth in his/her living environment. He/she helps the youth to integrate into a group and get along with friends. He/she mediates conflicts and motivates the boys and girls to become more interdependent with one another and their friends. (7 items)
(11) Authority. The youths obey this worker. He/she can keep control of the situation during shifts, outings, etc.
(7 items)
(12) Free Time Activities. During evenings or weekends the worker organizes special activities. Secondly, he/she integrates these activities into the treatment goals of the youths. (4 items)
182

1 83
(13) Responsibilities. The worker gives responsibilities to the youths who can handl? them, and he/she helps them in exercising their responsibilities. (3 items)
(14) Punctuality. The worker is on time when attendance is required. (1 item)
(15) Team Work. The worker shares his/her skills, knowledge, suggestions and experience with the team. He/she supports the team process and helps to focus on the goals. (8 items)
(16) Group Meetings. The staff member directs and participates in group meetings in a valuable way. (2 items)
(17) Child Care Needs. The staff member organizes meals, wake- ups, and bedtimes well, and uses these times in a treatment-relevant way. (3 items)
a
1 I.
I
Appendix 2
Characteristics of
SYC Staff : Initial Measurement — March e 1976 (T1)
184
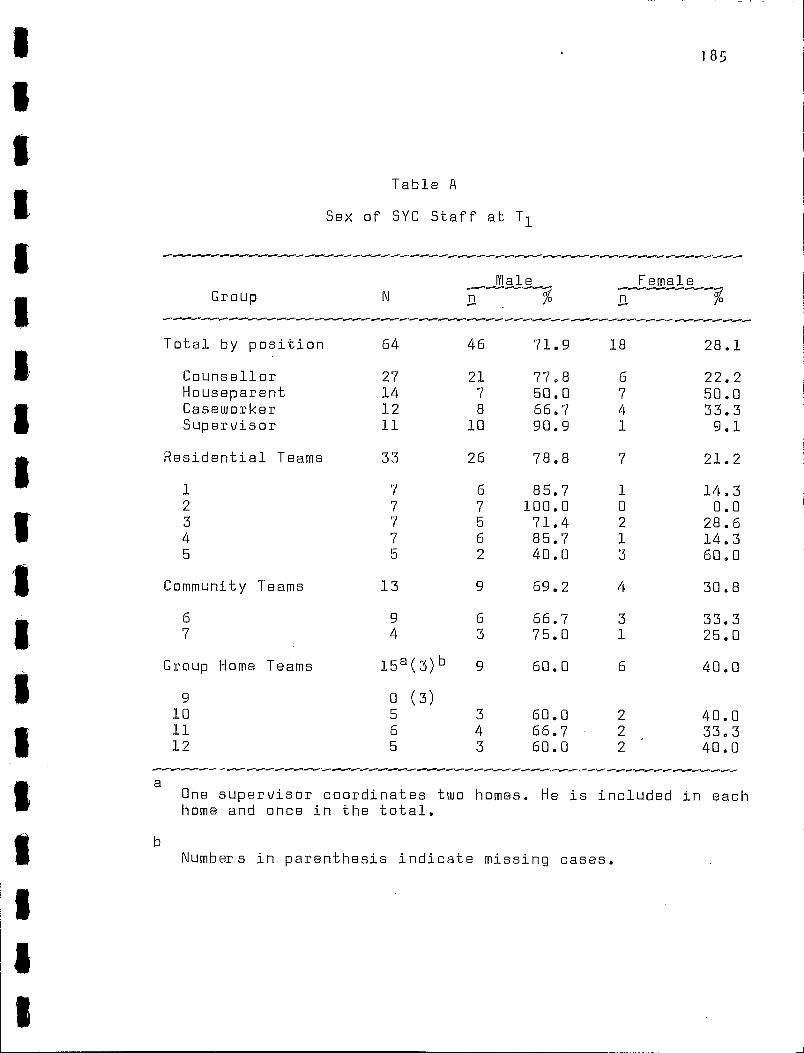
Table A
Sex of SYC Staff at T i
1 85
male Female Group N n
Total by position 64 46 71.9 18 28.1
Counsellor 27 21 77.8 6 22.2 Houseparent 14 7 50.0 7 50.0 Caseworker 12 8 66.7 4 33.3 Supervisor 11 10 90.9 1 9.1
Residential Teams 33 26 • 78.8 7 21.2
1 7 6 85.7 1 14.3 2 7 7 100.0 0 0.0 3 7 5 71.4 2 28.6 4 7 6 85.7 1 14.3 5 5 2 40.0 3 60.0
Community Teams 13 9 69.2 4 30.8
6 9 6 66.7 3 33.3
7 4 3 75.0 1 25.0
Group Home Teams 15 a (3)b 9 60.0 6 40.0
9 0 (3)
10 5 3 60.0 2 40.0
11 6 4 66.7 2 33.3
19 5 3 60.0 2 ' 40.0
a One supervisor coordinates two homes. He is included in each home and once in the total.
Numbers in parenthesis indicate missing cases.

186
I
Table 8
Marital Status of SYC Staff at T 1
1/
Single Married _U-5-S145.9-D:e II % A Group
Total by position 64 24 37.5 36 56.3 4 6.3
Counsellor 27 12 44.4 13 48.1 2 7.4 Houseparent 14 2 14.3 12 85.7 0 0.0 Caseworker 12 7 58.3 3 25.0 2 16.7 Supervisor 11 3 27.3 8 72.7 0 0.0
Residential Teams 33 14 42.4 16 48.5 3 9,1
1 7 2 28.6 5 71.4 0 0.0 2 7 2 28.6 4 57.1 1 14.3 3 7 3 42.9 4 57.1 0 0.0 4 7 4 57.1 2 28.6 1 14.3 5 5 3 60.0 1 20.0 1 20.0
Community Teams 13 7 53.8 5 38.5 1 7.7
6 9 6 66.7 2 22.2 1 11.1 7 4 1 25.0 3 75.0 0 0.0
Group Home Teams 158 (3P 2 13.3 13 86.7 0 0.0
9 0(3) 10 5 0 0 5 100.0 0 0.0 11 6 2 33.3 4 66.7 0 0.0 12 5 0 0 5 100.0 0 0.0
a One supervisor coordinates two homes, He is included in each home and once in the total.
b Numbers in parenthesis indicate missing cases.
I I

187
Table C
Age in Years of SYC Staff at T 1
------------ Standard
Group N Mean deviation
Total by position 64 30.2 8.23
Counsellor 27 29.4 8.01 Houseparent 14 29.8 10.58 Caseworker 12 30.2 5.31 Supervisor 11 32.6 8.67
Residential -reàms 33 30.1 7,68
1 7 29.9 9.97 2 7 32.7 10.45 3 7 30.4 6.02 4 7 27.3 6.23 5 5 30.4 4.56
Community Teams 13 29.0 7.35
6 7
Group Homes Teams
9 28.3 8.37 4 30.5 5.06
15a(3)b 28.8 8.34
9 0(3) 10 5 25.6 7.02 11 6 35.8 7.14 12 5 26.6 9.76
a One supervisor coordinates two homes. He is included in each home and once in the total.
Numbers in parenthesis indicate missing cases.

188
Table D
Previous Employment of SYC Staff at T 1
Previously Not Previously Emaloy,ed Emeoyed
Group 71-
Total by position 64 48 75.0 16 25.0
Counsellor 27 21 77.8 6 22.2 Houseparent 14 a 57.1 6 42.9 Caseworker 12 10 83.3 2 16.7 Supervisor 11 9 81.8 2 18.5
Residential Teams 33 26 78.8 7 21.2
1 7 5 71.4 2 28.6 2 7 6 85.7 1 14.3 3 7 5 71.4 2 28.6 4 7 5 71.4 0 , 28.6 5 5 5 100.0 0 0.0
Community Teams 13 10 76.9 3 23.1
6 7
Group Home Teams
9 7 77.8 2 22.2 4 3 75.0 1 25.0
15 8 (3) b 9 60.0 6 40.0
9 0(3) 10 5 3 60.0 2 40.0 11 6 4 66.7 2 33.3 12 5 3 60.0 2 40.0
a One supervisor coordinates two homes. He is.included in each home and once in the total. •
b Numbers in parenthesis indicate missing cases.

Table E
Previous Related Employment of SYC Staff at T 1
--------------------------------------------------------------- Related Non-Related
Emaloyment Group N .,0
189
Total by position 48 28 58.3 20 41.7
Counsellor 21 13 61.9 8 38.1 Houseparent 8 3 37.5 5 62.5 Caseworker 10 6 60.0 4 40.0 Supervisor 9 6 66.7 3 33.3
Residential Teams 26 16 61.5 10 38.5
1 5 3 60.0 2 40.0 2 6 2 33.3 4 66.7 3 5 4 80.0 1 20.0 4 5 2 40.0 3 60.0 5 5 5 100.0 0 0.0
Community Teams 10 7 70.0 3 30.0
6 7 4 571 3 42.9 7 3 3 100.0 0 0.0
Group Home Teams 9 8( 3 )b 5 55.6 4 44.4
9 0(3) 10 3 3 100.0 0 0.0 11 4 2 50.0 2 50.0 12 3 1 33.3 2 66.7
a One supervisor coordinates two homes. He is included in each home and once in the total.
Numbers in parenthesis indicate missing cases.
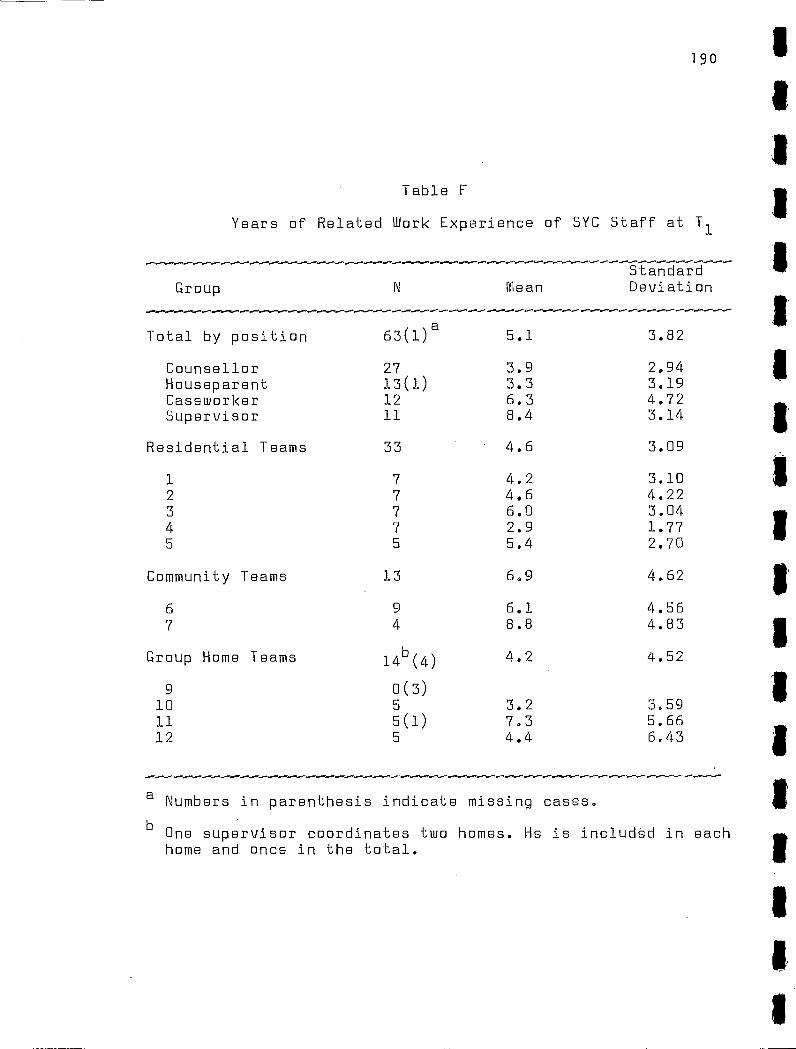
.•••••
Standard Mean Deviation Group
Total by position
Counsellor Houseparent Caseworker Supervisor
Residential Teams
Table F
Years of Related Work Experience of SYC Staff at T 1
19 0
63(1) a 5.1 3.82
27 3.9 2.94 13(1) 3.3 3.19 12 6.3 4.72 11 8.4 3.14
33 4.6 3.09
1 7 4.2 3.10 2 7 4.6 4.22 3 7 6.0 3.04 4 7 2.9 1.77 5 5 5.4 2.70
Community Teams 13 6.9 4.62
6 9 6.1 4.56
7 4 8.8 4.83
Group Home Teams 14b(4) 4.2 4.52
9 0(3)
10 5 3.2 3.59
11 5(1) 7.3 5.66
12 5 4.4 6.43
a Numbers in parenthesis indicate missing cases.
b One supervisor coordinates two homes. He is included in each home and once in the total.

Table G
Educational Qualifications of SYC Staff at T1
19 1
Group
No Diploma . Under or De .aree CEGEP Graduate Graduate Other
N n Yo- D D n n
Total by position 64 11 17.2 59 29.7 21 32.8 6 9.4 7 10.9
Counsellor 27 8 29.6 8 29.6 9 33.3 0 0.0 2 7.4 Houseparent 14 3 21.4 5 35.7 4 28.6 0 0.0 2 14.3 Caseworker 12 0 0.0 2 16.7 6 50.0 2 16.7 2 16.7 Supervisor 11 0 0.0 4 36.4 2 18.2 4 36.4 1 9.1
Residential Teams 33 8 24.2 10 30.3 12 36.4 1 3.0 2 6.1
7 3 42.9 3 42.9 1 14.2 0 0.0 0 0.0 2 7 2 28.6 2 28.6 3 42.9 0 0.0 0 0.0 3 7 2 28.6 4 57.1 1 14.3 0 0.0 0 0.0 4 7 1 14.3 1 14.3 5 71.4 0 0.0 0 0.0 5 5 0 0.0 0 0.0 2 40.0 1 20.0 2 40.0
Community Teams 13 0 0.0 2 15.4 4 30.6 5 38.4 2 15.4
6 9 0 0.0 2 22.2 3 33.3 4 44.4 0 0.0 7 4 0 0.0 0 0.0 1 25.0 1 25.0 2 50.0
Group Home Teams 15a (33J2 13.3 6 40.0 5 33.3 0 0.0 2 13.3
9 0(3) 10 5 1 20.0 4 80.0 0 0.0 0 0.0 0 0.0 11 6 1 16.7 2 33.3 1 16.7 0 0.0 2 33.3 12 5 0 0.0 0 0.0 4 80.0 0 0.0 1 20.0
a One supervisor coordinates two homes. He is included in each home an:lance in the total.
13 Numbers in parenthesis indicate missing cases.

Table H
Certification Program of SYC Staff at T i
192
Group No Program CEGEP Undergrad Graduate
N 771 D D 5 n
Total by position 64 46 71.9 9 14.1 6 9.4 3 4.7
Counsellor 27 18 66.7 7 25.9 1 3.7 1 3.7 Houseparent 14 9 64.3 2 14.3 3 21.4 0 0.0 Caseworker 12 10 83.3 0 0.0 1 8.3 1 8.3 Supervisor 11 9 81.8 0 0.0 1 9.1 1 9.1
Residential Teams 33 23 69.7 7 21.2 1 3.0 2 6.1
1 7 2 28.6 3 42.9 1 14.3 1 14.3 2 7 4 57.1 2 28.6 0 0.0 1 14.3 3 7 5 71.4 2 28.6 0 0.0 0 0.0 4 7 7 100.0 0 0.0 0 0.0 0 0.0 5 5 5 100.0 0 0.0 0 0.0 0 0.0
Community Teams 13 11 84.6 0 0.0 1 7.7 1 7.7
6 9 7 77.8 0 0.0 1 11.1 1 11.1 7 4 4 100.0 0 0.0 0 0.0 0 0.0
Group Home Teams 15 a(3P 10 66.7 1 6.7 4 26.7 0 0.0
9 0(3) 10 5 3 60.0 0 0.0 2 40.0 0 0.0 11 6 3 50.0 1 16.7 2 33.3 0 0.0 12 5 5 100.0 0 0.0 0 0.0 0 0.0
a One supervisor coordinates two homes. He is included in each home and once in the total.
b Numbers in parenthesis indicate missing cases.

19 3
Table I
The Participation of SYC Staff at T 1 in Development Courses
During the LastSix Months
Took Couses Did not take Courses Group
Total by position 64 27 42.2 37 57.8
Counsellor 27 4 14.8 23 85.2 Houseparent 14 7 50.0 7 50.0 Caseworker 12 9 75.0 • 3 25.0 Supervisor 11 7 63.6 4 36.4
Residential Teams 33 7 21.2 26 78.8
1 7 2 28.6 5 71.4 2 7 2 28.6 5 71.4 3 7 2 28.6 5 71.4 4 7 1 14.3 6 85.7 5 5 0 0.0 5 100.0
Community Teams 13 10 76.9 3 23.1
6 7
Group Home Teams
9 6 66.7 3 33.3 4 4 100.0 0 0.0
15 8 (3) 13 8 53.3 7 46.7
9 0(3) 10 5 3 60.0 2 40.0 11 6 5 83.3 1 16.7 12 5 1 20.0 4 80.0
a One supervisor coordinates two homes. He is included in each home and once in the total.
b Numbers in parenthesis indicate missing cases.

19 4
In Present Unit Total Time at SYC Mean SD Mean SD
I
1
9 19.7 20.24 43.6 44.83 4 17.8 10.78 35.5 20.64
6 7
Group Home Teams 15 a (3) 13 8.1 6.41 14.7 20.24
Table J
Number of Months Staff Have Worked for SYC at T1
I/
Group
Total by position 64 14.6 13.27 27.6 26.44
Counsellor 27 14.7 12.57 24.3 17.13 Houseparent 14 9.1 8.25 9.4 8.21 Caseworker 12 16.4 17.83 35.9 40.03 Supervisor 11 19.6 13.64 50.0 25.72
Residential Teams 33 14.9 13.31 26.9 20.62
1 7 12.1 4.78 27.3 17.00 2 7 16.9 8.75 24.9 17.81 3 7 25.4 16.22 41.0 26.27 4 7 14.7 17.35 21.6 14.52 5 5 2.0 0.0 17.0 24.75
Community Teams 13 19.1 17.41 41.1 38.15
9 0(3) 10 5 10.8 9.39 16.8 20.89 11 6 7.8 5.34 18.8 26.57 12 5 5.2 1.09 19.0 29.69
a One supervisor coordinates two homes. He is included in each home and once in the total.
Numbers in parenthesis indicate missing cases.

r."
Table K
Work History of SYC Staff at T1
19 5
Group
Previous Previous Units Positions Woryed In Mean SD Mean SD
Total by position 64 .59 .77 .69 .85
Counsellor 27 .33 .48 .63 .69 Houseparent 14 .14 .36 .07 .27 Caseworker 12 .92 .79 .92 1.08 Supervisor 11 1.45 .93 1.36 .92
Residential Teams 33 .51 .67 .76 .83
1 7 .71 .49 1.00 .82 2 7 .29 .76 .57 1.13 3 7 .57 .79 .86 .69 4 7 .71 .76 .71 .76 6 5 .20 .44 .60 .89
Community Teaffis 13 1.08 .95 1.00 1.00
6 9 1.00 1.00 1.11 .96
7 4 1.25 .96 .75 1.05
Group Home Teams 15 ae . 33 .62 .27 .59
9 0(3)
10 5 .20 .45 .20 .45
11 6 .50 .84 .33 .82
12 5 .60 .89 .60 .89
a One supervisor coordinates two homes. He is included in each home and once in the total.
Numbers in parenthesis indicate missing cases.

a One supervisor coordinates two homes. He is included in each home and one in the total. o - Numbers in parenthesis indicate missing cases.
MI OM alle 11110 en Mil 111101 1111111 ill, OM II» OM all, allt 1113
Group Home Teams 1413 (4) 49.2 9.0 53.7 13.5 50.7 5.7 53.6 9.8 52.1 7.8
9 0(3)
10 5 50.2 11.6 52.8 13.2 47.8 5.3 55.8 9.5 56.4 9.8
11 5(1) 50.6 9. 7 48.4 9.2 52.0 6.6 54.0 13.7 48.0 5.7
12 5 49.8 9.3 60.6 15.6 53.4 4.4 47.0 8.3 51.2 5.2 _ .0 aN
Table L
Preference Scores of SYC Staff For Different Treatment Approaches atT i
Accepting Supportive Control Behavior Insight Friend Big Brother Structure Reality Reality
Group N SD SD SD M SD M SD
Total by position 62(2) a 49.8 8.5 51.0 12.16 53.3 8.3 55.8 11.1 54.4 10.2
Counsellor 26(1) 51.2 8.3 52.5 9.8 54.0 6.9 51.8 8.4 55.1 9.5 Houseparent 13(1) 48.3 8.3 53.3 13.9 55.1 10.2 52.1 6.3 48.8 8.8 Caseworker 12 45.8 7.9 42.0 14.6 49.6 7.9 67.3 10.8 57.0 10.4 'Supervisor 11 52.9 9.1 54.7 12.0 53.6 9.4 57.2 13.3 56.6 11.9
Residential Teams 32(1) 51.6 8.2 52.9 10.1 53.9 7.2 52.1 8.1 55.6 9.6
1 7 51.9 10.3 54.3 13.2 54.0 8.3 50.3 8.7 54.1 10.9 2 6(1) 51.8 9.7 52.2 5.2 55.0 5.4 52.5 8.2 56.3 8.6 3 7 51.0 9.7 56.0 14.3 54.6 7.8 49.7 7.9 56.0 11.1 4 7 49.6 4.8 48.7 3.7 53.7 9.4 49.9 7.0 54.6 8.8 5 5 54.6 7.2 53.8 10.7 51.6 5.6 60.4 5.9 57.8 11.8
Community Teams 13 46.8 9.1 44.5 16.5 50.4 8.6 68.3 11.2 57.7 11.4
6 9 49.6 9.0 49.0 11.2 46.4 5.5 68.7 10.7 61.9 10.5 7 4 40.5 6.4 34.5 23.6 59.3 7.8 67.5 14.1 48.3 7.5

a Numbers in parenthesis indicate missing cases.
The supervisor who co-ordinates two homes is counted in each home and once, in the total.
mu am es me se en us MU ere an tug es am me as me ea en ell
Table M
Mean Scores and Frequency Distribution of S.Y.C. Staff on Conceptual Level at T
1
Stage Orientation Group Norm Exploration Indepen,dence
N M Sb N % N % N % ----------------------------„ Total by position 63(1)d 1.99 .38 11 17.5 35 55.6 17 26.9
Counsellor 27 1.87 .31 7 25.9 15 55.6 5 18.5 Homeparent 13(1) 1.86 .39 4 30.8 7 53.8 2 15.4 Caseworker 12 2.21 .31 0 0.0 7 58.3 5 41 • 7 Superviser 11 2.24 .39 0 0.0 6 54.5 5 45.5
Residential teams 1 2 3 4 5
33 1.95 .37 7 21.2 18 54.5 8 24.3
7 1.85 .51 3 42.8 2 28.6 2 28.6
7 1.74 .32 2 28.6 4 57.1 1 14.3
7 2.08 .19 0 0.0 4 57.1 3 42.8
7 1.99 .40 2 28.6 4 57.1 1 14.3
5 2.14 .31 0 0.0 4 80.0 1 20.0
Community Teams 13 2.20 .26 0 0.0 6 46.2 7 53.8 6 9 2.21 .19 0 0.0 4 44.4 5 55.6
. 7 4 2.19 .43 0 0.0 2 50.0 2 50.0
Group e Home Teams 14(4) b 1.98 .45 2 14.3 9 64.3 3 21.4 9 0(3)
10 5 1.89 .41 . 1 20.0 3 60.0 1 20.0 11 5(1) 1.99 .64 1 20.0 3 60.0 1 20.0 12 5 2.05 .24 0 0.0 4 80.0 1 20.0
l-0

198
1
I
Table N
Mean Scores and Frequency Distribution of SYC Staff on the Repression Sensitivation Scale at T1
Group
Distribution Lower_25% Middle_50% lJauer_25%
N M SD n g n D
Total by position 60e 21.9 11.7 15 25.0 34 56.7 11 18.3
26(1 22.8 14.2 6 23.1 15 57.7 5 19.2
12(2) 20.5 9.2 4 33.3 6 50.0 2 16.7
11(1) 21.6 7.4 1 9.1 9 81.8 1 9.1 11 21.3 12.0 4 36.4 4 36.4 3 27.3
Residential Teams 31(2) 21.3 13.9 9 29.1 17 54.8 5 16.1
1 7 17.7 15.1 4 57.1 2 28.6 1 14.3 2 6(1) 18.5 8.5 1 16.7 4 66.7 1 16.7 3 7 20.4 8.3 2 28.6 4 57.1 1 14.3 4 6(1) 33.0 21.3 0 0.0 4 66.7 2 33.3 5 5 17.0 9.1 2 40.0 3 60.0 0 0.0
Community Teams 13 24.6 8.6 1 7.7 9 69.2 3 23.1
6 9 26.3 9.0 1 11.1 6 66.7 2 22.2
7 4 20.8 7.2 0 0.0 3 75.0 1 25.0
Group Home Teams 13b e 23.3 7.5 2 15.4 8 61.5 3 23.1
9 0(3)
10 5 21.4 8.1 1 20.0 4 80.0 0 0.0
11 4(2) 22.0 9.8 1 25.0 2 50.0 1 25.0
12 5 28.4 4.6 0 0.0 2 40.0 3 60.0
a Numbers in parenthesis indicate missing cases.
One supervisor coordinates two homes. He is included in each home and once in the total.
Counsellor Houseparent Caseworker Supervisor
I

Appendix 3
Characteristics of
SYC Staff : Second Measurement — October, 1977 (T2)
199
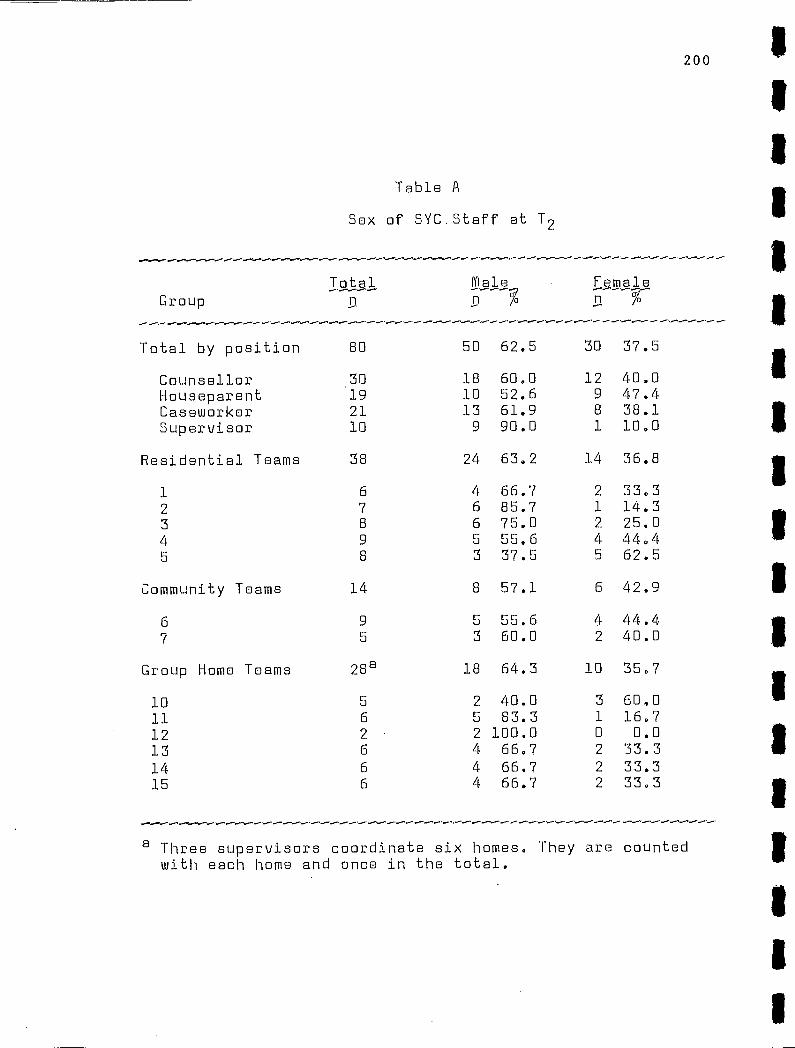
Table A
Sex of SYC.Staff at T 2
----------------------
200
Group Total Male Famale
n n
Total by position 80 50 62.5 30 37.5
Counsellor 30 18 60.0 12 40.0 Houseparent 19 10 52.6 9 47.4 Caseworker 21 13 61.9 8 38.1 Supervisor 10 9 90.0 1 10.0
Residential Teams 38 24 63.2 14 36.8
1 6 4 66.7 2 33.3
2 7 6 85.7 1 14.3 3 a 6 75.0 2 25.0 4 9 5 55.6 4 44.4 5 a 3 37.5 5 62.5
Community Teams 14 8 57.1 6 42.9
6 7
Group Home Teams
9 5 55.6 4 44.4 5 3 60.0 2 40.0
28 a 18 64.3 10 35.7
10 5 2 40.0 3 60.0
11 6 5 83.3 1 16.7 12 2 2 100.0 0 0.0 13 6 4 66.7 2 33.3
14 6 4 66.7 2 33.3 15 6 4 66.7 2 33.3
a Three supervisors coordinate six homes. They are counted with each home and once in the total.

Group
Table B
Marital Status of SYC Staff at T2
Total 5i.ule Married Divorced/SeD %
201
Total by position 80 29 36.2 47 58.7 4 5.0
Counsellor 30 15 50.0 15 50.0 0 0.0 Houseparent 19 6 31.6 12 63.2 1 5.3 Caseworker 21 8 38.1 13 61.9 0 0.0 Supervisor 70 0 0.0 7 70.0 3 30.0
Residential Teams 38 15 39.5 21 55.3 2 5.3
1 6 1 16.7 4 66.7 1 16.7
2 7 4 57.1 2 28.6 1 14.3
3 8 3 37.5 5 62.5 0 0.0
4 9 3 33.3 6 66.7 0 0.0
5 8 5 62.5 3 37.5 0 0.0
Community Teams 14 6 42.9 7 50.0 1 7.1
6 9 4 44.4 4 44.4 1 11.1
7 5 2 40.0 3 60.0 0 0.0
Group Home Teams 28a 7 25.0 20 71.4 1 3.6
10 5 0 0.0 5 100.0 0 0.0
11 6 1 16.7 4 66.7 1 16.7
12 2 0 0.0 2 100.0 0 0.0
13 6 2 33.3 4 66.7 0 0.0
14 6 2 33.3 4 66.7 0 0.0
15 6 2 33.0 4 66.7 0 0.0
a Three supervisors coordinate six homes. They are counted with each home and once in the total.

■•■••••
Group Standard
Mean Deviation
Table C
Age in years of SYC Staff at T 2
202
Total by position 80 31.3 8.13
Counsellor 30 28.7 4.47 Houseparent 19 35.5 13.19 Caseworker 21 30.4 7.03 Supervisor 10 33.4 5.60
Residential Teams 38 28.9 4.35
1 6 27.6 4.58 2 7 30.4 1.72 3 8 28.0 3.59 4 9 28.4 4.16 5 8 29.8 6.65
Community Teams 14 33.0 7.79
6 7
Group homes Teams
9 31.6 35.6
28 a 33,9
7.02 9.26
11.37
10 5 26.2 4.44 11 6 38.7 8.94 12 2 35.5 13.44 13 6 33.7 21.59 14 6 29.8 2.23 15 6 35.3 11.86
■••••
a Three supervisors coordinate six homes. They are counted with each home and once in the total.

Croup
203
Table D
Previous Employment of SYC Staff at T 2
..... ------------ ..... --------- Previously Nat Previously
Total Employ.ed_ _Employed__ n Yo-
........
Total by position 80 64. 80.0 16 20.0
Counsellor 30 25 83.3 5 16.7 Houseparent 19 18 94.7 1 5.3 Caseworker 21 13 61.9 8 38.1 Supervisor 10 8 80.0 2 20.0
Residential Teams 38 31 81.6 18.4
1 6 5 83.3 1 16.7 2 7 7 100.0 0 0.0 3 8 5 62.5 3 37.5 4 9 8 88.9 1 11.1 5 8 6 75.0 2 25.0
Community Teams 14 8 57.1 6 42.9
6 9 5 55.6 4 44.4 7 5 3 60.0 2 40.0
Croup homes Teams 28 a 25 89.3 3 10.7
10 5 4 80.0 1 20.0 11 6 5 83.3 1 16.7 12 2 2 100.0 0 0.0 13 6 6 100.0 0 0.0 14 6 6 100.0 0 0.0 15 6 5 83.3 1 16.7
a Three supervisors coordinate six homes. They are counted with each home and once in the total.

I/ 204
Table E
Previous Related Employment of SYC Staff at 1 2
1/ Related Non-Related
Total Employment Employment . . Group n %-
...... .....
Total by position 65 39 60.0 26 40.0 11
Counsellor 25 17 68.0 8 32.0 Houseparent 19 5 26.3 14 73.7
11 Caseworker 13 10 76.9 3 23,1 Supervisor 8 7 87.5 1 12.5
Residential Teams 31 22 71.0 9 29.0 11
1 q 3 60.0 2 40.0
2 7 5 71.4 2 28.6 II
3 5 4 80.0 1 20.0
4 8 6 75.0 0
4 25.0
5 6 4 66.7 2 33.3 I/
Community Teams 8 6 75.0 2 25.0
6 5 3 60.0 2 40.0 II
7 3 3 100.0 0 0.0
Group Home Teams 26 11 42.3 15 57.7 11
10 4 2 50.0 2 50.0
11 6 1 16.7 5 83.3 11
12 2 2 100.0 0 0.0
13 6 4 66.7 2 33.3
14 6 3 50 ..0 3 50 0 0
15 5 2 40.0 3 60.0 11
a Three supervisors coordinate six homes, They are counted 11 with each home and once in the total.
11
1

Total by position 80 5.5 3.77
Table F
Years of Related Work Experience of SYC Staff at 1 2
205
Group Standard
a Mean Deviation
Counsellor , 30 4.5 2.59 Houseparent 19 4.3 2.58 Caseworker 21 6.6 • 4.94 Supervisor 10 8.5 4.07
Reeidential Teams 38 4.9 2.54
1 6 4.5 • 1.27 2 7 4.7 2.57 3 8 5.6 3 4.65 4 9 4.7 2.35 5 8 4.9 2.61
Community teams 14 8.8 5.25 6 9 7.5 4.87 7 5 11.3 5.55
Group Home Teams 28a 4.6 3.53 10 5 1.9 .89 11 6 6.6 5.61 12 2 9.8 10.61 13 6 4.1 1.94 14 6 4.9 2.93 15 6 6.1 3.43
a Three supervisiops co-ordinate six homes. Th dy are counted with each home and once in the total.
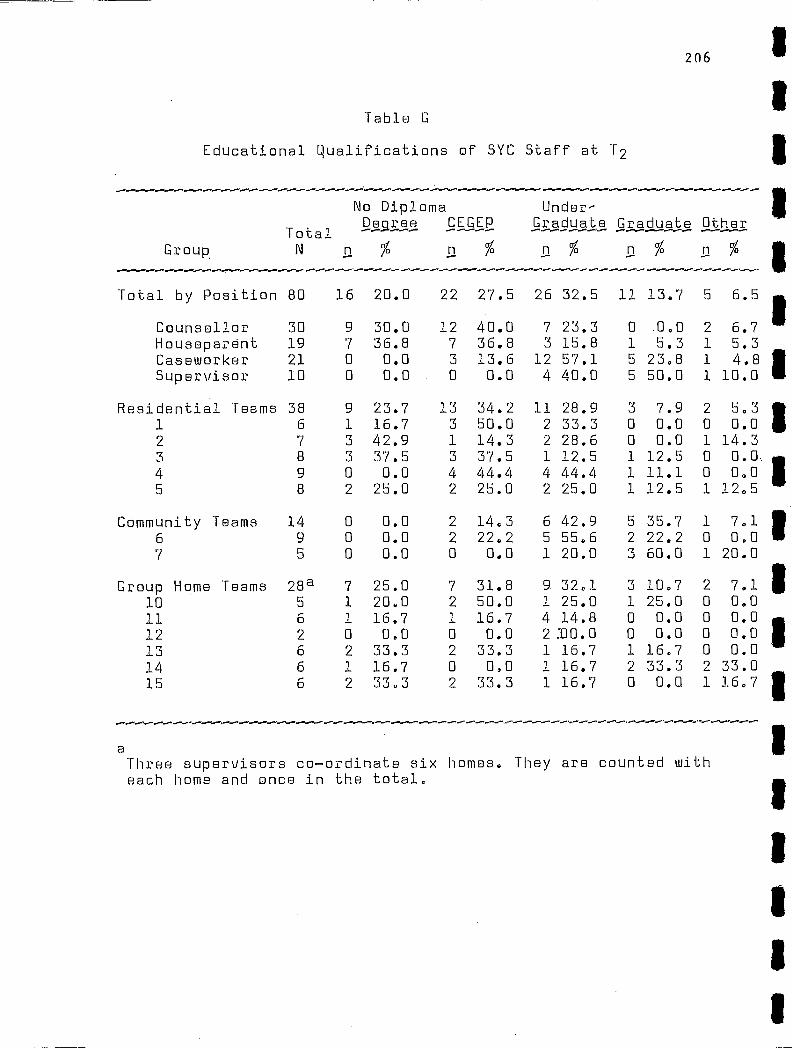
1 1
No Diploma De.uree CEGEP
Total -- --- N n %
11 Graduate Graduate Other
% D % D % -------------- -------
Group %
Under-
206 1
Table
Educational qualifications of SYC Staff at 1 2
Total by Position 80 16 20.0 22 27.5 26 32.5 11 13.7 5 6.5
1 Counsellor Houseparent Caseworker Supervisor
30 9 30.0 12 40.0 7 23.3 19 7 36.8 7 36.8 3 15.8 21 0 0.0 3 13.6 12 57.1 10 0 0.0 0 0.0 4 40.0
0 0.0 2 6.7 1 5.3 1 5.3 5 23.8 1 4.8 II 5 50.0 1 10.0
Residential Teams 38 1 6 2 7 3 8 4 9 5 8
Community Teams 6 7
Group Home Teams 28a 10 5 11 6 12 2 13 6 14 6 15 6
9 23.7 13 34.2 11 28.9
1 16.7 3 50.0 2 33.3
3 42.9 1 14.3 2 28.6
3 37.5 3 37.5 1 12.5 0 0.0 4 44.4 4 44.4
2 25.0 2 25.0 2 25.0
7 25.0 7 31.8 9 32.1
1 20.0 2 50.0 1 25.0
1 16.7 1 16.7 4 14.8 0 0.0 0 0.0 2130.0
2 33.3 2 33.3 1 16.7
1 16.7 0 0.0 1 16.7
2 33.3 2 33.3 1 16.7
37.9 2 5.3 le 0 0.0 0 0.0 0 0.0 1 14.3 1 12.5 0 0.0 1 11.1 0 0.0 II 1 12.5 1 12.5
5 35.7 1 7 0 1 II 2 22.2 0 0.0 3 60.0 1 20.0
3 10.7 2 7 0 1 1 25.0 0 0.0 0 0.0 0 0.0 0 0.0 0 0.0 II 1 16.7 0 0.0 2 33.3 2 33.0 0 0.0 1 16.7 II
14 0 0.0 2 14.3 6 42.9
9 0 0.0 2 22.2 5 55.6
5 0 0.0 0 0.0 1 20.0
a Three supervisors co-ordinate six homes. They are counted with each home and once in the total.
1

Table H
Certification Program of SYC Staff at T 2
207
Group Total No
17-r-ogr,a n r---Ir
CEGEP Undegrad. Graduate -------- -------- n % • n % n %
Total by Position 80 59 73.7 6 7.5 10 12.5 5 6.3
Counsellor 30 19 63.3 3 10.0 7 23.3 1 3.3 Houseparent 19 14 73.7 3 15.8 2 10.5 0 0.0 Caseworker 21 18 85.7 0 0.0 1 4.8 2 9.5 Supervisor 10 8 80.0 0 0.0 0 0.0 2 20.0
Residential Teams 38 26 68.4 3 7.9 7 18.4 2 5.3 1 6 4 66.7 0 0.0 2 33.3 0 0.0 2 7 6 85.7 1 14.3 0 0.0 0 0.0 3 8 4 50.0 2 25.0 2 25.0 0 0.0 4 9 7 77.8 0 0.0 1 11.1 1 11.1 5 8 5 62.5 0 0.0 2 25.0 1 12.5
Community Teams 14 10 71.4 0 0.0 1 7.1 3 21.4 6 9 6 66.7 0 0.0 0 0.0 3 33.3 7 5 4 80.0 0 0.0 1 20.0 0 0.0
Group Home Teams 28a 23 82.1 3 10.7 2 7.1 0 0.0 10 5 3 60.0 1 20.0 1 20.0 0 0.0 11 6 6 100.0 0 0.0 0 0.0 0 0.0 12 2 2 100.0 0 0.0 0 0.0 0 0.0 13 6 4 66.7 1 16.7 1 16.7 0 0.0 14 6 6 100.0 0 0.0 0 0.0 0 0.0 15 6 5 83.3 1 16.7 0 0.0 0 0.0
a Three supervisors co-ordinate six homes. They are counted with each home and once in the total.

Total Took Courses Did_Dot_ e Courses Group
Total by position 80 41 51.3 39 48.7
Table I
The Participation of SYC Staff at T2 in Development Courses Durirvg the Last Six Months
Counsellor 30 14 46.7 16 53.3 Houseparent 19 4 21.1 15 78.9 Caseworker 21 16 76.2 5 28.8 Supervisor 10 7 70.0 3 30.0
Residential Teams 38 18 47.4 20 52.6 1 6 1 16.7
J 63.3 2 7 3 42.9 4 57.1 3 8 6 75.0 2 25.0 4 9 5 55.6 4 44.4 5 8 3 37.5 5 62.5
Community Teams 14 11 78.6 3 21 -.4 6 9 7 77.8 2 22.2 7 5 4 80.0 1 20.4
Group Home Teams 28 a 12 42.9 16 57.1 10 5 2 40.0 3 60.0 11 6 4 66.7 2 33.3 12 2 2 100.0 0 0.0 13 6 1 16.7 5 83.3 14 6 2 33.3 4 66.7 15 6 3 50.0 3 50.0
a Three supervisors co-ordinate six homes. Threy are counted with each home and once in the total.
208

Table J
Number of Months Staff Have Worked for SYC at 12
1.•••••L•••••••••,•••
2 09
Group In_present Unit Total Time at SYC
Mean SD Mean SD
Total by position 80 13.1 13.76 25.5 21.06
Counsellor 30 11.8 10.10 20.6 20.07 Houseparent 19 7.8 6.34 12.5 11.30 Caseworker 21 20.7 20.06 39.8 38.01 Supervisor 10 10.8 12.48 34.6 25.73
Residential Teams 38 10.9 9.50 21.2 18.87 1 6 8.7 8.43 16.2 14.70 2 7 2.6 3.05 10.0 12.78 3 8 18.5 13.67 32.4 22.87 4 9 12.1 8.40 18.8 15.25 5 8 11.1 3.04 26.3 21.72
Community Teams 14 26.2 23.14 51.9 42.23 6 9 56.1 52.60 24.7 25.23 7 5 44.2 12.33 29.0 21.24
Group Home Teams 28a 9.4 7.89 18.0 18.77 10 5 6.8 2.95 8.2 3.03 11 6 14.0 11.59 27.3 32.94 12 2 17.5 10.61 50.2 57.28 13 6 13:3 9.07 19.0 12.62 14 6 5.0 2.37 17.3 12.74 15 6 5.7 5.24 18.7 17.30
a Three supervisors co-ordinate'six homes. They are counted with each home and once in the total.

Group
Table K
Work History of SYC Staff at T 2
Previous Units Worked In Mean SD
Previous Positions Mean- -§D
210
Total by Position
Counsellor Houseparent Caseworker Supervisor
80 .64 .85
30 .30 .47 19 .21 .42 21 1.09 .94 10 1.50 1.08
.79 .89
.60 .77
.47 .51
1.05 1.16
1.40 .84
Residential Teams 38 .50 .73 .74 .86 1 6 .67 1.21 .67 1.21 2 7 .43 .79 .57 .79 3 8 .63 .74 .63 .52 4 9 .33 .50 .56 .73 5 8 .50 .53 1.25 1.04
Community Teams 14 1.43 1.09 1.21 1.25 6 9 1.22 1.20 1.33 1.41
7 5 1.80 .84 1.00 1.00
Group 'Homes Teams 28a .43 .63 .64 .68 10 5 .0 .0 .40 .55 11 6 .83 .75 .67 .82 12 2 1.0 1.41 1.00 1.41 13 6 .67 .89 .83 .75 14 . 6 .33 .52 .83 .75 15 6 .33 .52 .83 .75
a Three supervisors co-ordinate six homes They are counted with each home and once in the total.

Accepting Friend
. (for 1;•-
Supportive Big Brother ForCfm
Control Structure eor MpPfc)
SD
Behaviora1
-11.U.1-4I-X-- içi For Na)
Insight Reality iVor Nx5
SD Group
OM Ili IBM IIIIIII OM Ili ell all MI IBIS ill «I 1111. Ma MD MI all UM all
Table L
Preference Scores of SYC Staff For Different Treatment Apprceches at T2
Total by Position 72(8) a 52.8 8.5 51.6 9.3 53.6 8,2 54.5 11.3 54.5 8.4
24(6). 54.9 7.2 53.2 9.0 55.7 8.1 52.9 7.3 54.4 8.5 18(1) 53.7 8.0 52.9 7.8 50.5 5.9 54.6 5.7 55.0 8.4 21 49.7 9.3 48.1 10.4 52.3 9.1 57.7 1:.9 54.2 8.9 ((1) 52.3 9.7 53.0 9.1 57.3 8.8 51.2 5.7 54.2 8.3
Residential Teams 31(7) 55.2 7.8 53.6 9.5 55.3 7.8 51.6 7.3 54.3 8.9 1 6 54.7 6.1 55.3 7.2 49.3 9.2 57.7 5.9 63.2 9.7 2 0 (7) 3 8 57.9 8.8 56.1 7.2 57.0 4.5 45.8 E.2 53.0 6.7 4 9 55.1 8.2 49.7 10.9 57.7 8.2 47.6 E.4 49.1 4.8
8 52.9 7.9 54.3 11.4 55.3 7.9 57.6 7.0 54.9 9.9
Counselor Houseparent Casewmrker Supervisor
Community Teams 6 1
Group Home Teams 10 11 12 13 14 15
14 50.4 8.9 48.6 10.4 55.0 12.1 58.1 11- .8 52.1 9.0
9 50.6 10.1 48.6 11.7 51.3 12.3 58.9 11.8 55.0 8.8
5 50.0 7.2 48.8 8.8 61.6 9.4 56.9 E. 46.8 7.4
27(1)b 51.2 8.6 50.9 8.2 50.9 5.4 56.0 5.7 55.9 7.5
5 49.0 8.6 51.0 6.6 50.6 4.5 50.8 7.6 56.4 9.8
6 53.0 7.9 50.3 5.9 49.5 8.1 56.0 - .3 60.7 8.7
2 51.0 18.4 45.5 16.3 55.3 6.4 57.5 :-.8 52.0 0.0
5(1) 48.0 7.1 52.6 10.2 51.8 3.5 54.2 5.4 53.6 6.1
6 53.8 8.5 55.8 8.1 49.3 4.0 56.7 7.8 57.0 6.4 6 52.0 10.5 47.3 6.3 54.2 5.0 58.3 7.6 52.0 4.
a The numbers in parathesis indicate missing cases bThree supervisors co-ordinate six homes. They are counted with each home and once the total.

Table M
Mean Scores and Frequency Distribution of S.Y.C. Staff on Conceptual Level at T2
Group Stage Orientation
.11 11rm C.e2lerA.UP.E1 Sb
a
Total by position 71(9) a 1.85 .29 21 29.6 38 53.5 12 16.9 Counsellor 24(6) 1.79 ..32 9 37.5 11 45.8 4 16.7 Houseparent 18(1) 1.72 .23 8 44.4 9 50.0 1 5.6 Caseworker 21 1.93 .26 3 14.3 4 66.7 4 19.0 Supervision 8(2) 2.07 .33 1 12.5 4 50 3 37.5
Residential teams 31(7) 1.84 .34 11 35.5 14 45.2 6 19.4 1 6 1.93 .31 1 16.7 4 66.6 1 16.7 2 0(7) 3 8 1..77 .41 4 50.0 3 37.5 1 12.5 4 9 1.98 .26 2 22.2 4 44.4 3 33.3 5 8 1.69 .32 4 50.0 3 37.5 1 12.5
Community teams 13(1) 1.94 .22 1 7.7 9 69.2 3 23.1 6. 8(1) 1.95 .19 0 0.0 6 75.0 2 25.0
7 5 1.92 .28 1 20.0 7 ,«J 60.0 1 20.0
Group home teams 27(1) b 1.81 .28 9 33.3 15 55.6 3 11.1
10 5 1.73 .23 2 40.0 2 60.0 0 0.0
11 6 1.96 .44 2 33.3 2 33.3 2 33.3
12 2 2.15 .28 0 0:-.0 1 50.0 1 50.0
13 5(1) 1.83 .09 0 0.0 5 100.0 0 0.0
14 6 1.78 .32 3 50.0 2 33.3 1 16.7
15 6 1.78 .19 2 33.3 4 66.7 0 0.0
Number in parentheses indicate missing cases.
Three supervisors co-ordinate six homes; they are counted with each home and once in the total.
N)
N)
11111 111111 en ale 813 •111 MS 11111 11111 al MU 11111 INN MS OS Inn 11M1
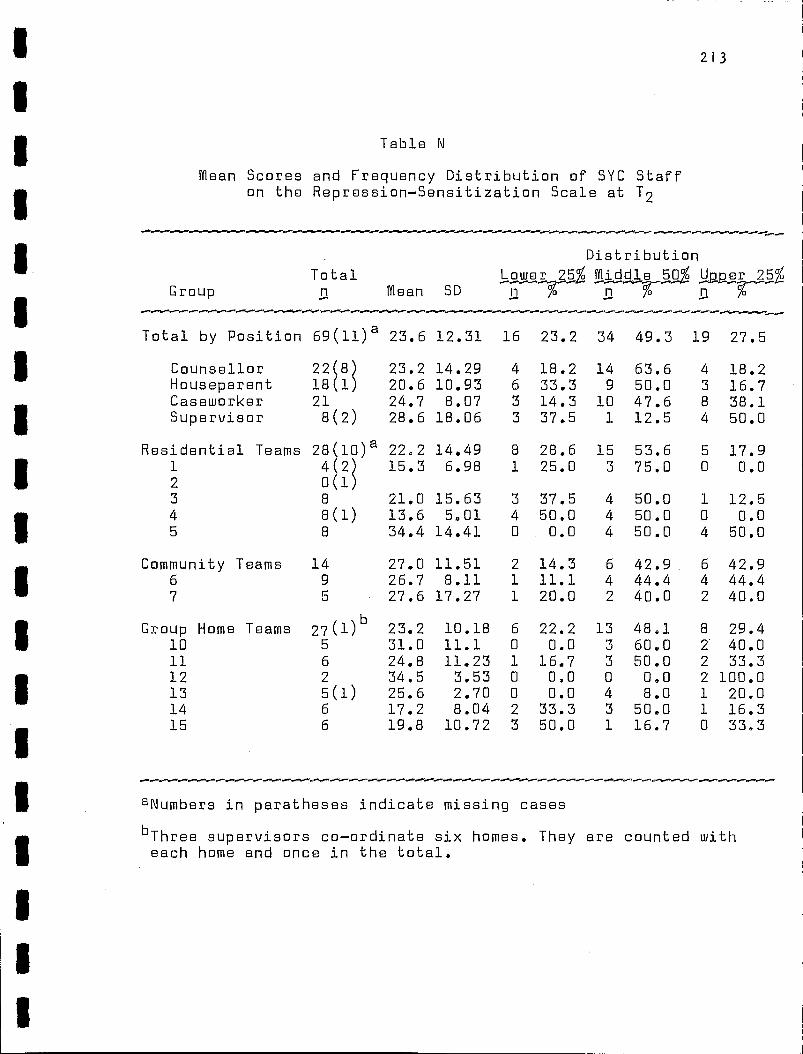
213
Table N
Mean Scores and Frequency Distribution of SYC Staff on the Repression-Sensitization Scale at T 2
Distribution Total Lower 255 Middle .5.o% !beer 25%
Mean SD n n %-
Total by Position 69(11) a 23.6 12.31 16 23.2 34 49.3 19 27.5
Counsellor 22(8) 23.2 14.29 4 18.2 14 63.6 4 18.2 Houseparent 18(1) 20.6 10.93 6 33.3 9 50.0 3 16.7 Caseworker 21 24.7 8.07 3 14.3 10 47.6 8 38.1 Supervisor 8(2) 28.6 18.06 3 37.5 1 12.5 4 50.0
Residential Teams 28(10) a 22.2 14.49 8 28.6 15 53.6 5 17.9 1 4(1 15.3 6.98 1 25.0 3 75.0 0 0.0 2 0(1 3 8 21.0 15.63 3 37.5 4 50.0 1 12.5 4 8(1) 13.6 5.01 4 50.0 4 50.0 0 0.0
a 34.4 14.41 0 0.0 4 50.0 4 50.0
Community Teams 14 27.0 11.51 2 14.3 6 42.9 6 42.9 6 9 26.7 8.11 1 11.1 4 44.4 4 44.4 7 5 27.6 17.27 1 20.0 2 40.0 2 40.0
Group Home Teams 27(1) b 23.2 10.18 6 22.2 13 48.1 8 29.4 10 5 31.0 11.1 0 0.0 3 60.0 2 40.0 11 6 24.8 11.23 1 16.7 3 50.0 2 33.3 12 2 34.5 3.53 0 0.0 0 0,0 2 100.0 13 5(1) 25.6 2.70 0 0.0 4 8.0 1 20.0 14 6 17.2 8.04 2 33.3 3 50.0 1 16.3 15 6 19.8 10.72 3 50.0 1 16.7 0 33.3
aNumbers in paratheses indicate missing cases
b Three supervisors co-ordinate six homes. They are counted with each home and once in the total.
Group

Appendix 4
Analysis of Significant Differences Between the Characteristics of SYC Staff at T 1 and T 2
21 4

Chi—Sguare
x 2 df
Mann Wbitney Characteristics
3037.0 2030.5
.008
.368
215
Table A
A Summary of the Significant Differences Between T i and T 2 - on the Background and Personal Characteristics of Tofal SYC Staff
Demographic Sex Marital Status Age
Education Qualifications Certification Program Staff Develop. Courses
Work History at SYC Months at SYC Months in Present Unit Previous Unit Previous Positions
Preference for Treatment . Approaches
Accepting Friend Bib Brother Control Structure Behavior Reality Insight Reality
.950 1 .329
.270 2 .874 2595.5, .582
2714.5 .925
2.589 4 .629
1.968 3 .579
.624 1 .429
3331.0 .024
4732.5 .000
2521.0 .367
2681.0 .805
1953.0 .058
2296.5 .579
2339.5 .798
2514.0 .628
2350.5 .833
Previous Employment Previously Empl. .283 1 .595 Related Previous Empl. .000 1 .997 Yrs. of Related Experience
Factors Influencing Worker Style Conceptual Level Repression .—Sensitization
-Klote. Data describing the staff at T., and T, on each of the characteristics can be found i the tàbles of Appendices 2 and 3.

Table B
A Summar9 cif the Significant Differences Between T 1 and 11 9 on the Background and Personal Characteristics of Residentiai Staff
Chi=Sguare
X 2 Mann Whitney
Characteristics df
Demographic Sex Marital Status Age
1.389 1 .239
.561 2 .756
1 1
.000 1 .997
.221 1 .638 628.0 .991
1.147 4 .887
5.961 3 .113
4.212 1 .040 1 862.0
1152.5 642.0 645.5
373.5 456.5 443.5 509.0 544.0
602.0 454.5
.007
.000
.851
.807 1
.090 II
.585
.469
.857 III
.505
1 .224 .885 1
216
645.0 .835 I/
Previous Employment Previously Empl. Related Previous Empl. Yrs. of Related Experience
Education Qualifications Certification Program Staff Develop. Courses
Work History at SYC Months at SYC Months in Present Unit Previous Unit Previous Positions
Preference for Treatment Approaches
Accepting Friend Bib Brother Control Structure Behavior Reality Insight Reality
Factors Influencing Worker Style Conceptual Level Repression—Sensitization
•■■•■../I0
Note. Data describing the staff at T, and T, on each of the characteristics can be found ih the tâbles of Appendices 2 and 3.
1 1 1
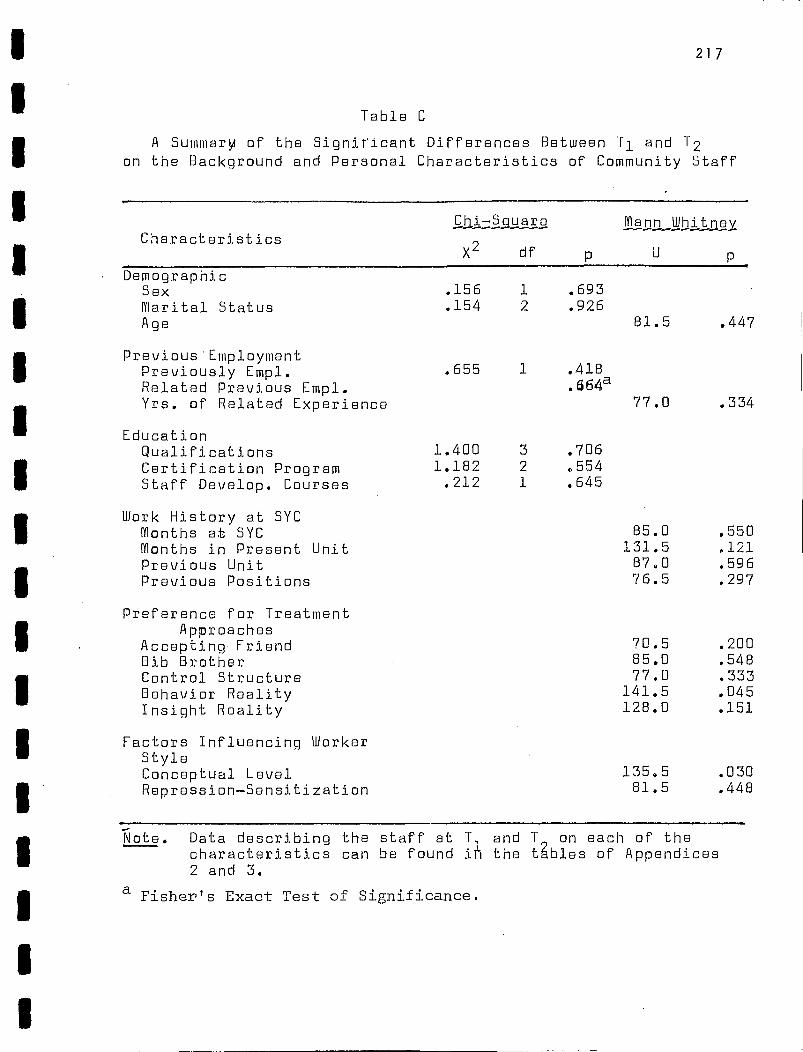
Characteristics Chi=Sguare
X 2 df
Mann Whitney
217
Table C
A Summarm of the Signiricant Differences Between T1 and 12
on the Background and Personal Characteristics of Community Staff
Demographic Sex .156 1 .693 Marital Status .154 2 .926 Pige 81.5 .447
Previous Employment Previously Empl. .655 1 .418
Related Previous Empl. .664a Yrs. of Related Experience 77.0 .334
Education Qualifications Certification Program Staff Develop. Courses
Work History at SYC Months at SYC Months in Present Unit Previous Unit Previous Positions
Preference for Treatment Approaches
Accepting Friend Bib Brother Control Structure Behavior Reality Insight Reality
Factors Influencing Worker Style Conceptual Level Repression—Sensitization
1.400 3 .706
1.182 2 .564
.212 1 .645
85.0 131.5 87.0 76.5
7 0.5 85.0 77.0
141.5 128.0
.550
.121
.596
.297
.200
.548
.333
.045
.151
135.5 .030
81.5 .448
-Klote. Data describing the staff at T, and T, on each of the characteristics can be found ih the tables of Appendices 2 and 3.
a . Fisher's Exact Test of Significance.
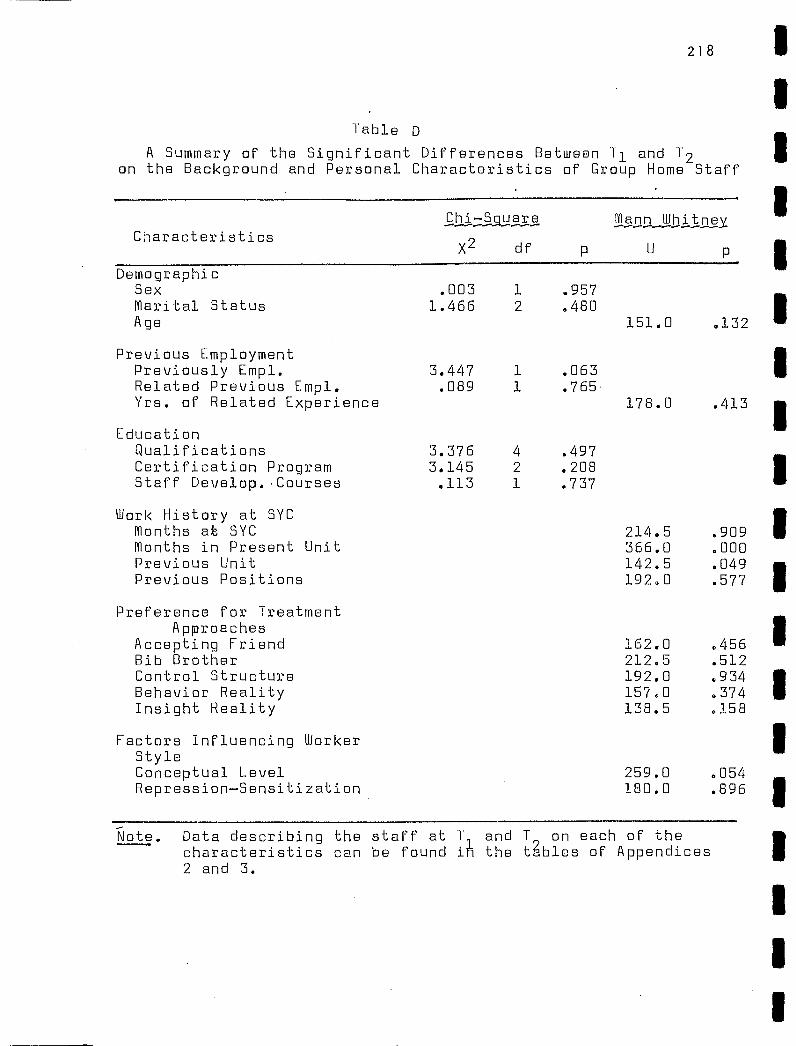
178.0 .413
259.0 .054
180.0 .896
214.5 366.0 142.5 192.0
.909
.000
.049
.577
162.0 212.5 192.0 157.0 138.5
.456
.512
.934
.374
.158
218
Table D A Summary of the Significant Differences Between T1 and T 2
on the Background and Personal Characteristics of Group Home Staff
Characteristics
Demographic Sex Marital Status Age
Chi=Sguare
x2 df
.003 1 .957
1.466 2 .480
Mann Wbitney
151.0 .132
Previous Employment Previously Empl. 3.447 1 .063 Related Previous Empl. .089 1 .765. Yrs. of Related Experience
Education Qualifications Certification Program Staff Develop..Courses
Work History at SYC Months at SYC Months in Present Unit Previous Unit Previous Positions
Preference for Treatment Approaches
Accepting Friend Bib Brother Control Structure Behavior Reality Insight Reality
Factors Influencing Worker Style Conceptual Level Repression—Sensitization
3.376 4 .497
3.145 2 .208
.113 1 .737
ilote. Data describing the staff at T, and T, on each of the characteristics can be found ifi the tàbles of Appendices 2 and 3.

Demographic Sex 1.337 1 .248 Marital Status 2.313 2 .315 Age 383.0 .724
Previous Employment Previously Empl. .038 1 .846 Related Previous Empl. .015 1 .903 Yrs. of Related Experience 386.5 .767
Education Qualifications .954 3 .813 Certification Program 5.986 3 .112 Staff Develop. Courses 5.279 1 .022
Work History at SYC Months at SYC Months in Present Unit Previous Unit Previous Positions
Preference for Treatment Approaches
Accepting Friend Bib Brother Control Structure Behavior Reality Insight Reality
Factors Influencing Worker Style Conceptual Level Repression—Sensitization
375.0 .335
275.0 .827
555.5 728.5 424.5 418.5
;016 .000 .729 .789
227.5 285.5 259.5 283.5 341.5
.Q99
.605
.306 ,577 .563
Characteristics Chi=5_guare Mann Wbitney
df x2
219
Table E
A Summary of the Significant Differences Between T 1 and T 2 on the Background and Personal Characteristics of Chiid Care Counsellors
-.1Çlote. Data describing the staff at T i and T on each of the characteristics can be found ifi the tables of Appendices 2 and 3.

1
1 Mann Wbitney Characteristics
Chi=§_guare
X 2 df
.041 1 .839
2.295 2 .317 93.5 .149
Demographic Sex Marital Status Age
4.753 1 .029
.014 1 .905 104.0 .289
2.714 4 .607
.747 2 .689
1.876 1 .171
146.5 240.0 79.5
124.0
.622
.000
.014
.024
68.0 .048 11
111,5 .824
147.0 .227 II
89.5 .264
72.5 .071
154.0 .138
116.5 .719
220 1
Table F A Summary of the Significant Differences Between Ti and T 9
on the Background and Personal Characteristics of Houseparents
Previous Employment Previously Empl. Related Previous Empl. Yrs. of Related Experience
Education Qualifications 'Certification Program Staff Devplop. Courses
Work History at SYC Months at SYC Months in Present Unit Previous Unit Previous Positions
Preference for Treatment Approaches
Accepting Friend Bib Brother Control Structure Behavior Reality Insight Reality
Factors Influencing Worker Style Conceptual Level Repression—Sensitization
ilote. Data describing the staff at T, and T, on each of the characteristics can be found ih the tables of Appendices 2 and 3.

Chir:Sguare
X 2 df
Mann WbitDey Characteristics
150.5 .619
142.5 .831
221
'able G A Summary of the Significant Differences Between T 1 and 1 2
on Background and Personal Characteristics of Caseworkers
Demographic Sex Marital Status Age
Previous Employment Previously Empl. Related Previous Empl. Yrs. of Related Experience
Education Qualifications Certification Program Staff Develop. Courses
Work History at SYC Months at SYC Months in Present Unit Previous Unit Previous Positions
Preference for Treatment Approaches
Accepting Friend " Bib Brother Control Structure Behavior Reality Insight Reality
Factors Influencing Worker Style Conceptual Level Repression—Sensitization
.004 1 .948
5.239 2 .073
1.051 1 .305
.069 1 .793
2.756 3 .431
.149 2 .928
.135 1 .714'
122.5 207.5 123.5 119.0
105.0 108.0 111.5 196.5 153.5
.619
.010
.622
.504
.257
.308
.373
.032
.536
203.0 .018
88.0 .154
ilote. Data describing the staff at T, and T, on each of the characteristics can be found ih the tàbles of Appendices 2 and 3.

222
1
83.5 102.0 54.5 54.0
.045
.001
.970
.941
61.5 .646
59.5 .751
1
52.5 .818 I/
50.0 .969
42.0 .568 II
64.5 .253 II
53.0 • 788
55.0 .362
35.0 .456
Table H A Summary of the Significant Differences Between T i and T 2
on the Background and Personal Characteristics of Supervisors
Chi=Sguare Mann Whitney Characteristics
x2
Demographic Sex .453 1 .501 Marital Status 6.033 2 .049 Age
Previous Employment Previously Empl. .203 1 .652 Related Previous Empl. .335 Yrs. of Related Experience
Education Qualifications Certification Program Staff Develop. Courses
Work History at SYC Months at SYC Months in Present Unit Previous Unit Previous Positions
Preference for Treatment Approaches
Accepting Friend Bib Brother Control Structure Behavior Reality Insight Reality
Factors Influencing Worker Style Conceptual Level Repression—Sensitization
df
4.741 3 .192
1.348 2 .509
.024 1 .887
-Klote. Data describing the staff at T i and T, on each of the characteristics can be found ih the tà.bles of Appendices 2 and 3.

223
Table K
Summaru of the Significant Differences Between T i and T 2 on the Background and Personal Characteristics of the Team 3 Staff
Characteristics Chi=Sguare Mann Wbitney
X 2 df p Demographic a
Sex .769 Marital Status .769 Age 34.0 .486
Previous Employment Previously Empl. .573 Related Previous Empl. .778 Yrs. of Related Experience 33.0 .562
Education Qualifications Certification Program Staff Develop. Courses
Work History at SYC Months at SYC Months in Present Unit Previous Unit Previous Positions
Preference for Treatment Approaches
Accepting Friend Bib Brother Control Structure Behavior Reality Insight Reality
Factors Influencing Worker Style Conceptual Level Repression—Sensitization
1.282 3 .733
2.054 2 .358 .100
38.5 50.5 33.0 26.5
15.0 26.0 18.5 36.0 37.0
.224
.008
.504
.847
.127
.815
.269
.351
.285
47.0 .028
31.5 .684
i■lote. Data describing the staff at T, and T, on each of the characteristics can be found ih the tàbles of Appendices 2 and 3.
a . Fisher's Exact Test of Significance.

1
1
Previous Employment Previously Empl. Related Previous Empl. Yrs. of Related Experience
.40
.249 19.0 .185
22 11 1
.Table L Summary of the Significant Differences Between T 1 and T 2
on the Background and Personal Characteristics of the Team 4 Staff
Mann Wbitney Characteristics
Demographic Sex Marital Status Age
)(2 df
a .231
2.939 2 .230 25.5 .523 I/
Education Qualifications Certification Program Staff Develop. Courses
Work History at SYC Months at SYC Months in Present Unit Previous Unit Previous Positions
Preference for Treatment Approaches
Accepting Friend Bib Brother Control Structure Behavior Reality Insight Reality
Factors Influencing Worker Style Conceptual Level Repression—Sensitization
3.719 3 .293
1.778 2 .411 .121
41.5 54.5 35.5 40.5
18.0 33.5 26.5 32.5 39.0
.289
.011
.641
.278
.148
.831
.593
.914
.413
28.5 .719
43.0 .012
Note. Data describing the staff at T i and T, on each of the characteristics can be found i the tàbles of Appendices 2 and 3.
a Fisher's Exact Test of Significance. 1
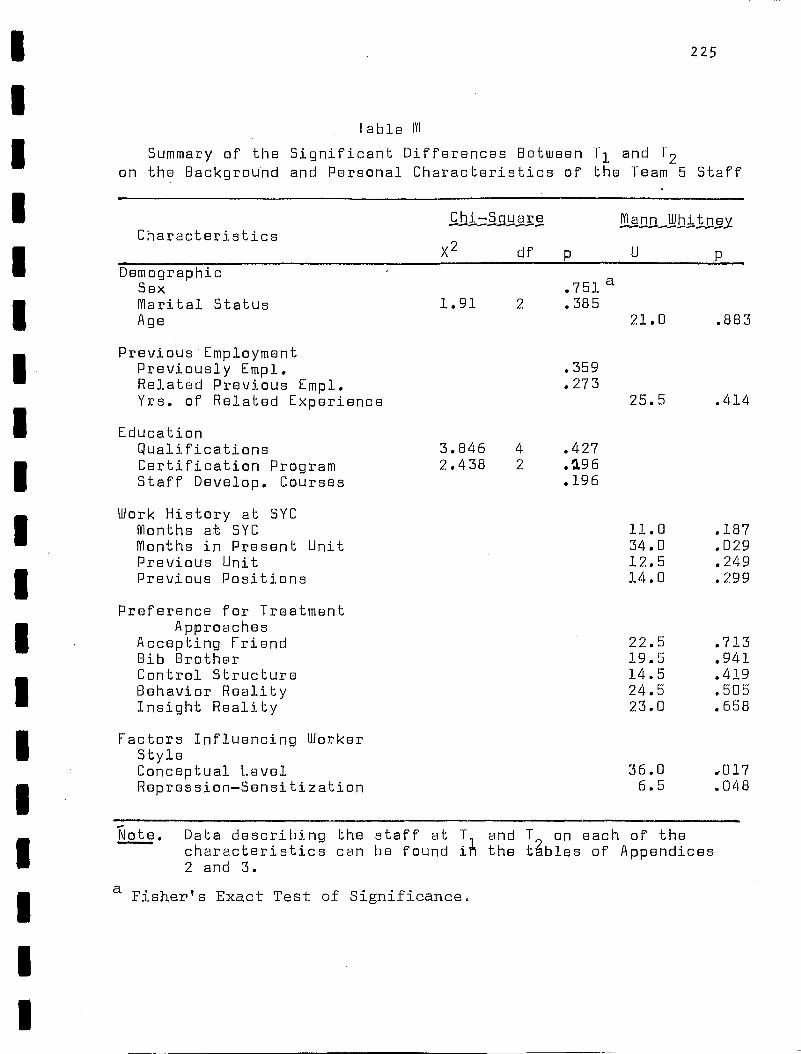
Characteristics X 2 df p
225
labia M
Summary of the Significant Differences Between Ti and r 2 on the Background and Personal Characteristics of the Team 5 Staff
Chi=Sguare Mann Wbitney
Demographic Sex .751 a Marital Status 1.91 2 .385 Age 21.0 .883
Previous*Employment Previously Empl. .359 Related Previous Empl. .273 Yrs. of Related Experience 25.5 .414
Education Qualifications Certification Program Staff Develop. Courses
Work History at SYC Months at SYC Months in Present Unit Previous Unit Previous Positions
Preference for Treatment Approaches
Accepting Friend Bib Brother Control Structure Behavior Reality Insight Reality
Factors Influencing Worker Style Conceptual Level Repression—Sensitization
3.846 4 .427
2.438 2 .196
11.0 34.0 12.5 14.0
22.5 19.5 14.5 24.5 23.0
.187
.029
.249
.299
.713
.941
.419
.505
.658
36.0 .017
6.5 .048
«Klote. Data describing the staff at T, and T, on each of the characteristics can be found the t.àbles of Appendices 2 and 3.
a Fisher's Exact Test of Significance.

Characteristics Chi :::Sguare
X 2 df
Mann Whitney
.859
.248
.854
.702
38.5 53.5 38.5 36.5
.755
.894
.451
.129
.162
37.0 42.0 32.0 57.5 56.0
.50 a
1.067 2 .587 33.5 .536
.309
.689 34.0 .566
226
Table N Summary of the Significant Differences Between T i and T 2
on the Background and Personal Characteristics of the Team 6 Staff
Demographic Sex Marital Status Age
Previous Employment Previously Empl. Related Previous Empl. Yrs. of Related Experience
Education Qualifications Certification Program Staff Develop. Courses
Work History at SYC Months at SYC Months in Present Unit Previous Unit Previous Positions
Preference for Treatment Approaches
Accepting Friend Bib Brother Control Structure Behavior Reality Insight Reality
Factors Influencing Worker Style Conceptual Level Repression—Sensitization
1.167 2 .558
2.077 2 .354 .500
61.0 .016
38.5 .859
■••■•••
-Note. Data describing the staff at 1- , and T, on each of the characteristics can be found ifi the tà.bles of Appendices 2 and 3.
a . Fisher's Exact Test of Significance.

Chi=§„guare
X 2 df
Mann Whitney Characteristics
.401
.240
.496
.228
8.5 18.0 9.5 7.0
3.0 6.5 9.0
18.0 17.0
.040
.206
.462
.248
.288
4;525 15.5 .34 81.0
227
Table 0
Summary of the Significant Differences lietwoon T 1 and 1 2 on the Background and Personal Characteristics of the Feam - 7 Staff
Demographic a Sex .50 Marital Status .50 Age 8.5 .396
Previous Employment Previously Empl. .50 Related Previous Empl. 1.00 Yrs. of Related Experience 8.5 .401
Education Qualifications Certification Program Staff Develop. Courses
Work History at SYC Months at SYC Months in Present Unit Previous Unit Previous Positions
Preference for Treatment Approaches
Accepting Friend Bib Brother Control Structure Behavior Reality Insight Reality
Factors Influencing Worker Style Conceptual Level Repression—Sensitization
2.00 2 .368 .50 .50
i-Jote. Data describing the staff at T, and T, on each of the characteristics can be found ih the tàbles of Appendices
2 and 3.
a Fisher's Exact Test of Significance.

Chi±:§guare
X 2 df
Mann Whitney Characteristics
.596
.01
.513
.317
15.0 25.0 10.0 15.0
.834
.915
.523
.665 1.000
11.5 13.0 9.5
14.5 12.5
228
Table P Summary of the Significant Differences Between T 1 and T 2
on the Background and Personal Characteristics of the Team 10 Staff
Demographic Sex Marital Status Age
a .50
1.00 7.0 .246
Previous'Employment Previously Empl. Related Previous Empl. Yrs. of Related Experience
Education Qualifications Certification Program Staff Develop. Courses
Work History at SYC Months at SYC Months in Present Unit Previous Unit ' Previous Positions
Preference for Treatment Approaches
Accepting Friend Bib Brother Control Structure Behavior Reality Insight Reality
Factors Influencing Worker Style Conceptual Level Repression—Sensitization
.50
.286 15.0 .590
2.667 3 .446
1.333 2 .513 .500
16.5 .396
7.0 .251
içlote. Data describing the staff at T, and T, on each of the characteristics can be found ifi the tàbles of Appendices 2 and 3.
a Fisher's Exact Test of Significance.

Demographic Sex Marital Status Age
a .500
1.333 2 .513 13.0 .400
14.0 29.0 13.0 13.0
.515
.067
.338
.382
14.5 14.5 19.0 14.5 2.0
.927
.926
.463
.925
.016
229
lable
Summary of the Significant Differences Between T 1 and T 2
on the Background and Personal Characteristics of the Team 11 Staff
Characteristics Chi=Sguare
x2 df
1_11D-LM—Wi.t.DeX
Previous Employment Previously Empl. .500 Related Previous Empl. .333 Yrs. of Related Experience 16.0 .748
Education Qualifications Certification Program Staff Develop. Courses
Work History at SYC Months at SYC Months in Present Unit Previous Unit Previous Positions
Preference for Treatment Approaches
Accepting Friend Bib Brother Control Structure Behavior Reality Insight Reality
4.133 3 .247
4.0 2 .135 .500
Factors Influencing Worker Style Conceptual Level 16.0 .855 Repression—Sensitization 9.5 .593
••••■••••••••••••••■••••••■■••••■••••••■.
'fiote. Data describing the staff at T, and T on each of the characteristics can be found ih the tables of Appendices 2 and 3.
a • Fisher's Exact Test of Significance.
Appendix 5
Summary of the Significant Differences at T 2
Between the SYC Staff in Different Settings,
Positions, and Teams on Background and Perso-
nal Characteristics
230

Demographic Sex Marital Status Pige
2 .897 4 .567
1.81 .171
.22 2.94
Table A
Summary of Significant Differences Between Residential, Group Home and Community Staff at T2, on Background and Personal
Characteristics
C111-1Uare ANOVA -------- Characteristic X
2 df F a
23 1
Previous Employment Previous Employment 6.14 2 .046 Related Previous Employment 5.69 2 .058 Yrs. of Related Experience 7.85 .001
Education Qualifications Certification Program Staff Development Courses
11.75 8 .163
10.87 6 .093
5.20 2 .074
Work History at SYC Total time at SYC Time in present unit Previous units worked in Previous positions
Preferences for Treatment Approaches 12 Cf ni Mp/Cfc Na Nx
Factors influencing Worker Style Conceptual Level Repression—Sensitization
10.07 .0001
9.56 .0002
2.07 .133
8.99 .0003
2.34 .104
1.56 .219
2.30 .108
2.40 .098
.94 .936
.82 .447
.72 .489
Note. Data describing the staff groups on each of the characteristics can be found in the tables of Appendix 3.

232
1.20 .046
Demographic Sex Marital Status Age
4.09 3 .251
21.08 6 .002
Table B
Summary of Significant Differences Between SYC Counsellors, Houseparents, Caseworkers and Supervisors at T2 on Background
and Personal Characteristics
Chi Square
Characteristics X df a
Previous Employment Previous Employment 7.08 3 .069 Related Previous Employment 13.7 3 .003 Yrs. of Related Experience 4.60 .005
Education Qualifications 39.85 12 .0001 Certification Program 15.33 9 .082 Staff Development Courses 13.82 3 .003
111
Work History at SYC Total time at SYC 4.68 .005 Time in present unit 3.53 .019 Previous units worked in 3..7l .015 Previous positions 12.56 .000
Preferences for Treatment Approaches 1 9 1.57 .206 Cfm 1.45 .236 Mp/Cfc 2.30 .088 Na 1.15 .336 Nx .04 0 991
Factors Influencing Worker Style Conceptual Level Repression—Sensitization
3.72 .015
.87 .460
Note. Data describing the four positions on each of the characteristics can be found in the tables of Appendix 3.
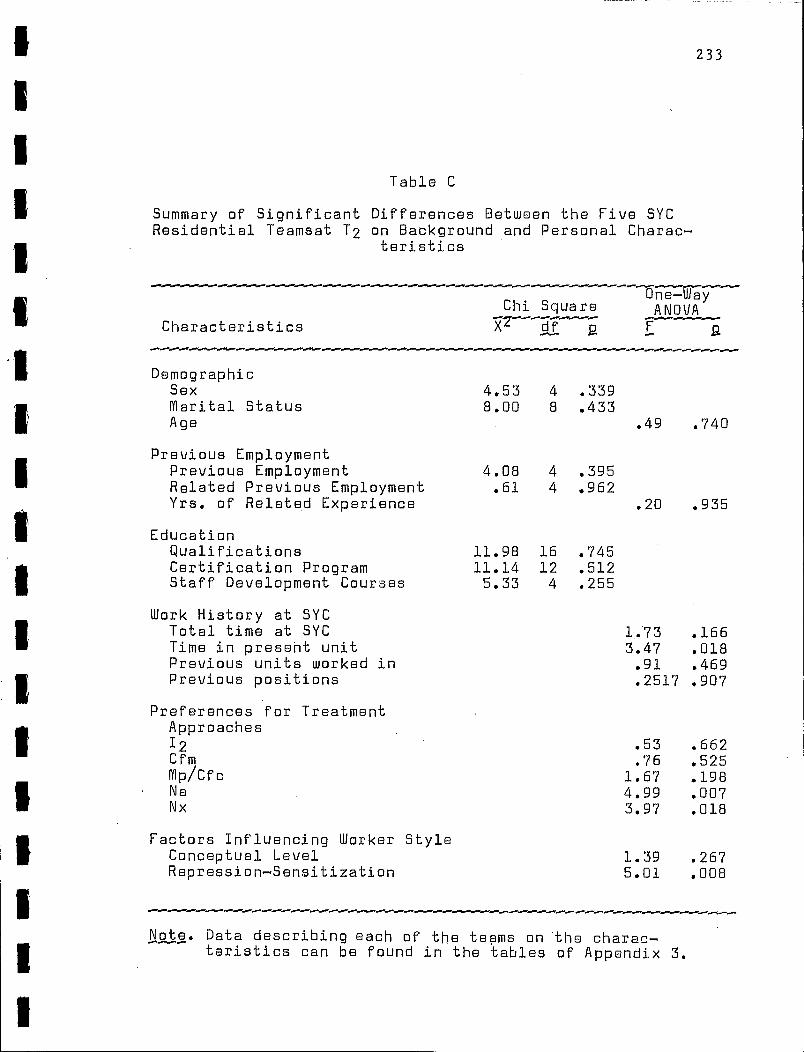
4.53 4 .339
8.00 8 .433 .49 .740
4.08 4 .395
.61 4 .962 .20 .935
Table C
Summary of Significant Differences Between the Five SYC Residential Teamsat T2 on Background and Personal Charac-
teristics
233
Characteristics Chi Square
df e
One—Way ANOVA
r-------
Demographic Sex Marital Status Age
Previous Employment Previous Employment Related Previous Employment Yrs. of Related Experience
Education Qualifications Certification Program Staff Development Courses
Work History at SYC Total time at SYC Time in present unit Previous units worked in Previous positions
11.98 16 .745 11.14 12 .512 5.33 4 .255
1.73 .166
3.47 .018
.91 .469
.2517 .907
Preferences for Treatment Approaches 12 .53 .662 Cfm .76 .525 Mp/Cfc 1.67 .198
• Na 4.99 .007 Nx 3.97 .018
Factors Influencing Worker Style Conceptual Level Repression—Sensitization
1.39 .267
5.01 .008
Note. Data describing each of the teams on the charac-teristics can be found in the tables of Appendix 3.

Fischers Exact One—Way Test or Chi—Square ANOVA 77 df F — R Characteristics
.657 .73 2 .696
.86 .873
.657
.357 1.75 .127
3 .162 2 .169
.725
5.14 5.55
Table D
Summary of the Significant Differences Between the Two SYC Community Teams at 1 2 on Background and Personal Characteristics
234
■••••• •••••••■•••••
Demographic Sex Marital Status Pige
Previous Employment Previous Employment Related Previous Employment Yrs. of Related Experience
Education Qualifications Certification Program Staff Development Courses
Work History at SYC Total time at SYC Time in present unit Previous units worked in Previous positions
.24 .633
.11 .752
.21 .018
.89 .362
Preferences for Treatment Approaches 12 .01 .916 Cfm .00 .968 Mp/Cfc 2.59 .133 Na .08 .779 Nx 3.08 .105
Factors Influencing Worker Style Conceptual Level .05 .820 Repression—Sensitization .02 .891
••••••
Note. Data describing the teams on each of the characteristics can be in the tables of Appendix 3.

One—Way ANOVA_
.99 .444
Demographic Sex Marital Status Age
3.39 5 .640 7.57 10 .670
1.24 2.09 .30
1.34
.322
.100
.908
.279
Table E
Summary of the Significant Differences Between Fice SYC,
Croup Home Teams at T2 on Background and Personal Charac- teristics
235
Chi Square Characteristics
Previous Employment Previous Employment Related Previous Employment Yrs. of Related Experience
Education Qualifications Certification Program Staff Development Courses
Work History at SYC Total time at SYC Time in present unit Previous units worked in Previous positions
2.78 5 .734
5.51 5 .357 1.54 .236
20.71 20 .415
7.18 10 .708
5.97 5 .309
Preferences for Treatment Approaches 12 .32 .893 Cfm .90 .496 Mp/Cfc .88 .507 Na .46 .799 Nx 1.16 .357
Factors Influencing Worker Style Conceptual Level Repression—Sensitization
.96 .461
2.01 ..113
Note. Data describing the group home teams on each of the characteristics can be found in the tables of Appendix 3.
APPENDIX 6
SYC Staff Ratings on the "Treater-Matching" Interview Scales
(September 1976 to March 1977)
236

+9 - 7 +9 0 +22 to -25
+29 to - 35 +35 to -44 +19 to -24 +44 to -52
+11 - 4
5 - 9
+8 - .5
+14 -14
1 2
Cfm Mp/Cfc Na Nx
+11 - 7 +13 - 9 +8 -6 +14 -14
Youth Type Scale Range Agreement within 10 2 of the Scale Pearson r n.
92% +22 to - 25
84% 79% 87% 90%
.00001
.00001
.00001
.00005
.00001
1 2 Cfm +29 to - 35 Mp/Cfc +35 to - 44 Na +19 to - 24 Nx +44 to '.52
.826
.743
.653
.587 :819
mil ilia MI III* Mt MU ILIM IMO We ILIN IMP
Table A
Criteria Used for Matching Workers to Youth Type In the Context of I-Level Theory
Youth Type Range of Scale
Original Cut-Offs a
Match Mismatch Present Research Cut-Offs
b
Match Mismatch
a See Ted Palmer, Guide to The Scoring and Interpretation of the "Form 3" Inventory, California
Treatment Project, 1968.
In taking the frequency distribution of our population on each of the scales into account, some
modifications were made in the cut-off points for matching and mismatching.
Table B
Correlation Between Two Independent Raters on the Subtype Scores of 38 Interviews

Table C
Correlation between Two Independent Raters on the 105 Items of the Rating Inventory
for the Selection and Matching of Treatment Personnela
Item Pearson's r Sig. Level Item Pearson's r Sig. Level Item Pearson's r Sig. Level
1 .598
2 .537
3 .499
4 .825
5 • 479
6 .519
7 .350 o .442
9 .413
10 .439
11 .56o
12 .712
13 .683
14 .406
15 .517
16 .179
17 .672
18 .474
19 .803
20 .586
21 .682
22 .643
23 .549
24 .481
25 .337
26 .360
27 .271
28 .259
29 .523
30 .725
31 .518
32 .582
33 .695 34 .454
35 .315•
.001 36 .423 .004 71 Did Not Score
.00i 37 4 99 .00t 72 .52 0 .001 Am 38 .438 .003 73 .159 .171 .001 39 ' .710 .001 74 .607 .001 .001 4o .209 .104 75 .289 .039 .001 41 .553 Am 76 .403 . 00 6 .016 42 .665 .001 77 .482 . 001 .003 43 .487 .001 78 .312 . 0 28 .005 44 .6 00 .001 79 .354 .015 .003 45 .403 . 00 6 8 0 .515 .001 .001 46 .325 .023 81 .774 .001 .001 47 .729 .001 82 .525 .001 .001 48 .655 . 001 83 .176 1 T46 .006 49 .682 .001 84 .130 .21 8 .001 50 .542 . 001 85 .449 .002
.141 51 .534 .001 86 .439 . 00 3
.001 52 .243 .071 87 .569 .001
.001 53 .584 .001 88 .390 .008
.001 54 .549 .001 89 .644 .001
.00t 55 .555 .001 go .315 .027
.001 56 .627 Am 91 .513 .001
.001 57 . 0 86 .305 92 .162 .166
.001 58 .299 .034 93 .193 .123
.001 59 .637 .001 94 .509 .001
. 0 19 6 0 .605 .001 95 .465 .002
.013 61 .234 .070 96 .375 .01 0
.0 5 0 62 .647 .00t 97 .539 .001
.0 58 63 .741 .001 98 .542 . 001
.001 64 .531 .001 99 .441 .003
.001 65 .709 .001 too .521 .001
.001 66 .613 .001 101 .206 .108
.001 67 .445 . 00 3 102 .378 .010
.001 68 .644 . 001 103 .181 .138
.002 69 .688 .001 104 .404 .006
.027 70 .578 .001 10 5 .358 .014
a Analysis based on 38 interviews.
um en me mg an am mot rt, am as es es is me es or ae

mil INN ON MI lie UM IOU UM 11111, 111•1 OM MO MN um we mu ion
Table D
Comparison of SYC Staff Matched and Mismatched to 12 Youth on Interview Scales and Subtype Scores
Scales
Matched Intermediate Mismatched (n=22) (n=32) (n=18) M SD M SD M SD
1. Soc. Des. Quai. 2. Att. Adol. Like 3. Alertness 4. Boldness 5. Forcefulness 6. Soc. Undes. Quai. 7. Aggress. 8. Past Diffc. 9. Present Prob. 10. Moral Or. 11. Work Sat. 12. World Sat. 13. Familiarity 14. Und. & Diff. 15. Use of Self 16. Atmosphere 17. Con. Neg. 18. Inner Focus 19. Chg. & Act. 20. Firmness 21. Con. Control
68.7 10.7 63.6 9.9 52.8 10.6
61.7 9.9 58.1 12.1 52.5 9.3
65.0 14.8 63.6 14.8 50.4 11.3
49.2 15.5 60.6 17.5 56.5 16.8
42.5 8.9 51.5 11.4 49.4 14.1
30.8 8.0 46.2 11.6 52.4 11.3
24.9 9.0 39.7 12.6 50.2 11.6
64.2 15.2 64.3 18.3 55.2 19.2
40.9 17.7 40.5 15.9 42.6 17.9
28.4 9.1 35.7 13.4 50.5 14.8
79.5 12.6 76.3 14.9 68.1 15.7
53.9 12.5 50.9 16.1 50.9 14.9
69.8 12.9 60.9 10.5 58.7 13.9
76.7 12.7 72.7 11.4 55.7 14.5
69.9 15.1 63.7 16.4 61.7 13.6
83.5 7.7 79.4 7.6 70.9 10.9
58.2 12.1 57.7 10.2 56.6 10.5
81.3 8.6 74.1 11.9 61.1 15.3
42.9 5.5 45.3 7.5 47.1 7.3
32.8 9.7 44.1 15.9 57.5 15.0
33.7 10.2 41.2 14.5 57.3 13.9
Subtype Scores
1 2 10.5 2.1 5.0 3.3 - 4.9 4.1 Cfm 12.8 4.1 2.1 8.4 - 6.6 8.9 Mp -10.3 8.5 - 2.8 11.7 - 5.2 9.5 Na 4.8 4.6 4.0 4.6 1.7 4.7 Nx 9.8 10.4 - 3.8 13.1 -24.3 16.2
%.S3

Table E
Comparison of SYC Staff Matched and Mismatched to Cfm Youth on Interview Scales and Subtype Scores
Scales
Matched Intermediate Mismatched
(ne.20) (n=36) (n=16) M SD M SD M SD
Soc. Des. Quai. 2. Att. Adol. Like 3. Alertness 4. Boldness 5. Forcefulness 6. Soc. Undes. Quai. 7. Aggress. 8. Past Diffc. 9. Pres. Prob.
10. Moral Or. 11. Work Sat. 12. World Sat. 13. Familiarity 14. Und. & Diff. 15. Use of Self 16. Atmosphere 17. Con. Neg. 18. Inner Focus 19. Chg. & Act. 20. Firmness 21. Control
70.2 11.4 62.7 9.1 52.1 10.5
58.9 11.4 57.0 10.8 58.2 12.3
65.0 15.6 61.9 14.5 52.8 13.5
48.6 15.9 56.2 16.2 65.2 17.5
41. 0 6.9 48.1 11.4 57.6 12.4
29.3 7.4 43.5 9.2 59.2 8. 0
23.3 8.3 37.3 9.9 56.9 6.2
6 0 .3 18.3 65.9 16.0 55.1 19.8
36.9 17.5 41.1 15.5 46.6 18.1
28.6 8.7 36.5 13.7 49.6 16.4
82.1 12.9 73.7 13.8 70.1 17.4
57.1 12.2 49.3 14.7 51. 0 16.4
63.3 13.9 65.0 11.7 58.2 13.4
79.1 14.1 69.7 12.6 57.8 12.8
64.8 16.1 67.9 15.7 59. 0 13.3
84.8 7.1 78.8 7.5 70.2 10.9
54.9 10.5 58.4 10.8 59.1 11.0
80.5 9.7 73.3 13.2 63.2 15.3
42. 0 6.9 44.9 5.9 48.9 7.7
31.6 10.7 42.9 12.6 62.5 14.9
34.5 11.9 41.2 14.1 57.3 14.5
Subtype Scores
1 2 Cfm Mp Na Nx
9.2 3.4 4.6 5.2 2.9 6.5
14.5 3.4 3.6 5.2 - 11.8 5.3
-10.9 8.9 - 6. 0 9.5 1.6 11.4
3.3 4.9 4.6 4.4 2.2 4.9
11.6 10.6 - 4. 0 13. 0 -26.8 12.8 N.)
wilit tout Mt MI MI. OW* tile ella 1.11> Mil MI tag er

UN MI OM II» -.1118 Ili UM Mill UM MIR Milli OM IMP OM RI Me am UM IOW
Table F
Comparison of SYC Workers Matched and Mismatched to Mp/Cfc Youth on Interview Scales and Subtype Scores
Scales
Matched Intermediate Mismatched
(n=13) (n=29) (n=30) M SD M SD M SD
I,■■■
1. Soc. Des. Quai. 2. Att. Adol. Like 3. Alertness 4. Boldness 5. Forcefulness 6. Soc. Undes. Quai. 7. Aggress. 8. Past Diffc. 9. Pres. Prob. 10. Moral Or. 11. Work Sat. 12. World Sat. 13. Familiarity 14. Und. & Diff. 15. Use of Self 16. Atmosphere 17. Con. Neg. 18. Inner Focus
15. Chg. & Act. 20. Firmness 21. Control
65.4 12.4 61.7 11.0 60.0 11.5
65.7 13.5 59.1 9.5 53.1 9.3
70.2 17.3 58.4 10.9 58.9 16.3
74.5 13.4 58.9 13.4 45.2 13.5
58.2 10.3 52.0 11.6 40.3 7.3
50.0 11.8 46.6 13.2 36.9 12.0
45.3 16.6 42.2 13.7 30.6 11.6
62.5 22.2 63.3 17.7 60.2 16.4
26.6 14.7 43.1 15.3 45.6 16.1
41.6 15.1 40.6 15.9 31.9 12.8
8 0 .8 12.9 75.6 15.3 72.5 15.2
46.8 15.1 53.9 13.2 52.1 15.7
58.2 11.9 64.5 11.7 63.8 14.1
71.9 11.4 70.3 14.2 68.1 17.1
65.4 15.6 65.6 17.3 64.4 14. 0
77.5 10.1 78.5 9.1 79. 0 10.2
63.1 10.1 58.9 9.4 53.9 11.3
73.4 12.5 71.9 13.3 73.9 15.6
46.3 5.8 46.2 7.7 43.4 6.6
55.5 12.5 47.5 15.3 35.9 15.6
49.6 15.1 47.1 14.3 36. 0 15.1
Subtype Scores
12 2.5 6.1 3.7 7.3 5.4 6.0 Cfm - 3.6 5.7 1.4 10.4 7.8 8.7 Mp 10.6 6.0 - 3.4 4.1 - 14.9 6. 0 Na 8.o 4.6 4.2 3.4 1.4 4.5 Nx - 8.3 15.3 - 8.4 17.7 .3 19.0

Table G
Comparison of SYC Workers Matched and Mismatched to Na Youth
on Interview Scales and Subtype Scores
Scales
Matched Intermediate Mismatched
(n.14) (n.46) (n=12) M SD M SD M SD
1. Soc. Des. Qual. 2. Att. Adol. Like 3. Alertness 4. Boldness 5. Forcefulness 6. Soc. Undes. Quai. 7. Aggress.' 8. Past Diffc. 9. Pres. Prob.
10. Moral Or. 11. Work Sat. 12. World Sat. 13. Familiarity 14. Und. & Diff. 15. Use of Self 16. Atmosphere 17. Con. Neg. 18. Inner Focus 19. Chg. & Act. 20. Firmness 21. Control
72.3 11.1 62.5 9.9 50.5 8.9
67.1 11.9 57.4 8.9 48.6 10.8
73.4 17.9 59.8 12.4 49.8 11.1
64.5 20.7 56.2 14.8 45.9 17.3
51.8 13.1 48.2 11.6 44.1 11.3
41.8 12.2 43.5 13.7 43.4 14.5
34.9 16.8 38.6 13.8 38.9 15.8
67.4 17.5 62.2 18.3 54.7 15.1
30.7 18.0 41.4 15.1 52.4 15.2
33.7 14.5 37.4 15.1 40.4 15.6
80.7 11.8 76.6 13.7 63.5 17.7
42.9 12.9 53.9 12.7 54.5 19.8
66.5 11.6 63.9 12.3 55.9 14.7
76.1 12.4 70.7 13.6 58.3 17.4
69.6 15.8 65.2 15.5 59.3 14.5
81.5 9.2 78.5 9.3 75.1 11.1
61.8 10.0 58.2 10.3 50.0 10.3
15.2 10.7 74.8 13.2 64.0 17.8
45.8 6.7 45.2 7.3 43.5 6.5
46.2 14.3 42.6 16.8 47.4 18.8
40.6 12.9 43.2 15.7 44.6 19.1
Subtype Scores
12 6.8 5.8 4.5 6.2 0 7.5 Cfm 3.9 11.3 3.4 9.9 1.3 11.4 Mp 4.7 11.1 - 6.1 7.5 -16.3 9.8 Na 9.8 2.5 3.7 2.8 - 3.3 2.5 Nx 1.1 15.7 - 3.7 17.1 -15.7 21.4
BIM et 111111 MI OM UN IN 11111111 IBM Ma in1, gin Ind MS MIL III I»

Mil all 1111111 111111t 11111i 11111111 O. OBI OM OM Ill& MN OBI
Table H
Comparison of SYC Workers Matched and Mismatched to Nx Youth on Interview Scales and Subtype Scores
Scales
Matched Intermediate Mismatched
(n11) (n=39) (n=22) M SD M SD M SD
1. Soc. Des. Qual. 2. Att. Adol. Like 3. Alertness 4. Boldness 5. Forcefulness 6. Soc. Undes. Quai. 7. Aggress. 8. Past Diffc. 9. Pres. Prob. 10. Moral Or. 11. Work Sat. 12. World Sat. 13. Familiarity 14. Und. & Diff. 15. Use of Self 16. Atmosphere 17. Con. Neg. 18. Inner Focus 19. Chg. & Act. 20. Firmness 21. Control
74.5 9.7 64.3 9.2 52.9 9.9
58.1 10.6 58.4 11.8 56.5 10.8
72.3 16.4 63.3 13.7 50.6 10.5
51.7 16.9 54.3 16.5 61.4 18.0
44.5 6.7 46.1 11.1 53.9 13.8
30.9 7.2 39.4 11.1 55.9 9.6
23.5 8.9 33.8 11.3 52.5 10.0
66.5 19.4 64.3 16.9 55.7 17.8
34.5 12.7 39.9 16.9 46.6 17.4
21.9 9.4 34.2 11.1 50.1 13.7
81.4 13.3 76.6 1 3. 0 69.7 17.5
50.8 9.9 51.4 13.9 53.2 17.9
57.9 14.1 66.8 11.9 58.9 12.1
87.5 9.0 73.5 10.1 55.7 12.2
69.2 17.2 66.6 15.1 6 0 .2 14.8
86.1 6.3 80.5 7.6 71.3 10.0
61.4 7.6 57.8 11.2 55.3 11.1
84.5 8.2 77.0 10.1 60.3 13.7
b2.4 7.1 43.8 6.1 48.6 7.2
27.8 10.3 4 0 .9 12.8 57.8 15.3
27.7 9.6 4 0 .2 13.4 55.3 13.4
Subtype Scores
12 8.5 4.6 6.7 4.3 - 2.4 6.1 Cfm 12.1 5.8 7.2 6.9 - 8.4 7.2 Mp - 6.9 7.2 - 6.4 10.9 - 3.7 11.6 Na 5.5 4.2 4.4 4.7 1.5 4.5
• Nx 19.7 5.1 .5 9.6 - 26.3 10.2
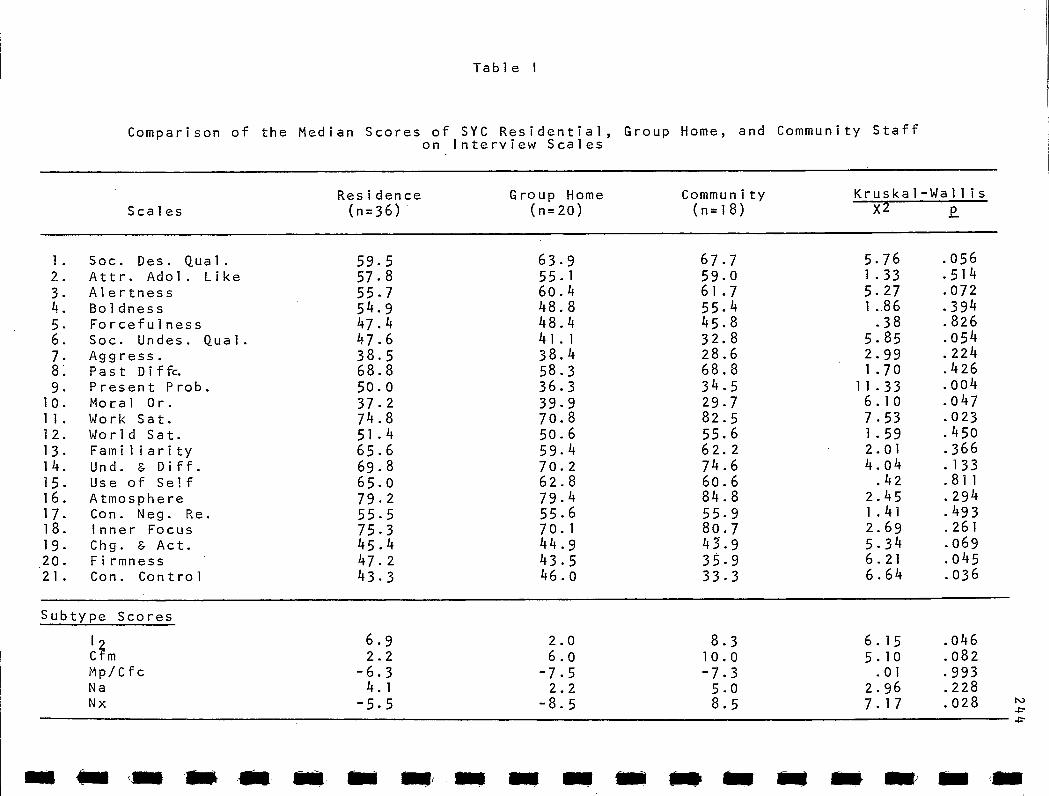
Scales
Kruskal - Wallis x2
Community (n.18)
Residence (n=36)
Group Home (n=20)
1. Soc. Des. Quai. 2. Attr. Adol. Like 3. Alertness 4. Boldness 5. Forcefulness 6. soc. Undes. Quai. 7. Aggress. 8. Past Diffc. 9. Present Prob.
10. Moral Or. 11. Work Sat. 12. World Sat. 13. Familiarity 14. Und. g Diff. 15. Use of Self 16. Atmosphere 17. Con. Neg. Re. 18. Inner Focus 19. Chg. g Act. 20. Firmness 21. Con. Control
59.5 57.8 55.7 54.9 47.4 47.6 38.5 68.8 50.0 37.2 74.8 51.4 65.6 69.8 65.0 79.2 55.5 75.3 45.4 47.2 43.3
63.9 55.1 60.4 48.8 48.4 41.1 38.4 58.3 36.3 39.9 70.8 50.6 59.4 70.2 62.8 79.4 55.6 70.1 44.9 43.5 46.0
67.7 59.0 61.7 55.4 45.8 32.8 28.6 68.8 34.5 29.7 82.5 55.6 62.2 74.6 60.6 84.8 55.9 80.7 45.9 35.9 33.3
5.76 .056
1.33 .514
5.27 .072
1.86 .394 .38 .826
5.85 .054
2.99 .224
1.70 .426
11.33 .004
6.10 .o47
7.53 .023
1.59 .450
2.01 .366
4.04 .133 .42 .811
2.45 .294
1.41 .493
2.69 .261
5.34 .069
6.21 .045
6.64 .036
Table I
Comparison of the Median Scores of SYC Residential, Group Home, and Community Staff on Interview Scales
Subtype Scores
1 2 Cfm Mp/Cfc Na Nx
6.9 2.2
-6.3 4.1 -5.5
2.0 6.0 -7.5 2.2
-8.5
8.3 10.0 -7.3 5.0 8.5
6.15 5.10 .01
2.96 7.17
.o46
.082
.993
.228
.028 e-
ma el ire de Ile - - 111111 ill Me Mg 01111 MI ale 11111
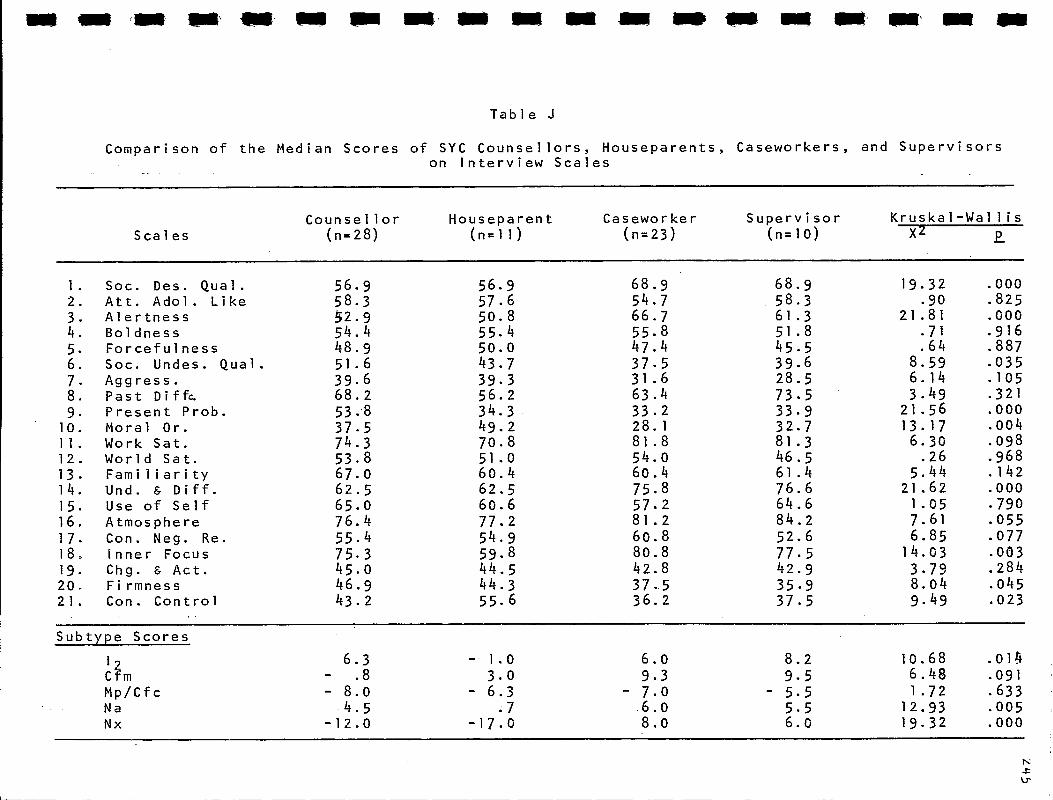
Ma 11111111 Ina Mal UN IBM OS Ilia MN OM en Ma MI Mt INS
Table J
Comparison of the Median Scores of SYC Counsellors, Houseparents, Caseworkers, and Supervisors on Interview Scales
Scales Counsellor Houseparent
(n=28) (n=11) Caseworker
(n=23) Supervisor
(n=10) Kruskal -Wallis
Xz
1. Soc. Des. Quai. 2. Att. Adol. Like 3. Alertness 4. Boldness 5. Forcefulness 6. Soc. Undes. Quai. 7. Aggress. 8. Past Diffc. 9. Present Prob.
10. Moral Or. 11. Work Sat. 12. World Sat. 13. Familiarity 14. Und. & Diff. 15. Use of Self 16. Atmosphere 17. Con. Neg. Re. 18. inner Focus 19. Chg. & Act.
20, Firmness
21. Con. Control
56.9 58.3 52.9 54.4 48.9 51.6 39.6 68.2 53.8 37.5 74.3 53.8 67.0 62.5 65.0 76.4 55.4 75.3 45.0 46.9 43.2
56.9 57.6 50.8 55.4 50.0 43.7 39.3 56.2 34.3 49.2 70.8 51.0 60.4 62.5 60.6 77.2 54.9 59.8 44.5 44.3 55.6
68.9 54.7 66.7 55.8 47.4 37.5 31.6 63.4 33.2 28.1 81.8 54.0 60.4 75.8 57.2 81.2 60.8 80.8
42.8 37.5 36.2
68.9 58.3 61.3 51.8 45.5 39.6 28.5 73.5 33.9 32.7 81.3 46.5 61.4 76.6 64.6 84.2 52.6 77.5 42.9 35.9 37.5
19.32 .000
.90 .825
21.81 .000 .71 .916 .64 .887
8.59 .035
6.14 .105
3.49 .321
21.56 .000
13.17 .004
6.30 .098 .26 .968
5.44 .142
21.62 .000
1.05 .790
7.61 .055
6.85 .077
14.03 .003
3.79 .284
8.04 .045
9.49 .023
Subtype Scores
1 2 Cfm Mp/Cfc Na Nx
6.3 - 1.0 6. 0 8.2 10.68 .014 - .8 3.0 9.3 9.5 6.48 .091 - 8.0 - 6.3 - 7. 0 - 5.5 1.72 .633
4.5 .7 6.0 5.5 12.93 .005 -12.0 - 17.0 8.0 6. 0 19.32 .000

Team 1 (n-7) Scales
Table K
Comparison of the Median Scores of Five SYC Residential Teams on Interview Scales
Team 2 Team 3 Team 4 Team 5 Kruskal-Wallis (n=7) (n=7) (n=8) (n=7) X 2
1. Soc. Des. Quai. 2. Att. Adol. Like 3. Alertness 4. Boldness 5. Forcefulness 6. soc. Undes. Quai. 7. Aggress. 8. Past Diffc. 9. Present Prob.
10. Moral Or. 11. Work Sat. 12. World Sat. 13. Familiarity 14. Und. & Diff. 15. Use of Self 16. Atmosphere 17. Con. Neg. Re. 18. Inner Focus 19. Chg. & Act. 20. Firmness 21. Con. Control
63.2 59.4 55.0 49.5 46.5 31.3 34.7 68.8 48.6 38.5 80.8 58.3 68.8 71.9 58.1 86.0 55.4 70.8 45.2 38.3 39.5
55.6 52.9 55.0 55.8 47.9 47.9 47.2 72.9 55.8 32.8 67.3 45.8 60.4 71.9 65.0 73.8 55.6 73.5 45.2 54.7 41.3
65.3 62.5 50.0 45.9 38.9 43.8 38.9 70.3 37.5 59.8 81.3 50.0 68.8 60.9 65.3 70.2 55.0 71.0 47.7 44.8 45.3
65.3 60.4 65.0 64.2 52.7 48.9 38.4 54.2 37.5 36.5 75.0 51.4 60.4 78.1 57.2 79.2 55.2 80.8 44.5 54.4 45.5
52.1 55.7 55.0 57.1 47.9 56.7 47.2 62.5 58.3 32.3 72.2 45.8 60.4 71.9 67.2 84.9 66.5 88.8 45.9 36.5 4o.8
5.72 .221
4.95 .293
4.10 .392
6.45 .168
1.08 .897
1.56 .817
1.74 .784
1.58 .812
8.29 .082
3.23 .52o
7.59 .108
5.89 .207
5.06 .281
4.14 .387
1.59 .809
10.51 .033
7.53 .111
6.29 .178
2.18 .703
2.61 .626
3.99 .407
Subtype Scores
12 8.5 cfm 7.5 Mp/Cfc - 10.5 Na 4.0 Nx - 3.5
6.5 5.5 3.5 7.8 2.39 - 2.5 .5 4.5 2.5 2.02 - 6.5 -10.5 - .5 - 9.5 6.12
3.5 3.5 7.0 1.0 6.18 -10.5 -10.5 - 2.5 o .82
.663
.731
.191
.186
.936
ts.)
Cr•
MI OM 11111111 1018 0111 1111111 OM BIM MI OM en MI MI , 1111«, RIO all

Scales Team 6 (n=9)
Team 7 (n=7)
Kruskal - Wal lis X2
1. Soc. Des. Quai. 2. Att. Adol. Like 3. Alertness 4. Boldness 5. Forcefulness 6. Soc. Undes. Quai. 7. Aggress. 8. Past Diffc. 9. Present Prob. 10. Moral Or. 11. Work Sat. 12. World Sat. 13. Familiarity 14. Und. & Diff. 15. Use of Self 16. Atmosphere 17. Con. Neg. Re. 18. Inner Focus 19. Chg. & Act. 20. Firmness 21. Con. Control
66.7 52.6 62.5 44.7 38.0 29.2 25.0 64.6 41.6 21.9 82.3 54.7 62.5 75.0 74.1 84.9 55.8 84.2 40.9 28.2 28.7
70.8 70.8 77.5 73.8 54.9 41.7 49.5 71.9 25.0 42.2 87.5 54.2 62.9 75.0 58.8 75.2 61.0 70.4 44.1 53.1 39.8
11022 .314
2.53 .111
2.54 .111
8.52 .004
4.52 .034
3.66 .o56
5.69 .017 .07 .784
6.97 .008
6.57 .010 .18 .668
1.25 .264 .07 .791 .05 .831 .48 .490
3.84 .o5o
1.37 .243
8.49 .004
2.04 .153
9.81 .002
8.47 .004
Subtype Scores
1 2 Cfm Np/Cfc Na Nx
5.5 - 3.5
6.5 9.5
- 6.5
10.0 15.0
-13.8 2.7 13.0
5.67 .017
7.57 .006
11.12 .001
8.47 .003
6.19 .013
IMO ell MU MI alla MI MO INIMI Mr OM lime 11111111 11111111
Table L
Comparison of the Median Scores of Two SYC Community Teams on Interview Scales

Table M
Comparison of the Median Scores of Six SYC Group Home Teams
on Interview Scales
Scales Team 10 (n=3)
Team 11 (n=4)
Team 12 (n=4)
Team 13 (n=4, )
Team 14 Team 15 Kruskal-Wallis (n=4) (n=4) x2
1. Soc. Des. Quai. 2. Att. Adol. Like 3. Alertness 4. Boldness
5‘. Forcefulness 6. Soc. Undes. Quai. 7. Aggress. 8. Past Diffc. 9. Present Prob.
10. Moral Or. 11. Work Sat. 12. World Sat. 13. Familiarity
14 • Und. & Diff. 15. Use of Self 16. Atmosphere 17. Con. Neg. Re. 18. Inner Focus 19. Chg. & Act. 20. Firmness 21. Con. Control
65.3 62.5 47.9 63.9 54.2 65.3 2.22 .817
72.9 50.7 47.9 57.3 52.1 56.3 7.57 .182
62.5 62.5 46.3 52.8 55.8 63.8 6.82 .234
52.5 49.2 57.9 45.8 44.7 57.5 1.87 .867
43.8 39.6 46.9 47.9 35.4 54.2 7.94 .159
35.4 4 0 .6 52.1 40.9 38.8 45.1 8.40 .135
30.6 34.7 54.9 37.5 31.9 40.3 10.13 .072
68.8 56.3 56.3 68.8 50.0 54.2 4.08 .537
37.5 29.2 45.9 30.0 45.8 34.7 3.44 .632
34.4 37.5 57.8 34.4 36.5 46.9 9.52 .090
79.2 70.8 77.1 73.6 58.3 68.8 6.50 .260
58.3 47.9 43.8 54.2 40.3 62.5 11.94 .036
72.9 60.4 58.3 58.3 60.4 52.1 5.86 .321
71.9 73.9 48.5 68.8 59.4 70.6 2.03 .845
70.0 65.3 53.8 72.7 51.3 44.1 6.89 .229
80.0 83.5 73.5 75.8 75.6 74.4 .89 .971
50.2 66.3 53.8 55.0 43.9 55.8 8.91 .113
85.6 70.2 62.8 66.0 75.2 52.9 3.14 .678
40.9 41.9 50.6 45.9 41.1 44.5 8.23 .144
42.2 41.9 57.8 40.6 38.5 55.2 8.95 .111
40.5 46.0 60.0 47.7 36.1 48.0 7.46 .188
Subtype Scores
1 2 Cfm Mp/Cfc Na Nx
10.2 2.5 - 2.5 - 1.5 5.0 1.3 8.70 .122
8.5 7.0 - 11.0 - 1.5 9.5 - 3.0 7.87 .164
- 5.0 - 7.5 .5 - 9.5 -22.5 - 3.0 10.79 .056 r.›
4.5 3.5 2.5 1.0 - 1.5 1.5 4.94 .423
2.5 - 3.5 -32.5 - 6.5 -14.0 -21.5 4.82 .438
411111111 111111 , 1111111 MIN all al 1111111 IMO tilt MI tali IIIIIIIII MIS MI

2 49
Appendix 7
SYC Staff Self Ratings on the Staff Intervention Scales
April 1977

Table A
Correlation Between SYC Self and Observer Ratings on the Staff Intervention Questionnai -re
25 0
/
Scales Pearson's r
1-<- 1-_1-0711 -------------- ---- -- .062 .315
Relationships .262 .019
Motivation -.042 .375
Indiv. -.117 .194
Support -.141 .141
Values -.039 .381
Justice .061 .312
Indifference .259 .021
Autonomy .046 .365
Work with Client Group -.165 .217
Authority .295 .012
Free Time activities .361 .004
Responsibilities .146 .139
Punctuality .409 .0005
Team Work .005 .484
Group Meetings .406 .008
Child Care .276 .038
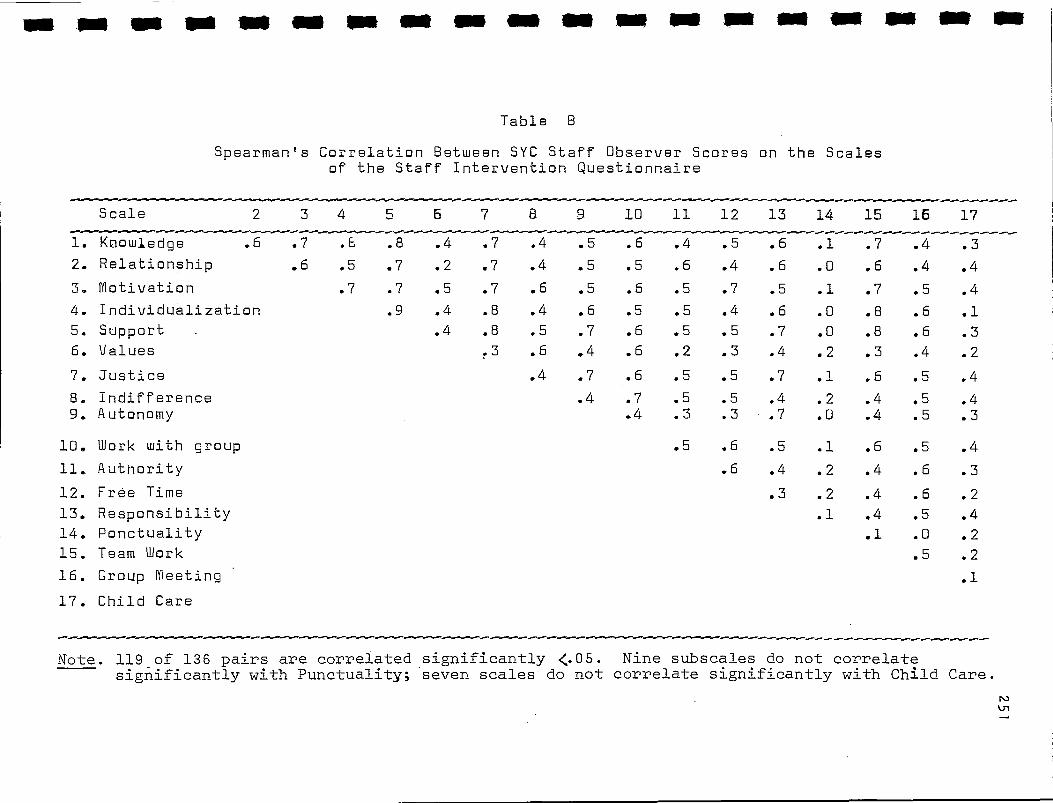
10. Work with group
11. Authority
12. Free Time
13. Responsibility 14. Ponctuality 15. Team Work
16. Group meeting •
17. Child Care
.5 .6 .5 .1 .6 .5 .4
.6 .4 .2 .4 .6 .3
.3 .2 .4 .6 .2
.1 .4 .5 .4
.1 .0 .2
.5 .2
.1
1111111 Ilia IMO 1111. IMO OM MO Ili OM Oil 1111 ale lie Ole MI OM Mt On
Table B
Spearman's Correlation Between SYC Staff Observer Scores on the Scales of the Staff Intervention Questionnaire
Scale 2 3 4 5 6 7 8 9 10 11 12 13 14 15 16 17
1. Knowledge .6 .7 .E .8 .4 .7 .4 .5 .6 .4 .5 .6 .1 .7 .4 .3 2. Relationship .6 .5 .7 .2 .7 .4 .5 .5 .6 .4 .6 .0 .6 .4 .4
3. motivation .7 .7 .5 .7 .6 .5 .6 .5 .7 .5 .1 .7 .5 .4 4. Individualization .9 .4 .8 .4 .6 .5 .5 .4 .6 .0 .8 .6 .1 5. Support . .4 .8 .5 .7 .6 .5 .5 .7 .0 .8 .6 .3 6. Values .3 .6 .4 .6 .2 .3 .4 .2 .3 .4 .2
7. Justice .4 .7 .6 .5 .5 .7 .1 .6 .5 .4 8. Indifference .4 .7 .5 .5 .4 .2 .4 .5 .4 9. Autonomy .4 .3 .3 .7 .0 .4 .5 .3
Note. 119 of 136 pairs are correlated significantly <.05. Nine subscales do not correlate significantly with Punctuality; seven scales do not correlate significantly with Child Care.
N.)

Table C
Spearman's Correlation Between SYC Staff Self Rating Scores on the Scales of the Staff Intervention Questionnaire
Scale 2 3 4 5 6 7 8 9 10 11 12 13 14 15 16 17
1. Knowledge .4 .6 .6 .6 .4 .3 .2 .4 .3 .2 .3 .5 .1 .4 -.0 .3
2. Relationships .4 .5 .6 .4 .3 .1 .5 .6 .5 .3 .4 .1 .5 .2 .3
3. Motivation .6 .7 .5 .4 .3 .3 .5 .3 .4 .5 .1 .6 .2 .4
4. Individualization .7 .5 .5 .2 .5 .6 .3 .3 .5 -.0 .7 .2 .3
5. Support .5 .5 .3 .4 .6 .5 ".5 .4 -.0 .6 .3 .5
6. Values .3 .3 .5 .6 .3 .2 .4 .2 .5 .0 .3
7. Justice .4 .5 .4 .3 .0 .4 .1 .6 .1 .1
8. Indifference .1 .2 .5 .2 .1 .0 .4 .1 .2
9. Autonomy .4 .2 .0 .6 .2 .3 -.0 .2
10. Work with group .6 .4 .3 -.0 .6 .5 .5
11. Authority .3 .1 .0 .6 .6 .3
12. Free Time .2 -.1 .5 .5 .5
13. Responsibility .0 .4 .0 .1
14. Ponctuality -.0 .0 .1
15. Team Work .5 .2
16. Croup Meeting .2
17. Child Care
Note: 92 out of the 136 pairs correlate significantly <.05.
\JI
en MN IBM 11111111 MO IS Me ISO OM Mt 11111111 111111 11113 111111 411111 OS MS all

Al MI MI OM MI MIS IBM 111111 MI OM all MI MS US Mal 11111 MU ant 111111
Table D
Comparison of the Median Self RatingsSYC Staff in the Three Treatment Settings on the Staff Intervention Scales
Scale Residence Community Group Home (n=31) (n14) (n=16)
Knowledge 7.7 7.9 7.6
Relationship 7.7 8.0 8.1
Motivation 7.6 7.9 7.9
Individualization 7.6 8.1 7.5
Support 7.4 7.4 7.5 Values 8.4 8.4 9.3
Justice 7.4 7.6 8.1
Indifference 2.8 3.3 2.6 Autonomy 7.2 8.1 8.1
Work with Group 7.6 7.2 7.9
Authority 7.6 7.2 7.6
Free Time 7.5 6.8 6.6
Responsibility 7.8 8.8 7.9
Punctuality 8.3 8.5 9.1 -
Team Work 7.2 7.4 7.5
Group Meeting 7.4 - 6.5
Child Care 7.9 - 8.1

Table E
Comparison of the Counsellers', Houseparents', and Caseworker& Median Self Ratings on the Staff Intervention Scale
Counsellers Houseparents Caseworkers Kruskal - Wullis Scale (n:29) (n=10) (n=22) X2
Knowledge 7.6 6.7 7.7 .56 .754
Relationship 7.8 8.3 7.6 2.92 .232
Motivation 7.6 7.9 7.9 2.32 .314
Individualization 7.5 7.2 8.0 4.96 .084
Support 7.3 7.1 7.5 1.13 .569
Values 8.3 9.3 8.8 3.30 .192
Justice 7.5 7.3 8.1 1.71 .426
Indifference 2.5 2.9 2.7 .26 .879
Autonomy 7.3 8.1 8.1 7.45 .024 ,
Work with Croup 7.9 8.0 7.0 5.03 .081
Authority 7.6 7.7 6.9 4.71 .095
Free Time 7.6 6.0 6.8 9.81 .007
Responsibility 7.8 7.5 8.8 10.20 .006
Punctuality 8.3 9.5 8.6 6.08 .048
Team Work 7.2 7.4 7.3 3.19 .203
Group Meeting 7.4 7.1 - .24 .887
Child Care 8.0 8.6 - 2.13 .344
■.n
MI OM MI I» IN Ole MO MO Me OM OW Mg 111111 1111111 IMO 1110 ISM

11111 Mg MIR MS MID Ole OM MO OM III MI UM US IMO OM CO INS OM
Table F
Comparison of SYC Residential Tees. Median Self Ratings on the Staff Intervention Scales
Team 1 Team 2 Team 3 Team 4 Team 5 Kruskal-Wallis (n=7) (n=5) (n=7) (n=6) (ne.6) X 2 P ----------------------------------------------
Knowledge 8.0 8.2 6.9 7.1 7.9 .329 .5i1
Relationship 8.2 8.0 8.0 6.5 7.6 8.78 .067
motivation 8.1 7.9 6.9 7.6 7.5 2.58 .630
Individualization 7.7 8.3 7.0 5.9 7.3 4.04 .400
Support 7.5 7.6 7.0 7.0 7.0 3.58 .467
Values 8.3 8.9 8.2 8.2 8.9 2.75 .599
Justice 7.5 7.5 7.5 6.6 7.4 1.81 .770
Indifference 2.7 2.8 2.3 3.1 3.7 6.70 .152
Autonomy 6.9 8.0 7.2 6.5 7.7 5.77 .217
Work with Group 8.1 8.3 7.4 6.9 7.7 3.86 .426
Authority 7.9 8.1 7.6 7.6 6.8 5.54 .237
Free Time 7.2 8.8 7.4 6.9 7.3 5.10 .277
Responsibility 7.2 8.3 7.7 7.3 8.1 4.62 .329
Punctuality 7.5 8.6 8.1 7.8 8.8 2.01 .733
Team Work 7.3 8.1 7.2 7.1 7.0 5.45 .244
Group meeting 7.7 6.2 6.3 6.2 5.8 3.30 .509
Child Care 8.2 8.5 7.7 7.8 7.8 5.52 .238
Scale

Table G
Comparison of the SYC Community Teame Median Self Ratings on the Staff Intervention Scales
Team 6 Team 7 Kruskal-Wallis Scale (n=8) (n=6) X2
Knowledge 7.8 8.1 -1.04 .301 Relationship 7.9 8.5 - .98 .328 Motivation 7.5 8.3 -1.24 .217 Individualization 7.7 8.6 -1.36 .173 Support 7.2 8.5 -1.95 .051 Values 8.3 9.2 - .73 .466 Justice 7.6 7.6 - .65 .515 Indifference 4.1 2.2 -1.23 .217 Autonomy 8.2 8.1 - .07 .948
Work with Croup 7.1 7.9 - .07 .948 Authority 6.4 8.3 -2.34 .019 Free Time 6.0 7.2 -1.65 .099 Responsibility 8.8 8.9 - .14 .893
Punctuality 8.6 7.1 .14 .892
Team Work 6.9 8.3 -1.30 .193
Croup Meeting _ _ - - -
Child Care - - - -
1.1111 eon MO «II is se Milt MN Me Ili Mg OM UM I» MP Ill. OM

Me es as UM IMO all all OM INS 111111 MI Mt OM UN IMO OM
Table H
Comparison of the SYC Croup Home Teams' Median Self Ratings on the Staff Intervention Scale a
Team 10 Team 11 Team 12 Team 13 Team 14 Team 15 Scale (n=2) (n=3) (n=3) (n=2) (n=3) (n=3) Kn-Owledge 5.8 7.5 Relationship 8.3 8.5 7.1 9.1 7.3 7.8 Motivation 7.3 8.1 7.6 9.1 7.9 7.8 Individualization 7.8 8.7 6.3 7.5 7.7 8.0 Support 7.5 7.6 6.5 8.1 7.6 6.9 Values 9.4 8.4 6 .3 10.0 9.4 9.(3 Justice 6.9 9.2 7.5 7.7 7.2 8.6 Indifference 1.4 1.8 1.7 2.8 2.8 2.8 Autonomy 8.3 8.1 6.9 7.9 7.4 8.3 Work with Croup 7.9 8.8 6.4 8.9 7.6 7.6 Authority 7.0 8.4 7.1 8.1 7.1 7.9 Free Time 6.3 6.5 5.7 8.8 5.8 5.8 Responsibility 7.5 7.9 6.6 8.9 7.2 8.3 Punctuality 9.3 8.6 8.9 10.0 8.9 9.7 Team Work 6.8 9.0 7.7 8.9 7.1 7.5 Croup Meetin 4.2 8.3 7.1 7.9 6.6 6.7 Child Care 8.9 8.1 5.6 8.4 9.4 6.9
a * No statistical tests run due to small number of respondents.

APPENDIX 8
SYC Youths' Satisfaction with their Workers
258

Table A
• SYC Residential and Group Home Youths' Satisfaction a
with their Workers at Five Points in Time
259
Time Youth Very Very No
n k Sat. Sat. 50/50 Dissat. Dissat. Response ..... (80-100)" (60-79) • (4n-59) (20-39) (0-19)
March
1976 69 39.1 36.2 8.7 8.7 4.3 2.9
June
1976 34 c 52.9 32.4 5.9 2.9 2.9 2.9
Oct. 1976 68 44.1 25.0 19.1 4.4 4.4 2.9
April 1977 64 39.0 28.1 17.2 10.9 3.1 1.6
Oct. 1977 76 36.8 35.5 14.5 9.2 2.6 1.3
Over ,- all 311 41.1 31.5 13.8 7.7 3.5 2.3
a Numbers are in percentages.
Score range.
Few group home youth answered any questionnaires during the June
administration.
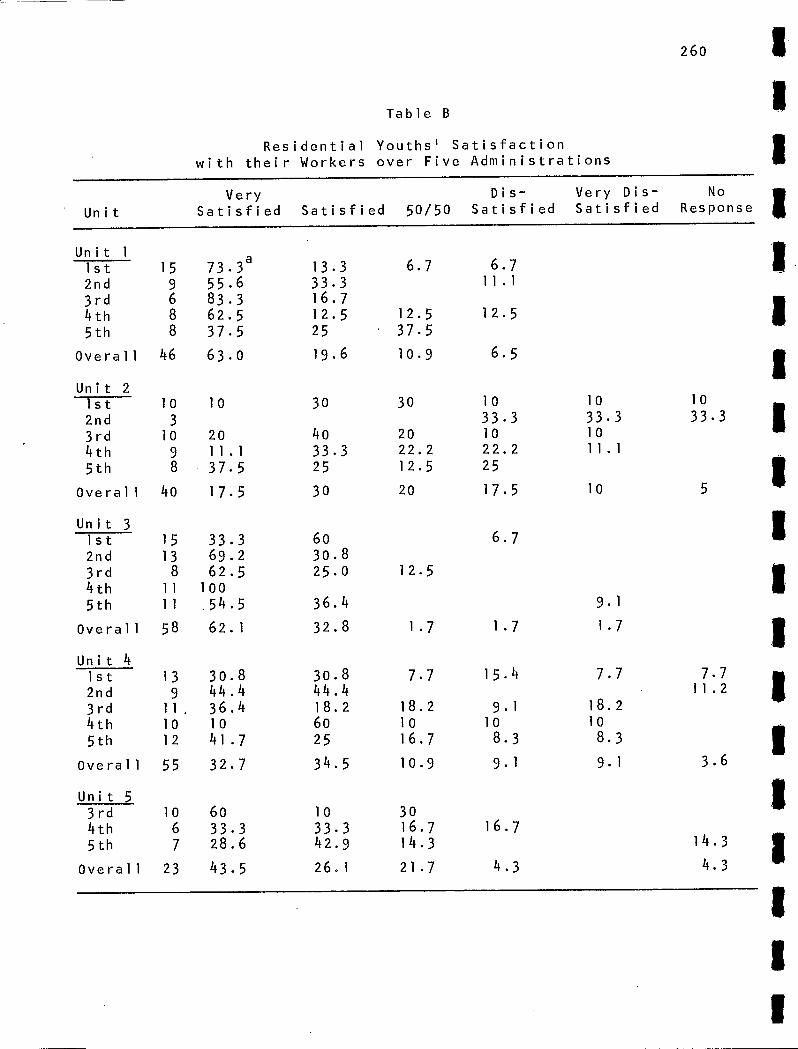
10
1 4.3
30 16.7 14.3
16.7 33.3 42.9
6.7 11.1
12.5
6.5
60 30.8 25.0
6.7
12.5
36.4 9.1
260
Table B
Residential Youths' Satisfaction with their Workers over Five Administrations 1
Unit
Very Dis- Very Dis- No Satisfied Satisfied 50/50 Satisfied Satisfied Response II
Unit 1 1st 15 73.3 a 13.3 6.7 2nd 9 55.6 33.3 3rd 6 83.3 16.7 4th 8 62.5 12.5 12.5 5th 8 37.5 25 37.5
Overall 46 63.0 19.6 10.9
Unit 2 1st 10 10 30 30 10 10 10 2nd 3 33.3 33.3 33.3 3rd 10 20 40 20 10 10 4th 9 11.1 33.3 22.2 22.2 11.1 5th 8 37.5 25 12.5 25
Overall 40 17.5 30 20 17.5 10 5
Unit 3 1st 15 33.3 2nd 13 69.2 3rd 8 62.5 4th 11 100 5th 11 54.5
Overall 58 62.1 32.8 1.7 1.7
Unit 4 1st 13 30.8 30.8 7.7 15.4 7.7 7.7 2nd 9 44.4 44.4 11.2 3rd 11, 36.4 18.2 18.2 9.1 18.2 4th 10 10 60 10 10 10 5th 12 41.7 25 16.7 8.3 8.3
Overall 55 32.7 34.5 10.9 9.1
Unit 5 3rd 10 60 4th 6 33.3 5th 7 28.6
Overall 23 43.5 26.1 21.7 4.3
1.7
9.1 3.6
4.3

APPENDIX 9
Staff Turnover
261

New Workers
Original Workers Group Ti
New Workers , Who
Transfer/Resign
Workers Who
Transfer/Resign
Table A
Movement of SYC Staff Groups from March 1976 to March 1977
tsa
Residential Teams 33 19 57.6 25 4 16.0 1 7 3 42.9 2 0 2 7 5 71.4 5 o
3 7 2 28.6 3 o 4 7 5 71.4 6 2 33.3 5 5 4 57.1 9 2 22.2
Community Teams 13 3 23.1 5 0
6 9 2 22.2 2 0
7 4 1 25.0 3 0
Group Homes 18 a 14 77.8 13 6 46.2
9 3 3 100.0 Home Closed
Io 5 5 100.0 7 5 71.4
11 6 4 66.7 3 i 33.3 12 5 2 4 0 . 0 3 o
Total Agency 64 36 56.3 43 10 23.3
a One supervisor coordinates two homes. He is counted in each and once in the total.
Me Ole MID IMO MI MID MI 1111118 al ON Mill 1111111 OM OM Mgt IMO MI URI 11111111

APPENDIX 10
Distribution of Workers and Youth In each Unit by I-Level and Conceptual Level
263

Table A
Distribution of Youth I-Level Subtype and Worker Type in SYC Residential Units
N.)
Youth Subtype in % Unit Time n I 2/Cfm Mp/Cfc Na Nx Other
Worker Type (Sept. 76 to mar. 77) I 2 /Cfm Mp/Cfc Na Nx M I MM M I MM M I MM M I MM
1 1 18 16.7 83.3 2 10 100.0
2 1 14 85.7 14.3 2 14 92.7 7.1
3 1 15 86.7 13.3 2 15 66.7 6.7 20.0 6.7
4 1 13 23.1 46.2 30.8 2 12 58.3 25.0 8.3 8.3
5 1 9 11.1 55.6 33.3 2 11 36.4 45.5 18.2
7 3 22 0 4 3 151 133
7 043 05 2 151 133
7 151 2 05 2 50 05 2
8 1 6 1 341 341 06 2
7 3 22 043 05 2 14 2
Note. M r. Matched; I Intermediate; MM Mismatched
a Significant change in youth subtype distribution from T 1 to T 2.
OM MS IMO Mill OM IMP OM MI OM OBI Mk ire en or as

VII MI all MS SIM UM UM en Ina Ina MS fin MIS re es MI an US
Table B
Distribution of Youth Subtype and Worker Type in SYC Community Units
Youth Subtype in % Unit Time n 1 2/Cfm Mp/Cfc
Na Nx Other
Worker Type (June 76 to Sept. 77) I2/Cfm Mp/Cfc Na Nx M I MM M I MM M I MM M I MM
6 1 45 33.3 4.4 4.4 57.8 2 56 30.4 1.8 3.6 64.3
7 1 28 10.7 57.1 32.1 2 41 7.3 12.2 78.0 2.4
9 7 20 02 7 1 53 45 0
7 1 33 5 20 5 20 1 33
Note. M = Matched; I = Intermediate; MM = Mismatched
a Change in youth subtype distribution from T 1 to T 2 .

Table C
Distribution of Youth Subtype and Worker Type in SYC Group Home Units
Worker Type (Nov. 76 to March 77) Youth Subtype in % 1 /Cfm Mp/Cfc Na Nx
Unit Time 12/Cfm Mp/Cfc Na Nx Other n M
2 I MM M 1 MM M 1 MM M 1 MM
1 1
10 1 7(1) 2 2 6(1)
1 4 50.0 50.0 2 5(1) 40.0 40.0 20.0
12 1 4(1) 50.0 50.0 2 6 50.0 50.0
13 b 1 5 20.0 80.0 2 4 50.0 50.0
14 1 Not open 2 7 57.1 42.9
15 1 Not open 2 8 37.5 62.5
28.6 71 .4
16.7 83.3 3(1)1 2 0 0 2 1 0 3 0 0 3 0
4 040 11 2 130 040
4 01 3 211 031 0??
4 22 0 0 22 0 4 0 1 2 1
4 220 0 04 0 22 112
4 121 130 031 11 2
Note. M Matched; 1 -.2 Intermediate; MM ...: Mismatched
a Numbers in parentheses indicate missing cases.
Change in youth subtype distribution from T 1 to T 2 .
NJ
Mill INS 111111 INS 1111111 MI Mil OM Me 11111111 Mil OM MO an as au an se
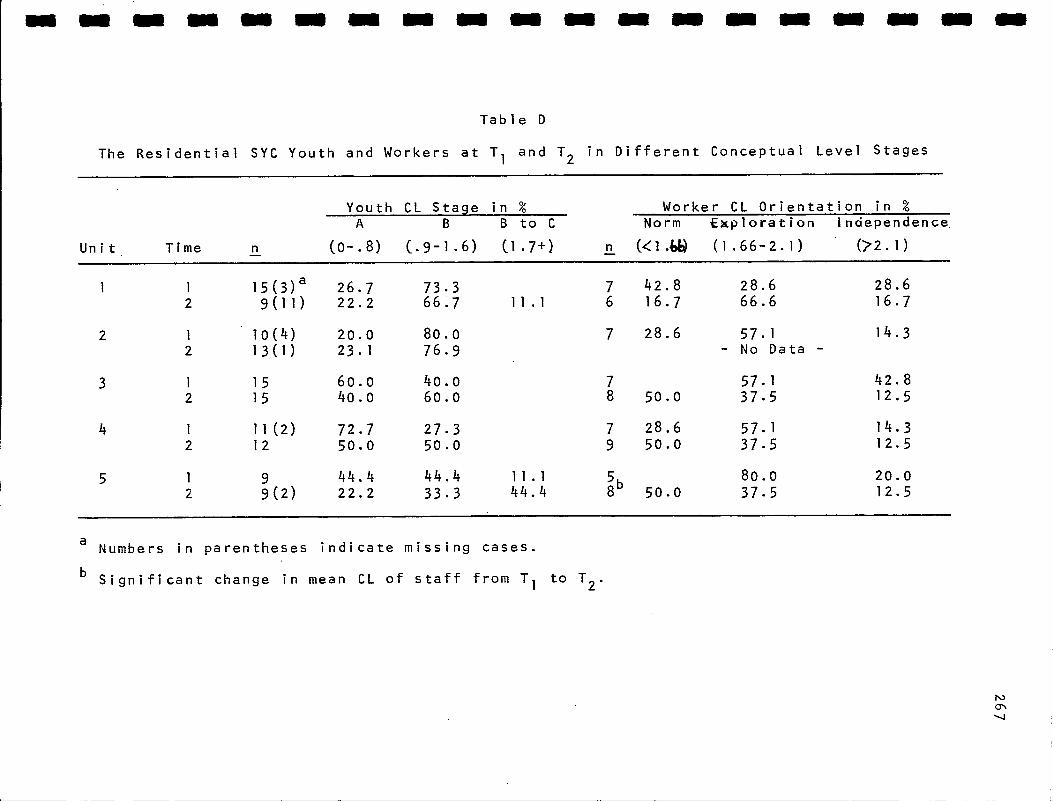
7 28.6 57.1 14.3 - No Data -
2 1 10(4) 20.0 80.0 2 13(1) 23.1 76.9
MI INS WI MO Ile MI Mal MS MI UM OM 1111111 Re MI US OM MO OM UM
Table D
The Residential SYC Youth and Workers at T 1 and T 2 in Different Conceptual Level Stages
Youth CL Stage in % Worker CL Orientation in % A B B to C Norm Exploration independence
Unit Time n (0-.8) (.9-1.6) (1.7+) n (<1.b (1.66-2.1) ( ?2.1) _ 1 1 15(3) a 26.7 73.3 7 42.8 28.6 28.6
2 9(11) 22.2 66.7 11.1 6 16.7 66.6 16.7
3 1 15 60.0 40.0 7 57.1 42.8 2 15 40.0 60.0 8 50.0 37.5 12.5
4 1 11(2) 72.7 27.3 7 28.6 57.1 14.3 2 12 50.0 50.0 9 50.0 37.5 12.5
5 1 9 44.4 44.4 11.1 5b 80.0 20.0
2 9(2) 22.2 33.3 44.4 8 50.0 37.5 12.5
a Numbers in parentheses indicate missing cases.
b . . Significant change in mean CL of staff from T 1 to 1 2 •

Table E
Distribution of the Conceptual Level Stages of SYC Youth and Staff in Community Units at T i and T2
OD
Youth CL Stage in % Worker CL Orientation in %
A B B to C Norm Exploration independence
Unit Time n (o - .8) (.9 - 1.6) (1.7+) n (<1.41) (1.66 - 2.1) (>2.1)
6 1 30(18) a 30.0 66.7 13.3 9 0.0 44.4 55.6 2 42(14) 33.3 59.5 7.1 8(1) 0.0 75.0 25.0
1 25(10) 24.0 60.0 16.0 4 0.0 50.0 50.0 2 35( 6) 31.4 54.3 14.3 5 20.0 60.0 20.0
7
a Numbers in parentheses indicate missing cases.
UM Ili 111111 IMO MO UM IMO 11111111 Ole MO IMO IMO OM OM fall OM

UM WM 1•11 SIM MIS UM MI MI MI Mil IIIIII UM MI MI 01111 UM IRO ill Me
Table F
Distribution of the Conceptual Level Stages of SYC Youth and Workers in Group Homes at T 1 and 12
Youth in CL Stage in % Worker CL Orientation in % A B B to C Norm Exploration Independence
Unit Time n (o-.8) (.9-1.6) (1.7+) n (<1.4) (1.66-2.1) ( n. 1) _ "
10 1 7(1) a 14.3 85.7 5 20.0 60.0 20.0 2 7 14.3 85.7 5 40.0 60.0
11 1 4 25.0 25.0 50.0 6(1)20.0 60.0 20.0 2 6 33.3 66.7 6 33.3 33.3 33.3
12 1 3(2) 33.3 66.7 5 80.o 20.0 2 4(2) 25.0 50.0 25.0 2 50.0 50.0
13 1 5 8 0 . 0 20.0 - No Data - 2 4 75.0 25.0 5(1) 100.0
14 I Not Open 2 7 14.3 85.7 6 50.0 33.3 16.7
15 1 Not Open 2 8 25. 0 5 0 . 0 25. 0 6 33.3 66.7
a Numbers in parentheses indicate missing cases.

APPENDIX 11
Comparison of the Characteristics of High
and Lower Conceptual Level SYC Staff
270

Characteristic dr p
•
Demographic Male Female
18 81.8 20 66.7 .81 1 .368
4 18.2 10 33.3
[:
6.52 3 .089
3.55 1 .059
111 271
Table A
Comparison of the Back ground and Personal Characteristics of High and Lower Conceptual Level S.Y.C. Staff
Lower CL _Chi=S.guare •
Single 8 36.4 9 30.0 Married 14 63.6 20 66.7 .91 2 .635 Sep/Div. 0 0.0 1 3.3
Employment PreV. Empl. Not prev. empl.
16 72.7 25 83.3
6 27.3 5 16.7 .34 1 .561
Prev. related emp1.10 No prey. " tt 6
62.5 15 57.7
37.5 11 42.3 .00 1 .988
Education No diploma/degree 1 4.5 12 40.0 CEGEP 4 45.5 8 26.7 Undergraduate 10 31.8 5 16.7 17.26 4 .002
Graduate 7 18.2 2 6.7 Other 0 0.0 3 10.0
•Certification program
None 18 81.8 22 73.3 CEGEP 0 0.0 5 16.7 Undergrad. 2 9.1 3 10.0
Graduate 2 9.1 0
Other 0
Staff development courses
Took courses 14 63.6 10 33.3
Did not courses 8 36.4 20 66.7

272 1 1
Table A (continued)
---------- II
h_CL.._ Lower C .4. IgD_Ozilibit,D.e4. Characteristics - (ng227- --5--.:30T
M Sp M SO U P- II
Demographic 11 Age 28.2 6.7 31.3 7.5 398.0 .207
Employment
Mos. Related Exp. 75.6 38.2 60.4 32.5 248.5 .131 II
Work History at SYC Mos. with syc 39.2 23.7 24.3 21.7 200.5 .016 II Mos. in present
unit 25.5 14.1 13.6 12.6 159.5 .002 Prey. units .9 .9 .7 .8 304.0 .605
II Preferences for Treatment approaches Accepting Friend 52.5 9.2 52.9(l a 8.1 328.0 .863 II Big Brother 50.1 15.6 53.0(1 7.6 348.0 .578 Control Structure 53.0 8.6 53.1(1 7.2 314.0 .924 Behavior Reality 56.9 10.5 50.5(1) 9.7 207.0 .032 II Insight Reality 57.3 9.2 54.8(1) 8.4 262.0 .273
Factors Influencing II Style
Conceptual Level 2.4 .2 1.5 ...2 0 .000 II Repression-.
Sensitization 20.4 10.5 25.5(2) 15.9 354.5 .363
_ II a Numbers in parentheses indicate missing cases.
II
II
II
II
11

Table B
Comparison of High and Lower Conceptual Level SYC Staff on Subtype Scores and Interview Scales
273
Subtype Scores High CL Lower CL Cri=15) (n=11) Mann-Whitney
so
Iz 6.0 7.5 4.4 4.5 56.0 Cfm 5.4 11.6 3.1 9.2 66.5 Mp/Cfc - .7 9.2 -9.5 12.6 40.5 Na 7.1 4.7 1.2 4.3 24.5 Nx 1.9 20.9 -6.8 13.8 57.7
.167
.406
.029
.003
.194
Interview Scales
1. Soc. Des. Qua1. 67.9 14.3 57.8 3.3 44.0 .046
2. Att. Adol. Like 61.5 12.7 56.2 10.9 59.5 .231
3. Alertness 67.8 18.3 53.4 11.3 46.5 .061 4. Boldness 58.8 16.8 54.5 1.6.6 75.0 .697 5. Forcefulness 49.4 9.7 48.1 13.2 70.5 .531 6. Soc , Undes.
Qual. 41.9 16.1 45.6 13.4 95.0 .515 7. Aggress. 35.1 18.7 37.5 11.1 92.0 .622 B. Pest. Di rfc. 68.3 14.8 59.1 12.9 49.5 .077 9. Present. Prob. 32.8 15.5 50.8 15.3 131.0 .011 10. Moral Or. 33.9 16.0 36.4 11.9 94.0 .549 11. Work Sat. 81.4 13.3 77.6 10.2 61.5 .271 12. World Sat. 50.8 9.6 52.7 18.7 88.5 .754 13. Familiarity 62.9 10.4 65.5 8.3 92.5 .602 14. Und. & Diff. 76.0 15.3 66.2 11.3 47.0 .064 15. Use of Self 67.7 14.9 62.8 12.6 70.5 .533 16. Atmosphère 80.9 12.0 78.5 9.1 62.0 .287 17. Con. Neg. 58:5 9.7 59.6 12.9 80.5 .917 18. Inner Focus 79.3 12.9 72.0 12.6 50.0 .092 19. Cg. & Act. 45.4 5.3 44.3 6.5 79.5 .876 20. Firmness 42.6 16.6 47.9 11.0 104.0 .263 21. Con. Control 43.1 17.8 43.2 16.7 92.5 .604
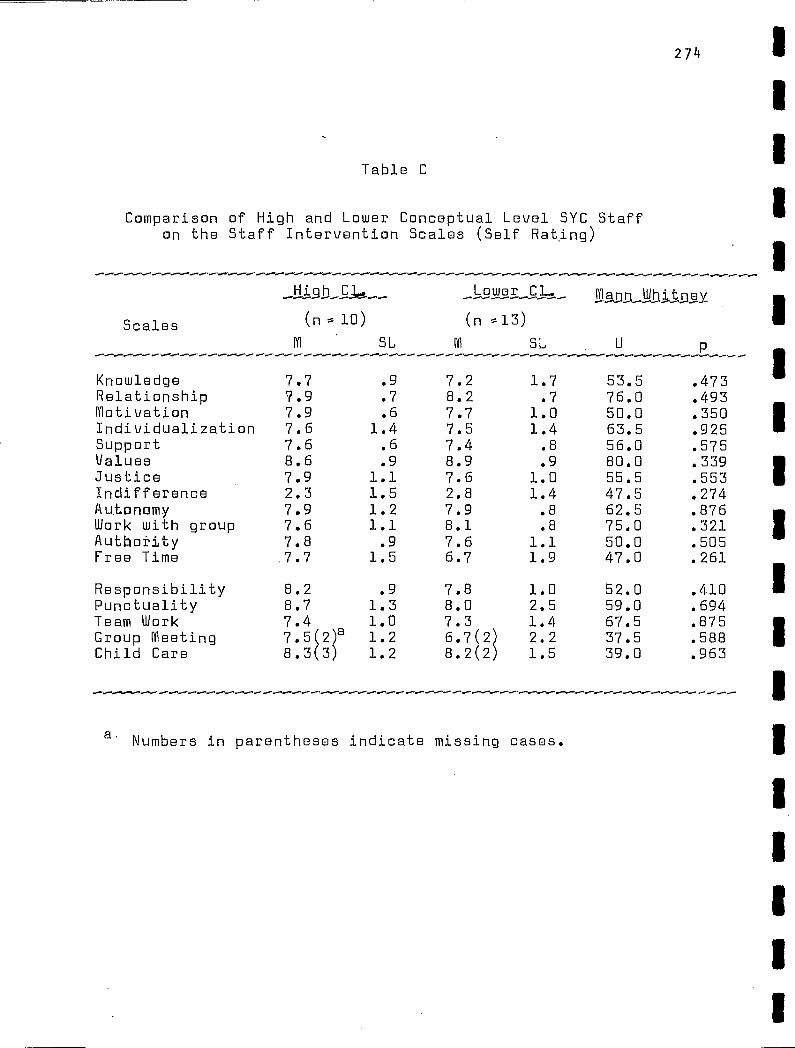
274
11
Table C
11 Comparison of High and Lower Conceptual Level SYC Staff on the Staff Intervention Scales (Self Rating)
II _Hi .gh_Cl.. Lower Cl.. Mann Whitney
Scales (ne 10) (n el3) 11 M SL M SL U P
11 Knowledge 7.7 .9 7.2 1.7 53.5 .473 Relationship 7.9 .7 8.2 .7 76.0 .493 Motivation 7.9 .6 7.7 1.0 50.0 .350
11 Individualization 7.6 1.4 7.5 1.4 63.5 .925 Support 7.6 .6 7.4 .8 56.0 .575 Values 8.6 .9 8.9 .9 80.0 .339
11 Justice 7.9 1.1 7.6 1.0 55.5 .553 Indifference 2.3 1.5 2.8 1.4 47.5 .274 Autonomy 7.9 1.2 7.9 .8 62.5 .876 Work with group 7.6 1.1 8.1 .8 75.0 .321 II Authoity 7.8 .9 7.6 1.1 50.0 .505 Free Time 7.7 1.5 6.7 1.9 47.0 .261
Responsibility 8.2 .9 7.8 1.0 52.0 .410 II Punctuality 8.7 1.3 8.0 2.5 59.0 .694 Team Work 7.4 1.0 7.3 1.4 67.5 .875
1 Group Meeting 7.5(qa 1.2 6.7(9 2.2 37.5 .588 Child Care 8.3(3 1.2 8.2(2 1.5 39.0 .963
II
a Numbers in parentheses indicate missing cases. 11
II
II
11
II
II

APPENDIX 12
Comparison of the Characteristics of Versatile
and Non-Versatile SYC Staff
275

276
1 Table A
Comparison of the Background and Personal Characteristics II of Versatile and Non-Versatile a S.Y.C. Staff •
Versatile Non-versatile Chi-Square 11
------- - -
Characteristic N % N % 'Xl df P-
Demographic: Male
9 81.8 11 68.8 .099 1 .753 11
Female 2 18.2 5 31.3
Single 4 36.4 5 31.3 II Married 6 54.5 9 56.3 .122 2 .941 Sep./Div. 1 9.1 2 12.5 IIEmployment: Prey. Empl. 8 72.7 9 56.3
.217 1 642 Not. prev. empl. 3 27.3 7 43.8 .
II Prey , related empl. 6 75.0 5 55.6 b
.33
No prev. " " 2 25.0 4 44.4
Education: II No diploma/degree 0 0.0 4 25.0 CEGEP 2 18.2 2 12.5
II Undergraduate 6 54.5 8 50.0 3.82 4 .430 Graduate 2 18.2 1 6.3 Other 1 9.1 1 6.3
II
Certification Program: None 9 81.8 13 81.3 II CEGEP 0 0.0 1 6.3 Undergraduate 1 9.1 2 12.5 2.21 3 .529 Graduate 1 9.1 0 0.0
II Other 0 0.0 0 0.0
Staff Development II Courses:
Took Courses 7 63.6 4 25.0 2.59 1 .108 Did not courses 4 36.4 12 75.0
II- - - -- -
a Versatile workers are "treater-matched" to two or more youth I-levelll subtypes and not mismatched to any; non-versatile workers aré mismatched to two or more youth subtypes'and not matche4 th- any.
h IIFisher's Exact Test of Significance.
1

8.9 11.6 6.1 7.8 6.2
50.8(9 7.9 53,7(2 12.1 55.7(2) 4.9 53.5(1 9.3 54.7(2 8.3
90.0 74.5 50.5 99.0 83.5
.471
.890
.143
.225
.716
Table A (continued)
277
Characteristics Versatile, Non-versatile Crow)
si SD • rt'ann-Uhitnéy
p
Demographic:
Age 29,2 :-- 4.2 26.6 9.9 113.0 - .214
Employment:
Mos. Releted Exp. 70.5 28.7 41.4 33.0 140.5 .009
Work History at SYC: Mos. with SYC 41.8 19.8 22.6 13.4 139.0 .012 Mos. in present
unit 24.1 19.5 20.0 12.5 91.5 .863 Prey. units 1.4 1.1 .3 .6 140.0 .004
Preferences for treatment approaches: Accepting Friend 53.2 Big Brother 53.3 Control Structure 52.5 Behavior Reality 58.0 Insight Reality 55.8
Factors Influencing Style:
Conceptual Level 2•2(1) a .4 1.9(1) .3 111.5 .042 Repression - Sensitization 23.4(2) 10.1 17.4(3) 7.0 81.5 .124
a Numbers in brackets indicate missing cases.
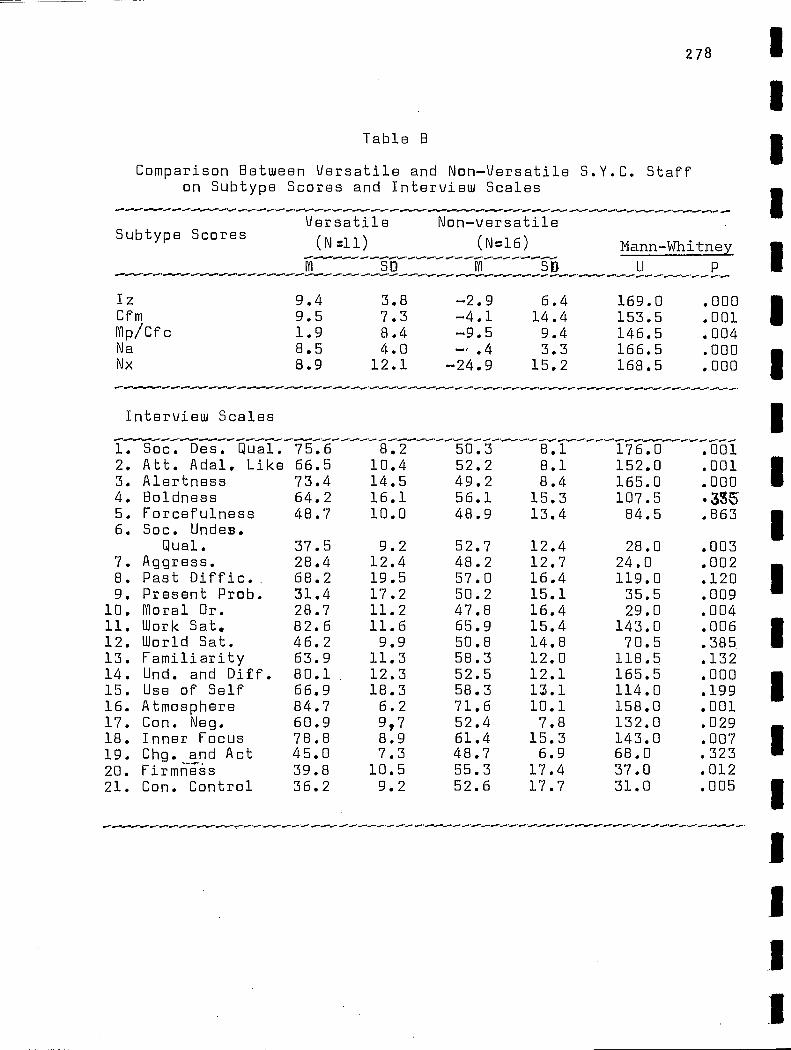
278 1
Table
Comparison Between Versatile and Non-Versatile S.Y.C. Staff on Subtype Scores and Interview Scales
Versatile Non-versatile (N=11) (N=16) Mann-Whitney
FYl SD m Sp U P11
Iz 9.4 3.8 -2.9 6.4 169.0 .000 Cfm 9.5 7.3 -4.1 14.4 153.5 .001 Mp/Cfc 1.9 8.4 -9.5 9.4 146.5 .004 Na 8.5 4.0 -. .4 3.3 166.5 .000 Nx 8.9 12.1 -24.9 15.2 168.5 .000
Subtype Scores
Interview Scales
1. Soc. Des. Qual. 75.6 8.2 50.3 8.1 176.0 .001 2. Att , Adal. Like 66.5 10.4 52.2 8.1 152.0 .001 1 3. Alertness 73.4 14.5 49.2 8.4 165.0 .000 4. Boldness 64.2 16.1 56.1 15.3 107.5 . e5 5. Forcefulness 48.7 10.0 48.9 13.4 84.5
. 863 II 6. Soc. Undes. 1ua1. 37.5 9.2 52.7 12.4 28.0 .003
7. Aggress. 28.4 12.4 48.2 12.7 24.0 .002 8. Past Diffic.. 68.2 19.5 57.0 16.4 119.0 .120 II 9. Present Prob. 31.4 17.2 50.2 15.1 35.5 .009 10. Moral Or. 28.7 11.2 47.8 16.4 29.0 .004 11. Work Sat, 82.6 11.6 65.9 15.4 143.0 .006 II 12. World Sat. 46.2 9.9 50.8 14.8 70.5 .385 13. Familiarity 63.9 11.3 58.3 12.0 118.5 .132 14. Und. and Diff. 80.1 12.3 52.5 12.1 165.5 .000 II 15. Use of Self 66.9 18.3 58.3 13.1 114.0 .199 16. Atmosphere 84.7 6.2 71.6 10.1 158.0 .001 17. Con. Neg. 60.9 9,7 , 52.4 7.8 132.0 .029 18. Inner Focus 78.8 8.9 61.4 15.3 143.0 .007
II 19. Chg. and Act 45.0 7.3 48.7 6.9 68.0 .323 20. Firmness 39.8 10.5 55.3 17.4 37.0 .012 21. Con. Control 36.2 9.2 52.6 17.7 31.0 .005 II
il

Scales (n =7) (n11)
Table C
Comparison of Versatile and Non-Versatile SYC Workers on Staff Intervention Scales (Self Ratings)
279
Versatile Non-Versatile Mann-Whitney
-§n m - sb- .....
Knowledge ' 7.7 1.0 7.4 1.5 42.0 .751 Relationship 8.2 .9 7.3 .5 63.5 .022 Motivation 7.9 .9 7.5 1.1 42.0 .749 Individualization 7.2 1.2 7.1 1.5 40.5 .855 Support 7.5 .9 7.0 .9 45.5 .525 Values 8.4 .7 8.1 1.2 43.0 .672 Justice 7.8 .9 7.2 .9 54.0 .157 Indifference 2.3 1.2 2.1 .7 35.0 .742 Autonomy 7.9 1.1 6.9 1.2 53.5 .173 Work with Croup 7.3 .9 7.5 .9 30.0 .625 Authority 7.8 1.2 7.6 .7 46.5 .258 Free Time 6.9 1.1 7.2 2.1 35.5 .784 Responsibility 8.6 1.2 7.4 1.1 61.0 .039 Puntuality 8.2 1.9 8.9 1.1 30.5 .442 Team Work 7.3 .7 7.4 1.0 34.5 .713 Croup Meeting 7
•9(4) - .6 7.2(2) 1.8 11.0 .633
Child Care 7.9(3) 1.1 7.3(2) 3.0 13.0 .926
a Numbers in parentheses indicate missing cases.

Appendix 13
Comearison of the Characteristics of Stayers
28 0

Stayers Lea vers Chi-Square
X 2 df Characteristics
Table A
Comparison of the Background and Personal Characteristics between SYC Staff Who Stay Longer that Two Years in a Unit
and Those Who Leave Within a Year
281
Demographic Male Female
24 77.4 14 56.0 2.01 1 .156
7 22.6 11 44.0
Single 11 35.5 10 40.0 Married 19 61.3 10 40.0 4.92 2 .085 Sep/Div. 1 3.2 5 20.0
Employment Prey, Empl. 23 74.2 10 76.0 Not prey. empl. 8 25.8 6 24.0
Prey, related emp1.13 56.5 11 57.9 No prey. " " 10 43.5 8 42.1
.02 1 .877
1 .823
Education No diploma degree 4 12.9 8 32.0 CEGEP 11 35.5 5 20.0 Undergraduate 10 32.3 6 24.0 4.33 4 .363 Graduate 4 12.9 3 12.0 Other 2 6.5 3 12.0
Certification Program None 22 71.0 17 68.0 CEGEP 4 12.9 4 16.0 Undergraduate 3 9.7 4 16.0 2.17 3 .539 Graduate 2 6.5 0 Other 0 0
Staff Development Courses
Participated 19 61.3 8 32 Did not 3.65 1 .056
participate 12 38.7 17 68
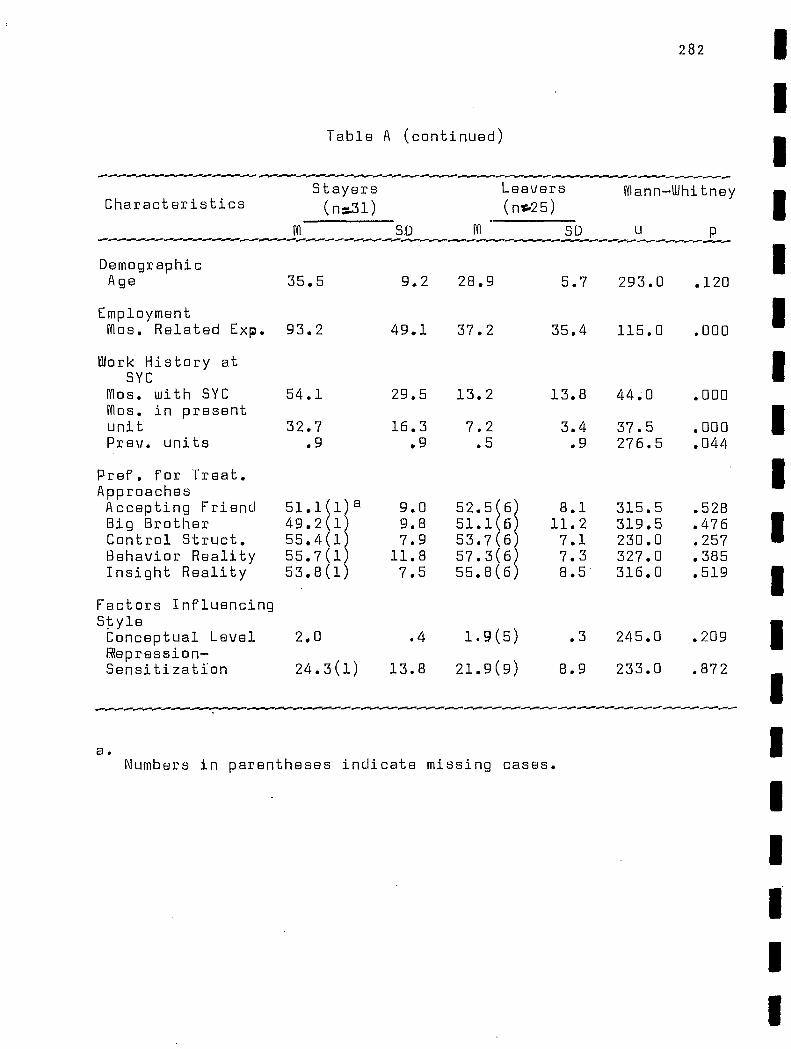
282
Table A (continued)
Stayers Leavers Characteristics (n=31) (ns,25)
Mann-Whitney 11
M SD M SD u p ----
Demographic 11 Age 35.5 9.2 28.9 5.7 293.0 .120
Employment II Mos. Related Exp. 93.2 49.1 37.2 35.4 115.0 .000
Work History at II SYC
Mos. with SYC 54.1 29.5 13.2 13.8 44.0 .000 Mos. in present unit 32.7 16.3 7.2 3.4 37.5 .000 II Prev. units .9 .9 .5 .9 276.5 .044
Pref. for Treat. II Approaches Accepting Friend 51.1(1 a 9.0 52.5i6 8.1 315.5 .528 Big Brother 49.2(1 9.8 51.1(6 11.2 319.5 .476
II Control Struct. 55.4(1 7.9 53.7(6 7.1 230.0 .257 Behavior Reality 55.7(1 11.8 57.3(6 7.3 327.0 .385 Insight Reality 53.8(1 7.5 55.8(6 8.5 316.0 .519
II Factors Influencing Style Donceptual Level 2.0 .4 1.9(5) .3 245.0 .209 II Repression- Sensitization 24.3(1) 13.8 21.9(9) 8.9 233.0 .872
11
a. Numbers in parentheses indicate missing cases.

283
Table B
Comparison Between SYC Staff who Stay in a Unit Longer Than Two Years and Those who Leave Within one Year on
Subtype Scores and Interview Scales
Stayers ------n'avers Mann-Wbitney, (n=28) (ne..,14)
Subtype Scores M sià M SD U --P
4.7 7.1 4.9 4.9 185.0 .768
3.2 11.7 6.6 13.6 214.0 .631
-3.7 10.5 -8.8 10.9 153.5 .256
4.8 4.9 2.1 5.5 146.0 .181
-5.2 17.9 -4.5 17.2 191.0 .894
Interview Scales
1. Soc. Des. Qual. 63.8 10.3 59.2 10.1 142.5 .153 2. Pitt. Adol. Like 59.5 11.4 56.1 8.6 148.0 .198 3. Alertness 61.3 15.2 56.6 10.3 162.0 .363 4. Boldness 54.7 16.7 54.9 14.5 217.0 .575 5. Forcefulness 48.9 11.1 50.4 12.8 216.5 .583 6. Soc. Undes. Qual. 44.3 13.7 43.0 14.3 191.0 .894 7. Aggress. 38.5 15.1 36.4 14.3 182.0 .709 8. Past. Diffic. 63.8 15.6 63.4 14.7 201.0 .892 9. Present Prob. 38.5 15.7 51.2 15.9 284.5 .018 10. Moral Or. 38.2 15.1 37.3 11.9 192.5 .925 11. Work Sat. 78.4 12.8 67.3 16.0 112.5 .025 12. World Sat. 55.1 12.3 46.1 13.3 114.0 .028 13. Familiarity 62.6 12.4 59.9 11.3 172.5 .529 14. Und. & Diff. 69.9 12.2 67.9 17.1 178.0 .630 15. Use of Self 64.2 13.0 67.9 16.1 223.0 .471 16. Atmosphere 78.6 10.1 82.2 6.9 229.5 .371 17. Con. Neg. 56.3 8.7 57.2 10.2 202.5 .862 18. Inner. Focus 71.7 12.4 76.6 11.4 240.0 .240 19. Chg. & Act. 45.5 5.5 43.9 6.7 154.0 .262 20. Firmness 46.2 16.0 42.4 15.3 175.0 .574 21. Con. Control 44.4 14.2 40.0 14.8 172.5 .531
Iz Cfm Mp/Cfc Na Nx
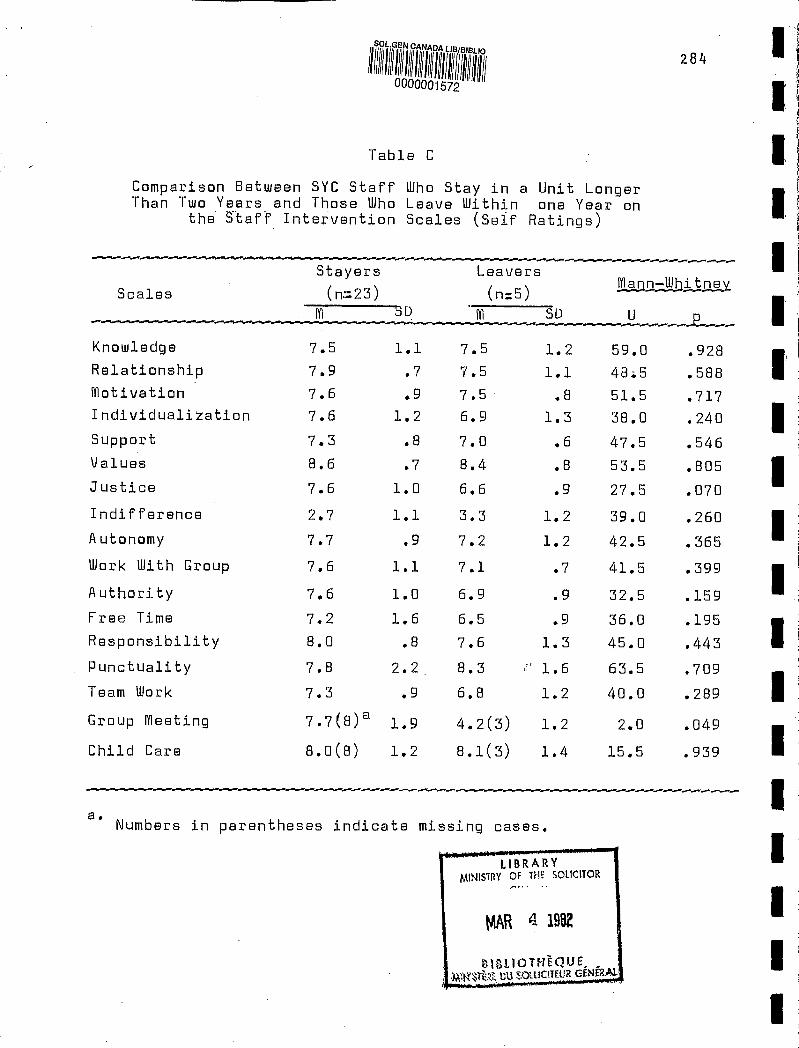
SOL.GEN CANADA LIS SIBLIO 284 II
1 1 1
Table
Comparison Between SYG Staff Who Stay in a Unit Longer Than Two Years and Those Who Leave Within one Year on
the Staff Intervention Scales (Self Ratings) 1
Scales
Stayers Leavers Mann-Whitnu
(n=23) (n:5) SD m SD U
Knowledge 7.5 1.1 7.5 1.2 59.0 .928 Relationship 7.9 .7 7.5 1.1 486 .588 II Motivation • 7.6 .9 7.5 .8 51.5 .717 Individualization 7.6 1.2 6.9 1.3 38.0 .240
II Support 7.3 .8 7.0 .6 47.5 .546 Values 8.6 .7 8.4 .8 53.5 .805
II Justice 7.6 1.0 6.6 .9 27.5 .070
Indifference 2.7 1.1 3.3 1.2 39.0 .260 II Autonomy 7.7 .9 7.2 1.2 42.5 .365
Work With croup 7.6 1.1 7.1 .7 41.5 .399 111 Authority 7.6 1.0 6.9 .9 32.5 .159
Free Time 7.2 1.6 6.5 .9 36.0 .195 Responsibility 8.0 .8 7.6 1.3 45.0 .443 II Punctuality 7.8 2.2 8.3 ,',' 1.6 63.5 .709 Team Work 7.3 .9 6.8 1.2 40.0 .289 II Group Meeting 7•7(8) a 1.9 4.2(3) 1.2 2.0 .049
Child Care 8.0(8) 1.2 8.1(3) 1.4 15.5 .939 I
1 a. Numbers in parentheses indicate missing cases.
LIBRARY MINISTRY OF THE SOLICITOR
MAR 4 1982
.BILIOTILIÈQUE 1)13 S.OILICITEUR GÉNÉRAIJ
1

11V Reitsma, Marge 9110 Thelluman resource .P71 F5 no.2
Date Due