Architecture Evaluation - J. Mack Robinson College of …s a Cpeoa eu raSCrS/ BCW P AC R atio f w r...
29
Architecture Evaluation Qualitative and Quantitative
Transcript of Architecture Evaluation - J. Mack Robinson College of …s a Cpeoa eu raSCrS/ BCW P AC R atio f w r...
Architecture Evaluation
Qualitative and Quantitative
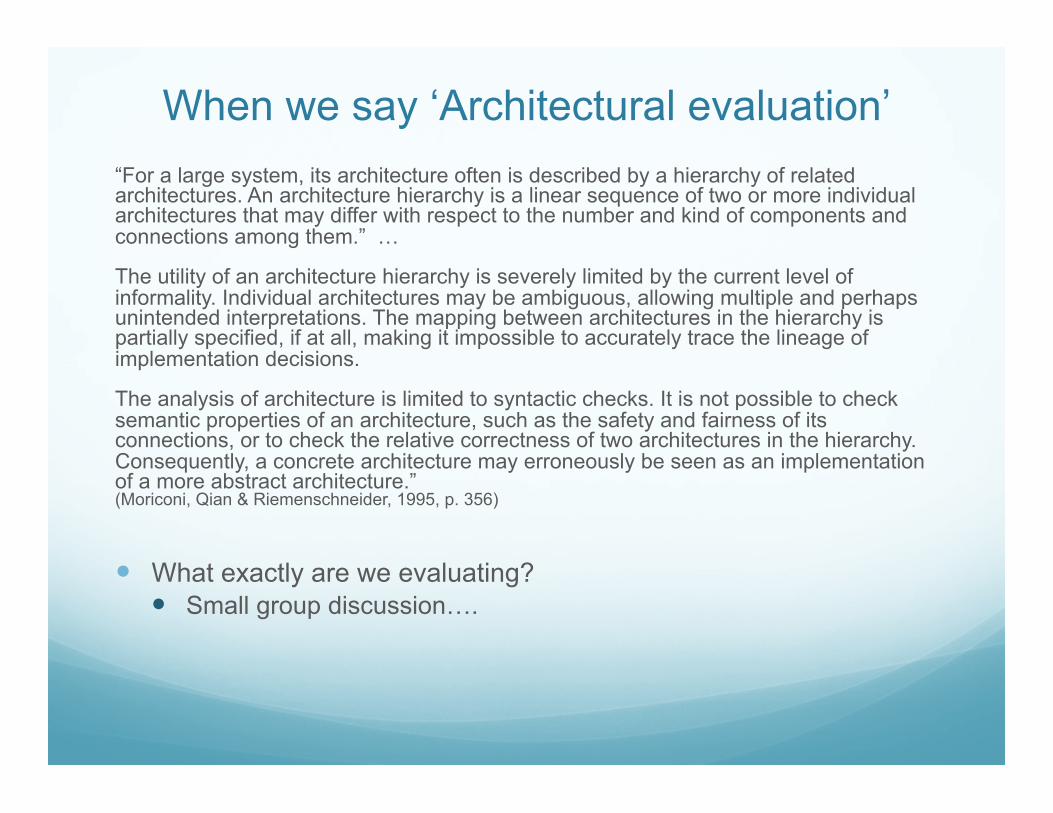
When we say ‘Architectural evaluation’ “For a large system, its architecture often is described by a hierarchy of related architectures. An architecture hierarchy is a linear sequence of two or more individual architectures that may differ with respect to the number and kind of components and connections among them.” … The utility of an architecture hierarchy is severely limited by the current level of informality. Individual architectures may be ambiguous, allowing multiple and perhaps unintended interpretations. The mapping between architectures in the hierarchy is partially specified, if at all, making it impossible to accurately trace the lineage of implementation decisions. The analysis of architecture is limited to syntactic checks. It is not possible to check semantic properties of an architecture, such as the safety and fairness of its connections, or to check the relative correctness of two architectures in the hierarchy. Consequently, a concrete architecture may erroneously be seen as an implementation of a more abstract architecture.” (Moriconi, Qian & Riemenschneider, 1995, p. 356)
What exactly are we evaluating? Small group discussion….

Professor Truex Enterprise Architectures
Architecture Management & Planning
IT Hardware Inventory
Network Map
Connectivity Diagrams
Topology Map
Skills Inventory
Vendor & New Technology Research
Departmental Fixed Asset Inventory
Corporate Fixed Asset Inventory
Organizational Charts
Framework or Reference Model
Business Unit & Departmental
Interviews
Configuration Management
.
Buy List
Standards
Project Inventories
PCUM
Term Formula
Percent Complete
Cost Performance Indexor Performance Factor
Checklist ActionsRatio of work accomplished in terms of the total amount of work to do.
Symbol
% Done
CPI or PF
TCPI or VF
BCWPBAC
Average PerformanceBCWPcum
Duration (wks or mos) Since ACWP Began
BCWPcumDuration (wks or mos)
From Time Now to Manager's Stated Completion Date
SC or S/CSchedule Correlation
BCWPACWP
Ratio of work accomplished against money spent (an efficiency ra ting: Work Done for Resources Expended)
To CompletePerformance Index
or Verification Factor
BAC - BCWPEAC - ACWP
Ratio of work remaining against money remaining (Efficiency whic h must be achieved to complete the remaining work with the expected remain ing money)
Schedule Performance Index SPI Ratio of work accomplished against what should have been done (E fficiency Rating: Work done as compared to what should have been done)
BCWPBCWS
SV
Ratio of Schedule Variance (SV) in terms of average amount of wo rk accomplished (in weeks or months). It indicates a correlation t o program true schedule condition
IEACIndependent EstimateAt Completion
BACPF
Calculation of a projected Estimate At Completion to compare wit h the CAM's Estimate At Completion:1) Ration of total work to be done against experienced cost eff iciency2) Sunk costs added to a ratio of remaining work against weight ed cost and schedule efficiencies
1)
2)BAC - BCWP.8CPI + .2SPI
ACWP +
Average Expected Performance To Finish
Average rate at which work has been accomplished since work bega n
Average rate at which work must be accomplished in the future to finish on the date the CAM has forecasted for completion of the work.PTO GO
PCUM
PCUM
Term Formula
Percent Complete
Cost Performance Indexor Performance Factor
Checklist ActionsRatio of work accomplished in terms of the total amount of work to do.
Symbol
% Done
CPI or PF
TCPI or VF
BCWPBAC
Average PerformanceBCWPcum
Duration (wks or mos) Since ACWP Began
BCWPcumDuration (wks or mos)
From Time Now to Manager's Stated Completion Date
SC or S/CSchedule Correlation
BCWPACWP
Ratio of work accomplished against money spent (an efficiency ra ting: Work Done for Resources Expended)
To CompletePerformance Index
or Verification Factor
BAC - BCWPEAC - ACWP
Ratio of work remaining against money remaining (Efficiency whic h must be achieved to complete the remaining work with the expected remain ing money)
Schedule Performance Index SPI Ratio of work accomplished against what should have been done (E fficiency Rating: Work done as compared to what should have been done)
BCWPBCWS
SV
Ratio of Schedule Variance (SV) in terms of average amount of wo rk accomplished (in weeks or months). It indicates a correlation t o program true schedule condition
IEACIndependent EstimateAt Completion
BACPF
Calculation of a projected Estimate At Completion to compare wit h the CAM's Estimate At Completion:1) Ration of total work to be done against experienced cost eff iciency2) Sunk costs added to a ratio of remaining work against weight ed cost and schedule efficiencies
1)
2)BAC - BCWP.8CPI + .2SPI
ACWP +
Average Expected Performance To Finish
Average rate at which work has been accomplished since work bega n
Average rate at which work must be accomplished in the future to finish on the date the CAM has forecasted for completion of the work.PTO GO
PCUM
Budgets
Version Control
Forecasted Cost Estimate At Completion EAC
Work Variance Schedule Variance SV
Cost Variance Cost Variance CV
Completion Var Variance At Completion VAC
Data Element Term AcronymData Element Term Acronym
Data Element Term AcronymData Element Term AcronymScheduled Work Budgeted Cost for Work Scheduled BCWS
Earned Value Budgeted Cost for Work Performed BCWP
Actuals Actual Cost of Work Performed ACWP
Authorized Work Budget At Completion BAC
Life Cycle Management
Architecture Management & Planning
Today…
1. Overview and Introduction
2. Marketing Activities
3. Program Requirements
4. Planned Program
5. Business Issues
6. Proposal Requirements
7. Cost and Pricing
A. Target Program Summary
A. Customer Organization and Environment
A. Scope of Work A. Win Strategy A. Desirability of Project/ Task
A. Proposal Manager and Key Team Members
A. Executive Cost Summary
B. Program Description
E. Customer Source Selection Process
B. Overview of Program Requirements
B. Teaming Approach
B. NDA/ Teaming Agreements
B. Proposal Plan B. Contingencies
B. Background and History
C. Customer Hot Buttons and Selection Criteria
C. Integrated Customer Solution Worksheet
C. Technical Approach
C. Cost to Bid C. Proposal Requirements and Summary Volume Outline
C. Material and/or Subcontractor Costs
C. Solicitation Schedule
D. Competitor Analysis
D. Customer Solution “Actions Required” Plan
D. Management and Organizational Overview
D. Risk Analysis and Mitigation Plan
D. Special Requirements (i.e., Orals, E-mail, etc.)
D. Fee and Operating Profit Summary
D. Opportunity Rating Summary
F. Customer Analysis and Bidder Comparison
E. Personnel and Staffing Approach
E. Unusual Costing Factors/ Concerns
E. Capture Program Status
F. Capture Program Status
F. Related Experience and Past Performance Approach
F. BAFO Requirements (Discounting, etc.)
G. Cost/Price Approach
IT Software / Applications Inventory
$ $ $
$ $ $ $
$ $ $ $ $
$ $ $ $
Professor Truex Enterprise Architectures
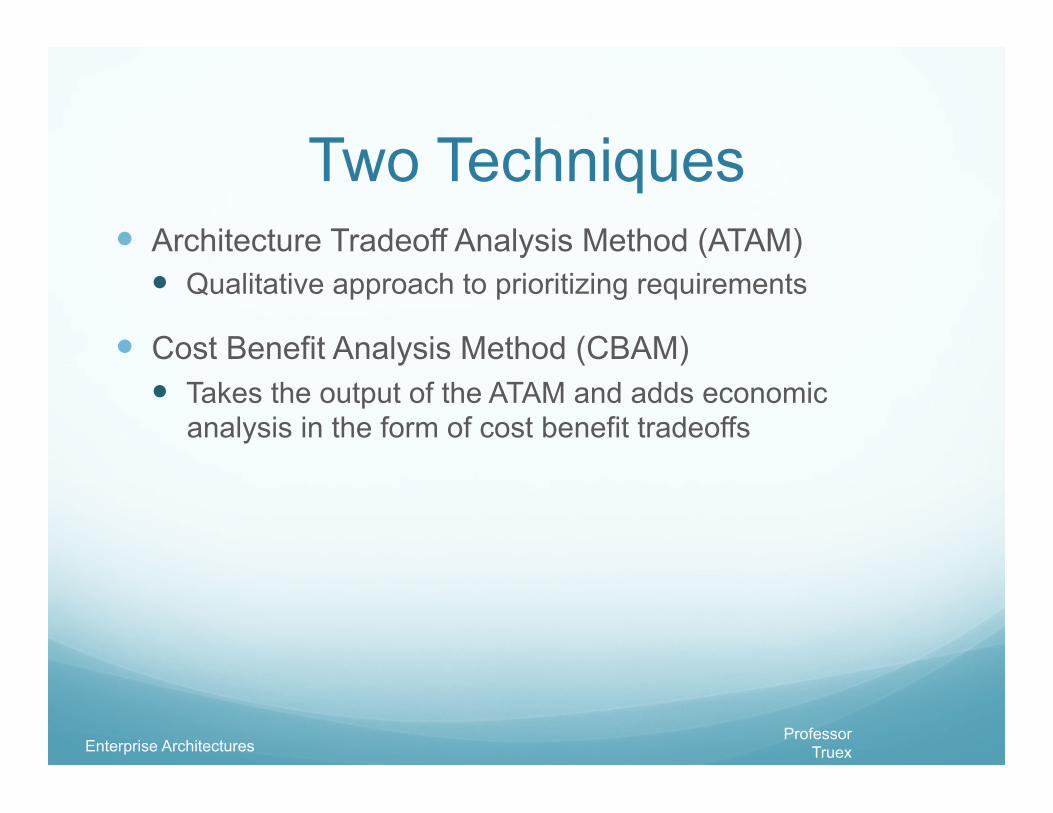
Two Techniques Architecture Tradeoff Analysis Method (ATAM)
Qualitative approach to prioritizing requirements
Cost Benefit Analysis Method (CBAM) Takes the output of the ATAM and adds economic
analysis in the form of cost benefit tradeoffs
Professor Truex Enterprise Architectures
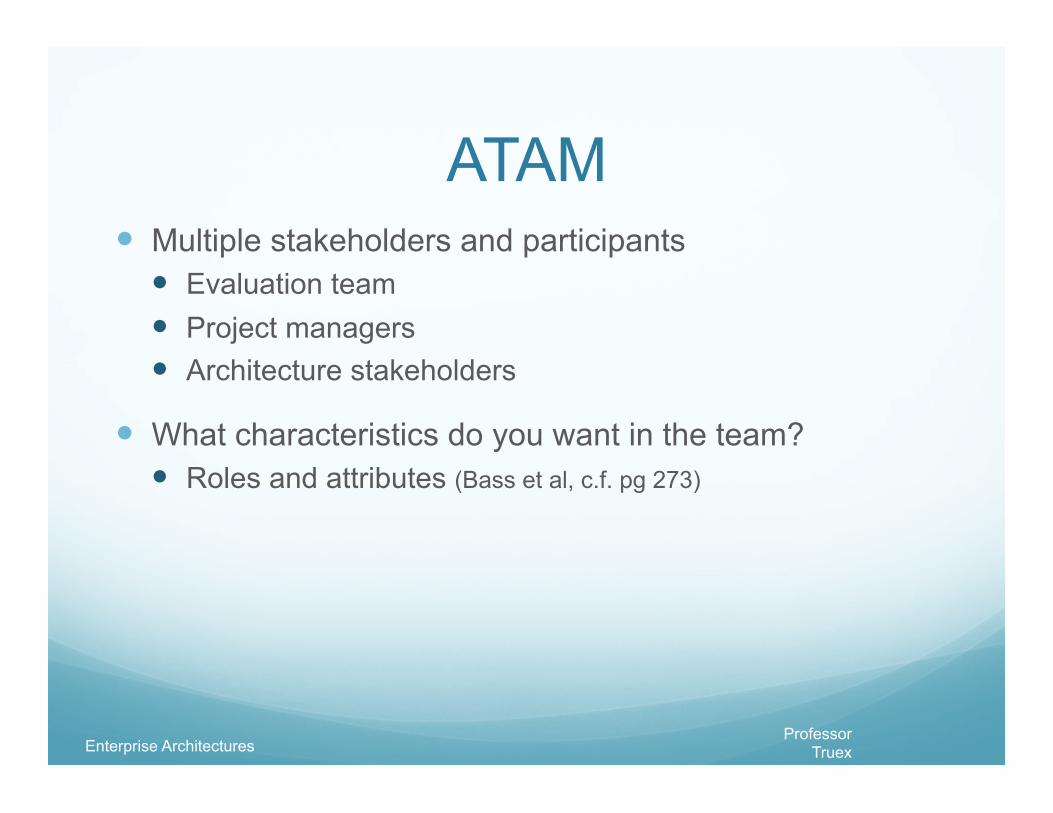
ATAM Multiple stakeholders and participants
Evaluation team Project managers Architecture stakeholders
What characteristics do you want in the team? Roles and attributes (Bass et al, c.f. pg 273)

Professor Truex Enterprise Architectures
ATM outputs/deliverables Rank ordered priorities in the following forms:
1. Concise architecture model 2. Clear business goals of the architecture (system) 3. Quality requirement scenarios (QRSs) 4. Mapping of architectural decisions to QRSs 5. Sensitivity analysis and tradeoff points
– How important is it and at what tradeoff? E.g., back up database important to reliability, problem for
security 6. Risk analysis and risk theme clustering

Professor Truex Enterprise Architectures
Example tabular ATAM output Quality Attribute Attribute refinement Scenarios
Performance Transaction Response time
User updates patient acct. in less than .75 second
Throughput Patient acct under peak load in response to chg of add notification < 4 secs.
Generating reports Batch by midday
Usability Proficiency training Experienced new hires up to speed in < 2wks
Normal operation Set payment plan real time with patient w/out delays
Configurability No source code changes to change fee structures; <1 day
Maintainability …Change, update, maintenance scenarios…
Professor Truex Enterprise Architectures
CBAM -- Cost Benefit If each architectural decision has costs and tradeoffs
(risks) How do we evaluate economic value and necessity?

Professor Truex Enterprise Architectures
CBAM (Benefits) vs. ATAM (tradeoffs) ATAM identifies sets of key architectural decisions
BAM quantifies them as to cost
Scenarios Utility curves
Best case and worst case scenarios compared to current and desired states
Prioritizing scenarios via voting
Professor Truex Enterprise Architectures
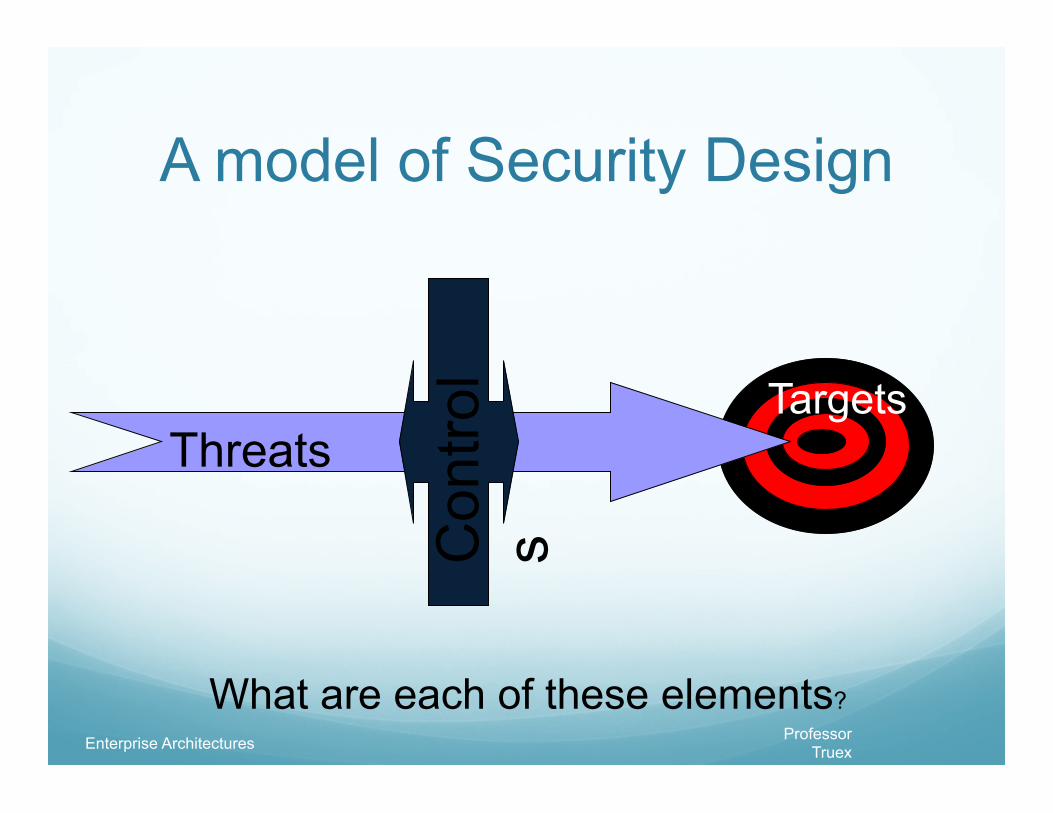
A model of Security Design
Threats C
ontro
ls
Targets
What are each of these elements?
Professor Truex Enterprise Architectures
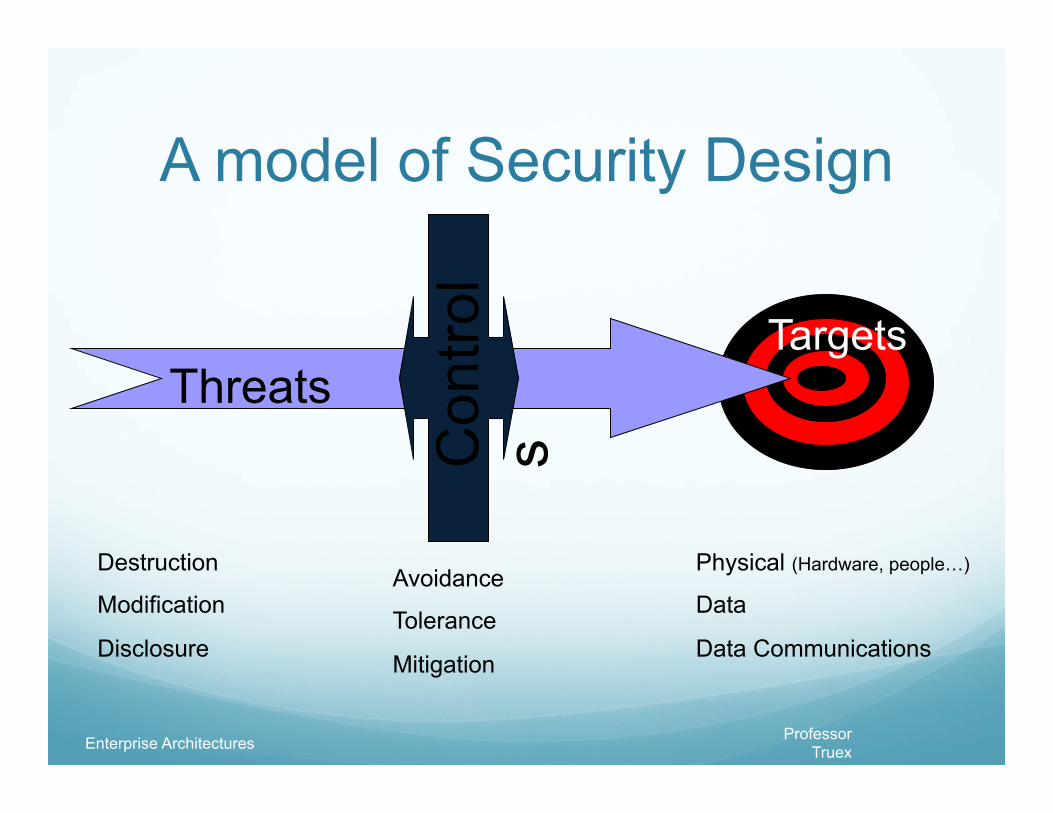
A model of Security Design
Threats C
ontro
ls
Targets
Destruction
Modification
Disclosure
Physical (Hardware, people…)
Data
Data Communications
Avoidance
Tolerance
Mitigation

Professor Truex Enterprise Architectures
Intranet Security: instance example
Intranet security is vital especially if connected to the Internet
Security can be threatened (someone tries to break in) compromised (someone knows how to break in) breached (actually breaks in or infiltrates)
Security threats can come from inside and outside be deliberate or accidental

Professor Truex Enterprise Architectures
Types of Threats Threats to hardware
Theft of equipment Tampering by disgruntled employees Destruction by natural accidents (fire, flood etc.) Ordinary wear and tear
Threats to software Deletion - accidental or deliberate Theft by user Corruption by virus or hardware malfunction
Threats to information Corruption, theft or deletion of files
Professor Truex Enterprise Architectures
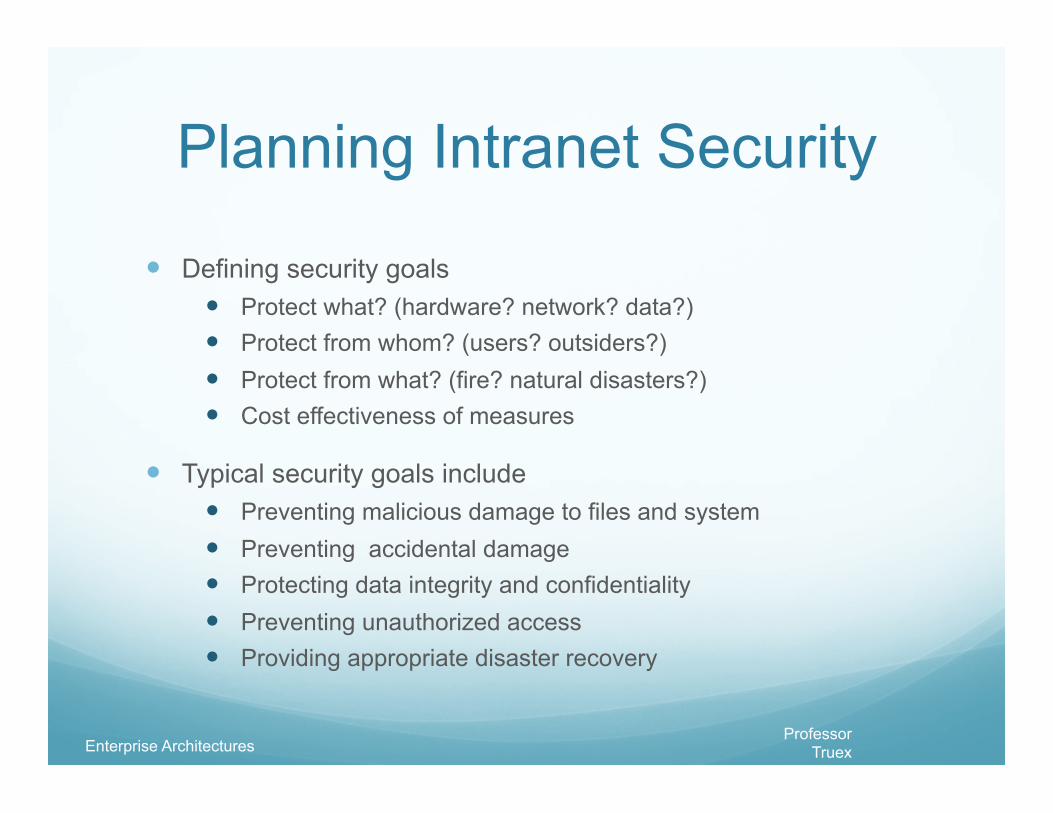
Planning Intranet Security
Defining security goals Protect what? (hardware? network? data?) Protect from whom? (users? outsiders?) Protect from what? (fire? natural disasters?) Cost effectiveness of measures
Typical security goals include Preventing malicious damage to files and system Preventing accidental damage Protecting data integrity and confidentiality Preventing unauthorized access Providing appropriate disaster recovery

Professor Truex Enterprise Architectures
Use the model to assess and plan...
Threats C
ontro
ls
Targets
Destruction
Modification
Disclosure
Physical (Hardware, people…)
Data
Data Communications
Avoidance
Tolerance
Mitigation
Professor Truex Enterprise Architectures
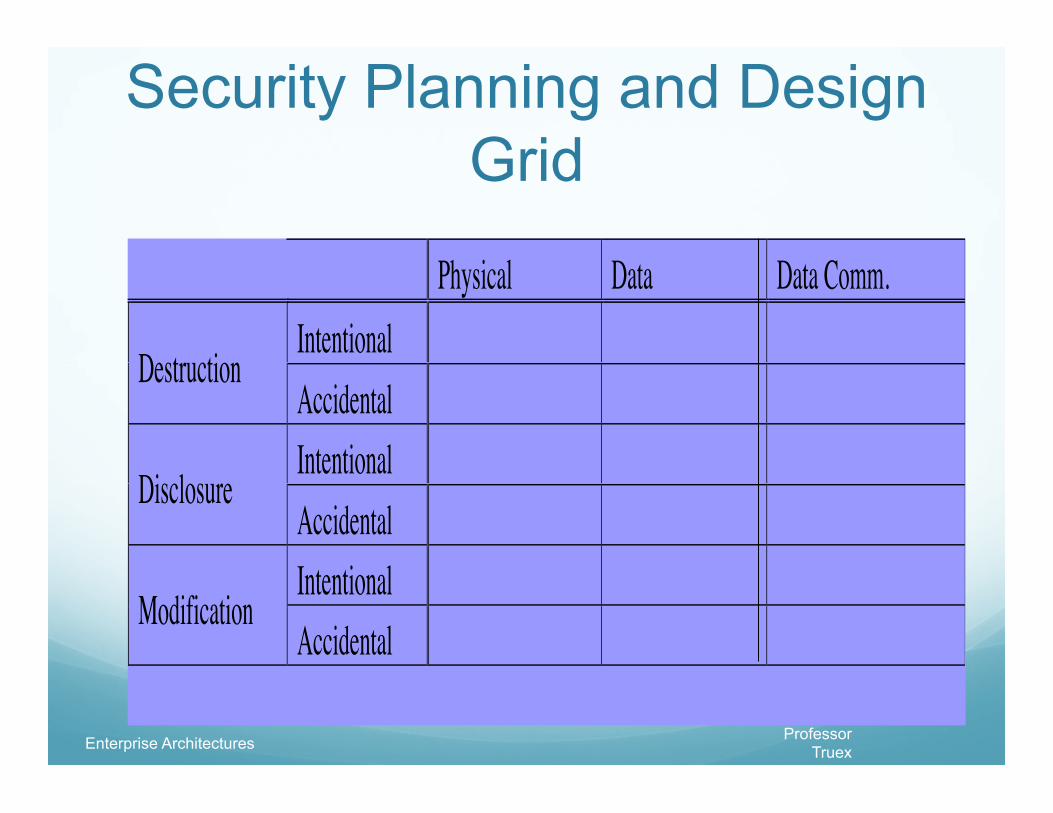
Security Planning and Design Grid
Physical Data Data Comm.Intentional
DestructionAccidentalIntentional
DisclosureAccidentalIntentional
ModificationAccidental
Professor Truex Enterprise Architectures
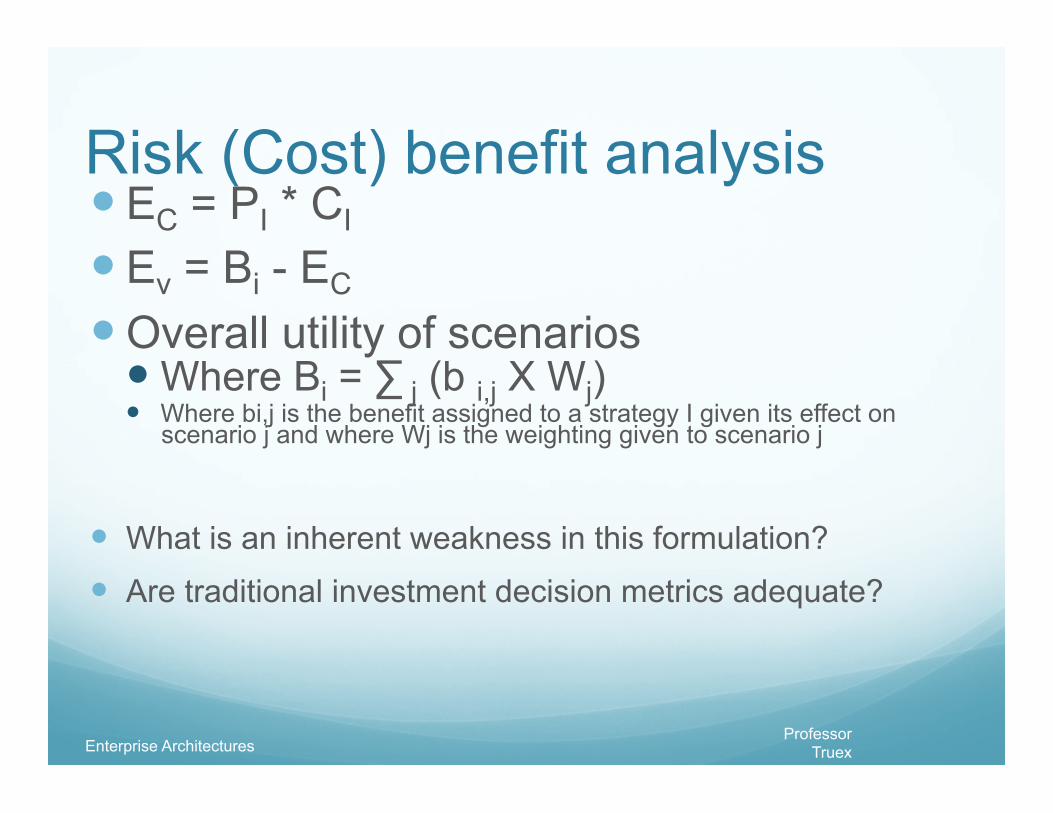
Risk (Cost) benefit analysis EC = PI * CI
Ev = Bi - EC Overall utility of scenarios Where Bi = ∑ j (b i,j X Wj) Where bi,j is the benefit assigned to a strategy I given its effect on
scenario j and where Wj is the weighting given to scenario j
What is an inherent weakness in this formulation?
Are traditional investment decision metrics adequate?

Professor Truex Enterprise Architectures
Design benefits, costs and Return on Investment
Question; How good is good enough?
Once decided and costs are assigned then we compute the expected return on investment. That metric is, in turn, compared to organizational standards.
ROI ==> Ri = Bi / Ci
Professor Truex Enterprise Architectures
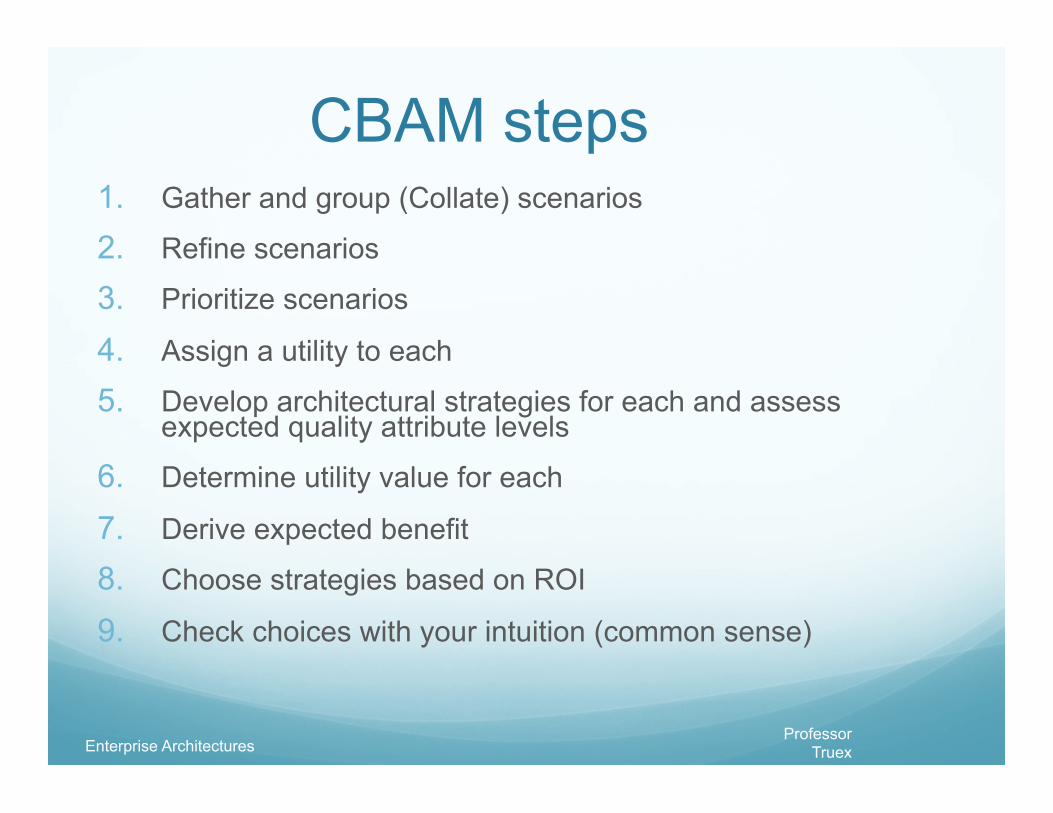
CBAM steps 1. Gather and group (Collate) scenarios
2. Refine scenarios
3. Prioritize scenarios
4. Assign a utility to each
5. Develop architectural strategies for each and assess expected quality attribute levels
6. Determine utility value for each
7. Derive expected benefit
8. Choose strategies based on ROI
9. Check choices with your intuition (common sense)

Professor Truex Enterprise Architectures
c.f., pgs. 318-323 Collected scenarios
Response goals
Refined Scenarios
Assign utility

Professor Truex Enterprise Architectures
Financial Analysis of Projects
Financial considerations are often an important consideration in selecting projects
Three primary methods for determining the projected financial value of projects: Net present value (NPV) analysis Return on investment (ROI) Payback analysis
Professor Truex Enterprise Architectures
Net Present Value Analysis
Net present value (NPV) analysis is a method of calculating the expected net monetary gain or loss from a project by discounting all expected future cash inflows and outflows to the present point in time
Projects with a positive NPV should be considered if financial value is a key criterion
The higher the NPV, the better
Professor Truex Enterprise Architectures
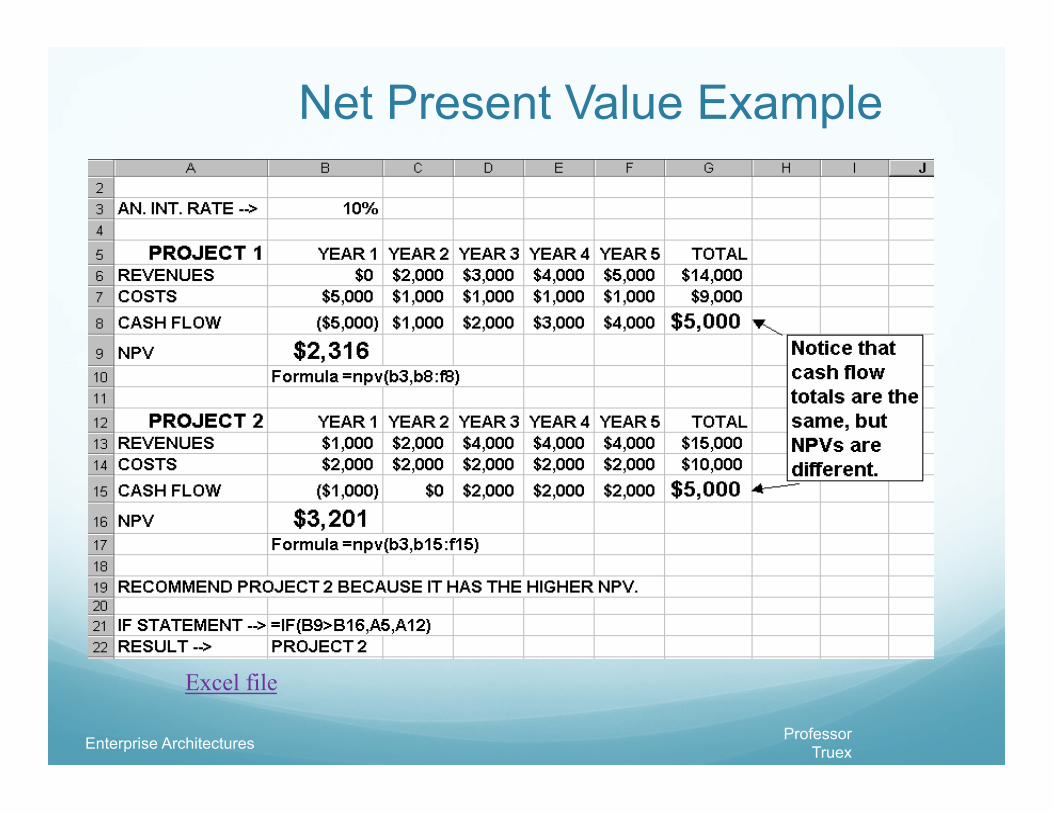
Net Present Value Example
Excel file

Professor Truex Enterprise Architectures
Return on Investment Return on investment (ROI)
or income divided by investment ROI = (total discounted benefits - total discounted costs) /
discounted costs The higher the ROI, the better
Many organizations have a required rate of return or minimum acceptable rate of return on investment for projects
Professor Truex Enterprise Architectures
Payback Analysis Another important financial consideration is
payback analysis
The payback period is the amount of time it will take to recoup, in the form of net cash inflows, the net dollars invested in a project
Payback occurs when the cumulative discounted benefits and costs are greater than zero
Many organizations want IT projects to have a fairly short payback period

Professor Truex Enterprise Architectures
NPV, ROI, and Payback Analysis for Project 1
Excel file

Professor Truex Enterprise Architectures
NPV, ROI, and Payback Analysis for Project 2
Excel file
Professor Truex Enterprise Architectures
Weighted Scoring Model
A weighted scoring model is a tool that provides a systematic process for selecting projects based on many criteria First identify criteria important to the project selection process Then assign weights (percentages) to each criterion so they add up
to 100% Then assign scores to each criterion for each project Multiply the scores by the weights and get the total weighted scores
The higher the weighted score, the better

Professor Truex Enterprise Architectures
Sample Weighted Scoring Model for Project Selection
Excel file