Architectural Considerations for a 500 TFLOPS Heterogeneous HPC
36
1 Dr. Richard Linderman Chief Scientist Information Directorate Air Force Research Laboratory Architectural Considerations for a 500 TFLOPS Heterogeneous HPC
Transcript of Architectural Considerations for a 500 TFLOPS Heterogeneous HPC

1
Dr. Richard Linderman
Chief Scientist
Information Directorate
Air Force Research Laboratory
Architectural Considerations for a 500 TFLOPS
Heterogeneous HPC

2
Introduction
• A 500 TFLOPS HPC is being built as a mix of Xeon, Cell,
and GPGPU multicore chips for $2M ($4/GFLOPS)
– $6000 3.0 GHz dual-octal Xeon® (384 GFLOPS) (qty 84 ~$500K)
– $380 3.2 GHz PS3® with Cell Broadband Engine® (153
GFLOPS) $2/GFLOPS (qty 2016 -> $760K)
– $1300 Tesla C1060 for 1 Teraflops (almost 2X better but there is
that extra multiply of dubious value!) (qty 168 -> $220K)
• Approximately 300 TF from Cell and 200 TF from GPGPU

3
SKY (PowerPC)200 GFLOPS/$M
10
100INTEL PARAGON
(i860) 12 GFLOPS/$M
1,000
10,000
1M
Heterogeneous HPCXEON + FPGA81 TOPS/$M
53 TFLOP Cell Cluster147 TFLOPS/$M
500 TFLOP Cell-GPGPU250 TFLOPS/$M
Exponentially Improving Price-PerformanceMeasured by AFRL-Rome HPCs
100,000
GFLOPS/$M

4
SKY (PowerPC)640 GF, 9 KW (71)
1
10INTEL PARAGON96 GF, 40 KW (2.5)
100
1,000
Cell Cluster53 TF, 35 KW (1510)
500 TFLOP Cell-GPGPU300 KW (1660)
Improving Power EfficiencyMeasured by AFRL-Rome HPCs
Dual Xeon Cluster530 GF, 7 KW (76)
GFLOPS per KW

5
$300-380
Cell BE® processor
256 MB RDRAM (only)
40/80/160 GB hard drive
Gigabit Ethernet (only)
153 Gflops Single Precision Peak
Sony Hypervisor
Fedora Core 7 or 9 Linux or YDL 6.1
IBM CELL SDK 3.0
PlayStation3 Fundamentals
6 of 8 SPEs available
25.6 GB/sec to RDRAM
~110 Watts

6
Cell Cluster Architecture
• The Cell Cluster has a peak
performance of 51.5 Teraflops from 336
PS3s and additional 1.4 TF from the
headnodes on its 14 subclusters.
• Cost: $361K
•PS3s 37% of cost
• Price Performance: 147 TFLOPS/$M
• The 24 PS3s in aggregate contain 6
GB of memory and 960 GB of disk. The
dual quad-core Xeon headnodes have
32 GB of DRAM and 4 TB of disk each.

7
Horus Cluster
# of Tesla GPUs 2 (Per Server)
# of Streaming
Processor Cores480 (240 per processor)
Frequency of processor
cores1.44 GHz
Single Precision floating
point performance
(peak)
2.07 TFlops
Double Precision
floating point
performance (peak)
176 GFlops
Floating Point Precision IEEE 754 single & double
Total Dedicated Memory 16GB
Memory Interface 512-bit
Memory Bandwidth 408GB/sec
Max Power Consumption 400 W
System Interface PCIe 2.0 x16
Programming
environmentCUDA
GPU Cluster: Supermicro 6016GT-TF GPU Server (Dual Quad Core 2.66GHz (Intel 5500), 12GB Ram, Dual 10Gigabit Ethernet)
12 The NVIDIA® Tesla™ S1060 Computing System (Dual PCI Express 2.0 cable connections)

8
Tesla C1060
• 240 cores
• 240 * 3 * 1.44 = 1.04 TFLOPS SP
• But *2/3 = 693 GFLOPS (Mult-Add)
• 86 GFLOPS Double Precision
• 30 Groups
• 1.44 GHz clock
• 4.29 Gbytes global memory with 102 GB/s bus
• CUDA programming language
© 2010 NVIDIA Corporation
9
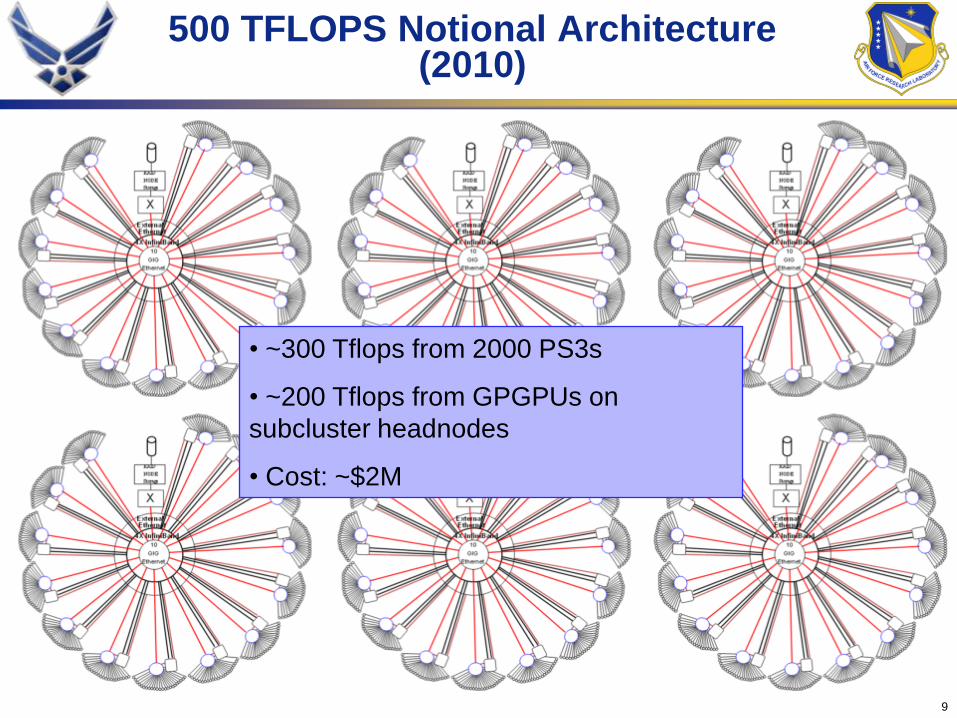
500 TFLOPS Notional Architecture (2010)
• ~300 Tflops from 2000 PS3s
• ~200 Tflops from GPGPUs on
subcluster headnodes
• Cost: ~$2M

10
Key Questions
• Which codes could scale given these constraints?
• Can a hybrid mixture of GPGPUs, PS3s and traditional
servers mitigate the weaknesses of each alone and still
deliver outstanding price-performance?
• What level of effort is required to deliver a reasonable
percentage of the enormous peak throughput?
• A case study approach is being taken to explore these
questions

11
C1060 Single Precision FFT Performance
FFT size Batch size GFLOPS
128 1048576 142.7679
256 524288 158.3834
512 262144 185.8466
1024 131072 180.5021
2048 65536 155.5087
4096 32768 138.4825
8192 16384 131.2078
16384 8192 133.1166
32768 4096 115.5721
65536 2048 120.7021
131072 1024 122.4666
262144 512 123.6724
524288 256 115.443
1048576 128 89.97151
2097152 64 77.87137
4194304 32 68.37061
8388608 16 66.8403
0
50
100
150
200
128
256
512
1024
2048
4096
8192
16384
32768
65536
131072
262144
524288
1048576
2097152
4194304
8388608
SP FFT cuFFT 2.3GFLOPS

12
C1060 Double Precision FFT Performance
FFT size Batch Size GFLOPS
128 524288 20.79753
256 262144 23.32277
512 131072 27.4417
1024 65536 24.90863
2048 32768 25.46983
4096 16384 25.8713
8192 8192 25.92831
16384 4096 26.24678
32768 2048 26.56052
65536 1024 26.88373
131072 512 26.48042
262144 256 26.21382
524288 128 24.53423
1048576 64 24.38489
2097152 32 25.0893
4194304 16 24.85596
8388608 8 24.71584
0
50
128
256
512
1024
2048
4096
8192
16384
32768
65536
1310
…
2621
…
5242
…
1048
…
2097
…
4194
…
8388
…
DP FFT cuFFT 2.3GFLOPS
13
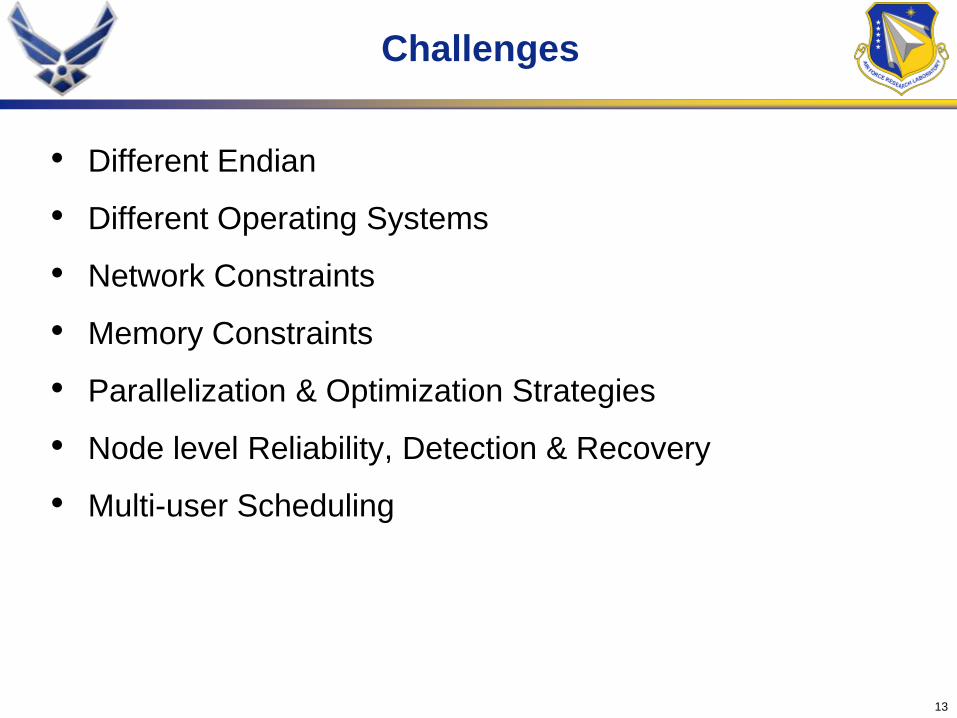
Challenges
• Different Endian
• Different Operating Systems
• Network Constraints
• Memory Constraints
• Parallelization & Optimization Strategies
• Node level Reliability, Detection & Recovery
• Multi-user Scheduling
14
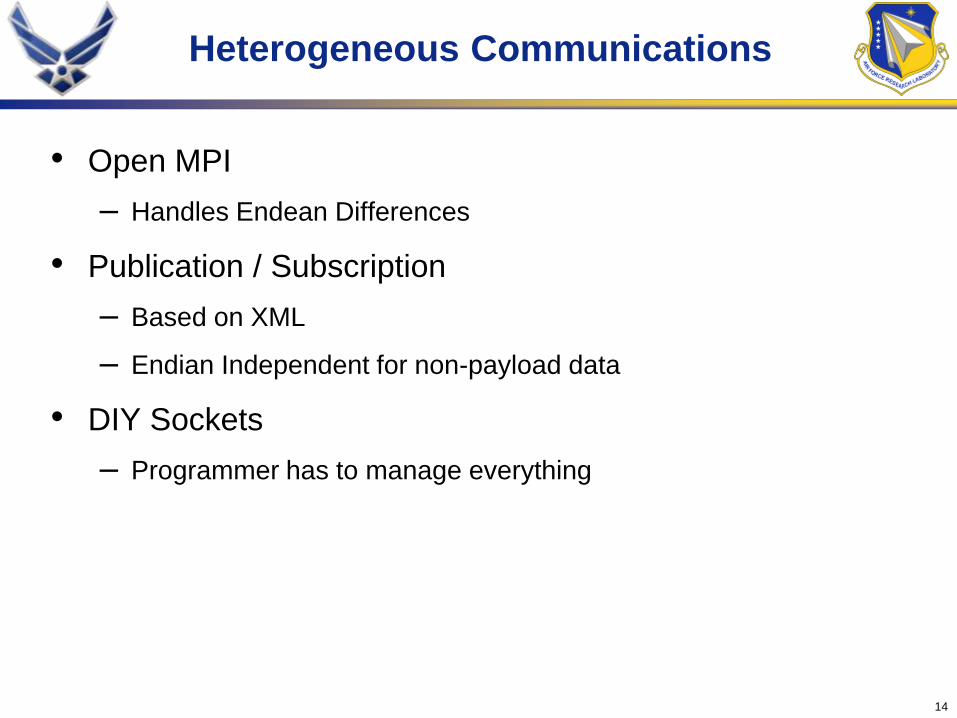
Heterogeneous Communications
• Open MPI
– Handles Endean Differences
• Publication / Subscription
– Based on XML
– Endian Independent for non-payload data
• DIY Sockets
– Programmer has to manage everything

15
Matrix-Matrix Multiply
• Good Candidate for Performance Acceleration
– Large Data
– Problem can be blocked & distributed
– Scalable
• Good test-bed for fault tolerance methods
– Detection of failure
– Restarting of failed process while preserving work already
completed

16
Matrix – Matrix Multiply performance for Nvidia C1060 GPGPU and PS3
http://www.nvidia.com/content/GTC/documents/SC09_CUDA_Tools_Cohen.pdf
$300 PS3
$1220
0
50
100
150
200
250
300
350
400
0 1000 2000 3000 4000 5000 6000 7000 8000 9000
Measured GFLOPS
Web Page Reference
Still working to close the gap

17
PS3-based 48k x 240k matrix-matrix multiply
240k
240k
48k 48k
48k
A
B
C
Each of 12 PS3s holds
one 4k x 240k strip of A.
PS3s process 4k x 8k blocks of A & B at a
time
4k x 8k blocked columns of B
are transmitted to all PS3s.
Each PS3 produces
one 4k x 48k strip of C.
As each blocked column of B is
processed,
one 4k x 8k block of C is produced.
18
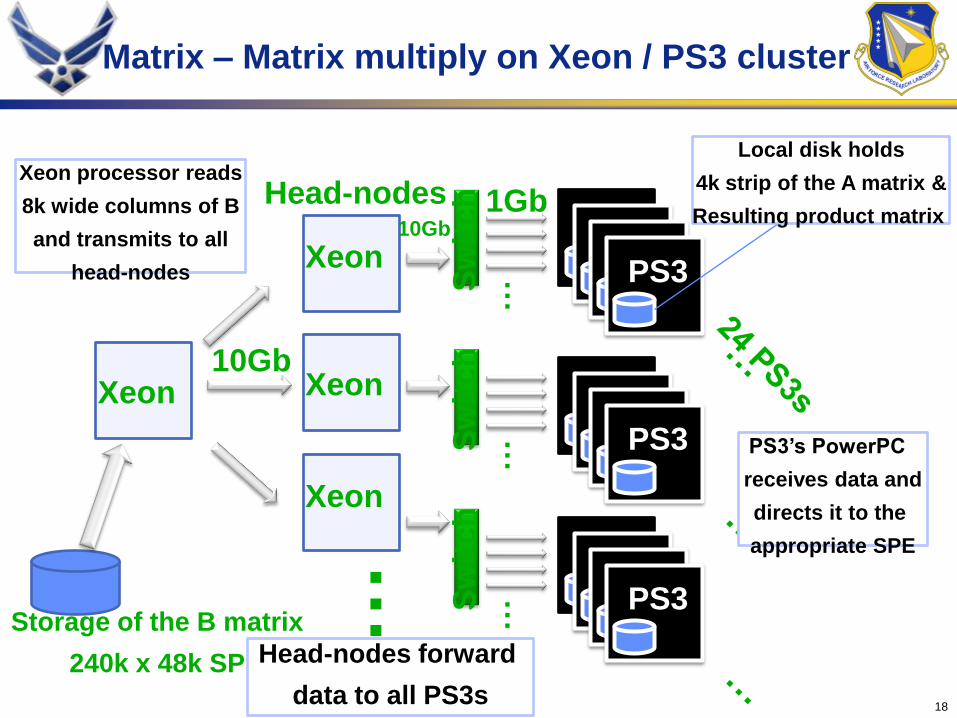
Matrix – Matrix multiply on Xeon / PS3 cluster
Head-nodes
Xeon
Storage of the B matrix
240k x 48k SP
…
PS3PS3PS3PS3
PS3PS3PS3PS3
PS3PS3PS3PS3
Sw
itch
…S
wit
ch
…S
wit
ch
…
Xeon
Xeon
Xeon 10Gb
10Gb1Gb
Local disk holds
4k strip of the A matrix &
Resulting product matrix
PS3’s PowerPC
receives data and
directs it to the
appropriate SPE
Xeon processor reads
8k wide columns of B
and transmits to all
head-nodes
Head-nodes forward
data to all PS3s

19
Matrix-Matrix Multiply Performance
The larger matrix dimension allows more computations relative to the
output data size, increasing the performance.
PS3 Clusters can achieve >80% peak efficiency on large matrix multiply!
0
20
40
60
80
100
120
140
160
1 2 3 4 5 6 7 8 9 10 11 12
GF
LO
PS
per
PS
3
Number of PS3s
Matrix-Matrix Multiply GFLOPS
48k x 48k
48k x 240k
PS3 Max GFLOPS (153)

20
PS3 Considerations
• Single precision floating point rounds toward zero
– Using a 1M dot product, compared Xeon SP round nearest &
Cell SPE results to Xeon DP results
– Xeon averaged 18.95 mantissa bits accuracy
– Cell SPE averages 9.68 mantissa bits accuracy
• PS3s exhibit an occasional hang condition aggravated
by heavy network & disk IO, believed to be an interrupt
handling problem

21
Fault Tolerance
• Could be complete failure of a node or just slow
• Return intermediate results to head-nodes to minimize
work lost due to unit failure
• Design with enough meta-data to restart processing in
mid-stream
• Build in methods to determine condition of a node,
normal, slow, or complete failure
HPCMP OIPT/CSB/HPCAP 2009
Cell Cluster: Early Access to Commodity Multicore
Solving the hard problems . . .
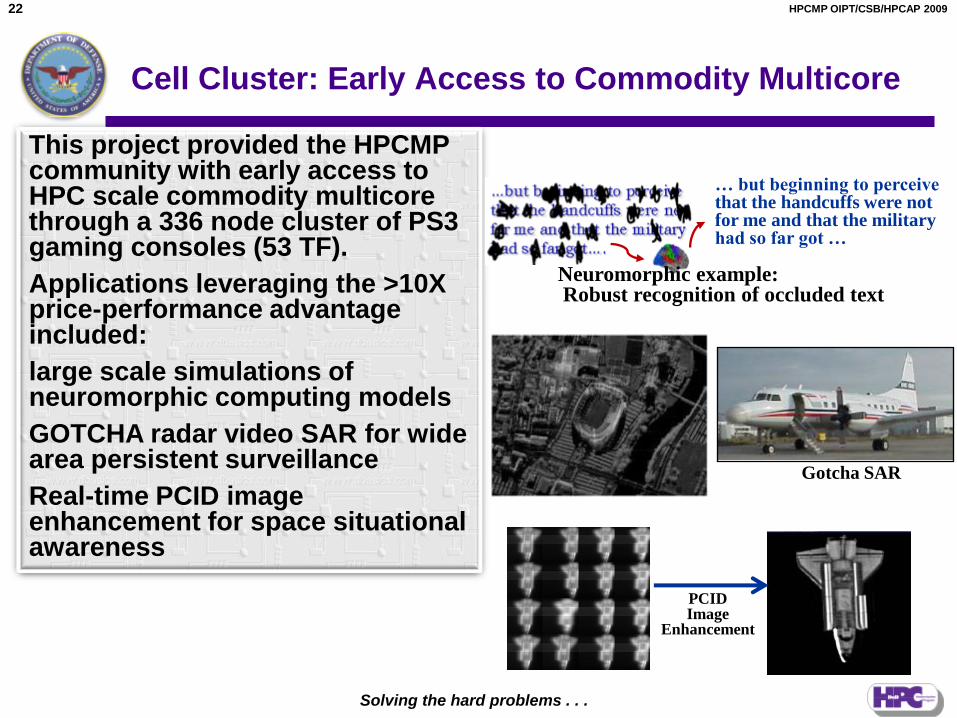
22
This project provided the HPCMP community with early access to HPC scale commodity multicore through a 336 node cluster of PS3 gaming consoles (53 TF).
Applications leveraging the >10X price-performance advantage included:
large scale simulations of neuromorphic computing models
GOTCHA radar video SAR for wide area persistent surveillance
Real-time PCID image enhancement for space situational awareness
… but beginning to perceive that the handcuffs were not for me and that the military had so far got …
Neuromorphic example:Robust recognition of occluded text
Gotcha SAR
PCID Image
Enhancement
23
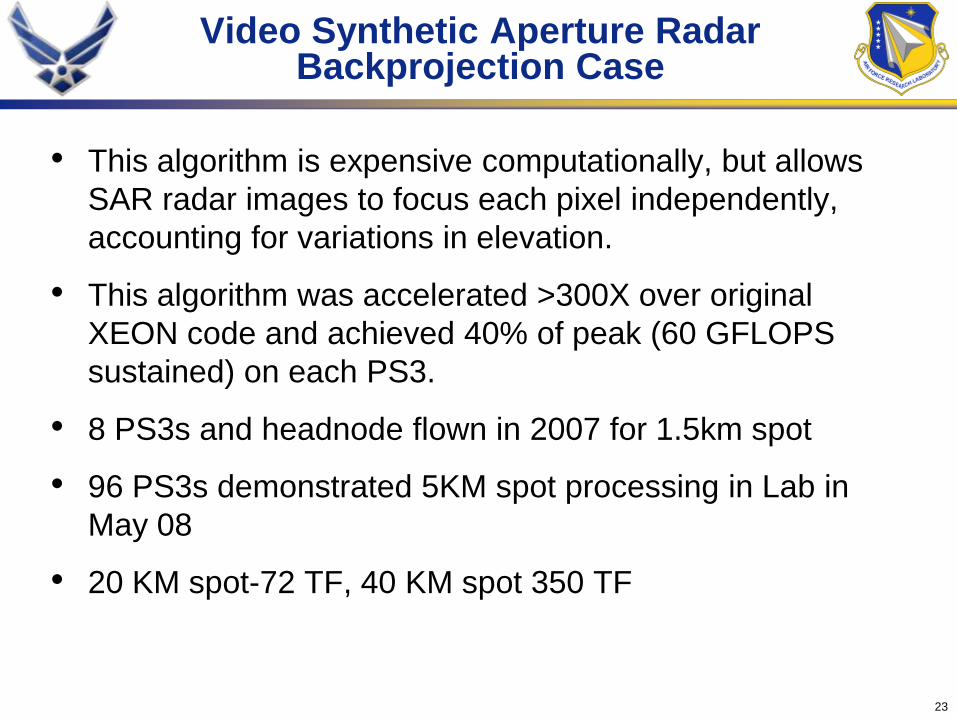
Video Synthetic Aperture Radar Backprojection Case
• This algorithm is expensive computationally, but allows
SAR radar images to focus each pixel independently,
accounting for variations in elevation.
• This algorithm was accelerated >300X over original
XEON code and achieved 40% of peak (60 GFLOPS
sustained) on each PS3.
• 8 PS3s and headnode flown in 2007 for 1.5km spot
• 96 PS3s demonstrated 5KM spot processing in Lab in
May 08
• 20 KM spot-72 TF, 40 KM spot 350 TF
24
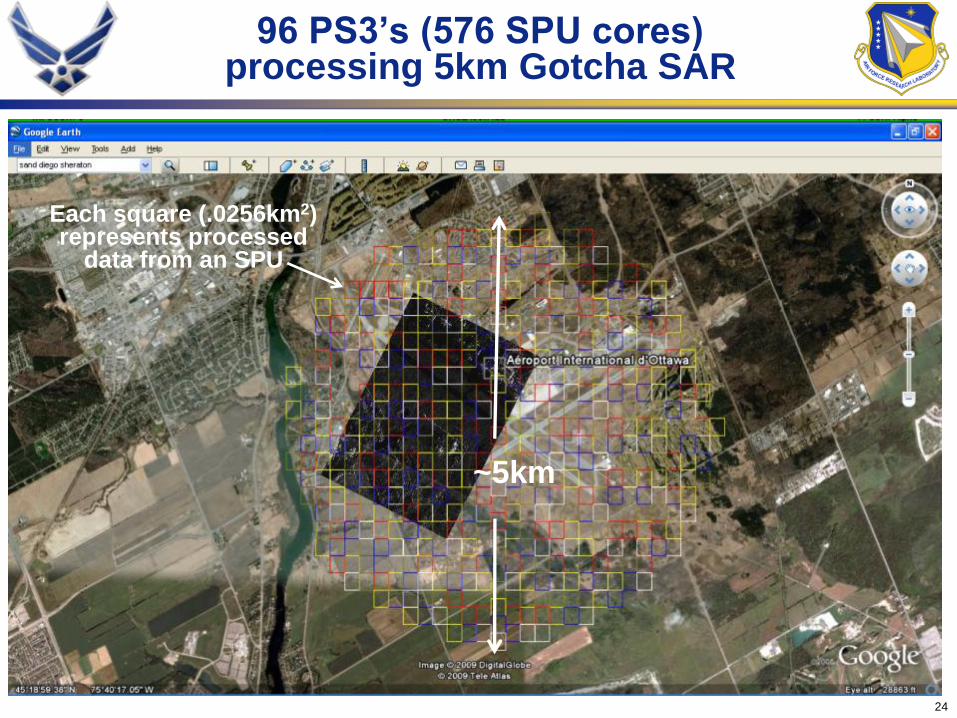
96 PS3’s (576 SPU cores) processing 5km Gotcha SAR
Each square (.0256km2) represents processed
data from an SPU
~5km

25
Results: Gotcha VideoSAR Scalability
• At 256 PS3s, each send 6 MB/sec and receives 8.4 MB/sec while headnodes each receive 200 MB/sec and send 140 MB/sec
26
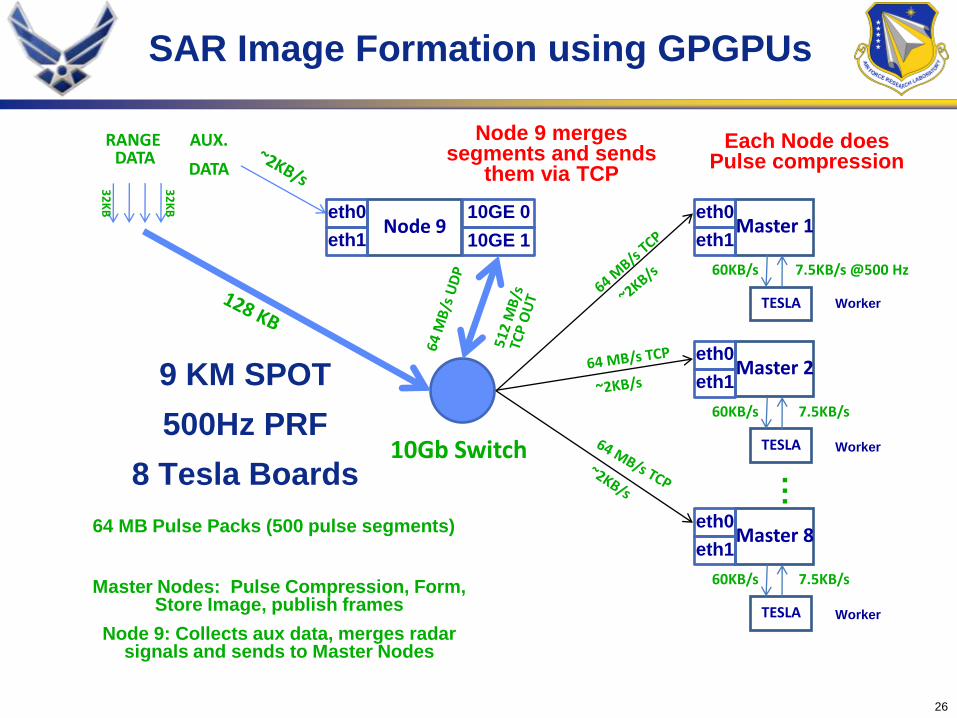
SAR Image Formation using GPGPUs
9 KM SPOT
500Hz PRF
8 Tesla Boards
RANGEDATA
AUX.
DATA
Master Nodes: Pulse Compression, Form, Store Image, publish frames
Node 9: Collects aux data, merges radar signals and sends to Master Nodes
Master 8
7.5KB/s
TESLA
60KB/s
eth0
eth1
Master 1
7.5KB/s @500 Hz
TESLA
60KB/s
eth0
eth1
Master 2
7.5KB/s
TESLA
60KB/s
eth0
eth1
10Gb Switch
…
32
KB
32
KB
64 MB Pulse Packs (500 pulse segments)
Each Node does Pulse compression
Worker
Worker
Worker
Node 9eth0
eth1
10GE 0
10GE 1
Node 9 mergessegments and sends
them via TCP

27
Neuromorphic Computing Architecture Simulation Case
• The driving application behind developing a 53 TF class
cluster was to support basic research into alternative
neuromorphic computing architectures.
• The first of these to be optimized for the PS3 was the
―Brain-State-In –A-Box‖ (BSB)—looking for 1M BSBs
simulating in real time
• Optimized the BSB for the PS3 and achieved 18 GFLOPS
on each core of the PS3 [6]. Across the 6 cores, 108
GFLOPS/PS3, over 70% of peak was sustained.
– 12 staff week effort for first PS3 optimization experience

28
BSB Recall Operation
)( X(0)X(t)X(t)A1)X(t S
• X(t+1) and X(t) are N dimensional real vectors;• A is an NxN connection matrix; • is a scalar constant feedback factor;• is an inhibition decay constant; • is a nonzero constant if there is a need to
maintain the input stimulation;• X(0) is the input stimulation;• S() is the “squash” function
1
11
1
1
1
)(
y
y
y
if
if
if
yyS

• V1 ~ 1% of total cortex.• Each of the 196 subfields models 8192 minicolumns• V2 will be a similar scale model, using another ~190 nodes.• All communication is Pub/Sub, via 100K JBI.• An Oval is a process
Emulation
On the Cell Cluster
Cell Nodes: 196Head Nodes: 8
8 JBIBrokers
Left Eye Model
Right Eye Model
Chiasm Model
Right LGN Model
Left LGN Model
Left V1Subfield
2
Left V1Subfield
1
Left V1Subfield
0
Right V1Subfield
2
Right V1Subfield
1
Right V1Subfield
0
Instrumentation(visualize test points)
Environment forstimulating cortex
Currently using 1 subfield/node
29
Shape has no significance

30
V1 Minicolumn ModelOne “Subfield” per PS3 Node
A “Neighborhood” of 9 subfields.
Each Minicolumn:
32 element BSB
56 simple cells
10 complex cells
~32 ―readout‖ cells.
Functional Column:
cluster of 64 minicolumns.
One subfield:
8,192 minicolumns
(128 Fumctional Columns)
Full Scale Primary Visual Cortex:
196 subfields (196 PS3 nodes)
Connectivity pattern of a
single Functional Column:
E => excitation
I => inhibition
X => both E & I
I X I E I X I
E
E
I I I I I
E
X X X X X
I I I I I
X X X X X
E
EE
EE
E E
E E
EE E
E E
EE
I I I I I
I I I I I
2 X 64
Functional Columns
Network: Every functional column communicates with functional columns in 8 surrounding neighboring subfields.
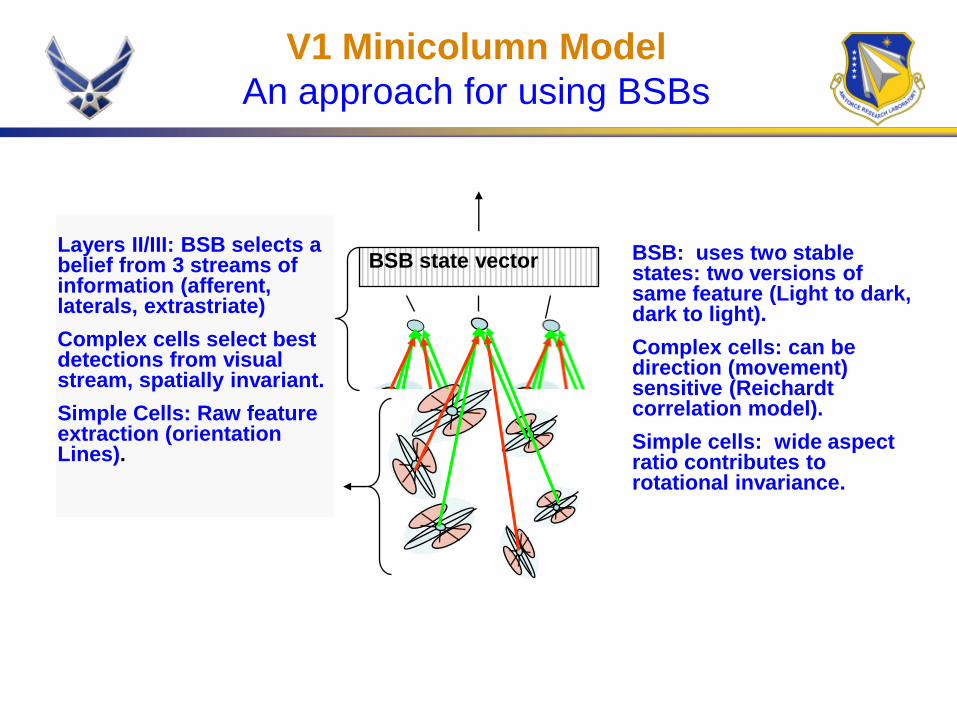
Layers II/III: BSB selects a belief from 3 streams of information (afferent, laterals, extrastriate)
Complex cells select best detections from visual stream, spatially invariant.
Simple Cells: Raw feature extraction (orientation Lines).
BSB: uses two stable states: two versions of same feature (Light to dark, dark to light).
Complex cells: can be direction (movement) sensitive (Reichardt correlation model).
Simple cells: wide aspect ratio contributes to rotational invariance.
BSB state vector
V1 Minicolumn Model
An approach for using BSBs

32
AssessmentEmulation Speed
BSB: 2.833 ms (29.8 MFLOP)/SPE 10.5GF/S
Level IV: 2.602 ms (22.6 MFLOP)/SPE 8.6GF/S
Total V1 Subfield (PS3 node) Cycle Time: ~6.1 ms (157 MFLOP 26.1 GF/S)
196 Subfields (Whole V1) total cycle time, including all messages: ~51 ms (19 Hz)
Biomorphic “requirements”:• gaze: 5 saccades/Second (200 milliseconds) for detailed orientation perception. (Achieved)
• Track: ~35 frames/sec (videospeed) for low resolution,perception of movement. (Not yetaddressed; looks promising).
Time measured in Milliseconds
32
Msg LatencyLevel ivLevel ii/iii (BSB)
52.5MF/6.01ms22.6MF/2.6ms29.8MF/2.83ms
PS3Node
0
1
2
3
Distribution of image pieces is themajor source of 45 ms latency.
0.465ms X 98
Next Step: Broadcast to eliminate message latency.

33
Hybrid Cognitive Model for Text Recognition
…but beginning to perceive that the handcuffs were not for me and that the military had so far got….
…but b??i??in? to p?r?ei?e t??t ?he ?andcuffs ?ere n??f?r me an? th?t t?e mi?itary ?ad s? fa? g?t ….
BSB Recognition
Word Level Confabulation
Sentence Level Confabulation
but besieging believingbeginningbanishing
……
to porceiteperceiveparseile
twittha
ttexttest….
theshe
handcuffs nutnunnodnot…
furforfirfar
me military
madladhadgad…
fereserewerehere
…
sustssso…
anyantannand…
thitthat
toetiethetee…
faxfatfarfan…
gutgotgetgat…
but b??i??in? to p?r?ei?e t??t ?he ?andcuffs n?? f?rme mi?itary
?ad ?ere s? an? th?t t?e fa? g?t
Knowledge Base (KB)
Knowledge Base (KB)
…but beginning to perceive that the handcuffs were not for me and that the military had so far got….
Perception based on neural network
models
Prediction
Prediction

34
Performance Evaluation
PS3 node
1 Cell Processor
Sub-cluster
1 head-node + 24 PS3
HPC cluster
14 sub-clusters
Computing power from Cell
processors (GFLOPS)
75 1800 25200
Character recognition peak
performance (characters / sec)
48 1152 16128
Word confabulation peak
performance (words / sec)
N/A 30 420
Sentence confabulation peak
performance (sentences / sec)
N/A 160 2240
Overall typical text recognition
performance (sentences / sec)
N/A 4.3 59.9
Performance Evaluation
35
Next Steps
• Move the V1 visual cortex models from PS3s to GPGPU
so PS3s can model next levels of visual cortex (V2-V4)
• Multiplication of very large matrices (SGEMM) on the
Cluster (1010 to 1012 elements)
• LINPACK LU benchmark with iterative methods on Cell
and GPGPUs

36
Conclusions
• The large computer graphics and gaming marketplaces
are bringing forward products with tremendous
computational performance at commodity prices and
outstanding power efficiency
• A 500 TF HPC can be built for approximately $2M with a
mixture of GPGPUs (200 TF), Cell-BEs (300 TF), and
Xeons.
• Several applications are scaling very well and achieving
significant percentage of GPGPU and Cell BE peak
performance
• The heterogeneous mixture of multicore components
allows applications to benefit from the differing strengths
and avoid weaknesses