ArcGIS online - University of Waterloo · Geospatial Centre | University of Waterloo | November...
18
Geospatial Centre | University of Waterloo | November 2015 1 Overview ArcGIS Online is a web-based mapping and app-building site created by Esri, the world leader in GIS software. In an effort to empower users of all levels to create interactive maps and applications that are easy to share, Esri developed the ArcGIS Online platform to realize its vision. With both a free version for lay users and an organizational account for larger enterprises, the functionality is tailored to different mapping and application needs. Not only can users create custom maps using their own data, but they can also publish ready-to-use apps that make sharing the information easy and intuitive for their audience. This guide explores the capabilities that come with the free version, which is available to anyone with an Esri Global Account. Setting Up Although ArcGIS Online can be used without setting up an account, it also means not being able to save your maps and applications. For the purpose of this guide, we will set up a free Esri Global Account, which you can use to access not only ArcGIS Online but all of Esri’s training resources. Go to http://www.arcgis.com and click on Sign In at the top-right corner of the page. At the bottom left of the page, click on Create a Public Account and fill in the necessary info. Once you’ve created your account (which includes receiving a verification email), sign in to ArcGIS Online. Note: The prominent, orange-coloured “30-Day Free Trial” button on the ArcGIS Online landing page is intended for organizations, not individuals; therefore, be sure to create a public account rather than an organizational one. In this guide, we are going to learn how to use many features in ArcGIS Online including creating basic maps, adding in layers, changing the symbology of the layers and creating and sharing web applications. Once you have finished this tutorial, you should have a high understanding of the main functions of ArcGIS online and be able to produce simple maps by using data available online through their server as well as learning how to upload and use your own data from multiple sources.
Transcript of ArcGIS online - University of Waterloo · Geospatial Centre | University of Waterloo | November...
Geospatial Centre | University of Waterloo | November 2015 1
Overview ArcGIS Online is a web-based mapping and app-building site created by Esri, the world leader in
GIS software. In an effort to empower users of all levels to create interactive maps and
applications that are easy to share, Esri developed the ArcGIS Online platform to realize its
vision. With both a free version for lay users and an organizational account for larger
enterprises, the functionality is tailored to different mapping and application needs. Not only
can users create custom maps using their own data, but they can also publish ready-to-use apps
that make sharing the information easy and intuitive for their audience. This guide explores the
capabilities that come with the free version, which is available to anyone with an Esri Global
Account.
Setting Up Although ArcGIS Online can be used without setting up an account, it also means not being able
to save your maps and applications. For the purpose of this guide, we will set up a free Esri
Global Account, which you can use to access not only ArcGIS Online but all of Esri’s training
resources. Go to http://www.arcgis.com and click on Sign In at the top-right corner of the page.
At the bottom left of the page, click on Create a Public Account and fill in the necessary info.
Once you’ve created your account (which includes receiving a verification email), sign in to
ArcGIS Online.
Note: The prominent, orange-coloured “30-Day Free Trial” button on the ArcGIS Online
landing page is intended for organizations, not individuals; therefore, be sure to create a
public account rather than an organizational one.
In this guide, we are going to learn how to use many features in ArcGIS Online including
creating basic maps, adding in layers, changing the symbology of the layers and creating and
sharing web applications. Once you have finished this tutorial, you should have a high
understanding of the main functions of ArcGIS online and be able to produce simple maps by
using data available online through their server as well as learning how to upload and use your
own data from multiple sources.
Geospatial Centre | University of Waterloo | November 2015 2
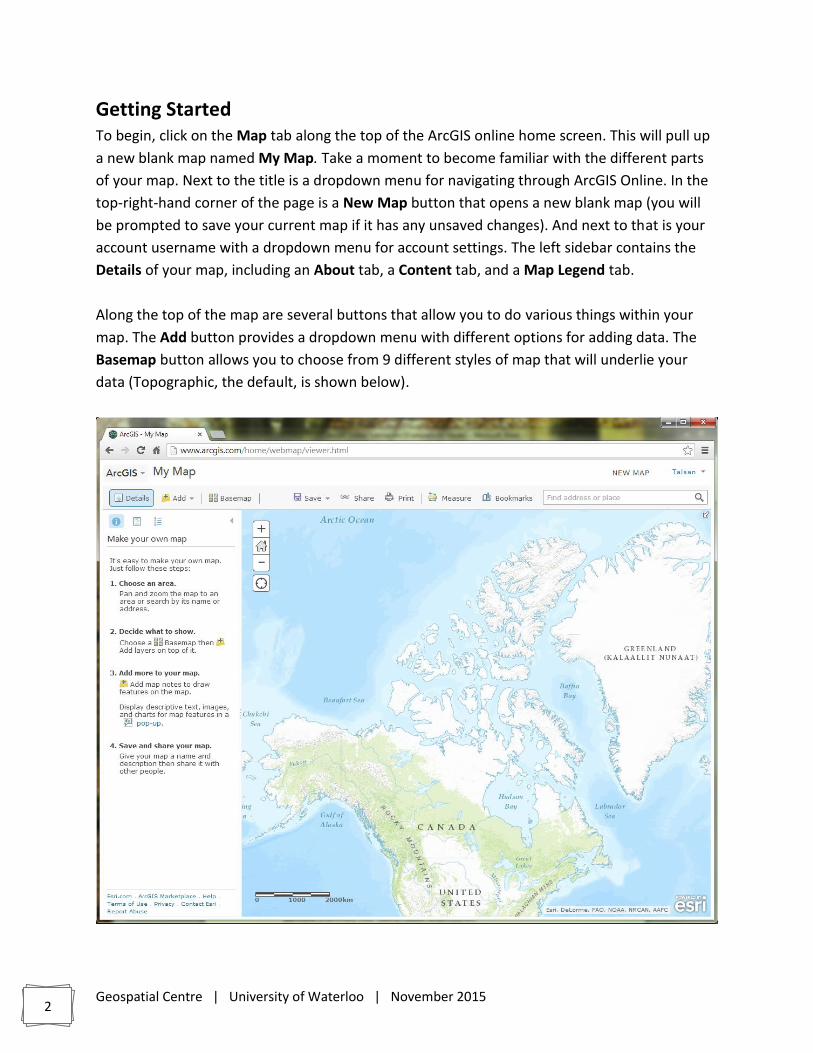
Getting Started To begin, click on the Map tab along the top of the ArcGIS online home screen. This will pull up
a new blank map named My Map. Take a moment to become familiar with the different parts
of your map. Next to the title is a dropdown menu for navigating through ArcGIS Online. In the
top-right-hand corner of the page is a New Map button that opens a new blank map (you will
be prompted to save your current map if it has any unsaved changes). And next to that is your
account username with a dropdown menu for account settings. The left sidebar contains the
Details of your map, including an About tab, a Content tab, and a Map Legend tab.
Along the top of the map are several buttons that allow you to do various things within your
map. The Add button provides a dropdown menu with different options for adding data. The
Basemap button allows you to choose from 9 different styles of map that will underlie your
data (Topographic, the default, is shown below).

Geospatial Centre | University of Waterloo | November 2015 3
The Save button lets you save the map as you add features to it. Share pops up a dialog box
giving various options for distributing your map. Print takes a snapshot of the map and its
peripheral info that can then be printed. You can also get Directions from A to B and Measure
distances, areas, or latitude-longitude coordinates. And if there’s a certain place you want to be
able to quickly return to on the map, create a Bookmark of that location, which records the
extent and position of the map. But in order to get to that place the first time, you may want to
use the Search box to find an address or a place. Navigating the map is relatively easy: click and
drag to Pan the map and Zoom In and Out using the scrollwheel on your mouse.
Picking a Location The first step in working with your map will be to choose a location to work in. For this guide,
we will use the University of Waterloo main campus. In the Search box, begin typing university
of waterloo and choose the result at 200 University Ave.
At this point, let’s take a moment to Save the map and give it some information. Note that the
map extent will also be saved, so make sure you like the zoom level. Click on either the Save or
Save As option and name the map. You can use the information below to populate the fields or
come up with your own Title (something short but descriptive), Tags (keywords that are used
for searching purposes), and Summary (a brief description of what the map is or what it shows).
Creating New Data Now that we have a location, we can start to add features to our map. To do this, we need to
Add Map Notes, which function as editable layers in the map. Click the Add menu and choose
Add Map Notes. This pops up a dialog box, which allows you to name your notes and choose

Geospatial Centre | University of Waterloo | November 2015 4
from several different templates for different applications. For now, just keep the default
settings and click Create.
You will notice that the Details pane on the left automatically changes to the Edit pane, which
contains tools for creating four basic features: Points, Text, Lines, Areas. We’ll start by creating
a point feature using the Pushpin. Click on the point tool, then zoom into the Dana Porter
Library (DP) on the university campus. Click on the northeast corner of the building to place
your Pushpin marker. Name the point Geospatial Centre and leave the description blank. If you
want to change the appearance of your marker, click Change Symbol and choose from the
various menu options and colors (these options would be good to explore for future reference).
There are numerous options for adding an Area (also known as a polygon), each of which you
can experiment with, but probably the most commonly used tool is Area, which allows you to
draw each vertex of your feature with a click of the mouse (double-click to finish your drawing

Geospatial Centre | University of Waterloo | November 2015 5
and close the polygon). Choose this tool and draw an area around the Peter Russell Rock
Garden as shown below.
When the callout box appears after you’ve created
the area, enter the information as seen below.
Next we’ll add a path using a Line feature. There
are two options for this: Line and Freehand Line.
The former lets you draw each vertex with a click
of the mouse; the latter requires you to click and hold while you draw your segment freehand.
Choose one of these options and draw a path from the library to the rock garden (you can draw
the route any way you please, as long as you follow established paths on campus). Name the
path Library to Rock Garden and click Close.
As with the point marker, you can change the symbol for any of the features you create.
Because the features we have created so far have a space for Name and Description, we will
not cover the Text feature. However, if you simply wanted to add a Text note to your map, this
would be a useful tool.
Adding Pre-existing Data
With the Map Notes, we created our own data layers right inside the map. But sometimes the
data you need already exists. ArcGIS Online has several ways of adding data to your map. The
easiest way is to search for data from the Add menu. Click on Add and choose Search for
Layers. In the search box, type uw roads and hit enter. Add the University of Waterloo
Roadlines to your map and click Done Adding Layers below the results list. This layer is a
simplified road network of the area around the UW campus.

Geospatial Centre | University of Waterloo | November 2015 6
Another method for adding data is through a hosted web service. Click on the Add dropdown
menu and choose Add Layer from Web. In the dialog box, enter the following URL:
http://tiles.arcgis.com/tiles/tjWJTKGrDe1oIfBu/arcgis/rest/services/uwcampusaerial2014/MapServer,
then click Add Layer. This imagery service is provided by the Regional Municipality of Waterloo
and is particularly useful because the ArcGIS Online satellite imagery is currently out-of-date
and missing several newer buildings on campus. Please note that due to copyright restrictions
on this layer, you can only view it up to a certain view level – once you have zoomed too far, it
will stop drawing.
The final method of adding data is to Add Layer from File, which uses your own locally stored
data files. There are several file types you can upload: Esri Shapefiles (in zipped format);
comma, semi-colon, or tab delimited text files (CSV or TXT); and GPS Exchange Format (GPX);
each allows you to upload a maximum of 1000 features.
Note: If you’d like to explore the Add Layer from File function another time, you can
move ahead to Customizing Your Layers on page 10.
Uploading Data Files For this section, we are going to utilize the City of Waterloo’s Open Data Catalogue, which
features datasets available to the public for general use (see the Open Data Waterloo User
Licence for details). To access the data, go to http://opendata.city-of-
waterloo.opendata.arcgis.com/ .
Shapefiles
We’ll begin with one of the most common geospatial data formats, the Shapefile (.shp).
Although the shapefile format was created by Esri, it can be read by virtually any GIS program,
including some programs that aren’t primarily intended for GIS such as AutoDesk’s drafting
software AutoCAD.
Geospatial Centre | University of Waterloo | November 2015 7
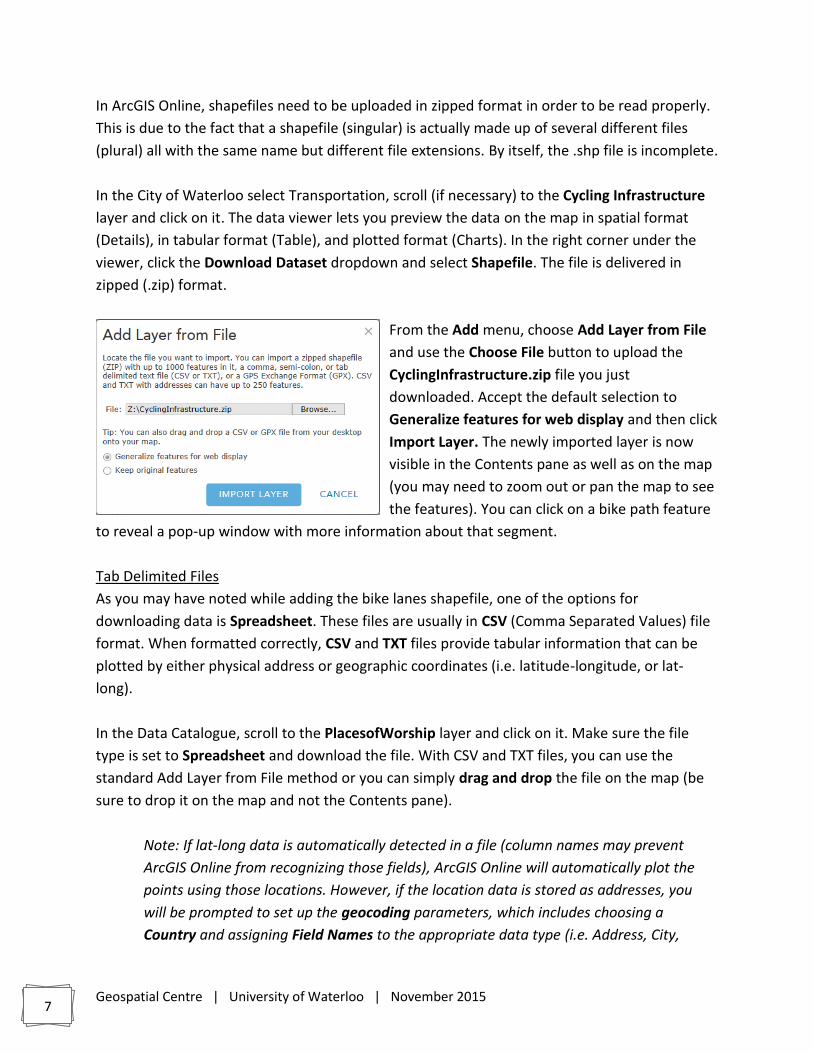
In ArcGIS Online, shapefiles need to be uploaded in zipped format in order to be read properly.
This is due to the fact that a shapefile (singular) is actually made up of several different files
(plural) all with the same name but different file extensions. By itself, the .shp file is incomplete.
In the City of Waterloo select Transportation, scroll (if necessary) to the Cycling Infrastructure
layer and click on it. The data viewer lets you preview the data on the map in spatial format
(Details), in tabular format (Table), and plotted format (Charts). In the right corner under the
viewer, click the Download Dataset dropdown and select Shapefile. The file is delivered in
zipped (.zip) format.
From the Add menu, choose Add Layer from File
and use the Choose File button to upload the
CyclingInfrastructure.zip file you just
downloaded. Accept the default selection to
Generalize features for web display and then click
Import Layer. The newly imported layer is now
visible in the Contents pane as well as on the map
(you may need to zoom out or pan the map to see
the features). You can click on a bike path feature
to reveal a pop-up window with more information about that segment.
Tab Delimited Files
As you may have noted while adding the bike lanes shapefile, one of the options for
downloading data is Spreadsheet. These files are usually in CSV (Comma Separated Values) file
format. When formatted correctly, CSV and TXT files provide tabular information that can be
plotted by either physical address or geographic coordinates (i.e. latitude-longitude, or lat-
long).
In the Data Catalogue, scroll to the PlacesofWorship layer and click on it. Make sure the file
type is set to Spreadsheet and download the file. With CSV and TXT files, you can use the
standard Add Layer from File method or you can simply drag and drop the file on the map (be
sure to drop it on the map and not the Contents pane).
Note: If lat-long data is automatically detected in a file (column names may prevent
ArcGIS Online from recognizing those fields), ArcGIS Online will automatically plot the
points using those locations. However, if the location data is stored as addresses, you
will be prompted to set up the geocoding parameters, which includes choosing a
Country and assigning Field Names to the appropriate data type (i.e. Address, City,

Geospatial Centre | University of Waterloo | November 2015 8
Postal, etc.). The Canada Address Locator is a sophisticated geocoder built by Esri and is
especially useful if your list contains addresses from more than one country. The dialog
for setting up geocoding is shown below and acts much like the other Add Layer from
File options.
GPX Files
Outdoor enthusiasts will probably be familiar with GPX files, which store location information
that can be used in GPS devices. However, GPX files go beyond GPS use in the field; they are
often imported and exported using various geospatial software, and they can be shared fairly
easily because of their relatively small file size.
The City of Waterloo Open Data Catalogue does not currently offer GPX files; therefore, we will
visit http://www.topofusion.com/gpx.php for the sake of illustrating the capability. On the
TopoFusion page, choose the Download Fantasy Island data in GPX format link and save the
file. As with the CSV file, you can drag and drop the FantasyIsland.gpx file onto the map to add
the layer. The map will probably zoom to the layer (in Tucson, Arizona) by default, but because
this was added for illustrative purposes, click on the gray arrow next to the Map Notes layer
and choose Zoom to (this and other functions will be described in more detail later on).
KML Files
Although they are not mentioned in the Add Layer from File dialog, KML files can also be added
to ArcGIS Online and used in your maps. This popular file format (Keyhole Markup Language)
was created by Google and is used in their popular Google Earth application. The City of
Waterloo’s Open Data Catalogue offers their data in KML format.

Geospatial Centre | University of Waterloo | November 2015 9
From the Data Catalogue, click on the Parks layer, change the file type to KML and click
Download. From the Save location, right-click on the ParkSpaces.zip folder and choose Extract
All…. From your map window, go to the ArcGIS dropdown menu (may also say Home) in the
top-left corner and choose My Content. On this page, you’ll see all the items you create in
ArcGIS Online. Above the list of items, click on + Add Item and browse to the ParkSpaces.kml
file you just extracted.
The Add Item dialog also
requires you to add Tags to
your new item, which helps
your item get found in
searches. Type the words
waterloo and parks in the
box (use the Tab key to add
additional tags), and when
everything looks like the
image on the left, click Add
Item.
Once the KML has finished uploading, the item description page will appear showing the details
of your newly added layer. Before you can add the KML to your map, however, you will need to
Share it with the public.
Under the thumbnail image, click Share, then check the box to Share the item(s) with:
Everyone (public) and click OK.

Geospatial Centre | University of Waterloo | November 2015 10
Use the link along the top of the page to go back to the My Content page where you will now
see your ParkSpaces.kml item listed. To the right of each item name is a small gray arrow. Click
the arrow next to ParkSpaces.kml and choose Add to Map, which will add the parks in Waterloo
to the map we’ve been working with.
Editing and viewing attribute information You may have noticed that not all of the roads have been digitized in
the road layer. With the help of the 2014 aerial imagery, we can add a
few roads that we feel should be part of the layer.
Start by clicking on the arrow next
to the roads layer and select
“Enable Editing”. An Edit button
will now appear on the ribbon
beside the Add button. Pan and
zoom to the area that you wish to add a road to and click the edit
button. Click on the New Feature button and then start clicking on the
map to add road lines.
Customizing Your Layers Under the Contents tab of your map’s Details, you should now see
nine layers and a basemap (Topographic). You will also notice that to
the right of each item is a small gray arrow. Clicking the arrow reveals
a dropdown menu showing the various actions you can perform on a given layer. Click the
arrow next to one of the layers and you will see options such as Zoom to, Transparency, Set
Visibility Range, and so forth. The options vary by layer, so what can be done with one layer
may not be possible with another.

Geospatial Centre | University of Waterloo | November 2015 11
Let’s use some of the menu options to tidy things up a bit. First, Rename FantasyIsland and
PlacesofWorship to put a space between the words. Next, Rename CyclingInfrastructure to
Waterloo Bike Lanes, ParkSpaces to Waterloo Parks, and uwcampusaerial2014 to Waterloo
Aerial 2014. Finally, change the Transparency on Waterloo Aerial 2014 to 50%. You can also
optionally remove the three event types that aren’t being used.
One last customization we’ll perform is Set Visibility Range. This allows you to control which
layers are visible at various zoom levels. Since the aerial imagery is of little use when zoomed
out too far to see much detail, we’ll set the visibility range so it doesn’t show past a certain
extent. Click on the menu next to Waterloo Aerials 2012 and hover over Set Visibility Range.
Change the dropdown for In closer than: to 1:40,000 (Town). Now zoom out on the map until
the aerial imagery disappears. Notice how much easier it is to read the map at this scale when
the aerials are hidden from view.
Note: ArcGIS Online also has tools that can be used to Perform Analysis on the data you
add or create. This functionality is only available on layers where editing has been
enabled. Where editing has been disabled (as is the case with Canada Median Age),
Perform Analysis will not be an option in the dropdown menu. However, you can still
customize the pop-up information on such layers by using the Configure Pop-up option
in the menu. Because this guide is intended as an overview of ArcGIS Online, we won’t
cover the Perform Analysis or Configure Pop-up tools. Nevertheless, feel free to explore
these options on your own to see what the possibilities are for you and your data.
Accessing the attribute table Behind each piece of spatial data there is tabular information. Often times
this information can be very useful to determine what an ambiguous dataset
can be used for, or give you an insight as to what types of analysis you can do
with a data set. For example, a set of address points may also contain
information about the type of building it is.
To view the attribute table of a layer, click on the arrow next to the layer
“Places of Worship” in the Table of Contents and click “Show Table”. You can
then sort the table based on different columns. Record what entries show up
at the top and bottom of the list when you sort the table by each column
name.
Sharing Your Map
Geospatial Centre | University of Waterloo | November 2015 12
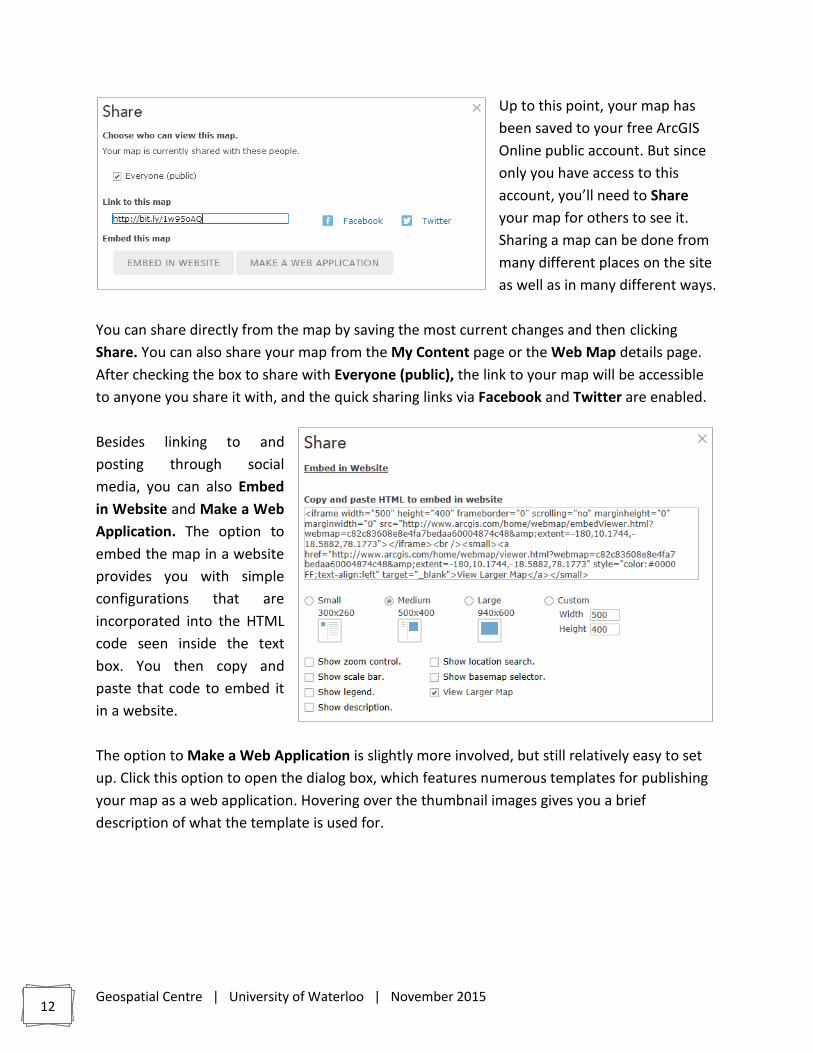
Up to this point, your map has
been saved to your free ArcGIS
Online public account. But since
only you have access to this
account, you’ll need to Share
your map for others to see it.
Sharing a map can be done from
many different places on the site
as well as in many different ways.
You can share directly from the map by saving the most current changes and then clicking
Share. You can also share your map from the My Content page or the Web Map details page.
After checking the box to share with Everyone (public), the link to your map will be accessible
to anyone you share it with, and the quick sharing links via Facebook and Twitter are enabled.
Besides linking to and
posting through social
media, you can also Embed
in Website and Make a Web
Application. The option to
embed the map in a website
provides you with simple
configurations that are
incorporated into the HTML
code seen inside the text
box. You then copy and
paste that code to embed it
in a website.
The option to Make a Web Application is slightly more involved, but still relatively easy to set
up. Click this option to open the dialog box, which features numerous templates for publishing
your map as a web application. Hovering over the thumbnail images gives you a brief
description of what the template is used for.

Geospatial Centre | University of Waterloo | November 2015 13
For this map, we’ll use the Basic Viewer template as a way to share our web map outside of the
ArcGIS Online viewer where we created it. Click the dropdown menu under the thumbnail
image and choose Publish. Enter the information for your web application as seen below, and
then click Save and Publish.
At this point, some
important information
appears on the screen.
Although the web map
was shared, the web
application is not yet
shared. Therefore, you
will want to View Item
so you can share the
web application.
Geospatial Centre | University of Waterloo | November 2015 14
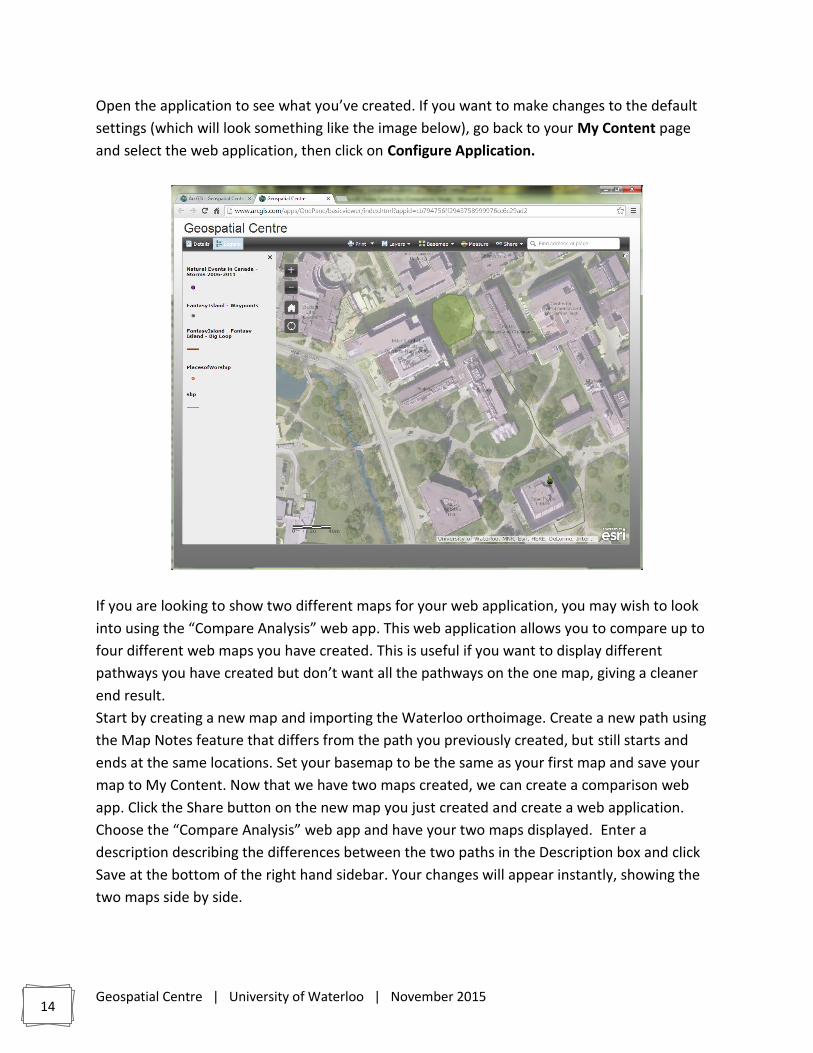
Open the application to see what you’ve created. If you want to make changes to the default
settings (which will look something like the image below), go back to your My Content page
and select the web application, then click on Configure Application.
If you are looking to show two different maps for your web application, you may wish to look
into using the “Compare Analysis” web app. This web application allows you to compare up to
four different web maps you have created. This is useful if you want to display different
pathways you have created but don’t want all the pathways on the one map, giving a cleaner
end result.
Start by creating a new map and importing the Waterloo orthoimage. Create a new path using
the Map Notes feature that differs from the path you previously created, but still starts and
ends at the same locations. Set your basemap to be the same as your first map and save your
map to My Content. Now that we have two maps created, we can create a comparison web
app. Click the Share button on the new map you just created and create a web application.
Choose the “Compare Analysis” web app and have your two maps displayed. Enter a
description describing the differences between the two paths in the Description box and click
Save at the bottom of the right hand sidebar. Your changes will appear instantly, showing the
two maps side by side.

Geospatial Centre | University of Waterloo | November 2015 15
Crowdsourcing with ArcGIS Online One of the great things that ArcGIS Online offers is the ability for multiple users to contribute
spatial data to a public space. Unfortunately, with the free account we cannot create our own
crowdsourcing layer (publishing an editable hosted layer is only available to organizational
accounts), but we can use an existing layer to demonstrate.
Create a new map and search for the layer “WhatsNearby”. Add this to your new map and save
it as ‘Crowdsourcing’.
Now that we have a map with an editable layer in it, we can create a crowdsourcing form/app.
Create a web app, but this time choose the GeoForm option (Second page of apps). Choose the
WhatsNearby layer as the editable layer. The default input settings are dropdown (“select”)
menus and text, but you may wish to use the other options they give you. You can also enter in
help and hint texts if you feel that some of the fields may be ambiguous.

Geospatial Centre | University of Waterloo | November 2015 16
Fields such as OBSERVID, NUMVOTES, and USERID can be left out for this tutorial, as the field
names are not descriptive enough for us to enter correct information or useful help text. You
can disable the fields by unchecking the checkbox in the Enabled column. You can also reorder
the fields by clicking and dragging in the Order column. Be sure to add help text to the fields so
that the user will know what to put into the fields (ex. “(123) 456-7890” for the phone number
help field to prompt the user to enter their phone number in the correct format).
The GeoForm comes with a variety of themes you can choose from. Depending on your
audience and the data you are presenting, you may prefer a different theme than the default
one chosen. In the final step, you will be able to preview the web app to determine whether or
not you wish to change anything. Be sure to try out your web app by entering a few points
around the University of Waterloo. Your final app should look similar to the screenshot below.

Geospatial Centre | University of Waterloo | November 2015 17

Geospatial Centre | University of Waterloo | November 2015 18
Wrapping Up ArcGIS Online provides an easy way for users to create and share maps. The free public account
does, of course, have some limitations, when compared with an organizational account. For
example, you cannot upload image files to your My Content folder with a public account, but
this functionality is possible with an organizational one. But even with the public account, you
probably noticed that there are many other features of this mapping platform that weren’t
covered in this guide. However, this introduction should give you the foundation for continuing
to explore the options on your own.
Much of how and what you learn will be by trial-and-error—even with this guide. So take the
time to discover the different tools and templates, the data and displays. See how geospatial
data can enhance your digital information and make data more meaningful by adding the
geographic element!
Updated: November 2015 by Marcus Wieland