
Arbeitspapiere der FOM · Arbeitspapiere der FOM, Nr. 57: Residential trade and industry PREFACE...
152
Arbeitspapiere der FOM Nr. 57 Residential trade and industry European market analysis, future trends and influencing factors ~ Roberto Cervelló-Royo / Francisco Guijarro Martínez / Thomas Pfahler / Marion Preuss
Transcript of Arbeitspapiere der FOM · Arbeitspapiere der FOM, Nr. 57: Residential trade and industry PREFACE...

Arb
eits
papi
ere
der
FOM
Nr. 57
Residential trade and industry
European market analysis, future trends and influencing factors
~Roberto Cervelló-Royo / Francisco Guijarro Martínez /
Thomas Pfahler / Marion Preuss
Roberto Cervelló-Royo / Francisco Guijarro Martínez /
Thomas Pfahler / Marion Preuss
Residential trade and industry European market analysis, future trends and influencing factors
Arbeitspapiere der FOM, Nr. 57 Essen 2015
ISSN 1865-5610
© 2015 by
MA Akademie Verlags- und Druck-Gesellschaft mbH Leimkugelstraße 6, 45141 Essen Tel. 0201 81004-351 Fax 0201 81004-610
Das Werk einschließlich seiner Teile ist urheberrechtlich geschützt. Jede Verwertung außerhalb der engen Grenzen des Urhebergeset-zes ist ohne Zustimmung der MA Akademie Verlags- und Druck-Gesellschaft mbH unzulässig und strafbar. Das gilt insbesondere für Vervielfältigungen, Übersetzungen, Mikroverfilmungen und die Ein- speicherung und Verarbeitung in elektronischen Systemen.
Die Wiedergabe von Gebrauchs-namen, Handelsnamen, Warenbe-zeichnungen usw. in diesem Werk berechtigt auch ohne besondere Kennzeichnung nicht zu der Annah-me, dass solche Namen im Sinne der Warenzeichen- und Marken-schutz-Gesetzgebung als frei zu betrachten wären und daher von jedermann benutzt werden dürfen. Oft handelt es sich um gesetzlich geschützte eingetragene Waren- zeichen, auch wenn sie nicht als solche gekennzeichnet sind.

Arbeitspapiere der FOM, Nr. 57: Residential trade and industry
PREFACE
Residential trade and industry assets are a basic need of individuals with the
result of assessing housing as a right in several nations all over the world. Though
there is a strong focus on the relationship between populations and housing
demands, there is no direct interaction between them for two reasons: it is mainly
households and not individuals that require real estate and, secondly, the needs
of households change over time.
Therefore, various correlations can be identified in order to clarify the movements
detected in housing asset stock on a foundation of household characteristics as
well as population and society performance structures. The analysis of housing
stock in terms of demographic development is important for gaining an in-depth
understanding of housing tendencies, general characteristics and underlying
economic factors.1
In the present volume of the FOM Arbeitspapiere the authors2 establish a market
and trend analysis of the European member countries on the basis of specified
criteria. Thus they identify numerous streams as well as analogical tendencies.
1 Cp. Leal, J. (2007), p. 22 ff. 2 Corresponding author: Marion Preuss

Arbeitspapiere der FOM, Nr. 57: Residential trade and industry
II
The identified results could be on the one hand useful for the corresponding
decision-makers to minimise risks, uncertainties and tilts in the medium-term. On
the other hand the latter could support the long-term development of real estate
markets in order to manage public and private investments in this sector with the
target of stabilising and advancing future real estate assets.
Hamburg, August 2015
Dr. Sabine Quirrenbach
Geschäftsleitung FOM Hochschulzentrum Hamburg
University of Applied Sciences
Arbeitspapiere der FOM, Nr. 57: Residential trade and industry
III
INDEX
LIST OF ABBREVIATIONS ................................................................................ IV
LIST OF FIGURES .............................................................................................. V
1 Introduction.................................................................................................... 1
2 Market analysis of the residential trade and industry in the European Union ............................................................................................................. 3
2.1 The progress in the European Union 27 ............................................. 3
2.2 Demographic progress ........................................................................ 8
2.3 Space progress ................................................................................. 46
2.4 Environmental social progress .......................................................... 57
3 Trends of the different European Union countries ...................................... 81
4 Conclusion and outlook ............................................................................... 95
LIST OF LITERATURE ....................................................................................... 97
APPENDIX........................................................................................................ 101

Arbeitspapiere der FOM, Nr. 57: Residential trade and industry
IV
LIST OF ABBREVIATIONS
A.D. Anno Domini
B.C. Before Christ
EEC European Economic Community
FOM Hochschule für Oekonomie &
Management
USA United States of America
USD United States Dollar
USSR Union of Soviet Socialist Republics
UVP Universidad Politécnica de Valencia
Arbeitspapiere der FOM, Nr. 57: Residential trade and industry
V
LIST OF FIGURES
Figure 1: Development of the population in Bulgaria .......................................... 8
Figure 2: Formation of the ageing indicators in Bulgaria ................................... 10
Figure 3: Trend of the number of households in Bulgaria ................................. 11
Figure 4: Development of the population in Estonia ......................................... 12
Figure 5: Formation of the ageing indicators in Estonia .................................... 13
Figure 6: Trend of the number of households in Estonia .................................. 15
Figure 7: Development of the population in Germany ....................................... 16
Figure 8: Formation of the ageing indicators in Germany ................................. 17
Figure 9: Trend of the number of households in Germany ............................... 19
Figure 10: Development of the population in Hungary ...................................... 20
Figure 11: Formation of the ageing indicators in Hungary ................................ 21
Figure 12: Trend of the number of households in Hungary ............................... 23
Figure 13: Development of the population in Latvia .......................................... 24
Figure 14: Formation of the ageing indicators in Latvia .................................... 25
Figure 15: Trend of the number of households in Latvia ................................... 26
Figure 16: Development of the population in Lithuania ..................................... 27
Figure 17: Formation of the ageing indicators in Lithuania ............................... 29
Figure 18: Average number of people per household in Lithuania ................... 30
Figure 19: Development of the population in Poland ........................................ 31
Figure 20: Formation of the ageing indicators in Poland ................................... 33
Figure 21: Clusters of households in Poland..................................................... 34
Figure 22: Development of the population in Romania ..................................... 35
Figure 23: Formation of the ageing indicators in Romania ............................... 37
Figure 24: Trend of the number of households in Romania .............................. 38
Figure 25: Development of the population in Slovakia ...................................... 39
Figure 26: Formation of the ageing indicators in Slovakia ................................ 40
Figure 27: Trend of the number of households in Slovakia ............................... 42
Figure 28: Development of the population in Spain .......................................... 43
Figure 29: Formation of the ageing indicators in Spain ..................................... 44
Figure 30: Formation of vacant dwellings in Spain ........................................... 45

Arbeitspapiere der FOM, Nr. 57: Residential trade and industry
VI
Figure 31: Build quality inside the housing in Bulgaria ...................................... 46
Figure 32: Trend of the age distribution of housing stock in Estonia ................ 47
Figure 33: Trend of the age distribution of housing stock in Germany .............. 48
Figure 34: Trend of the age distribution of housing stock in Hungary ............... 50
Figure 35: Trend of the age distribution of housing stock in Latvia ................... 51
Figure 36: Trend of the age distribution of housing stock in Lithuania .............. 52
Figure 37: Trend of the age distribution of housing stock in Poland ................. 53
Figure 38: Trend of the age distribution of housing stock in Romania .............. 54
Figure 39: Trend of the age distribution of housing stock in Slovakia ............... 55
Figure 40: Trend of the age distribution of housing stock in Spain ................... 56
Figure 41: The movement of the income level in Bulgaria ................................ 58
Figure 42: Economic conditions in Bulgaria ...................................................... 59
Figure 43: Economic conditions in Estonia........................................................ 61
Figure 44: Economic conditions in Germany ..................................................... 64
Figure 45: Economic conditions in Hungary ...................................................... 66
Figure 46: Economic conditions in Latvia .......................................................... 69
Figure 47: Economic conditions in Lithuania ..................................................... 71
Figure 48: Economic conditions in Poland ........................................................ 73
Figure 49: Economic conditions in Romania ..................................................... 75
Figure 50: Economic conditions in Slovakia ...................................................... 78
Figure 51: Economic conditions in Spain .......................................................... 80
Figure 52: Trends of the population development ............................................. 81
Figure 53: Tendencies of the median age of the populations ........................... 82
Figure 54: Development of the formation of the number of household ............. 83
Figure 55: The growing of the smaller 1- and 2-person households ................. 84
Figure 56: Shrinkage of the average number of people per household ............ 85
Figure 57: Movement to high-density and urban clusters ................................. 86
Figure 58: Formation of owner-occupied tenure status ..................................... 87
Figure 59: Exposure of total housing costs in purchasing power standards ..... 88
Figure 60: Equation of the construction cost indexes ........................................ 89
Figure 61: Trend of the income per capita ......................................................... 90
Arbeitspapiere der FOM, Nr. 57: Residential trade and industry
VII
Figure 62: Tendency of the GDP per capita ...................................................... 90
Figure 63: Formation of the population at risk of poverty .................................. 91
Figure 64: The tendencies of vacant conventional dwellings ............................ 92
Figure 65: Trends of the age distribution of housing stock ............................... 93

Arbeitspapiere der FOM, Nr. 57: Residential trade and industry
1
1 Introduction
Major demographic developments in recent decades have caused economies to
fluctuate, effecting supply and demand in the residential trade and industry. The
industry has had to react in order to stabilise, expand and avert shrinkage of its
assets. Rational decision-making is a must when dealing with this situation. There
is a high necessity for sense making of managerial decisions and strategies to
protect asset values. To successfully manage the situation, it is necessary to
focus on various fields such as demographic, space and environmental social
areas in order to gain an overview of the diverse movements and developments
in the different countries of the EU (European Union).
The aim of this paper is to realise a market analysis and identify the different
variables in order to differentiate between several streams and analogical
tendencies. In the focus of the present market analyses are the 27 countries of
the EU3 with decreasing populations, especially Bulgaria, Estonia, Germany,
Hungary, Latvia, Lithuania, Poland, Romania and Slovakia. Furthermore, there
will be a comparison with Spain whose population is expected to increase.
In Chapter 2, this paper begins with a brief description of the EU and following
the 10 in this study analysed countries, listing major historic developments and
also substantial data pertaining to them in order to gain an impression of the
protagonists at play. Then various variables relating to demographics, space and
environmental social progress are mentioned and analysed to identify the areas
of concern for the residential trade and industry.
To focus on the common ground and dissimilarities of the different countries in
these areas, important trends and shifts are highlighted in Chapter 3 to carving
out possible decision-making strategies. In Chapter 4, the paper ends with a
summary.
3 Although Croatia has been the 28th member state of the EU since July 2013, it is not
part of this analysis as a result of missing data.
Arbeitspapiere der FOM, Nr. 57: Residential trade and industry
3
2 Market analysis of the residential trade and industry in the European Union
A market analysis is essential for detecting different movements in the residential
trade and industry of Europe. Therefore, this chapter begins with a short
explanation of the afore-mentioned ten EU countries including their basic historic
progresses. Then several data of demographics, space and environmental social
developments are declared and analysed in order to detect the significant fields
of interest for the real estate segment. Consequently various base years of
databases from, e.g., The European Commission, The EU, Eurostat (European
Statistical Office), The United Nations and many more are explained in this
chapter with base years from around 1950 until 2050.4 Nevertheless, some data
are not available and therefore not mentioned in the analyses of this market
research.
2.1 The progress in the European Union 27
The EU is an economic and political alliance established in 1992 after ratification
of the Maastricht Treaty by members of the European Community. This alliance
includes 27 member states and expanded the political coverage of the European
Economic Community, mainly in the field of foreign and security affairs. The EU
advocated the establishment of an European bank and the implementation of a
common valuta, named the euro.5
In 2012 the GDP (Gross Domestic Product) of the EU economy amounted to
12,945,402 million euros. With around 7.0 % of the world’s population, the EU
trades about 20.0 % of all global exports and imports. Approximately 67.0 % of
the EU states trade with other EU countries. The EU was the largest importer with
a share of 16.4 % in 2011, followed by the United States with 15.5 % and China
with 11.9 %. The EU was also the most important exporter with 15.4 % of all
4 Cp. Appendix 1-8 of this analysis, pp. 78-102. 5 Cp. European Union (w.y.a), w. p., (date of demand: 15.07.2015) and European
Union (w.y.b), w. p., (date of demand: 15.07.2015).
Arbeitspapiere der FOM, Nr. 57: Residential trade and industry
4
exports, followed by China with 13.4 % and the United States with 10.5 %.6
Therefore, this alliance has strong macro- and micro-economic power with a high
potential for the EU member states.
There now brief descriptions of the analysed EU states will follow covering their
historical and economic developments of the last few decades:
Bulgaria is a country located in the southeast of Europe. It was first populated in
the 6th century A.D. From the 14th century it was occupied by the Ottoman Empire,
referred to sometimes as the Turkish Empire, and became independent in 1908.
After invading Bulgaria in 1944, the Soviet Union founded the People’s Republic
of Bulgaria, after which the country was under a communist government until
1989. The state established a demographic constitution in 1991. Bulgaria’s
capital is Sofia.7 It gained admission to the EU in 2007.8
Estonia is a state located in Northern Central Europe west of Russia. The country
was settled before the 1st century A.D. In the period between the 13th and 18th
centuries Estonia was occupied by the states Denmark, Germany, Sweden and
Russia. It became independent in 1918. In 1940 it was annexed by the USSR. In
1941 it was occupied by Germany, but in 1944 it reverted to being a Soviet state
named the Estonian Soviet Socialist Republic. Complete independence was
established in 1991. The capital of Estonia is Tallinn.9 Its EU entry was in 2004.10
Germany is a state in Northern Central Europe. In 500 B.C. it was annexed by
Germanic tribes. In the 6th century A.D. Germany became part of the Frankish
empire. Afterwards it became a federation of different princedoms and the core
of the Holy Roman Empire. In 1806 this imperial state was finished by Napoleon.
After 1815 Germany became an alliance and from 1871 to 1918 it was an empire
located around Prussia. After defeat in the First World War, it was restructured
6 Cp. European Union (w.y.c), w. p., (date of demand: 20.07.2015). 7 Cp. The American Heritage (2013a), w. p., (date of demand: 17.08.2015). 8 Cp. European Union (2014w.y.b), w. p., (date of demand: 20.07.2015). 9 Cp. The American Heritage (2013b), w. p., (date of demand: 17.08.2015). 10 Cp. European Union (w.y.c), w. p., (date of demand: 20.07.2015).
Arbeitspapiere der FOM, Nr. 57: Residential trade and industry
5
as the Weimar Republic, which came to an end when Adolf Hitler formed the
Third Reich. With Germany's defeat in 1945 at the end of the Second World War
the country was divided into four occupation zones controlled by the Allied
powers. In 1949 the zones of the allies USA, France and Britain formed West
Germany, while the Soviet zone became East Germany. These two parts of
Germany were reunified in 1990 after the collapse of the East German
Communist regime. The capital of Germany is Berlin.11 Germany was one of the
founding members of the EU and prior to this it was a member of the European
Economic Community from 1952.12
Hungary is a state in central Europe. Before the late 9th century Hungary was
under the authority of the Roman, Hunnish, Gothic and Slavic federations.
Foreign control ended when the country was captured by Magyars. In 997 St.
Stephen founded the first Hungarian state. After 1526, Hungary was ruled by the
Ottoman Turks. It later fell under Habsburg control, during which time in 1867 it
became part of Austria-Hungary. In 1918 Hungary became independent again. A
communist regime was installed in 1949, which lasted until 1989 when the
country became democratic. Budapest is the capital of Hungary.13 It entered the
EU in 2004.14
Latvia is a state in northern central Europe. In the 1200s the ancestral inhabitants,
the Letts, were captured and Christianised by German knights, named the
Livonian Brothers of the Sword, who controlled the area until 1561 when Latvia
was passed to Poland. From the 18th century, the country was under Russian
control. After the First World War, Latvia became independent. In 1940 the state
was annexed by the USSR and named the Latvian Soviet Socialist Republic. In
11 Cp. The American Heritage (2013c), w. p., (date of demand: 17.08.2015). 12 Cp. European Union (w.y.c), w. p., (date of demand: 20.07.2015). 13 Cp. The American Heritage (2013d), w. p., (date of demand: 17.08.2015). 14 Cp. European Union (w.y.c), w. p., (date of demand: 20.07.2015).
Arbeitspapiere der FOM, Nr. 57: Residential trade and industry
6
1990 Latvia declared its independence. Riga is its capital city.15 It entered the EU
in 2004.16
Lithuania is a state in northern central Europe. In the 1200s its different regions
were first brought together, whereby it became one of the largest countries in
medieval Europe. In 1569 Lithuania merged with Poland, but was annexed into
three Russian parts of Poland in 1772, 1793 and 1795. Lithuania was an
independent country from 1918 to 1940 when it became a constituent regime of
the USSR. From 1941 until 1944 it was occupied by Germany, but after the
Second World War it reverted to Soviet rule as the Lithuanian Soviet Socialist
Republic. In 1991 Lithuania again achieved independence. Vilnius is its capital.17
The country has belonged to the EU since 2004.18
Poland is a state in central Europe. In the 10th century it was unified as a kingdom,
and was established under the Jagiello Dynasty in the period from 1386 until
1572. It was a major power in the 15th and 16th centuries. In 1697 Poland lost its
independence and became fragmented into three parts in 1772, 1793 and 1795.
In 1918 Poland was reconstituted as a republic. Its current borders were fixed at
the end of the Second World War. Warsaw is the capital of Poland.19 Its EU entry
was in 2004.20
Romania is a country in southeast Europe. From the 3rd to the 12th century, the
state was annexed by a succession of invaders including the Goths, Huns,
Magyars and Mongols. In the 13th century the princedoms Moldavia and
Wallachia emerged within the Ottoman Empire and the Russian protectorates. In
1862 the princedoms were united then became an independent state in 1878. As
a result of a growing fascist system in the 1930s the monarchy regime changed
to a dictatorship in 1940. During the Second World War, Romania surrendered to
15 Cp. The American Heritage (2013e), w. p., (date of demand: 17.08.2015). 16 Cp. European Union (w.y.c), w. p., (date of demand: 20.07.2015). 17 Cp. The American Heritage (2013f), w. p., (date of demand: 17.08.2015). 18 Cp. European Union (w.y.c), w. p., (date of demand: 20.07.2015). 19 Cp. The American Heritage (2013g), w. p., (date of demand: 17.08.2015). 20 Cp. European Union (w.y.c), w. p., (date of demand: 20.07.2015).
Arbeitspapiere der FOM, Nr. 57: Residential trade and industry
7
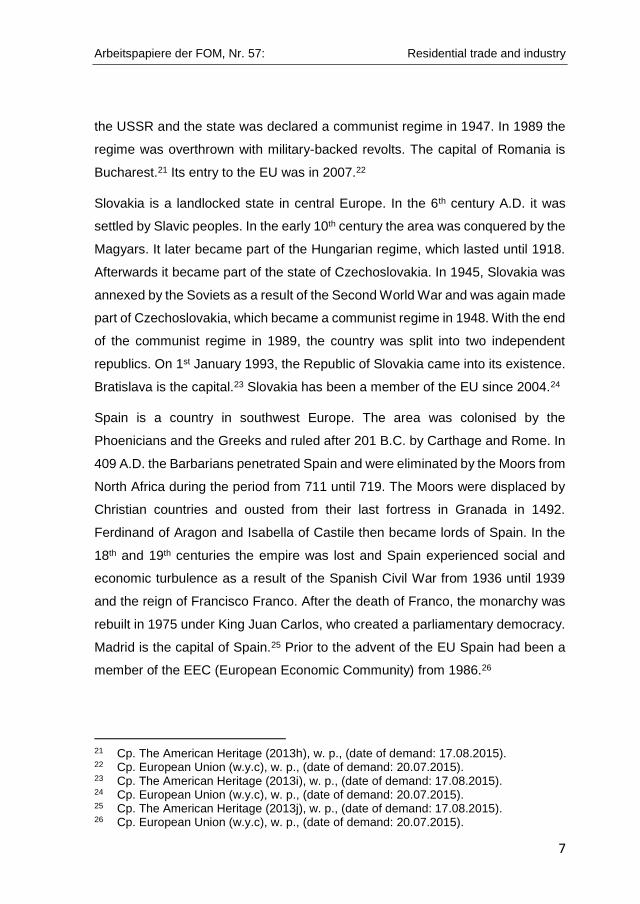
the USSR and the state was declared a communist regime in 1947. In 1989 the
regime was overthrown with military-backed revolts. The capital of Romania is
Bucharest.21 Its entry to the EU was in 2007.22
Slovakia is a landlocked state in central Europe. In the 6th century A.D. it was
settled by Slavic peoples. In the early 10th century the area was conquered by the
Magyars. It later became part of the Hungarian regime, which lasted until 1918.
Afterwards it became part of the state of Czechoslovakia. In 1945, Slovakia was
annexed by the Soviets as a result of the Second World War and was again made
part of Czechoslovakia, which became a communist regime in 1948. With the end
of the communist regime in 1989, the country was split into two independent
republics. On 1st January 1993, the Republic of Slovakia came into its existence.
Bratislava is the capital.23 Slovakia has been a member of the EU since 2004.24
Spain is a country in southwest Europe. The area was colonised by the
Phoenicians and the Greeks and ruled after 201 B.C. by Carthage and Rome. In
409 A.D. the Barbarians penetrated Spain and were eliminated by the Moors from
North Africa during the period from 711 until 719. The Moors were displaced by
Christian countries and ousted from their last fortress in Granada in 1492.
Ferdinand of Aragon and Isabella of Castile then became lords of Spain. In the
18th and 19th centuries the empire was lost and Spain experienced social and
economic turbulence as a result of the Spanish Civil War from 1936 until 1939
and the reign of Francisco Franco. After the death of Franco, the monarchy was
rebuilt in 1975 under King Juan Carlos, who created a parliamentary democracy.
Madrid is the capital of Spain.25 Prior to the advent of the EU Spain had been a
member of the EEC (European Economic Community) from 1986.26
21 Cp. The American Heritage (2013h), w. p., (date of demand: 17.08.2015). 22 Cp. European Union (w.y.c), w. p., (date of demand: 20.07.2015). 23 Cp. The American Heritage (2013i), w. p., (date of demand: 17.08.2015). 24 Cp. European Union (w.y.c), w. p., (date of demand: 20.07.2015). 25 Cp. The American Heritage (2013j), w. p., (date of demand: 17.08.2015). 26 Cp. European Union (w.y.c), w. p., (date of demand: 20.07.2015).

Arbeitspapiere der FOM, Nr. 57: Residential trade and industry
8
2.2 Demographic progress
Bulgaria (BG)
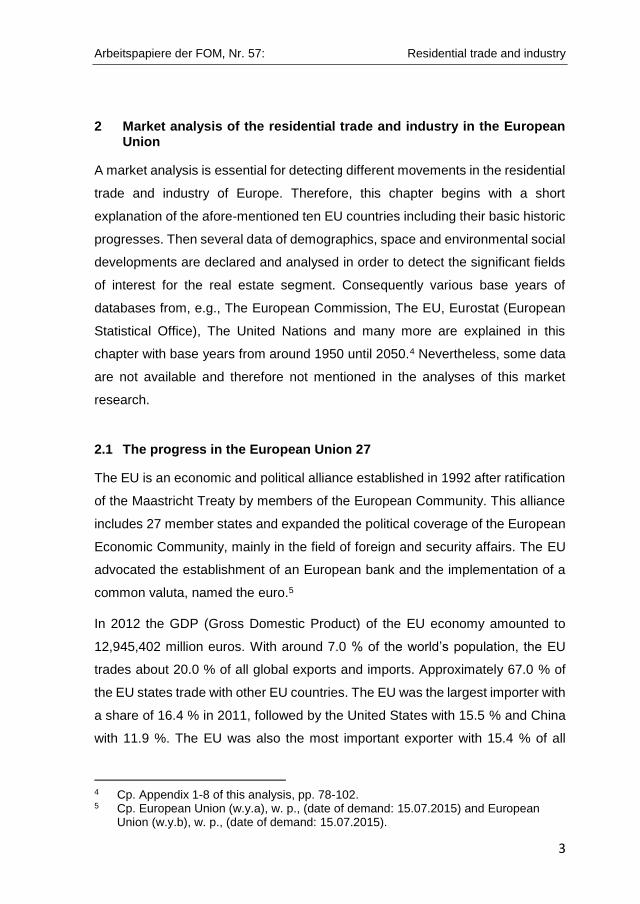
Bulgaria has a population of around 7.5 million,27 which is in decline. In 1970 it
was 8.5 million28 representing an 11.8 % reduction compared to the recorded
figure for 2010. In 2050 the population is predicted to be 5.9 million,29 which will
mean a fall of 21.5 % (see figure 1). This reduction would be much greater without
the increase of the net migration ratio from minus 9.9 thousand in 2010 to plus
3.8 thousand people predicted for 2050,30 which would balance the population
shrinkage in a positive manner. The reason for the population fall is a low fertility
rate, which fell from 2.2 in 197031 to 1.6 in 2010.32 Nevertheless, the fertility rate
is one of the highest for the analysed countries. Forecasts indicate that this rate
will stabilise at this low insufficient level.33
Figure 1: Development of the population in Bulgaria
Source: based on European Commission (2012), p. 297, Eurostat (2010a), p. 163.
27 Cp. European Commission (2012), p. 297. 28 Cp. Eurostat (2010a), p. 163. 29 Cp. European Commission (2012), p. 297. 30 Cp. European Commission (2012), p. 296. 31 Cp. Eurostat (2011), p. 112 ff. 32 Cp. European Commission (2012), p. 294. 33 Cp. European Commission (2012), p. 294.
1970 2010 2050
Population (millions) 8,50 7,50 5,90
0,0
2,0
4,0
6,0
8,0
10,0
Po
pu
lati
on
(m
illio
ns)
Arbeitspapiere der FOM, Nr. 57: Residential trade and industry
9
The age structures have shown a significant shift in Bulgaria. As mentioned
before, the fertility rate is low with the consequence of a decline of younger
generations. On the other hand, life expectancy is increasing. From a male life
expectancy of 69.1 and female of 73.5 in the base year 1970,34 the figures had
risen to 70.3 and 77.5, respectively, by 2010.35 In 2050 it is predicted that the
figures will be 79.7 and 85.0, respectively.36 This shows a growth trend of around
15.4 % for males and 15.7 % for females from 1970 to 2050. As a result, the
ageing indicators are changing rapidly. In 1970 children aged 0 to 14 represented
22.8 % of the population.37 The working-age population aged 15 to 64
represented 67.5 % and the elderly population aged 65 years and older 9.6%.38
Today with the latest base year 2010 children have shown a shift of nearly minus
40 %, while for the elderly population it is plus 83 %. The working population is
on the whole stable at 68.7 %.39 In 2050 a marginal difference of the children’s
population of 13.5 % in total is expected, a significant shift of minus 19.5 % in the
working population, and one of 177.5 % in the elderly population,40 which
demonstrates the demographic trends in a clear manner (see figure 2). The
median age will rise from 43.0 currently to 48.1 in 2050.41 The current median
age is the second highest after Germany; nevertheless, it will stabilise by 2050 to
a mid-table position among the researched states.
34 Cp. Eurostat (2011), p. 112 ff. 35 Cp. European Commission (2012), p. 294 f. 36 Cp. European Commission (2012), p. 294 f. 37 Cp. United Nations (2013), p. 336. 38 Cp. United Nations (2013), p. 336. 39 Cp. European Commission (2012), p. 298 ff. 40 Cp. European Commission (2012), p. 298 ff. 41 Cp. United Nations (2013), p. 70 ff.

Arbeitspapiere der FOM, Nr. 57: Residential trade and industry
10
Figure 2: Formation of the ageing indicators in Bulgaria
Source: based on European Commission (2012), p. 298 ff., United Nations (2013), p. 336.
The trend in the residential trade and industry has been the opposite. The number
of households in 1965 was 2,542,48042 compared to 2,900,80043 in 2009; by 2030
it is predicted to be 3,236,000 after a period of continuous growth (see figure 3).44
This tendency demonstrates an increase of 27.3 % compared to 1965. The
reason is the development of the household clusters: In 1965 the approximate
share of 1-person households was 17.0 %, 2-person households 20.7 %, 3-
42 Cp. United Nations (1974), p. 38 ff. 43 Cp. CECODHAS (2012), p. 38 ff. 44 Cp. United Nations (2001), p. 246.
1970 2010 2050
Children population (0-14 years)
22,82% 13,70% 13,50%
Working agepopulation (15-64
years)67,54% 68,70% 55,30%
Elderly population (age65+)
9,64% 17,60% 31,20%
0%
10%
20%
30%
40%
50%
60%
70%
80%
Age
ing
ind
icat
ors
(%
of
tota
l po
pu
lati
on
)

Arbeitspapiere der FOM, Nr. 57: Residential trade and industry
11
person households 21.6 % and 4-and-more-person households 40.6 %45 with an
average number of people per household of 3.2.46 In 2009 the average number
of households was 2.4.47 Although the percentage of clusters of households is
not available for this base year, it represents a change from 3-and-more-person
households to smaller 1- and 2-person households with the result of an increase
of households in total.
Figure 3: Trend of the number of households in Bulgaria
Source: based on CECODHAS Housing Europe (2012), p. 38 ff., United Nations (1974), p. 38 ff., United Nations (2001), p. 246.
Estonia (EE)
In 2010 the population of Estonia was around 1.3 million,48 which is also in
decline; in 1970 it was 1.449. In 2050 population is predicted to be 1.2 million50,
which is also a decrease of around 15 % from 1970 to 2050 (see figure 4). Like
Bulgaria this trend would be more significant without the development of the net
migration from minus 0.5 thousand in 2010 to plus 0.8 thousand people predicted
45 Cp. United Nations (1974), p. 38 ff. 46 Cp. United Nations (1974), p. 56 ff. 47 Cp. CECODHAS (2012), p. 38 ff. 48 Cp. European Commission (2012), p. 297. 49 Cp. Eurostat (2010a), p. 163. 50 Cp. European Commission (2012), p. 297.
1965 2009 2030
Number of households(millions)
2,54 2,90 3,24
- 0,50 1,00 1,50 2,00 2,50 3,00 3,50
Ho
use
ho
ld in
dic
ato
rs
(mill
ion
s)

Arbeitspapiere der FOM, Nr. 57: Residential trade and industry
12
for 2050.51 Again like Bulgaria, this population fall is a result of a low fertility rate,
which was 1.6 in 2010,52 representing the highest fertility level of the researched
countries together with Bulgaria. By 2050 it is predicted to have risen to 1.7
children per woman,53 which will also be among the highest of the analysed
states.
Figure 4: Development of the population in Estonia
Source: based on European Commission (2012), p. 297, Eurostat (2010a), p. 163.
Furthermore, there is movement in the age indicators in Estonia. The age clusters
for the base year 1970 are not available54; nevertheless, in 2010 the life
expectancies were 69.8 for males and 80.1 for females.55 In 2050 the forecast is
79.6 and 86.6, respectively.56 This trend represents a development of plus 9.8
years for males and plus 6.5 years for females from 2010 to 2050. Consequently
the ageing indicators will change. In 1970 the cluster of the children’s population
aged 0 to 14 represented 22.0 % of the total population.57 The working-age
51 Cp. European Commission (2012), p. 296. 52 Cp. European Commission (2012), p. 294. 53 Cp. European Commission (2012), p. 294. 54 Cp. Eurostat (2011), p. 112 ff. 55 Cp. European Commission (2012), p. 294 f. 56 Cp. European Commission (2012), p. 294 f. 57 Cp. United Nations (2013), p. 336.
1970 2010 2050
Population (millions) 1,40 1,30 1,20
1,10
1,15
1,20
1,25
1,30
1,35
1,40
1,45
Po
pu
lati
on
(m
illio
ns)

Arbeitspapiere der FOM, Nr. 57: Residential trade and industry
13
population aged 15 to 64 represented 66.2 % and the elderly population aged 65
and older nearly 12 %.58
Today the children’s population has fallen to 15.2 % and the elderly population
raised to 17.0 %.59 The working population has increased to 67.7 %.60 In 2050
forecasts indicate that the children’s population will represent 15.0 % of the total,
the working-age population 57.1 % and the elderly population 27.9 % (see figure
5).61 This is a significant shift of minus 31.8 % for children, minus 13.7 % for the
working population and a higher one of plus 132.5 % for the elderly from 1970 to
2050. The result is an increase of the median age in years from 40.9 in 2013 to
44.4 in 2050,62 which falls in the middle of the analysed states today, but will
develop to become one of the youngest median ages in the future.
Figure 5: Formation of the ageing indicators in Estonia
Source: based on European Commission (2012), p. 298 ff., United Nations (2013), p. 336.
58 Cp. United Nations (2013), p. 336. 59 Cp. European Commission (2012), p. 298 ff. 60 Cp. European Commission (2012), p. 298 ff. 61 Cp. European Commission (2012), p. 298 ff. 62 Cp. United Nations (2013), p. 70 ff.
1970 2010 2050
Children population(0-14 years)
22,00% 15,20% 15,00%
Working agepopulation (15-64
years)66,23% 67,70% 57,10%
Elderly population(age 65+)
11,77% 17,00% 27,90%
0%10%20%30%40%50%60%70%80%
Age
ing
ind
icat
ors
(%
of
tota
l p
op
ula
tio
n)

Arbeitspapiere der FOM, Nr. 57: Residential trade and industry
14
The tendency in the residential trade and industry is the opposite. As a result of
the annexation by the USSR for the base year 1965 there is just the total number
of USSR households available, 50,333,000; the number for Estonia is not
available.63 In 2009 the number for Estonia was 548,500.64 An increasing trend
is forecast until 2030 when the number of households will reach 607,000,65 which
is a development of approximately 10.6 % over a period of 21 years (see figure
6). In 2008 1-person households represented 33.0 % of the total, 2-person
households 30.0 %, 3-person households 20.0 % and 4-and-more-person
households 17.0 %.66 Despite the lack of available base-year data, it can still be
determined that Estonia has experienced an increase in smaller 1- and 2-person
households, because the average number of people per household was 3.7 in
196567 compared to 2.4 in 2009.68 The shift in age structures is clearly visible in
the context of the household compositions: The share of the single adults under
65 is 18.3 %; single adults aged 65 and over 15.4 %; couples both under 65
11.1 %; couples with at least one aged 65 and older 7.8 %; others, no under 18s
19.1 %; single adults with children 4.2 %; and two and more adults with children
24.2 %.69 This demonstrates that senior households represent a minimum of
23.2 % of the total, which is a significant share held by senior households. 8 % of
dwellings were vacant in 2009,70 which is high in comparison to the other
analysed EU states.
63 Cp. United Nations (1974), p. 38 ff. 64 Cp. CECODHAS Housing Europe (2012), p. 38 ff. 65 Cp. United Nations (2001), p. 246. 66 Cp. Ministry of the Interior and Kingdom Relations et al. (2010), p. 30. 67 Cp. United Nations (1974), p. 56 ff. 68 Cp. CECODHAS Housing Europe (2012), p. 38 ff. 69 Cp. Eurostat (2010b), p. 84. 70 Cp. Ministry of the Interior and Kingdom Relations (2010), p. 63.

Arbeitspapiere der FOM, Nr. 57: Residential trade and industry
15
Figure 6: Trend of the number of households in Estonia
Source: based on CECODHAS Housing Europe (2012), p. 38 ff., United Nations (2001), p. 246.
Germany (DE)
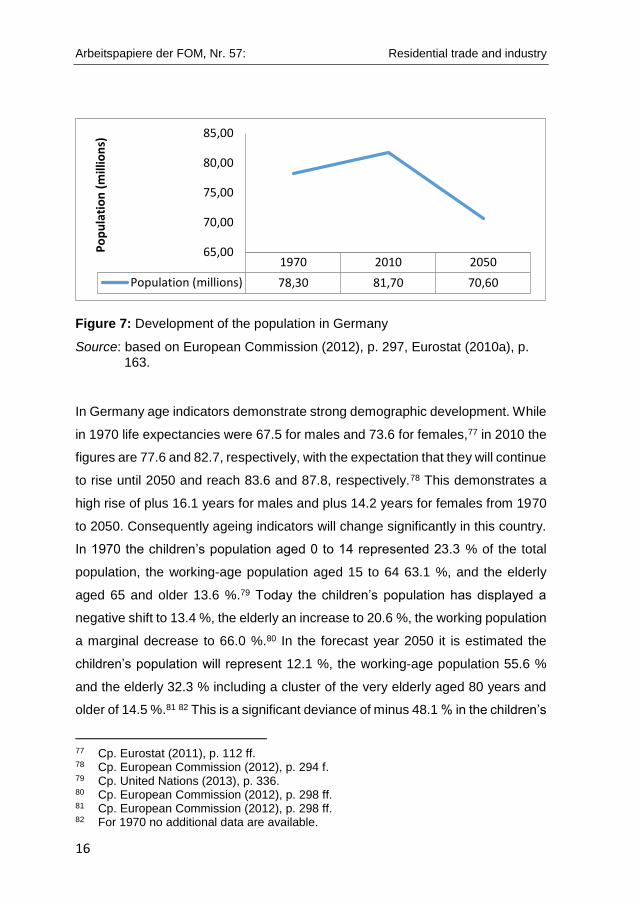
In 2010 Germany’s population was 81.7 million people,71 an increase of 4.3 %
from 78.3 million in 1970.72 Nevertheless, it is predicted that the population will
have fallen to 70.6 million people by 2050,73 which is again a negative trend of
around minus 9.8 % from 1970 to 2050 (see figure 7). Also, in Germany net
migration will prevent a higher decline; from 41.0 thousand migrants coming to
Germany in 2010, the figure is predicted to have risen to 87.7 thousand by 2050.74
Like in the afore-mentioned countries, Germany’s fertility rate was quite low at
1.4 children per woman in 2010.75 This figure is predicted to have risen to 1.5 by
2050,76 which is also low and the average for the EU.
71 Cp. European Commission (2012), p. 297. 72 Cp. Eurostat (2010a), p. 163. 73 Cp. European Commission (2012), p. 297. 74 Cp. European Commission (2012), p. 296. 75 Cp. European Commission (2012), p. 294. 76 Cp. European Commission (2012), p. 294.
2009 2030
Number ofhouseholds (millions)
0,55 0,61
0,50
0,52
0,54
0,56
0,58
0,60
0,62
Ho
use
ho
ld in
dic
ato
rs
Arbeitspapiere der FOM, Nr. 57: Residential trade and industry
16
Figure 7: Development of the population in Germany
Source: based on European Commission (2012), p. 297, Eurostat (2010a), p. 163.
In Germany age indicators demonstrate strong demographic development. While
in 1970 life expectancies were 67.5 for males and 73.6 for females,77 in 2010 the
figures are 77.6 and 82.7, respectively, with the expectation that they will continue
to rise until 2050 and reach 83.6 and 87.8, respectively.78 This demonstrates a
high rise of plus 16.1 years for males and plus 14.2 years for females from 1970
to 2050. Consequently ageing indicators will change significantly in this country.
In 1970 the children’s population aged 0 to 14 represented 23.3 % of the total
population, the working-age population aged 15 to 64 63.1 %, and the elderly
aged 65 and older 13.6 %.79 Today the children’s population has displayed a
negative shift to 13.4 %, the elderly an increase to 20.6 %, the working population
a marginal decrease to 66.0 %.80 In the forecast year 2050 it is estimated the
children’s population will represent 12.1 %, the working-age population 55.6 %
and the elderly 32.3 % including a cluster of the very elderly aged 80 years and
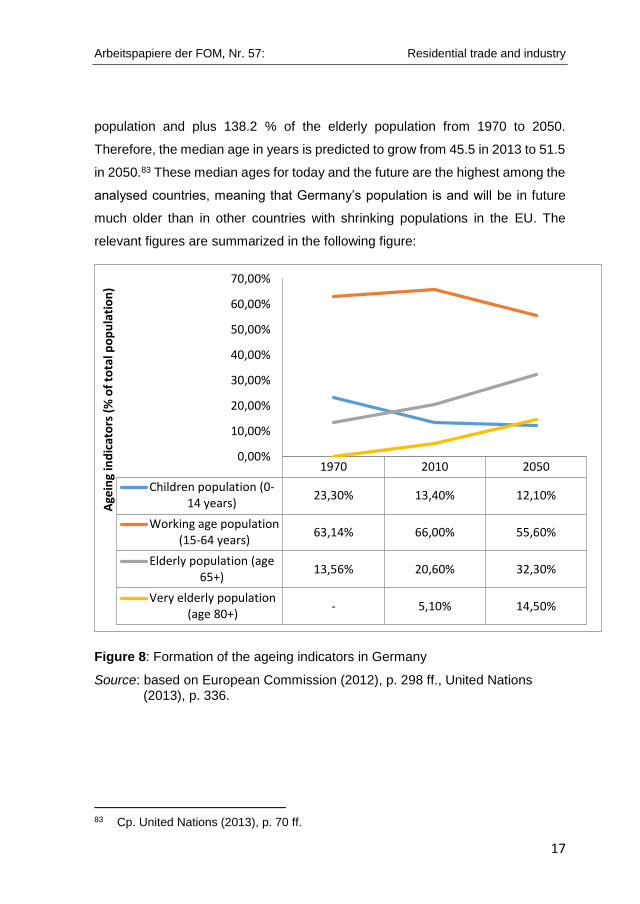
older of 14.5 %.81 82 This is a significant deviance of minus 48.1 % in the children’s
77 Cp. Eurostat (2011), p. 112 ff. 78 Cp. European Commission (2012), p. 294 f. 79 Cp. United Nations (2013), p. 336. 80 Cp. European Commission (2012), p. 298 ff. 81 Cp. European Commission (2012), p. 298 ff. 82 For 1970 no additional data are available.
1970 2010 2050
Population (millions) 78,30 81,70 70,60
65,00
70,00
75,00
80,00
85,00
Po
pu
lati
on
(m
illio
ns)
Arbeitspapiere der FOM, Nr. 57: Residential trade and industry
17
population and plus 138.2 % of the elderly population from 1970 to 2050.
Therefore, the median age in years is predicted to grow from 45.5 in 2013 to 51.5
in 2050.83 These median ages for today and the future are the highest among the
analysed countries, meaning that Germany’s population is and will be in future
much older than in other countries with shrinking populations in the EU. The
relevant figures are summarized in the following figure:
Figure 8: Formation of the ageing indicators in Germany
Source: based on European Commission (2012), p. 298 ff., United Nations (2013), p. 336.
83 Cp. United Nations (2013), p. 70 ff.
1970 2010 2050
Children population (0-14 years)
23,30% 13,40% 12,10%
Working age population(15-64 years)
63,14% 66,00% 55,60%
Elderly population (age65+)
13,56% 20,60% 32,30%
Very elderly population(age 80+)
- 5,10% 14,50%
0,00%
10,00%
20,00%
30,00%
40,00%
50,00%
60,00%
70,00%
Age
ing
ind
icat
ors
(%
of
tota
l po
pu
lati
on
)
Arbeitspapiere der FOM, Nr. 57: Residential trade and industry
18
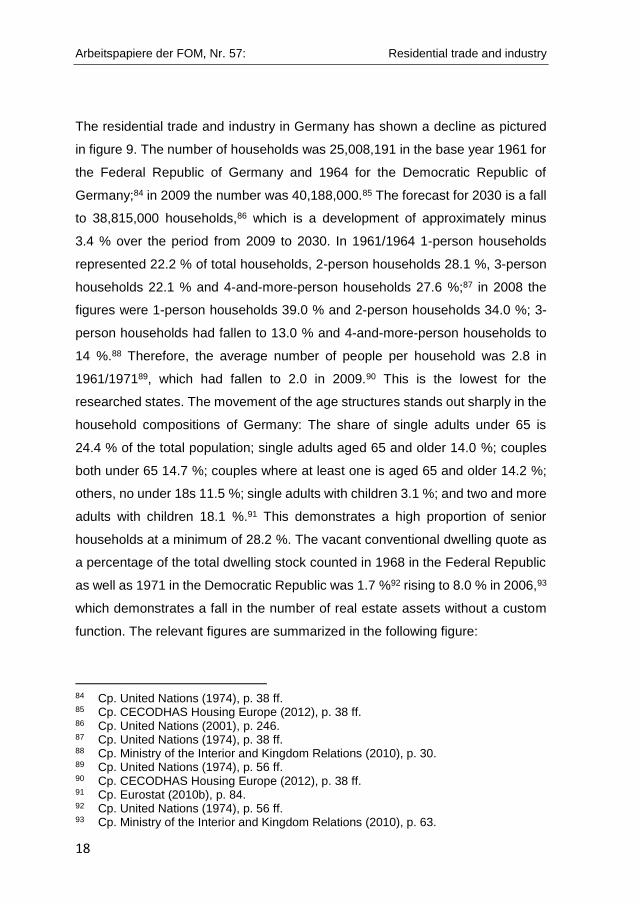
The residential trade and industry in Germany has shown a decline as pictured
in figure 9. The number of households was 25,008,191 in the base year 1961 for
the Federal Republic of Germany and 1964 for the Democratic Republic of
Germany;84 in 2009 the number was 40,188,000.85 The forecast for 2030 is a fall
to 38,815,000 households,86 which is a development of approximately minus
3.4 % over the period from 2009 to 2030. In 1961/1964 1-person households
represented 22.2 % of total households, 2-person households 28.1 %, 3-person
households 22.1 % and 4-and-more-person households 27.6 %;87 in 2008 the
figures were 1-person households 39.0 % and 2-person households 34.0 %; 3-
person households had fallen to 13.0 % and 4-and-more-person households to
14 %.88 Therefore, the average number of people per household was 2.8 in
1961/197189, which had fallen to 2.0 in 2009.90 This is the lowest for the
researched states. The movement of the age structures stands out sharply in the
household compositions of Germany: The share of single adults under 65 is
24.4 % of the total population; single adults aged 65 and older 14.0 %; couples
both under 65 14.7 %; couples where at least one is aged 65 and older 14.2 %;
others, no under 18s 11.5 %; single adults with children 3.1 %; and two and more
adults with children 18.1 %.91 This demonstrates a high proportion of senior
households at a minimum of 28.2 %. The vacant conventional dwelling quote as
a percentage of the total dwelling stock counted in 1968 in the Federal Republic
as well as 1971 in the Democratic Republic was 1.7 %92 rising to 8.0 % in 2006,93
which demonstrates a fall in the number of real estate assets without a custom
function. The relevant figures are summarized in the following figure:
84 Cp. United Nations (1974), p. 38 ff. 85 Cp. CECODHAS Housing Europe (2012), p. 38 ff. 86 Cp. United Nations (2001), p. 246. 87 Cp. United Nations (1974), p. 38 ff. 88 Cp. Ministry of the Interior and Kingdom Relations (2010), p. 30. 89 Cp. United Nations (1974), p. 56 ff. 90 Cp. CECODHAS Housing Europe (2012), p. 38 ff. 91 Cp. Eurostat (2010b), p. 84. 92 Cp. United Nations (1974), p. 56 ff. 93 Cp. Ministry of the Interior and Kingdom Relations (2010), p. 63.
Arbeitspapiere der FOM, Nr. 57: Residential trade and industry
19
Figure 9: Trend of the number of households in Germany
Source: based on CECODHAS Housing Europe (2012), p. 38 ff., United Nations (1974), p. 38 ff. as well as United Nations (2001), p. 246.
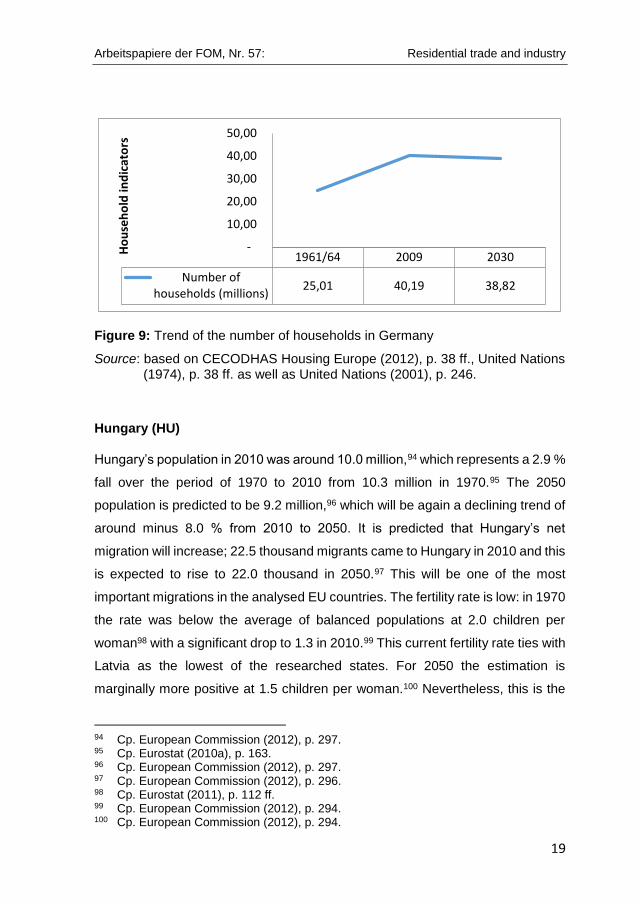
Hungary (HU)
Hungary’s population in 2010 was around 10.0 million,94 which represents a 2.9 %
fall over the period of 1970 to 2010 from 10.3 million in 1970.95 The 2050
population is predicted to be 9.2 million,96 which will be again a declining trend of
around minus 8.0 % from 2010 to 2050. It is predicted that Hungary’s net
migration will increase; 22.5 thousand migrants came to Hungary in 2010 and this
is expected to rise to 22.0 thousand in 2050.97 This will be one of the most
important migrations in the analysed EU countries. The fertility rate is low: in 1970
the rate was below the average of balanced populations at 2.0 children per
woman98 with a significant drop to 1.3 in 2010.99 This current fertility rate ties with
Latvia as the lowest of the researched states. For 2050 the estimation is
marginally more positive at 1.5 children per woman.100 Nevertheless, this is the
94 Cp. European Commission (2012), p. 297. 95 Cp. Eurostat (2010a), p. 163. 96 Cp. European Commission (2012), p. 297. 97 Cp. European Commission (2012), p. 296. 98 Cp. Eurostat (2011), p. 112 ff. 99 Cp. European Commission (2012), p. 294. 100 Cp. European Commission (2012), p. 294.
1961/64 2009 2030
Number ofhouseholds (millions)
25,01 40,19 38,82
-
10,00
20,00
30,00
40,00
50,00H
ou
seh
old
ind
icat
ors
Arbeitspapiere der FOM, Nr. 57: Residential trade and industry
20
lowest rate across the decreasing populations of the EU 27. The relevant figures
are summarized in the following figure:
Figure 10: Development of the population in Hungary
Source: based on European Commission (2012), p. 297, Eurostat (2010a), p. 163.
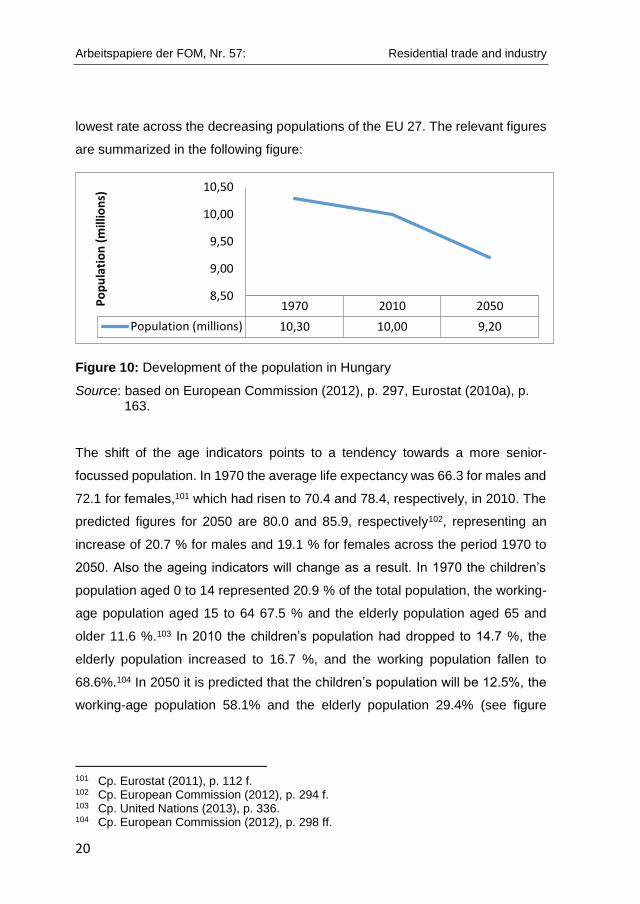
The shift of the age indicators points to a tendency towards a more senior-
focussed population. In 1970 the average life expectancy was 66.3 for males and
72.1 for females,101 which had risen to 70.4 and 78.4, respectively, in 2010. The
predicted figures for 2050 are 80.0 and 85.9, respectively102, representing an
increase of 20.7 % for males and 19.1 % for females across the period 1970 to
2050. Also the ageing indicators will change as a result. In 1970 the children’s
population aged 0 to 14 represented 20.9 % of the total population, the working-
age population aged 15 to 64 67.5 % and the elderly population aged 65 and
older 11.6 %.103 In 2010 the children’s population had dropped to 14.7 %, the
elderly population increased to 16.7 %, and the working population fallen to
68.6%.104 In 2050 it is predicted that the children’s population will be 12.5%, the
working-age population 58.1% and the elderly population 29.4% (see figure
101 Cp. Eurostat (2011), p. 112 f. 102 Cp. European Commission (2012), p. 294 f. 103 Cp. United Nations (2013), p. 336. 104 Cp. European Commission (2012), p. 298 ff.
1970 2010 2050
Population (millions) 10,30 10,00 9,20
8,50
9,00
9,50
10,00
10,50
Po
pu
lati
on
(m
illio
ns)
Arbeitspapiere der FOM, Nr. 57: Residential trade and industry
21
11).105 This is a deviance of minus 40.5% in the children’s population and plus
145.0 % in the elderly population from 1970 to 2050. The median age in years
will change from the current 40.6 to 46.1 in 2050.106 These ages fall in the mid
range of the analysed countries.
Figure 11: Formation of the ageing indicators in Hungary
Source: based on European Commission (2012), p. 298, cp. United Nations (2013), p. 336.
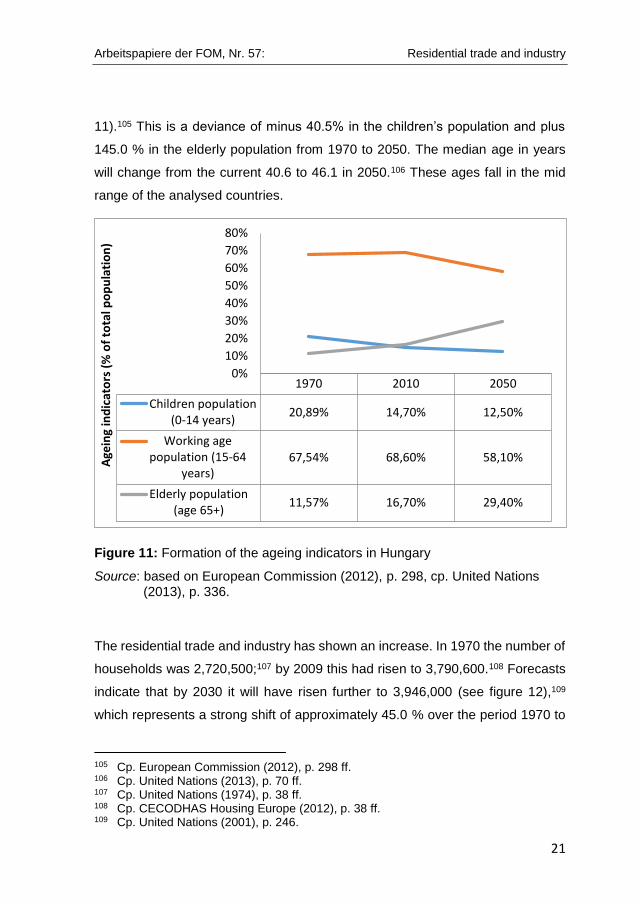
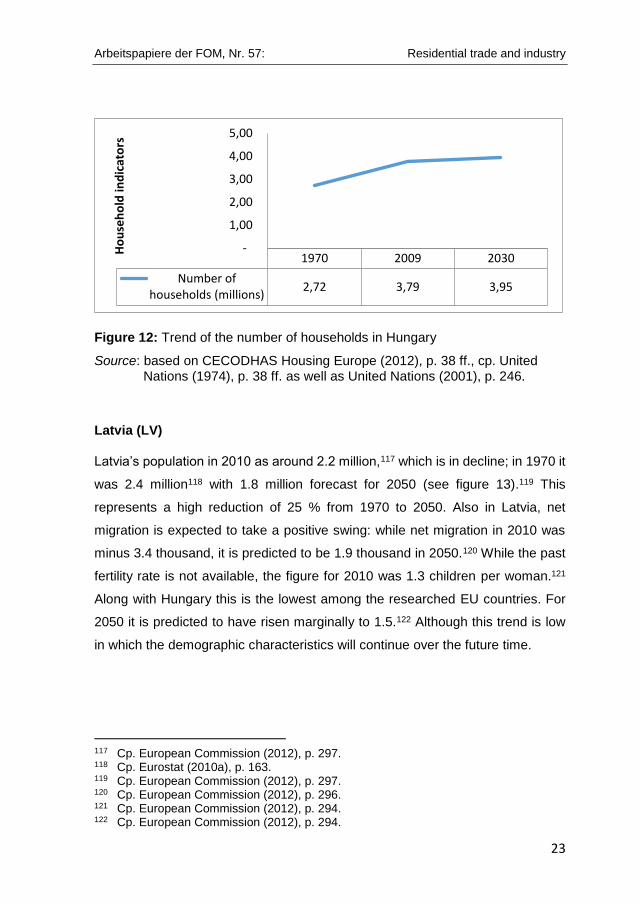
The residential trade and industry has shown an increase. In 1970 the number of
households was 2,720,500;107 by 2009 this had risen to 3,790,600.108 Forecasts
indicate that by 2030 it will have risen further to 3,946,000 (see figure 12),109
which represents a strong shift of approximately 45.0 % over the period 1970 to
105 Cp. European Commission (2012), p. 298 ff. 106 Cp. United Nations (2013), p. 70 ff. 107 Cp. United Nations (1974), p. 38 ff. 108 Cp. CECODHAS Housing Europe (2012), p. 38 ff. 109 Cp. United Nations (2001), p. 246.
1970 2010 2050
Children population(0-14 years)
20,89% 14,70% 12,50%
Working agepopulation (15-64
years)67,54% 68,60% 58,10%
Elderly population(age 65+)
11,57% 16,70% 29,40%
0%
10%
20%
30%
40%
50%
60%
70%
80%
Age
ing
ind
icat
ors
(%
of
tota
l po
pu
lati
on
)

Arbeitspapiere der FOM, Nr. 57: Residential trade and industry
22
2030. The household clusters have shifted accordingly. In 1970 1-person
households represented 0.0 % of the total, 2-person households 29.6 %, 3-
person households 29.3 % and 4-and-more-person households 41.2 %.110 2004
saw a tendency towards smaller households: 1-person households 29.0 %, 2-
person households 30.0 %, 3-person households 19.0 % and 4-and-more-person
households 23.0 %.111 The average number of people per household of 3.0 in
1970112 had fallen to 2.6 by 2009.113 The movement of the age structures is
apparent from Hungary’s household compositions: In 2007 single adults under
65 represented 11.5 % of the total population; single adults aged 65 and older
12.8 %; couples both under 65 12.8 %; couples where at least one is aged 65
and older 8.6 %; others, no under 18s 22.6 %; single adults with children 3.2 %;
and two and more adults with children 28.6.114 This means senior households
represent a minimum of 21.4 % of the total; nevertheless, this is relatively low in
comparison to the other countries. In 1970 3.4 % of dwellings were vacant,115
which had risen to 5.6 % by 2005.116 This is more balanced and lower than for
the other analysed countries.
110 Cp. United Nations (1974), p. 38 ff. 111 Cp. Ministry of the Interior and Kingdom Relations (2010), p. 30. 112 Cp. United Nations (1974), p. 56 ff. 113 Cp. CECODHAS Housing Europe (2012), p. 38 ff. 114 Cp. Eurostat (2010), p. 84. 115 Cp. United Nations (1974), p. 56 ff. 116 Cp. Ministry of the Interior and Kingdom Relations (2010), p. 63.
Arbeitspapiere der FOM, Nr. 57: Residential trade and industry
23
Figure 12: Trend of the number of households in Hungary
Source: based on CECODHAS Housing Europe (2012), p. 38 ff., cp. United Nations (1974), p. 38 ff. as well as United Nations (2001), p. 246.
Latvia (LV)
Latvia’s population in 2010 as around 2.2 million,117 which is in decline; in 1970 it
was 2.4 million118 with 1.8 million forecast for 2050 (see figure 13).119 This
represents a high reduction of 25 % from 1970 to 2050. Also in Latvia, net
migration is expected to take a positive swing: while net migration in 2010 was
minus 3.4 thousand, it is predicted to be 1.9 thousand in 2050.120 While the past
fertility rate is not available, the figure for 2010 was 1.3 children per woman.121
Along with Hungary this is the lowest among the researched EU countries. For
2050 it is predicted to have risen marginally to 1.5.122 Although this trend is low
in which the demographic characteristics will continue over the future time.
117 Cp. European Commission (2012), p. 297. 118 Cp. Eurostat (2010a), p. 163. 119 Cp. European Commission (2012), p. 297. 120 Cp. European Commission (2012), p. 296. 121 Cp. European Commission (2012), p. 294. 122 Cp. European Commission (2012), p. 294.
1970 2009 2030
Number ofhouseholds (millions)
2,72 3,79 3,95
-
1,00
2,00
3,00
4,00
5,00H
ou
seh
old
ind
icat
ors

Arbeitspapiere der FOM, Nr. 57: Residential trade and industry
24
Figure 13: Development of the population in Latvia
Source: based on European Commission (2012), p. 297 and Eurostat (2010a), p. 163.
The life expectancies are developing in a mostly analogical manner compared to
the afore-mentioned countries: While the figures for 1970 are not available, in
2010 they were 68.3 for males and 78.0 for females.123 In 2050 they are predicted
to have risen to 78.9 and 85.6, respectively124, representing a significant increase
of 15.5 % for males and 9.7 % for females from the base year 1970 to 2050. In
1970 the children’s population aged 0 to 14 represented 21.6 % of the total
population, the working-age population aged 15 to 64 66.4 % and the elderly
population aged 65 and older 12.0 %.125
Today with an actual base year of 2010 the children’s population has a negative
development with a quotation of 13.8 %, the elderly population increases to a
share of 17.3 %; the working population will marginally increase to 68.9 %.126 In
2050 it is estimated that the children’s population be 12.3 % in total, the working-
age population will be 56.6 % and the elderly 31.2 % (summarized in the following
figure). The figure for the very elderly generation aged a minimum of 80 years will
123 Cp. European Commission (2012), p. 294 f. 124 Cp. European Commission (2012), p. 294 f. 125 Cp. United Nations (2013), p. 336. 126 Cp. European Commission (2012), p. 298 ff.
1970 2010 2050
Population (millions) 2,40 2,20 1,80
0,00
0,50
1,00
1,50
2,00
2,50
3,00
Po
pu
lati
on
(m
illio
ns)

Arbeitspapiere der FOM, Nr. 57: Residential trade and industry
25
be 10.7 %,127 which is the 3rd highest of the population. This is a crucial difference
of minus 43.1 % in the children’s population and plus 160.0 % in the elderly
population between 1970 and 2050. The median age in years will also increase
from 41.5 per person to 42.7 in 2050.128
Figure 14: Formation of the ageing indicators in Latvia
Source: based on European Commission (2012), p. 298 ff. and United Nations (2013), p. 336.
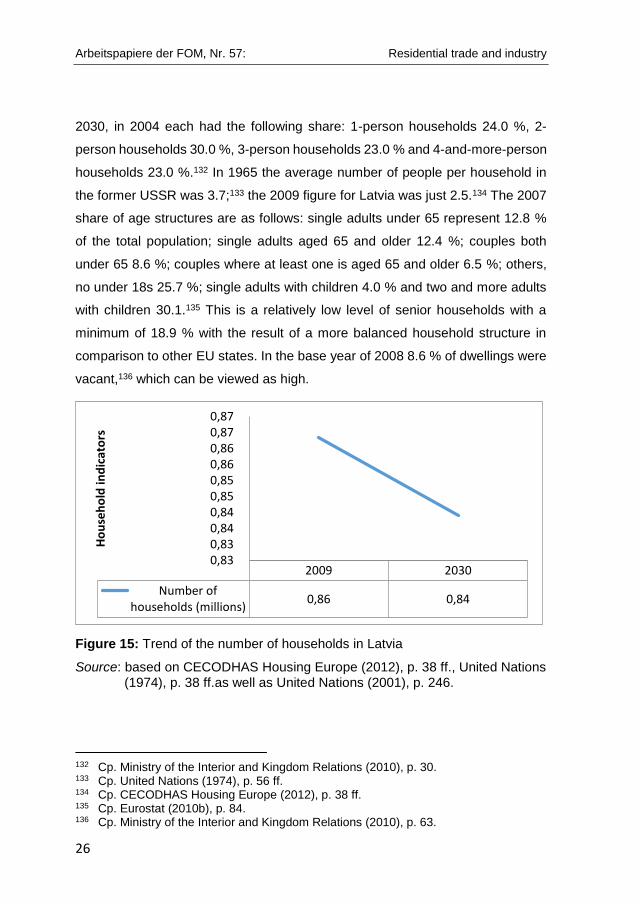
The residential trade and industry of Latvia is on a downward trend in contrast to
most of the afore-mentioned countries (see figure 15). In 1970 the total number
of households was only analysed for the whole of the USSR.129 Nevertheless, in
2009 the figure was 863,400.130 In 2030 it is forecast to have fallen to 839,000,131
which demonstrates a negative trend of minus 2.8 % over the period 2009 to
2030. While the data for clusters of households are not available for 1970 and
127 Cp. European Commission (2012), p. 298 ff. 128 Cp. United Nations (2013), p. 70 ff. 129 Cp. United Nations (1974), p. 38 ff. 130 Cp. CECODHAS Housing Europe (2012), p. 38 ff. 131 Cp. United Nations (2001), 246.
1970 2010 2050
Children population (0-14 years)
21,61% 13,80% 12,30%
Working agepopulation (15-64
years)66,38% 68,90% 56,60%
Elderly population (age65+)
12,01% 17,30% 31,20%
0,00%10,00%20,00%30,00%40,00%50,00%60,00%70,00%80,00%
Age
ing
ind
icat
ors
(%
of
tota
l p
op
ula
tio
n)
Arbeitspapiere der FOM, Nr. 57: Residential trade and industry
26
2030, in 2004 each had the following share: 1-person households 24.0 %, 2-
person households 30.0 %, 3-person households 23.0 % and 4-and-more-person
households 23.0 %.132 In 1965 the average number of people per household in
the former USSR was 3.7;133 the 2009 figure for Latvia was just 2.5.134 The 2007
share of age structures are as follows: single adults under 65 represent 12.8 %
of the total population; single adults aged 65 and older 12.4 %; couples both
under 65 8.6 %; couples where at least one is aged 65 and older 6.5 %; others,
no under 18s 25.7 %; single adults with children 4.0 % and two and more adults
with children 30.1.135 This is a relatively low level of senior households with a
minimum of 18.9 % with the result of a more balanced household structure in
comparison to other EU states. In the base year of 2008 8.6 % of dwellings were
vacant,136 which can be viewed as high.
Figure 15: Trend of the number of households in Latvia
Source: based on CECODHAS Housing Europe (2012), p. 38 ff., United Nations (1974), p. 38 ff.as well as United Nations (2001), p. 246.
132 Cp. Ministry of the Interior and Kingdom Relations (2010), p. 30. 133 Cp. United Nations (1974), p. 56 ff. 134 Cp. CECODHAS Housing Europe (2012), p. 38 ff. 135 Cp. Eurostat (2010b), p. 84. 136 Cp. Ministry of the Interior and Kingdom Relations (2010), p. 63.
2009 2030
Number ofhouseholds (millions)
0,86 0,84
0,83 0,83 0,84 0,84 0,85 0,85 0,86 0,86 0,87 0,87
Ho
use
ho
ld in
dic
ato
rs

Arbeitspapiere der FOM, Nr. 57: Residential trade and industry
27
Lithuania (LT)
Lithuania’s population in the base year 1970 was 3.1 million,137 and had grown to
around 3.3 million by 2010.138 Nevertheless, in 2050 the population is predicted
to have fallen to 2.8 million139 (see figure 16), which represents a shift of minus
9.7% across this whole timeframe from 1970 to 2050. The high net migration in
2010 caused a negative change of minus 13.0 thousand people, but it is predicted
to have risen to plus 2.2 thousand by 2050.140 This positive trend will prevent
greater population shrinkage. Lithuania had a positive fertility rate in 1970 of 2.4
children per woman,141 but this had fallen to a low of 1.5 in 2010.142
Forecasts indicate that it will remain more or less stable until 2050 when it will be
1.6 children, which is also low.143
Figure 16: Development of the population in Lithuania
Source: based on European Commission (2012), p. 297 and Eurostat (2010a), p. 163.
137 Cp. Eurostat (2010a), p. 163. 138 Cp. European Commission (2012), p. 297. 139 Cp. European Commission (2012), p. 297. 140 Cp. European Commission (2012), p. 296. 141 Cp. Eurostat (2011), p. 112 ff. 142 Cp. European Commission (2012), p. 294. 143 Cp. European Commission (2012), p. 294.
1970 2010 2050
Population (millions) 3,10 3,30 2,80
2,40
2,60
2,80
3,00
3,20
3,40
Po
pu
lati
on
(m
illio
ns)

Arbeitspapiere der FOM, Nr. 57: Residential trade and industry
28
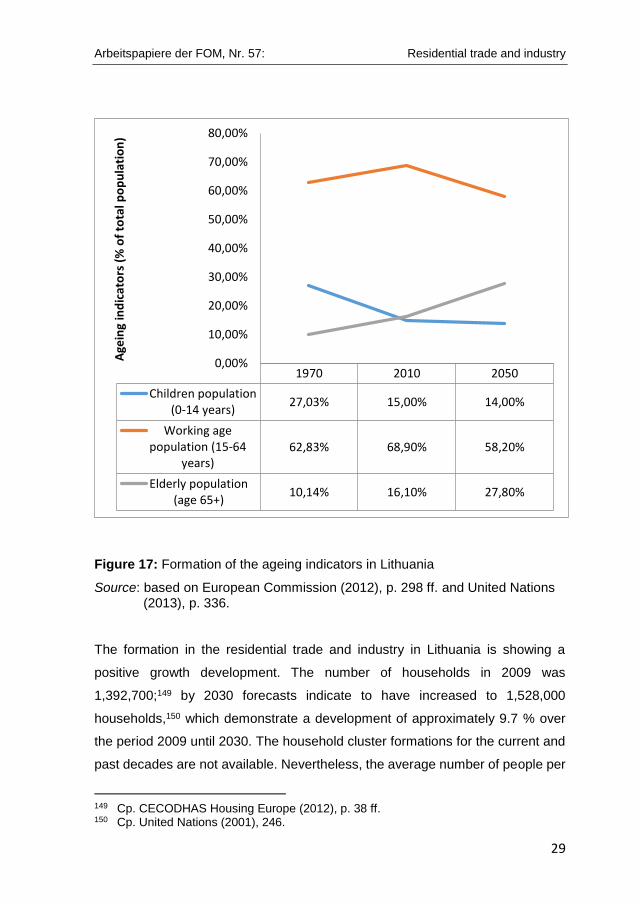
In Lithuania the age indicators demonstrate a demographic shift. While in 2010
the average life expectancy was 67.7 years for males and 78.7 for females, it is
expected to have risen by 2050 to 78.5 and 85.6, respectively.144 This
demonstrates an increase of 10.8 years for males and 6.9 years for females from
2010 to 2050. As a consequence the ageing indicators will rapidly change. In
1970 the cluster of the children’s population aged 0 to 14 represented 27.0 % of
the total population, the working-age population aged 15 to 64 had a percentage
of 62.8 % and the elderly population aged 65 and older had a share of nearly
10.1 %.145 Today the children’s population has shown a negative shift to a
quotation of 15.0 %, the elderly population has risen to a share of 16.1%; and the
working population increased to 68.9 %.146 In the forecast year 2050 it is
estimated that the children’s population will represent 14.0% of the total, the
working-age population 58.2 % and the elderly population 27.8 %, which includes
a cluster of a very elderly population aged 80 years and older of 10.2 % (see
figure 17).147 This is a significant deviance of minus 48.1% in the children’s
population and plus 175.2 % of the elderly population between 1970 and 2050.
Therefore, the median age in years is estimated with a growing shift from an
average age of 39.3 per person in 2013 to a median age of 44.2 in 2050.148 This
medium age is one of the lowest ages in the analysed countries.
144 Cp. European Commission (2012), p. 294 f. 145 Cp. United Nations (2013), p. 336. 146 Cp. European Commission (2012), p. 298 ff. 147 Cp. European Commission (2012), p. 298 ff. 148 Cp. United Nations (2013), p. 70 ff.
Arbeitspapiere der FOM, Nr. 57: Residential trade and industry
29
Figure 17: Formation of the ageing indicators in Lithuania
Source: based on European Commission (2012), p. 298 ff. and United Nations (2013), p. 336.
The formation in the residential trade and industry in Lithuania is showing a
positive growth development. The number of households in 2009 was
1,392,700;149 by 2030 forecasts indicate to have increased to 1,528,000
households,150 which demonstrate a development of approximately 9.7 % over
the period 2009 until 2030. The household cluster formations for the current and
past decades are not available. Nevertheless, the average number of people per
149 Cp. CECODHAS Housing Europe (2012), p. 38 ff. 150 Cp. United Nations (2001), 246.
1970 2010 2050
Children population(0-14 years)
27,03% 15,00% 14,00%
Working agepopulation (15-64
years)62,83% 68,90% 58,20%
Elderly population(age 65+)
10,14% 16,10% 27,80%
0,00%
10,00%
20,00%
30,00%
40,00%
50,00%
60,00%
70,00%
80,00%A
gein
g in
dic
ato
rs (
% o
f to
tal p
op
ula
tio
n)

Arbeitspapiere der FOM, Nr. 57: Residential trade and industry
30
household of 3.7 in 1965151 and 2.4 in 2009152 demonstrates a trend towards
smaller households (see figure 18). In 2007 a shift in age structures is visible from
the household compositions in Lithuania: The share of the single adults under 65
number 12.1 % of the total population; single adults aged 65 and older 14.9 %;
couples both under 65 9.6 %, couples where at least one is aged 65 and older
7.9 %; others, no under 18s 21.9 %; single adults with children 3.8 % and two
and more adults with children 29.8 %.153 This demonstrates senior households
with a proportion of a minimum of 22.8 % in total, which is a relatively balanced
composition level. Total vacant dwelling stock amounted to 3.7 % in 2001,154
which is the lowest level of the analysed countries. Therefore, it is estimated that
there is a basic realisation of custom-made dwellings.
Figure 18: Average number of people per household in Lithuania
Source: based on CECODHAS Housing Europe (2012), p. 38 ff., United Nations (1974); p. 56 ff.
151 Cp. United Nations (1974), p. 56 ff. 152 Cp. CECODHAS Housing Europe (2012), p. 38 ff. 153 Cp. Eurostat (2010b), p. 84. 154 Cp. Ministry of the Interior and Kingdom Relations (2010), p. 63.
1965 2009
Average number ofpersons perhouseholds
3,70 2,40
- 0,50 1,00 1,50 2,00 2,50 3,00 3,50 4,00
Ho
use
ho
ld in
dic
ato
rs
Arbeitspapiere der FOM, Nr. 57: Residential trade and industry
31
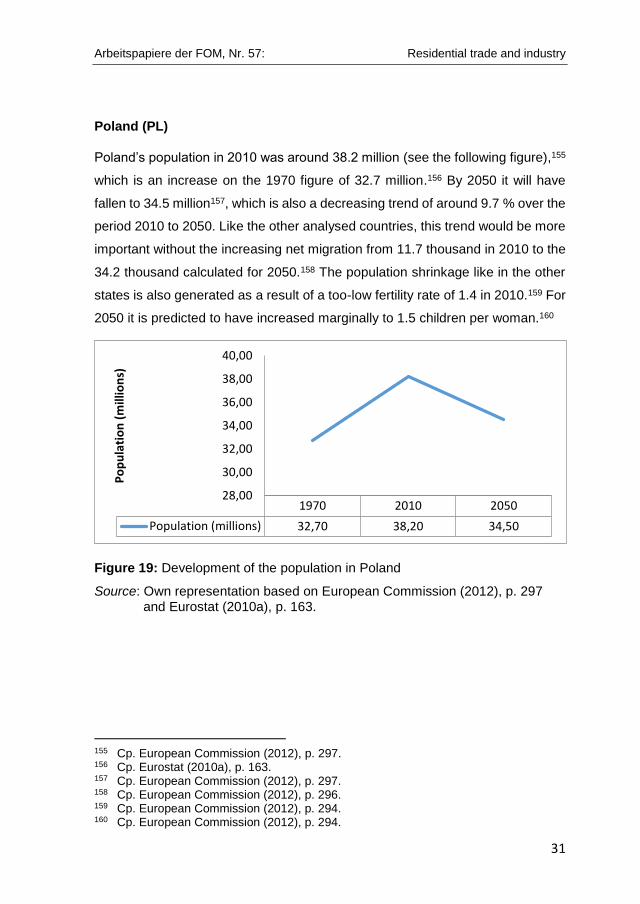
Poland (PL)
Poland’s population in 2010 was around 38.2 million (see the following figure),155
which is an increase on the 1970 figure of 32.7 million.156 By 2050 it will have
fallen to 34.5 million157, which is also a decreasing trend of around 9.7 % over the
period 2010 to 2050. Like the other analysed countries, this trend would be more
important without the increasing net migration from 11.7 thousand in 2010 to the
34.2 thousand calculated for 2050.158 The population shrinkage like in the other
states is also generated as a result of a too-low fertility rate of 1.4 in 2010.159 For
2050 it is predicted to have increased marginally to 1.5 children per woman.160
Figure 19: Development of the population in Poland
Source: Own representation based on European Commission (2012), p. 297 and Eurostat (2010a), p. 163.
155 Cp. European Commission (2012), p. 297. 156 Cp. Eurostat (2010a), p. 163. 157 Cp. European Commission (2012), p. 297. 158 Cp. European Commission (2012), p. 296. 159 Cp. European Commission (2012), p. 294. 160 Cp. European Commission (2012), p. 294.
1970 2010 2050
Population (millions) 32,70 38,20 34,50
28,00
30,00
32,00
34,00
36,00
38,00
40,00
Po
pu
lati
on
(m
illio
ns)
Arbeitspapiere der FOM, Nr. 57: Residential trade and industry
32
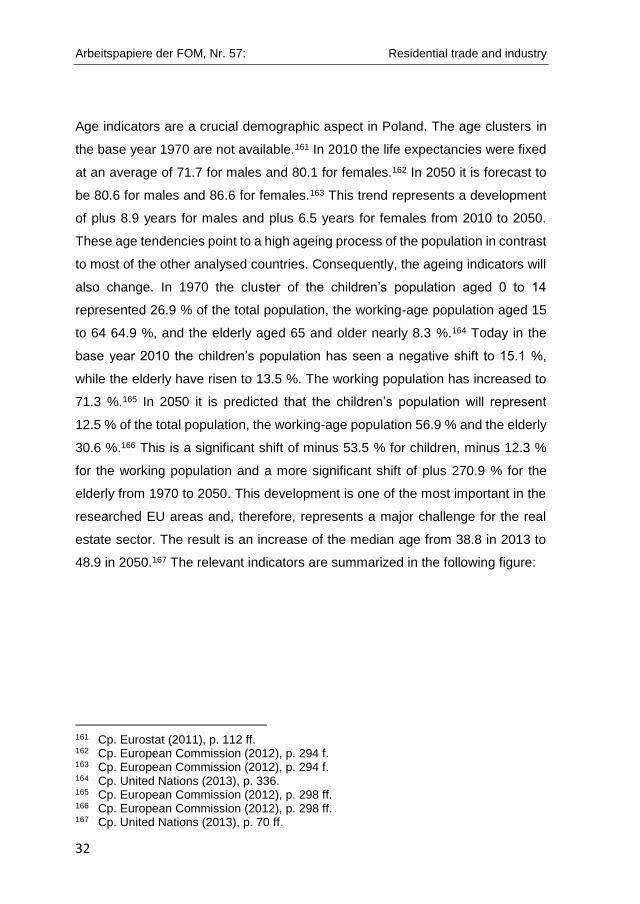
Age indicators are a crucial demographic aspect in Poland. The age clusters in
the base year 1970 are not available.161 In 2010 the life expectancies were fixed
at an average of 71.7 for males and 80.1 for females.162 In 2050 it is forecast to
be 80.6 for males and 86.6 for females.163 This trend represents a development
of plus 8.9 years for males and plus 6.5 years for females from 2010 to 2050.
These age tendencies point to a high ageing process of the population in contrast
to most of the other analysed countries. Consequently, the ageing indicators will
also change. In 1970 the cluster of the children’s population aged 0 to 14
represented 26.9 % of the total population, the working-age population aged 15
to 64 64.9 %, and the elderly aged 65 and older nearly 8.3 %.164 Today in the
base year 2010 the children’s population has seen a negative shift to 15.1 %,
while the elderly have risen to 13.5 %. The working population has increased to
71.3 %.165 In 2050 it is predicted that the children’s population will represent
12.5 % of the total population, the working-age population 56.9 % and the elderly
30.6 %.166 This is a significant shift of minus 53.5 % for children, minus 12.3 %
for the working population and a more significant shift of plus 270.9 % for the
elderly from 1970 to 2050. This development is one of the most important in the
researched EU areas and, therefore, represents a major challenge for the real
estate sector. The result is an increase of the median age from 38.8 in 2013 to
48.9 in 2050.167 The relevant indicators are summarized in the following figure:
161 Cp. Eurostat (2011), p. 112 ff. 162 Cp. European Commission (2012), p. 294 f. 163 Cp. European Commission (2012), p. 294 f. 164 Cp. United Nations (2013), p. 336. 165 Cp. European Commission (2012), p. 298 ff. 166 Cp. European Commission (2012), p. 298 ff. 167 Cp. United Nations (2013), p. 70 ff.
Arbeitspapiere der FOM, Nr. 57: Residential trade and industry
33
Figure 20: Formation of the ageing indicators in Poland
Source: based on European Commission (2012), p. 298 ff. and United Nations (2013), p. 336.
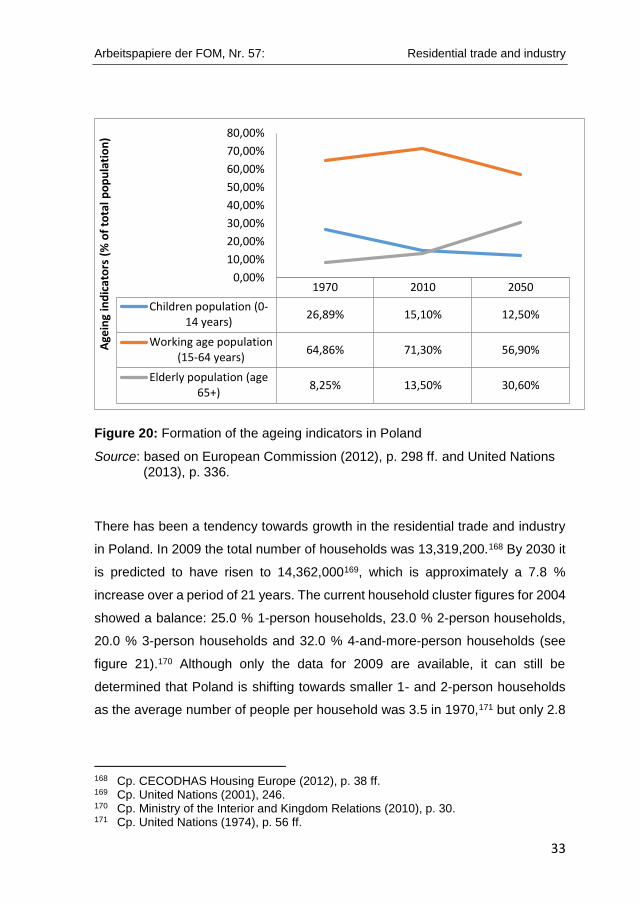
There has been a tendency towards growth in the residential trade and industry
in Poland. In 2009 the total number of households was 13,319,200.168 By 2030 it
is predicted to have risen to 14,362,000169, which is approximately a 7.8 %
increase over a period of 21 years. The current household cluster figures for 2004
showed a balance: 25.0 % 1-person households, 23.0 % 2-person households,
20.0 % 3-person households and 32.0 % 4-and-more-person households (see
figure 21).170 Although only the data for 2009 are available, it can still be
determined that Poland is shifting towards smaller 1- and 2-person households
as the average number of people per household was 3.5 in 1970,171 but only 2.8
168 Cp. CECODHAS Housing Europe (2012), p. 38 ff. 169 Cp. United Nations (2001), 246. 170 Cp. Ministry of the Interior and Kingdom Relations (2010), p. 30. 171 Cp. United Nations (1974), p. 56 ff.
1970 2010 2050
Children population (0-14 years)
26,89% 15,10% 12,50%
Working age population(15-64 years)
64,86% 71,30% 56,90%
Elderly population (age65+)
8,25% 13,50% 30,60%
0,00%
10,00%
20,00%
30,00%
40,00%
50,00%
60,00%
70,00%
80,00%
Age
ing
ind
icat
ors
(%
of
tota
l po
pu
lati
on
)

Arbeitspapiere der FOM, Nr. 57: Residential trade and industry
34
in 2009.172 The movement of the age structures is apparent from the household
compositions: In 2007 the share of single adults under 65 amounted to 11.3 % of
the total population; single adults aged 65 and older 13.4 %; couples both under
65 10.0 %; couples with at least one partner aged 65 and older 6.6 %; others, no
under 18s 24.6 %; single adults with children 1.8 %; and two and more adults
with children 32.4 %.173 This demonstrates that senior households represent a
minimum of 20.0% of the total, which today points strongly to a balanced age
structure. The amount of vacant conventional dwellings has changed over the
years: in 1970 the figure was 2.6 %174 and in 2002 5.3 %.175 Nevertheless, this
represents the 2nd smallest growth after Lithuania among the countries analysed,
and it can be concluded that the country consists mainly of stable residential trade
and industry portfolio assets because most are in use by the population.
Figure 21: Clusters of households in Poland
Source: based on Ministry of the Interior and Kingdom Relations (2010), p. 30.
172 Cp. CECODHAS Housing Europe (2012), p. 38 ff. 173 Cp. Eurostat (2010b), p. 84. 174 Cp. United Nations (1974), p. 56 ff. 175 Cp. Ministry of the Interior and Kingdom Relations (2010), p. 63.
25%
23%20%
32%
Clusters of households 2004
1-person-households in %
2-person-households in %
3-person-households in %
4-person-households in %and more

Arbeitspapiere der FOM, Nr. 57: Residential trade and industry
35
Romania (RO)
Romania’s population in 2010 was around 21.4 million176, which represents a
decline; in 1970 it was 20.1 million177 with 18.4 million forecast for 2050 (see
figure 22).178 This points to an 8.5 % drop between 1970 and 2050. Also in
Romania the net migration has shown a positive development: while the current
net migration figures for 2010 showed a negative trend of about minus 0.2
thousand, migration for 2050 is predicted to be plus 16.8 thousand.179 While the
past fertility rate is not available, the 2010 figure of 1.4 children per woman in
2010 is one of the lowest among the analysed countries.180 For 2050 the forecast
is marginally more positive at 1.5,181 but remains low.
Figure 22: Development of the population in Romania
Source: European Commission (2012), p. 297, Eurostat (2010a), p. 163.
176 Cp. European Commission (2012), p. 297. 177 Cp. Eurostat (2010a), p. 163. 178 Cp. European Commission (2012), p. 297. 179 Cp. European Commission (2012), p. 296. 180 Cp. European Commission (2012), p. 294. 181 Cp. European Commission (2012), p. 294.
1970 2010 2050
Population (millions) 20,10 21,40 18,40
16,00
17,00
18,00
19,00
20,00
21,00
22,00
Po
pu
lati
on
(m
illio
ns)

Arbeitspapiere der FOM, Nr. 57: Residential trade and industry
36
Life expectancy develops in an analogical way to the afore-mentioned
demographic characteristics of the country.182 While in 1970 the average life
expectancy was 65.8 for males and 70.4 for females,183 in 2010 the figures had
risen to 70.0 and 77.5, respectively.184 By 2050 they are expected to have risen
further to 79.8 and 85.1, respectively.185 This demonstrates the significant
increase of 21.3 % for males and 20.9 % for females from the base year 1970 to
2050. In 1970 the children’s population aged 0 to 14 represented 25.9 % of the
total population, the working-age population aged 15 to 64 66.6 % and the elderly
aged 65 and older nearly 8.4 %.186 Today with the current base year of 2010 the
children’s population has fallen to 15.2 %, the elderly population increased to 14.9
% and the working population increased to 69.9 %.187 In 2050 it is estimated that
the children’s population will have fallen further to 11.9 %, the working-age
population to 57.0 % and the elderly population increased to 31.1 %. The very
elderly aged at least 80 years will represent 9.6 %,188 which is high for this
population (see figure 23). This is a crucial difference of minus 54.1 % in the
children’s population and plus 267.6 % of the elderly population from 1970 to
2050, which is one of the most crucial shifts in the EU with shrinking populations.
The median age in years will also increase from 39.4 in 2013 to a much higher
48.8 in 2050.189
182 No additional data available. 183 Cp. Eurostat (2011), p. 112 ff. 184 Cp. European Commission (2012), p. 294 f. 185 Cp. European Commission (2012), p. 294 f. 186 Cp. United Nations (2013), p. 336. 187 Cp. European Commission (2012), p. 298 ff. 188 Cp. European Commission (2012), p. 298 ff. 189 Cp. United Nations (2013), p. 70 ff.

Arbeitspapiere der FOM, Nr. 57: Residential trade and industry
37
Figure 23: Formation of the ageing indicators in Romania
Source: based on European Commission (2012), p. 298 ff., United Nations (2013), p. 336.
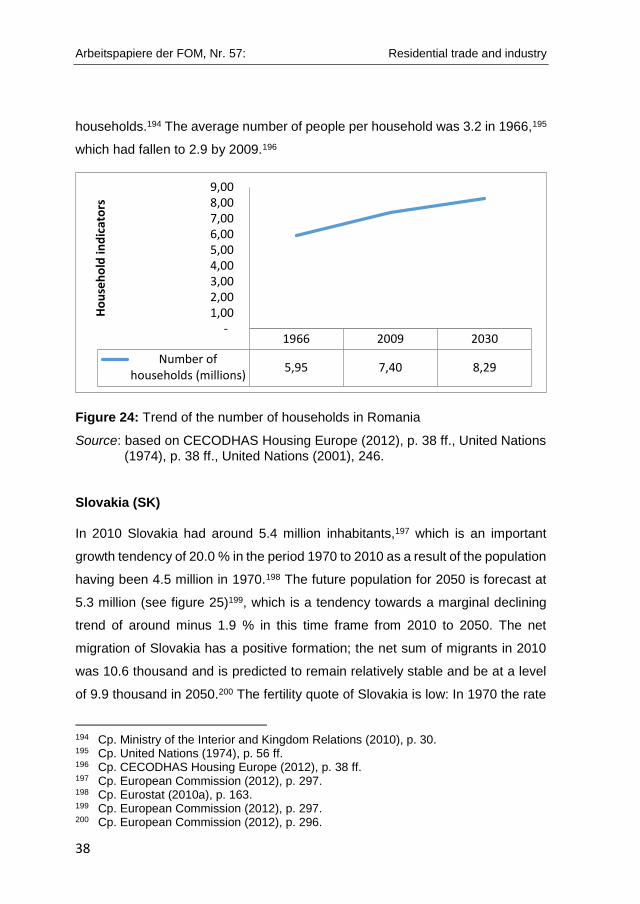
The residential trade and industry of Romania has growing structures (see figure
24). In 1966 the sum of households was analysed with 5,954,555.190 In 2009 the
number was 7,395,700.191 In 2030 the formation will increase with a total number
of 8,288,000 households,192 which demonstrates a significant growth trend of
about 39.2 % over the period 1966 to 2030. In 1966, 1-person households
represented 14.2 % of the household share, for 2-person households 23.4 %, 3-
person households 23.4 % and 4-and-more-person households 39.1 %;193 in
2008 the figures were 18.0 % for 1-person households, 27.0 % 2-person
households, 23.0 % 3-person households and 33.0 % 4-and-more-person
190 Cp. United Nations (1974), p. 38 ff. 191 Cp. CECODHAS Housing Europe (2012), p. 38 ff. 192 Cp. United Nations (2001), 246. 193 Cp. United Nations (1974), p. 38 ff.
1970 2010 2050
Children population (0-14 years)
25,91% 15,20% 11,90%
Working age population(15-64 years)
65,62% 69,90% 57,00%
Elderly population (age65+)
8,46% 14,90% 31,10%
Very elderly population(age 80+)
- 3,20% 9,60%
0%10%20%30%40%50%60%70%80%
Age
ing
ind
icat
ors
(%
of
tota
l po
pu
lati
on
)
Arbeitspapiere der FOM, Nr. 57: Residential trade and industry
38
households.194 The average number of people per household was 3.2 in 1966,195
which had fallen to 2.9 by 2009.196
Figure 24: Trend of the number of households in Romania
Source: based on CECODHAS Housing Europe (2012), p. 38 ff., United Nations (1974), p. 38 ff., United Nations (2001), 246.
Slovakia (SK)
In 2010 Slovakia had around 5.4 million inhabitants,197 which is an important
growth tendency of 20.0 % in the period 1970 to 2010 as a result of the population
having been 4.5 million in 1970.198 The future population for 2050 is forecast at
5.3 million (see figure 25)199, which is a tendency towards a marginal declining
trend of around minus 1.9 % in this time frame from 2010 to 2050. The net
migration of Slovakia has a positive formation; the net sum of migrants in 2010
was 10.6 thousand and is predicted to remain relatively stable and be at a level
of 9.9 thousand in 2050.200 The fertility quote of Slovakia is low: In 1970 the rate
194 Cp. Ministry of the Interior and Kingdom Relations (2010), p. 30. 195 Cp. United Nations (1974), p. 56 ff. 196 Cp. CECODHAS Housing Europe (2012), p. 38 ff. 197 Cp. European Commission (2012), p. 297. 198 Cp. Eurostat (2010a), p. 163. 199 Cp. European Commission (2012), p. 297. 200 Cp. European Commission (2012), p. 296.
1966 2009 2030
Number ofhouseholds (millions)
5,95 7,40 8,29
- 1,00 2,00 3,00 4,00 5,00 6,00 7,00 8,00 9,00
Ho
use
ho
ld in
dic
ato
rs

Arbeitspapiere der FOM, Nr. 57: Residential trade and industry
39
was a balanced growth level with 2.4 children per woman201 with the result of an
increasing population structure. This fell sharply to 1.4 children per woman in
2010.202 For 2050 the estimated rate is marginally more positive at 1.5 children
per woman.203
Figure 25: Development of the population in Slovakia
Source: based on European Commission (2012), p. 297, Eurostat (2010a), p. 163.
The shift of the age indicators shows a strong demographic tendency (see the
following figure). In 1970 the average life expectancies were 66.8 for males and
73.0 for females,204 and in 2010 71.6 for males and 79.1 for females.205 This trend
is predicted to develop strongly until 2050 with a life expectancy of 80.3 for males
and 86.0 for females,206 representing an increase of about 20.2 % for males and
17.8 % for females in the period 1970 to 2050. Consequently the ageing
indicators will also change significantly. In 1970 the cluster of the children’s
population aged 0 to 14 represented 27.4 % of the total population, the working-
age population aged 15 to 64 63.5 %, and the elderly aged 65 and older nearly
201 Cp. Eurostat (2011), p. 112 ff. 202 Cp. European Commission (2012), p. 294. 203 Cp. European Commission (2012), p. 294. 204 Cp. Eurostat (2011), p. 112 ff. 205 Cp. European Commission (2012), p. 294 f. 206 Cp. European Commission (2012), p. 294 f.
1970 2010 2050
Population (millions) 4,50 5,40 5,30
0,00
1,00
2,00
3,00
4,00
5,00
6,00
Po
pu
lati
on
(m
illio
ns)

Arbeitspapiere der FOM, Nr. 57: Residential trade and industry
40
9.1 %.207 By 2010 the children’s population had shown a negative shift down to
15.3 %, the elderly population an increase to 12.3 % and the working population
a marginal decrease to 72.4 %.208 In 2050 forecasts indicate that the children’s
population will be 12.7 %, the working-age population 57.4 % and the elderly
29.9 %.209 This is a significant deviance of minus 53.6 % in the children’s
population and plus 232.2 % in the elderly population from 1970 to 2050, which
shows a strong shift mainly in the ageing indicators of the senior generation. The
median age in years will increase significantly from the current 38.2 to 48.2 in
2050,210 which is a significant increase of 10 years across this timeframe.
Figure 26: Formation of the ageing indicators in Slovakia
Source: based on European Commission (2012), p. 298 ff., United Nations (2013), p. 336.
207 Cp. United Nations (2013), p. 336. 208 Cp. European Commission (2012), p. 298 ff. 209 Cp. European Commission (2012), p. 298 ff. 210 Cp. United Nations (2013), p. 70 ff.
1970 2010 2050
Children population (0-14 years)
27,43% 15,30% 12,70%
Working age population(15-64 years)
63,50% 72,40% 57,40%
Elderly population (age65+)
9,07% 12,30% 29,90%
0,00%
10,00%
20,00%
30,00%
40,00%
50,00%
60,00%
70,00%
80,00%
Age
ing
ind
icat
ors
(%
of
tota
l po
pu
lati
on
)

Arbeitspapiere der FOM, Nr. 57: Residential trade and industry
41
Slovakia has positive residential trade and industry formations (see figure 27). In
2009 it had 1,756,500 households,211 which are predicted to have risen to
2,396,000 by 2030,212 which is an increase of approximately 36.4 % over the
period 2009 to 2030. The developments in regard to household clusters are
relevant here. In 1970 in Czechoslovakia 1-person households represented
14.2 % of the total, 2-person households 26.8 %, 3-person households 22.1 %
and 4-and-more-person households 36.9 %.213 By 2004 there had been a major
change in 1-person households rising to 26.0 %. 2-person households stagnated
at 22.0 %, 3-person households declined at 18.0 % and 4-and-more-person
households decreased at 35.0 %.214 The average number of people per
household in 1961 in Czechoslovakia was 3.1,215 which had fallen to 2.8 by
2009.216 The changes of the age structure are tied to the household compositions
in Slovakia: In 2007 single adults under 65 represented 11.4 % of the total
population; single adults aged 65 and older 13.1 %; couples with both partners
under 65 8.0 %; couples where at least one is aged 65 and older 7.9%; others,
no under 18s 30.1 %; single adults with children 1.3 %; and two and more adults
with children 28.2 %.217 This means that senior households represent a minimum
of 21.0 %. In 1961 0.2 % of dwellings were vacant218 compared to 11.1 % in
2008.219 This current vacancy level is the 2nd highest after Spain, which shows
the significantly high non-use of real estate assets in Slovakia.
211 Cp. CECODHAS Housing Europe (2012), p. 38 ff. 212 Cp. United Nations (2001), 246. 213 Cp. United Nations (1974), p. 38 ff. 214 Cp. Ministry of the Interior and Kingdom Relations (2010), p. 30. 215 Cp. United Nations (1974), p. 56 ff. 216 Cp. CECODHAS Housing Europe (2012), p. 38 ff. 217 Cp. Eurostat (2010b), p. 84. 218 Cp. United Nations (1974), p. 56 ff. 219 Cp. Ministry of the Interior and Kingdom Relations (2010), p. 63.
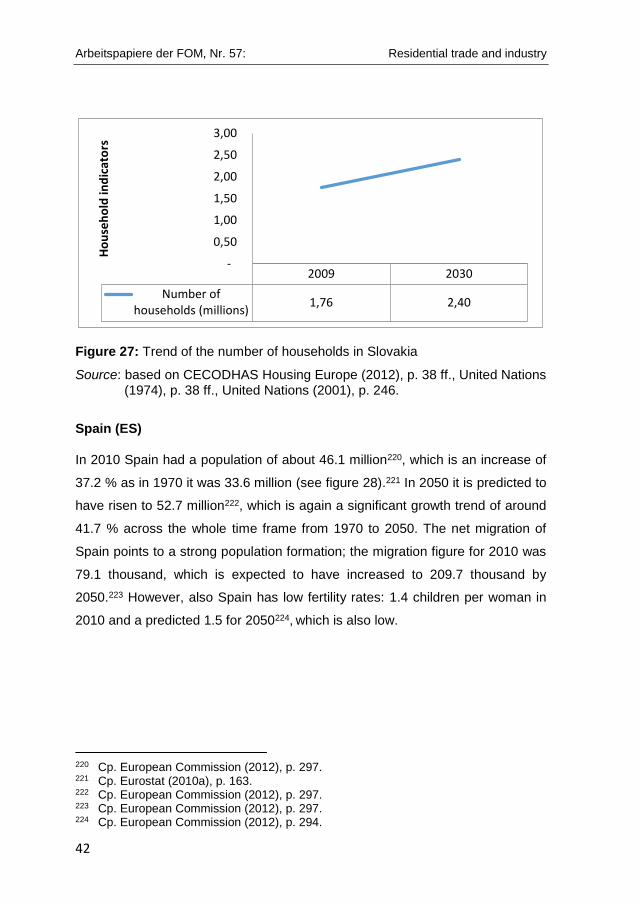
Arbeitspapiere der FOM, Nr. 57: Residential trade and industry
42
Figure 27: Trend of the number of households in Slovakia
Source: based on CECODHAS Housing Europe (2012), p. 38 ff., United Nations (1974), p. 38 ff., United Nations (2001), p. 246.
Spain (ES)
In 2010 Spain had a population of about 46.1 million220, which is an increase of
37.2 % as in 1970 it was 33.6 million (see figure 28).221 In 2050 it is predicted to
have risen to 52.7 million222, which is again a significant growth trend of around
41.7 % across the whole time frame from 1970 to 2050. The net migration of
Spain points to a strong population formation; the migration figure for 2010 was
79.1 thousand, which is expected to have increased to 209.7 thousand by
2050.223 However, also Spain has low fertility rates: 1.4 children per woman in
2010 and a predicted 1.5 for 2050224, which is also low.
220 Cp. European Commission (2012), p. 297. 221 Cp. Eurostat (2010a), p. 163. 222 Cp. European Commission (2012), p. 297. 223 Cp. European Commission (2012), p. 297. 224 Cp. European Commission (2012), p. 294.
2009 2030
Number ofhouseholds (millions)
1,76 2,40
-
0,50
1,00
1,50
2,00
2,50
3,00
Ho
use
ho
ld in
dic
ato
rs

Arbeitspapiere der FOM, Nr. 57: Residential trade and industry
43
Figure 28: Development of the population in Spain
Source: based on European Commission (2012), p. 297, Eurostat (2010a), p. 163.
In Spain the age indicators demonstrate a shift towards a more senior-focused
society (see figure 29). The average life expectancies in the base year 2010 were
78.6 for males and 84.7 for females.225 These are predicted to have risen to 84.2
and 89.0, respectively, by 2050.226 These are the highest for the analysed
countries in the EU, and represents a large increase plus 5.6 years for males and
plus 4.3 years for females from 2010 to 2050.
As a consequence the ageing indicators will change rapidly. In 1970 the cluster
of the children’s population aged 0 to 14 represented 27.9 % of the total
population, the working-age population aged 15 to 64 62.5 %, and the elderly
aged 65 and older nearly 9.7 %.227 Today the children’s population has seen a
negative shift to 15.0 %, the elderly population increase to 17.0 %, and the
working population grow to 68.0 %.228 In 2050 forecasts indicate that the
children’s population will be 13.1 %, the working-age population 55.3 % and the
225 Cp. European Commission (2012), p. 294 f. 226 Cp. European Commission (2012), p. 294 f. 227 Cp. United Nations (2013), p. 336. 228 Cp. European Commission (2012), p. 298 ff.
1970 2010 2050
Population (millions) 33,60 46,10 52,70
0,00
10,00
20,00
30,00
40,00
50,00
60,00P
op
ula
tio
n (
mill
ion
s)
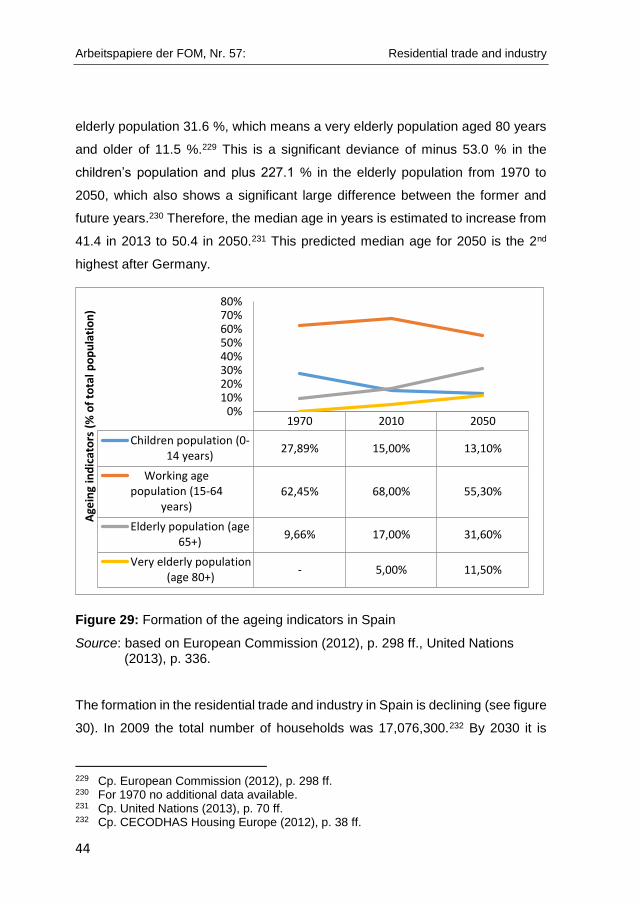
Arbeitspapiere der FOM, Nr. 57: Residential trade and industry
44
elderly population 31.6 %, which means a very elderly population aged 80 years
and older of 11.5 %.229 This is a significant deviance of minus 53.0 % in the
children’s population and plus 227.1 % in the elderly population from 1970 to
2050, which also shows a significant large difference between the former and
future years.230 Therefore, the median age in years is estimated to increase from
41.4 in 2013 to 50.4 in 2050.231 This predicted median age for 2050 is the 2nd
highest after Germany.
Figure 29: Formation of the ageing indicators in Spain
Source: based on European Commission (2012), p. 298 ff., United Nations (2013), p. 336.
The formation in the residential trade and industry in Spain is declining (see figure
30). In 2009 the total number of households was 17,076,300.232 By 2030 it is
229 Cp. European Commission (2012), p. 298 ff. 230 For 1970 no additional data available. 231 Cp. United Nations (2013), p. 70 ff. 232 Cp. CECODHAS Housing Europe (2012), p. 38 ff.
1970 2010 2050
Children population (0-14 years)
27,89% 15,00% 13,10%
Working agepopulation (15-64
years)62,45% 68,00% 55,30%
Elderly population (age65+)
9,66% 17,00% 31,60%
Very elderly population(age 80+)
- 5,00% 11,50%
0%10%20%30%40%50%60%70%80%
Age
ing
ind
icat
ors
(%
of
tota
l po
pu
lati
on
)
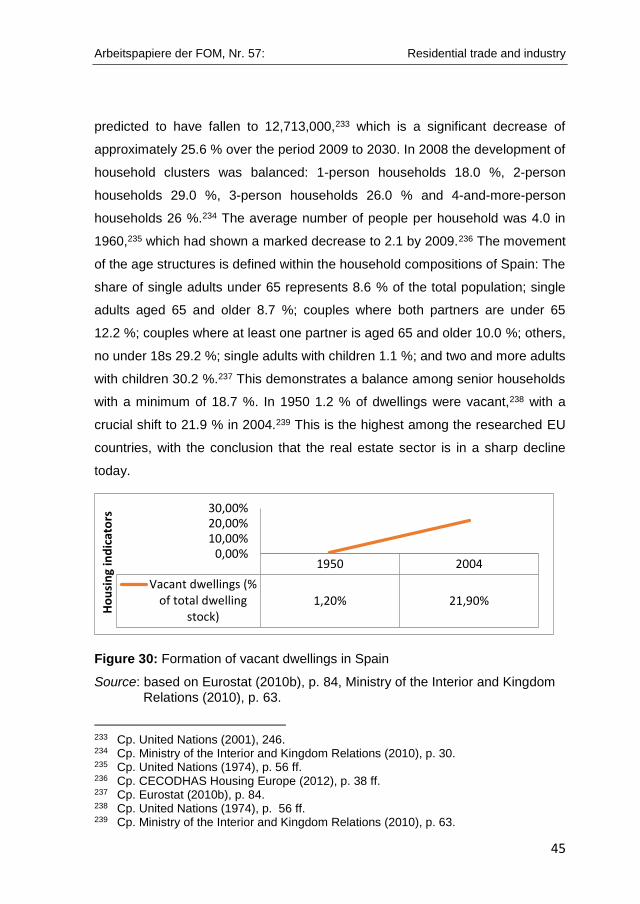
Arbeitspapiere der FOM, Nr. 57: Residential trade and industry
45
predicted to have fallen to 12,713,000,233 which is a significant decrease of
approximately 25.6 % over the period 2009 to 2030. In 2008 the development of
household clusters was balanced: 1-person households 18.0 %, 2-person
households 29.0 %, 3-person households 26.0 % and 4-and-more-person
households 26 %.234 The average number of people per household was 4.0 in
1960,235 which had shown a marked decrease to 2.1 by 2009.236 The movement
of the age structures is defined within the household compositions of Spain: The
share of single adults under 65 represents 8.6 % of the total population; single
adults aged 65 and older 8.7 %; couples where both partners are under 65
12.2 %; couples where at least one partner is aged 65 and older 10.0 %; others,
no under 18s 29.2 %; single adults with children 1.1 %; and two and more adults
with children 30.2 %.237 This demonstrates a balance among senior households
with a minimum of 18.7 %. In 1950 1.2 % of dwellings were vacant,238 with a
crucial shift to 21.9 % in 2004.239 This is the highest among the researched EU
countries, with the conclusion that the real estate sector is in a sharp decline
today.
Figure 30: Formation of vacant dwellings in Spain
Source: based on Eurostat (2010b), p. 84, Ministry of the Interior and Kingdom Relations (2010), p. 63.
233 Cp. United Nations (2001), 246. 234 Cp. Ministry of the Interior and Kingdom Relations (2010), p. 30. 235 Cp. United Nations (1974), p. 56 ff. 236 Cp. CECODHAS Housing Europe (2012), p. 38 ff. 237 Cp. Eurostat (2010b), p. 84. 238 Cp. United Nations (1974), p. 56 ff. 239 Cp. Ministry of the Interior and Kingdom Relations (2010), p. 63.
1950 2004
Vacant dwellings (%of total dwelling
stock)1,20% 21,90%
0,00%10,00%20,00%30,00%
Ho
usi
ng
ind
icat
ors

Arbeitspapiere der FOM, Nr. 57: Residential trade and industry
46
2.3 Space progress
Bulgaria (BG)
Because the age distribution of the housing stock for this country is not available,
an interpretation of the age distribution for the future is not possible. However,
the housing amenities were recorded from 1965 to 2001: Housing with flush
toilets increased from 11.8 %240 to 66.2 %241; residences with a fixed bath or
shower rose from 8.7 %242 to 77.9 %243 which demonstrates a significant
movement towards custom-fit real estate assets as shown in the following figure:
Figure 31: Build quality inside the housing in Bulgaria
Source: based on United Nations (1974), p. 182 ff., United Nations (2012), Table 6, p. 1 ff., United Nations (2012), Table 7, p. 1 ff.
240 Cp. United Nations (1974), p. 182 ff. 241 Cp. United Nations (2012), Table 6, p. 1 ff. 242 Cp. United Nations (1974), p. 182 ff. 243 Cp. United Nations (2012), Table 7, p. 1 ff.
1965 2001
Toilet flush 11,80% 66,20%
Fixed bath or shower 8,70% 77,90%
0,00%
10,00%
20,00%
30,00%
40,00%
50,00%
60,00%
70,00%
80,00%
90,00%
Bu
ild Q
ual
ity
( in
% in
dw
elli
ngs
)

Arbeitspapiere der FOM, Nr. 57: Residential trade and industry
47
Estonia (EE)
The age composition of housing stock of Estonia in 2009 is remarkable (see
figure 32): a relatively high share of 9.4 % of the housing stock had a construction
year older than 1919; 14.2 % were constructed between 1919 and 1945, 30.0 %
between 1946 and 1970, 21.5 % between 1971 and 1980, 19.6 % between 1981
and 1990, 2.0 % between 1990 and 2000 and 3.3 % have been relatively newly
built since 2000.244 The result is a housing stock, of which 53.6 % is older than
45 years with the earliest construction of at least 96 years. Consequently a need
will arise for refurbishments, new constructions and modernisations in the coming
years and decades. The average number of rooms per dwelling is 3.3,245 which
is in contrast to the demographic shift of the state.
Figure 32: Trend of the age distribution of housing stock in Estonia
Source: based on Ministry of the Interior and Kingdom Relations (2010).
244 Cp. Ministry of the Interior and Kingdom Relations (2010), p. 54. 245 Cp. Ministry of the Interior and Kingdom Relations (2010), p. 52.
9%
14%
30%22%
20%
2% 3%
Age distribution of housing stock 2009 in %
< 1919
1919-1945
1946-1970
1971-1980
1981-1990
1990-2000
> 2000
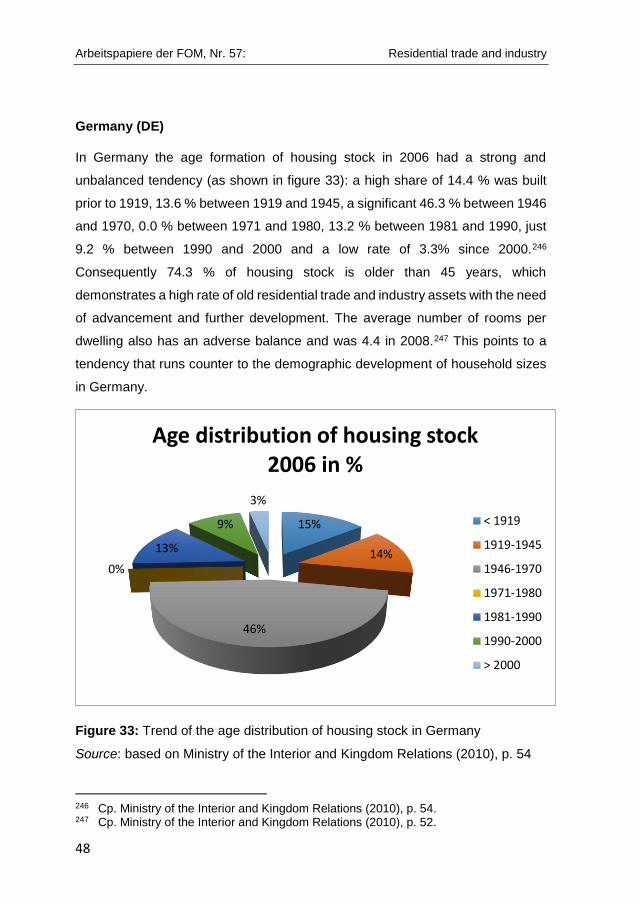
Arbeitspapiere der FOM, Nr. 57: Residential trade and industry
48
Germany (DE)
In Germany the age formation of housing stock in 2006 had a strong and
unbalanced tendency (as shown in figure 33): a high share of 14.4 % was built
prior to 1919, 13.6 % between 1919 and 1945, a significant 46.3 % between 1946
and 1970, 0.0 % between 1971 and 1980, 13.2 % between 1981 and 1990, just
9.2 % between 1990 and 2000 and a low rate of 3.3% since 2000.246
Consequently 74.3 % of housing stock is older than 45 years, which
demonstrates a high rate of old residential trade and industry assets with the need
of advancement and further development. The average number of rooms per
dwelling also has an adverse balance and was 4.4 in 2008.247 This points to a
tendency that runs counter to the demographic development of household sizes
in Germany.
Figure 33: Trend of the age distribution of housing stock in Germany
Source: based on Ministry of the Interior and Kingdom Relations (2010), p. 54
246 Cp. Ministry of the Interior and Kingdom Relations (2010), p. 54. 247 Cp. Ministry of the Interior and Kingdom Relations (2010), p. 52.
15%
14%
46%
0%
13%
9%
3%
Age distribution of housing stock 2006 in %
< 1919
1919-1945
1946-1970
1971-1980
1981-1990
1990-2000
> 2000
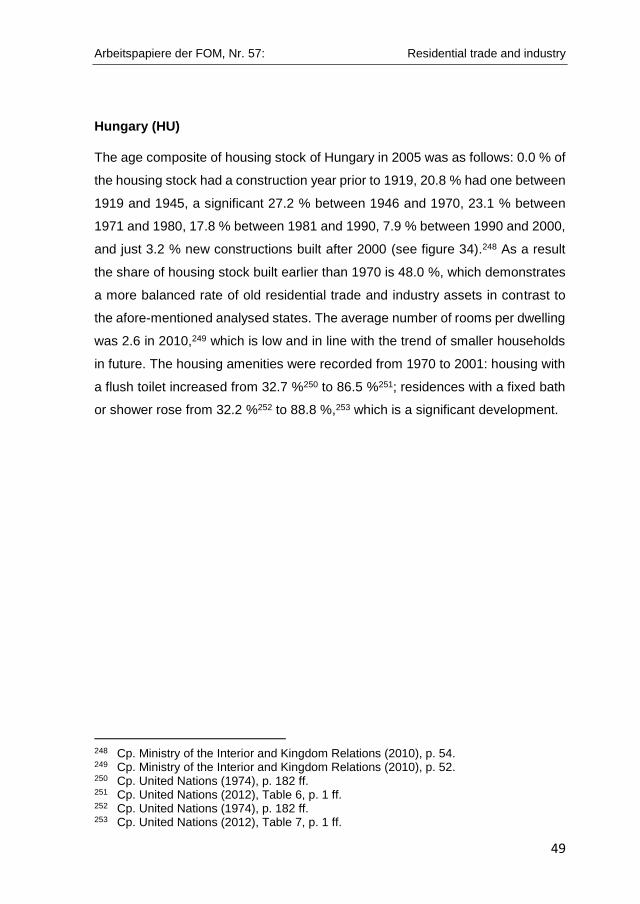
Arbeitspapiere der FOM, Nr. 57: Residential trade and industry
49
Hungary (HU)
The age composite of housing stock of Hungary in 2005 was as follows: 0.0 % of
the housing stock had a construction year prior to 1919, 20.8 % had one between
1919 and 1945, a significant 27.2 % between 1946 and 1970, 23.1 % between
1971 and 1980, 17.8 % between 1981 and 1990, 7.9 % between 1990 and 2000,
and just 3.2 % new constructions built after 2000 (see figure 34).248 As a result
the share of housing stock built earlier than 1970 is 48.0 %, which demonstrates
a more balanced rate of old residential trade and industry assets in contrast to
the afore-mentioned analysed states. The average number of rooms per dwelling
was 2.6 in 2010,249 which is low and in line with the trend of smaller households
in future. The housing amenities were recorded from 1970 to 2001: housing with
a flush toilet increased from 32.7 %250 to 86.5 %251; residences with a fixed bath
or shower rose from 32.2 %252 to 88.8 %,253 which is a significant development.
248 Cp. Ministry of the Interior and Kingdom Relations (2010), p. 54. 249 Cp. Ministry of the Interior and Kingdom Relations (2010), p. 52. 250 Cp. United Nations (1974), p. 182 ff. 251 Cp. United Nations (2012), Table 6, p. 1 ff. 252 Cp. United Nations (1974), p. 182 ff. 253 Cp. United Nations (2012), Table 7, p. 1 ff.
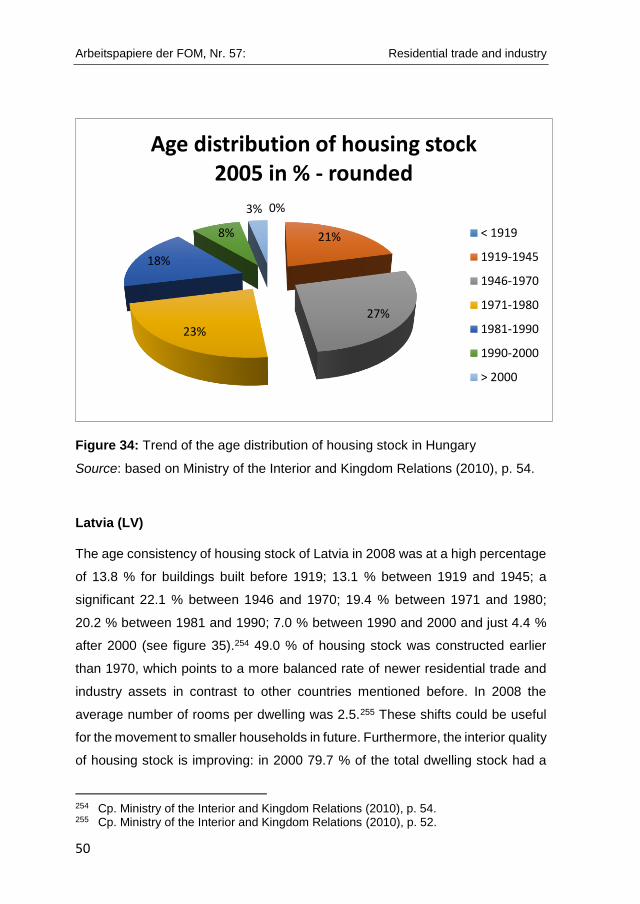
Arbeitspapiere der FOM, Nr. 57: Residential trade and industry
50
Figure 34: Trend of the age distribution of housing stock in Hungary
Source: based on Ministry of the Interior and Kingdom Relations (2010), p. 54.
Latvia (LV)
The age consistency of housing stock of Latvia in 2008 was at a high percentage
of 13.8 % for buildings built before 1919; 13.1 % between 1919 and 1945; a
significant 22.1 % between 1946 and 1970; 19.4 % between 1971 and 1980;
20.2 % between 1981 and 1990; 7.0 % between 1990 and 2000 and just 4.4 %
after 2000 (see figure 35).254 49.0 % of housing stock was constructed earlier
than 1970, which points to a more balanced rate of newer residential trade and
industry assets in contrast to other countries mentioned before. In 2008 the
average number of rooms per dwelling was 2.5.255 These shifts could be useful
for the movement to smaller households in future. Furthermore, the interior quality
of housing stock is improving: in 2000 79.7 % of the total dwelling stock had a
254 Cp. Ministry of the Interior and Kingdom Relations (2010), p. 54. 255 Cp. Ministry of the Interior and Kingdom Relations (2010), p. 52.
0%
21%
27%
23%
18%
8%
3%
Age distribution of housing stock 2005 in % - rounded
< 1919
1919-1945
1946-1970
1971-1980
1981-1990
1990-2000
> 2000

Arbeitspapiere der FOM, Nr. 57: Residential trade and industry
51
piped water system,256 72.8 % a flush toilet,257 98.6 % electric lighting,258 and
67.3 % a fixed bath or shower.259
Figure 35: Trend of the age distribution of housing stock in Latvia
Source: based on Ministry of the Interior and Kingdom Relations (2010), p. 54.
256 Cp. United Nations (2012), Table 5, p. 1 ff. 257 Cp. United Nations (2012), Table 6, p. 1 ff. 258 Cp. United Nations (2012), Table 10, p. 1 ff. 259 Cp. United Nations (2012), Table 7, p. 1 ff.
14%
13%
22%20%
20%
7% 4%
Age distribution of housing stock 2008 in % - rounded
< 1919
1919-1945
1946-1970
1971-1980
1981-1990
1990-2000
> 2000
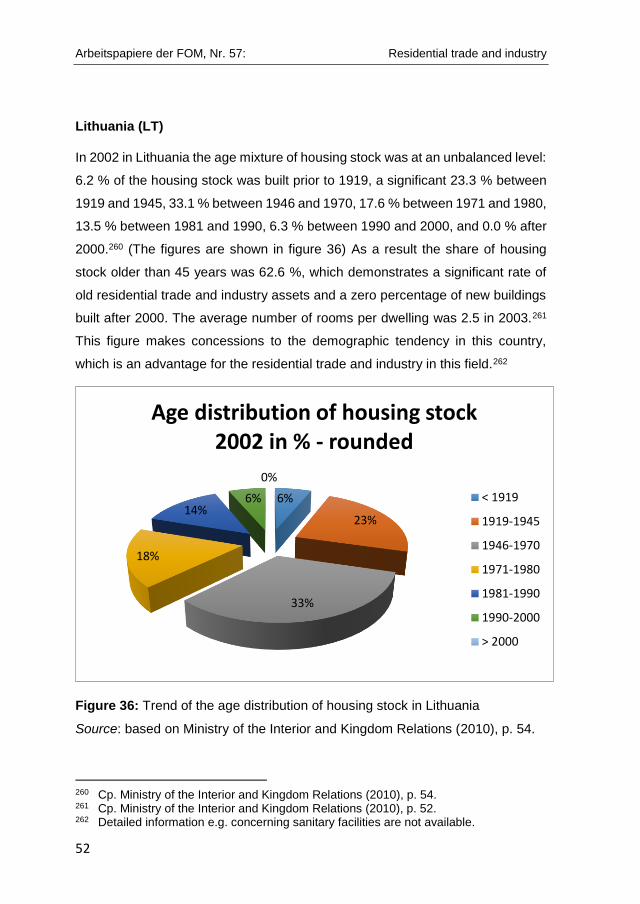
Arbeitspapiere der FOM, Nr. 57: Residential trade and industry
52
Lithuania (LT)
In 2002 in Lithuania the age mixture of housing stock was at an unbalanced level:
6.2 % of the housing stock was built prior to 1919, a significant 23.3 % between
1919 and 1945, 33.1 % between 1946 and 1970, 17.6 % between 1971 and 1980,
13.5 % between 1981 and 1990, 6.3 % between 1990 and 2000, and 0.0 % after
2000.260 (The figures are shown in figure 36) As a result the share of housing
stock older than 45 years was 62.6 %, which demonstrates a significant rate of
old residential trade and industry assets and a zero percentage of new buildings
built after 2000. The average number of rooms per dwelling was 2.5 in 2003.261
This figure makes concessions to the demographic tendency in this country,
which is an advantage for the residential trade and industry in this field.262
Figure 36: Trend of the age distribution of housing stock in Lithuania
Source: based on Ministry of the Interior and Kingdom Relations (2010), p. 54.
260 Cp. Ministry of the Interior and Kingdom Relations (2010), p. 54. 261 Cp. Ministry of the Interior and Kingdom Relations (2010), p. 52. 262 Detailed information e.g. concerning sanitary facilities are not available.
6%
23%
33%
18%
14%6%
0%
Age distribution of housing stock 2002 in % - rounded
< 1919
1919-1945
1946-1970
1971-1980
1981-1990
1990-2000
> 2000
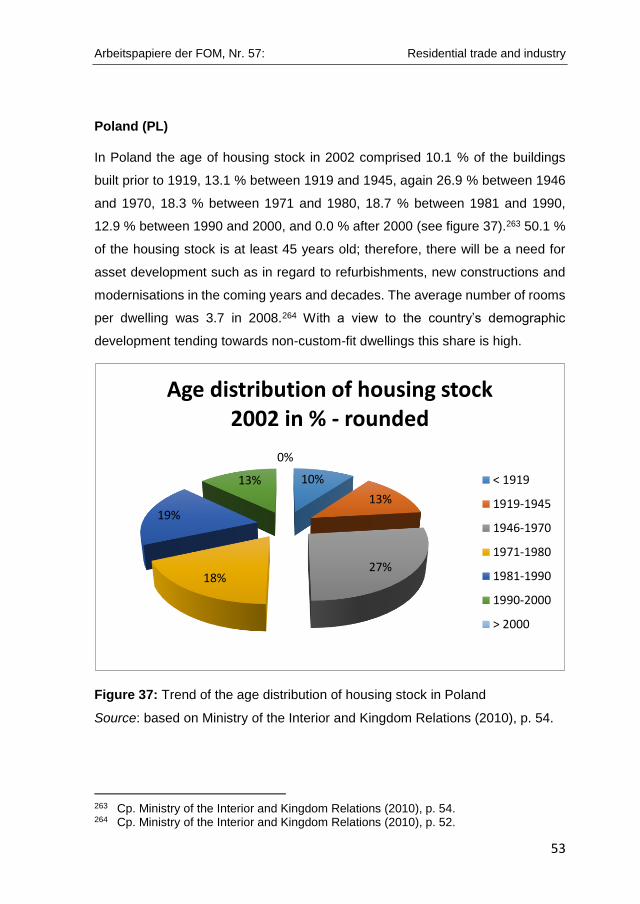
Arbeitspapiere der FOM, Nr. 57: Residential trade and industry
53
Poland (PL)
In Poland the age of housing stock in 2002 comprised 10.1 % of the buildings
built prior to 1919, 13.1 % between 1919 and 1945, again 26.9 % between 1946
and 1970, 18.3 % between 1971 and 1980, 18.7 % between 1981 and 1990,
12.9 % between 1990 and 2000, and 0.0 % after 2000 (see figure 37).263 50.1 %
of the housing stock is at least 45 years old; therefore, there will be a need for
asset development such as in regard to refurbishments, new constructions and
modernisations in the coming years and decades. The average number of rooms
per dwelling was 3.7 in 2008.264 With a view to the country’s demographic
development tending towards non-custom-fit dwellings this share is high.
Figure 37: Trend of the age distribution of housing stock in Poland
Source: based on Ministry of the Interior and Kingdom Relations (2010), p. 54.
263 Cp. Ministry of the Interior and Kingdom Relations (2010), p. 54. 264 Cp. Ministry of the Interior and Kingdom Relations (2010), p. 52.
10%
13%
27%18%
19%
13%
0%
Age distribution of housing stock 2002 in % - rounded
< 1919
1919-1945
1946-1970
1971-1980
1981-1990
1990-2000
> 2000
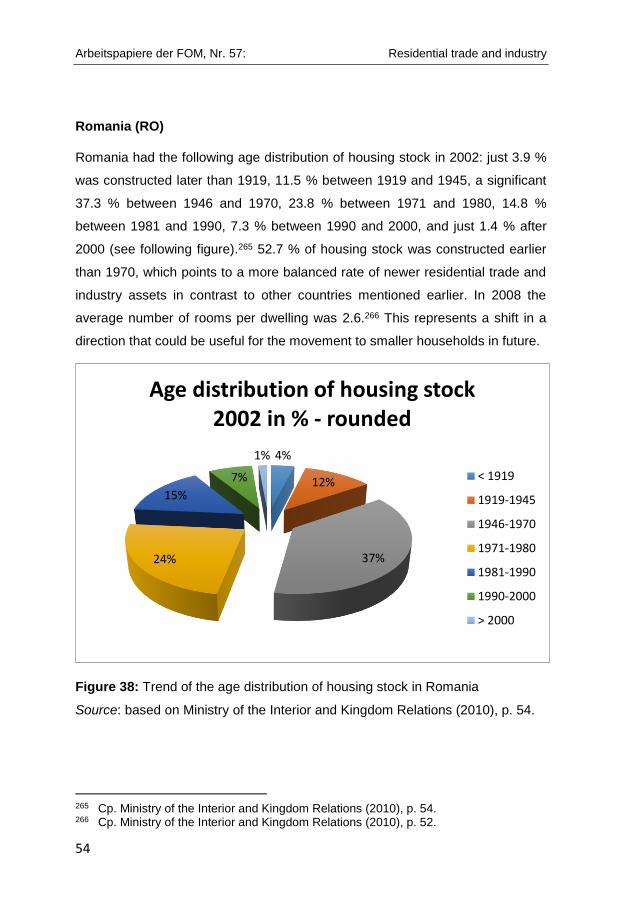
Arbeitspapiere der FOM, Nr. 57: Residential trade and industry
54
Romania (RO)
Romania had the following age distribution of housing stock in 2002: just 3.9 %
was constructed later than 1919, 11.5 % between 1919 and 1945, a significant
37.3 % between 1946 and 1970, 23.8 % between 1971 and 1980, 14.8 %
between 1981 and 1990, 7.3 % between 1990 and 2000, and just 1.4 % after
2000 (see following figure).265 52.7 % of housing stock was constructed earlier
than 1970, which points to a more balanced rate of newer residential trade and
industry assets in contrast to other countries mentioned earlier. In 2008 the
average number of rooms per dwelling was 2.6.266 This represents a shift in a
direction that could be useful for the movement to smaller households in future.
Figure 38: Trend of the age distribution of housing stock in Romania
Source: based on Ministry of the Interior and Kingdom Relations (2010), p. 54.
265 Cp. Ministry of the Interior and Kingdom Relations (2010), p. 54. 266 Cp. Ministry of the Interior and Kingdom Relations (2010), p. 52.
4%
12%
37%24%
15%
7%
1%
Age distribution of housing stock 2002 in % - rounded
< 1919
1919-1945
1946-1970
1971-1980
1981-1990
1990-2000
> 2000

Arbeitspapiere der FOM, Nr. 57: Residential trade and industry
55
Slovakia (SK)
Slovakia has a more balanced rate of old real estate assets. The age distribution
of real estate assets in 2001 was as follows: 3.4 % had a construction year prior
to 1919, a low 6.6 % between 1919 and 1945, the major portion of 35.1 %
between 1946 and 1970, 25.6 % between 1971 and 1980, 21.0 % between 1981
and 1990, just 6.2 % between 1990 and 2000, and a marginal 0.6 % are newer
buildings built after 2000 as shown in figure 39.267 Therefore, the share of housing
stock constructed in 1970 and earlier was 45.1 %, which is a low and balanced
rate of old residential trade and industry assets. The average number of rooms
per dwelling was 3.2 in 2001.268 This share is high in front of the demographic
development of the country.
Figure 39: Trend of the age distribution of housing stock in Slovakia
Source: based on Ministry of the Interior and Kingdom Relations (2010), p. 54.
267 Cp. Ministry of the Interior and Kingdom Relations (2010), p. 54. 268 Cp. Ministry of the Interior and Kingdom Relations (2010), p. 52.
3%
7%
36%
26%
21%
6%
1%
Age distribution of housing stock 2001 in % - rounded
< 1919
1919-1945
1946-1970
1971-1980
1981-1990
1990-2000
> 2000

Arbeitspapiere der FOM, Nr. 57: Residential trade and industry
56
Spain (ES)
The age mixture of housing assets of Spain in 2001 was notable: 8.9 % of the
housing stock was built prior to 1919, 4.2 % between 1919 and 1945, a significant
33.5 % between 1946 and 1970, again 24.1 % between 1971 and 1980, 13.6 %
between 1981 and 1990, 15.7 % between 1990 and 2000, and a remarkable
0.0 % after 2000 as shown in figure 40.269 Therefore, 46.6 % of housing were
older stock constructed before 1970; these rates demonstrate an equated
proportion of age distributions. The average number of rooms per dwelling was
5.1 in 2008,270 which is very high and stands in significant contrast to the
demographic tendencies of the country.
Figure 40: Trend of the age distribution of housing stock in Spain
Source: based on Ministry of the Interior and Kingdom Relations (2010), p. 54.
269 Cp. Ministry of the Interior and Kingdom Relations (2010), p. 54. 270 Cp. Ministry of the Interior and Kingdom Relations (2010), p. 52.
9%4%
33%
24%
14%
16%
0%
Age distribution of housing stock 2001 in %
< 1919
1919-1945
1946-1970
1971-1980
1981-1990
1990-2000
> 2000

Arbeitspapiere der FOM, Nr. 57: Residential trade and industry
57
2.4 Environmental social progress
Bulgaria (BG)
Bulgaria covers an area of 110,912 km2.271 In 1970 the population density per
km2 was 77 people.272 The urban cluster was 50.6 % of the total population, while
for rural areas the figure was 49.4 %.273 The tenure status in the base year 1965
had a high level of owner-occupiers representing 71.0 % of the total; the second
cluster of private renters was 17.1 %.274 The additional clusters are not available.
In the current base year 2007 the population density per km2 had fallen to 69
people.275 The population was heading in a more urban direction until 2006: a
high-density cluster of 35 %, an urban cluster of 26 % and a rural cluster of
39 %.276 Also tenure status changed significantly: In 2008 the share of owner-
occupied housing was 95.6 %277 with an increase of 34.6 % in contrast to 1965.
These processes will continue in the future. In 2050 the forecast for population
per km2 is predicted to be much lower at 46.0 people278 and a high urban cluster
of 83.41 %.279 A forecast of how tenure status will develop in the future is not
available.
Also the economic conditions are important to focus on. The 2010 per-capita
income level in comparison to the other countries with shrinking populations in
the EU 27 is low at 2,542 USD.280 The share of housing costs in disposable
income is 18.4 %.281 This is a relatively low and, therefore, positive level in
comparison to other analysed countries in the EU. The number of dependent
people in Bulgaria is 333,000.282 This is around 4.4 % of the population, which is
271 Cp. Ministry of the Interior and Kingdom Relations (2010), p. 19. 272 Cp. United Nations (1971), p. 110 ff. 273 Cp. United Nations (1971), p. 148 ff. 274 Cp. United Nations (1974), p. 56 ff. 275 Cp. Ministry of the Interior and Kingdom Relations (2010), p. 19. 276 Cp. Eurostat (2012a), p. 199. 277 Cp. CECODHAS Housing Europe (2012), p. 38 ff. 278 Cp. Geohive (w.y.b), w. p. (date of demand: 10.07.2015). 279 Cp. Geohive (w.y.a), w. p. (date of demand: 10.07.2015). 280 Cp. HSBC Global Research (2012), p. 4 f. 281 Cp. CECODHAS Housing Europe (2012), p. 38 ff. 282 Cp. European Commission (2012), p. 358.

Arbeitspapiere der FOM, Nr. 57: Residential trade and industry
58
at a relatively stable level. For 2050 there is a higher income of 13,154 USD per
capita forecasted (see figure 41) 283, which is less significant than in other states
in the EU 27 the number of dependent people will increase by about 6.3 % of the
population equating to 370,000.284
Figure 41: The movement of the income level in Bulgaria
Source: based on HSBC Global Research (2012), p. 4 f.
The total housing costs in purchasing power standards to express the volume of
economic aggregates is 165.6285 based on 2009, which represents a lower
standard than most of the other countries mentioned earlier. The construction
cost index as an indicator of the average cost movement over time of a fixed
basket of representative goods and services related to the construction industry
with a basis of 2005 equal to 100 % is 139.9,286 which is one of the highest and,
therefore, more adverse levels of the evaluated countries with shrinking
populations. Estimations for the future are not available. Nevertheless, these
economic conditions demonstrate contrasting relationships and could have
consequences for the portfolio management. The unemployment rate of the
283 Cp. HSBC Global Research (2012), p. 4 f. 284 Cp. European Commission (2012), p. 358. 285 Cp. CECODHAS Housing Europe (2012), p. 38 ff. 286 Cp. CECODHAS Housing Europe (2012), p. 38 ff.
2010 2050
Income per capita(USD)
2.542,00 13.154,00
-
2.000,00
4.000,00
6.000,00
8.000,00
10.000,00
12.000,00
14.000,00
Inco
me
leve
l
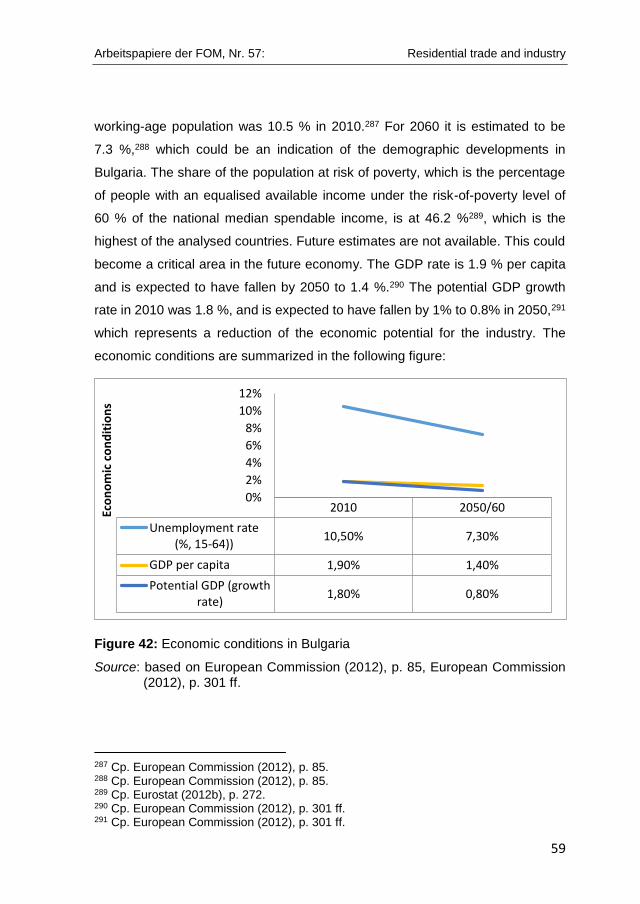
Arbeitspapiere der FOM, Nr. 57: Residential trade and industry
59
working-age population was 10.5 % in 2010.287 For 2060 it is estimated to be
7.3 %,288 which could be an indication of the demographic developments in
Bulgaria. The share of the population at risk of poverty, which is the percentage
of people with an equalised available income under the risk-of-poverty level of
60 % of the national median spendable income, is at 46.2 %289, which is the
highest of the analysed countries. Future estimates are not available. This could
become a critical area in the future economy. The GDP rate is 1.9 % per capita
and is expected to have fallen by 2050 to 1.4 %.290 The potential GDP growth
rate in 2010 was 1.8 %, and is expected to have fallen by 1% to 0.8% in 2050,291
which represents a reduction of the economic potential for the industry. The
economic conditions are summarized in the following figure:
Figure 42: Economic conditions in Bulgaria
Source: based on European Commission (2012), p. 85, European Commission (2012), p. 301 ff.
287 Cp. European Commission (2012), p. 85. 288 Cp. European Commission (2012), p. 85. 289 Cp. Eurostat (2012b), p. 272. 290 Cp. European Commission (2012), p. 301 ff. 291 Cp. European Commission (2012), p. 301 ff.
2010 2050/60
Unemployment rate(%, 15-64))
10,50% 7,30%
GDP per capita 1,90% 1,40%
Potential GDP (growthrate)
1,80% 0,80%
0%
2%
4%
6%
8%
10%
12%
Eco
no
mic
co
nd
itio
ns

Arbeitspapiere der FOM, Nr. 57: Residential trade and industry
60
Estonia (EE)
Estonia covers an area of 45,227 km2.292 In 1970 the population density per km2
in the USSR was low at 11 people293 with a balanced urban cluster of 56.3 % of
the total population, and 43.7 % for rural areas.294 In 2007 the average population
density per km2 had risen to 30.9 people.295 The tenure status of the base year
1965 is not available. The population density per km2 in 2006 showed an increase
of the high-density cluster to 32.0 %, urban cluster 29.0 %, and a decrease of the
rural cluster to 39.0 %.296 Tenure data for 2008 demonstrated a high and crucial
share of owner-occupied housing with 96.0 %.297 In 2050 the population density
per km2 is predicted to have fallen to 25.0 people298 with the urban cluster having
increased to 80.0 %.299
The proportion of housing costs from disposable income was 15.5 % in 2009.300
This is the lowest share of the analysed countries in the EU and shows a positive
economic tendency in the residential trade and industry. Dependent people
number 95,000,301 which equates to approximately 7.3 % and is relatively high
for this country. In 2050 it is predicted that the amount of dependent people will
have risen to 9.4 % equating to 113,000.302 The total housing costs in purchasing
power standards is 179.0303 for the base year 2009; this standard is located in
the middle of the analysed states. The construction cost index with a basis of
2005 equal to 100 % is 115.3.304 Therefore, the prices for new buildings are
mainly stable in the economy. The high unemployment rate of the working-age
292 Cp. Ministry of the Interior and Kingdom Relations (2010), p. 19. 293 Cp. United Nations (1971), p. 110 ff. 294 Cp. United Nations (1971), p. 148 ff. 295 Cp. Ministry of the Interior and Kingdom Relations (2010), p. 19. 296 Cp. Eurostat (2012a), p. 199. 297 Cp. CECODHAS Housing Europe (2012), p. 38 ff. 298 Cp. Geohive (w.y.b), w. p. (date of demand: 10.07.2015). 299 Cp. Geohive (w.y.a), w. p. (date of demand: 10.07.2015). 300 Cp. CECODHAS Housing Europe (2012), p. 38 ff. 301 Cp. European Commission (2012), p. 358. 302 Cp. European Commission (2012), p. 358. 303 Cp. CECODHAS Housing Europe (2012), p. 38 ff. 304 Cp. CECODHAS Housing Europe (2012), p. 38 ff.

Arbeitspapiere der FOM, Nr. 57: Residential trade and industry
61
population was 17.2 % in 2010.305 For 2060 it is estimated to have fallen to
7.3 %306 as a result of an upturn in the employment market in Estonia. 23.4 % of
the population is at risk of poverty,307 which is one of the lowest levels among the
selected states. Future estimates are not available. The GDP rate in 2010 was
minus 0.8 % per capita, but by 2050 is expected to have increased to plus
1.1 %.308 The potential GDP growth rate was also low in 2010 at minus 0.8 %,
but is forecast to have increased to 0.9 % by 2050.309 These figures show
Estonia’s poor economic situation (see figure 43), both today and in future, which
will also have consequences for developments in the real estate sector.
Figure 43: Economic conditions in Estonia
Source: based on European Commission (2012), p. 85, European Commission (2012), p. 301 ff.
305 Cp. European Commission (2012), p. 85. 306 Cp. European Commission (2012), p. 85. 307 Cp. Eurostat (2012b), p. 272. 308 Cp. European Commission (2012), p. 301 ff. 309 Cp. European Commission (2012), p. 301 ff.
2010 2050/60
Unemployment rate(%, 15-64))
17,20% 7,30%
GDP per capita -0,80% 1,10%
Potential GDP (growthrate)
-0,80% 0,90%
-2%0%2%4%6%8%
10%12%14%16%18%20%
Eco
no
mic
co
nd
itio
ns

Arbeitspapiere der FOM, Nr. 57: Residential trade and industry
62
Germany (DE)
Germany has an area of 357,031 km2.310 In 1970 the population density per km2
was 212.73 people311 with a balanced urban cluster of 43.3 % of the total
population in 1968/1969; for rural areas it was 56.7 %.312 In the actual base year
2007 the appropriate population rate per km2 was calculated at 229.9 people.313
The population density per km2 in 2006 reveals an important movement towards
a high-density cluster of 31.0 %, an urban cluster of 41.0 %, and a low rural cluster
of 28.0 %.314 In comparison to other researched countries the tenure level in 2008
showed a relatively low rate of owner-occupied housing at 42.0 %, private
housing at 53.0 % and social housing at 5.0 %.315 In 2050 forecasts indicate that
the population density per km2 will have fallen to 203.0 people,316 with an
increased urban cluster of 83.8 % and a rural cluster of 16.2 %.317
The income level of 2010 is in comparison to the other countries with shrinking
populations in the EU 27 on a high level with a per-capita income of 25,083.00
USD predicted to be 52,683.00 USD in 2050.318 The amount of housing costs
from disposable income was calculated to be high and, therefore, an adverse
share of 31.0 % in 2009 was noticed.319 In 2009 the free market rent was available
to the amount of 4,900 euros per year and up to an area of 71.0 m2 per
habitation.320 There are 8,408.0 thousand dependent people in the country,321
representing more than 10 %, which is deemed highly. By 2050 it is predicted to
have increased further to 13.9 % equating to 9,810.0 thousand people.322 As this
310 Cp. Ministry of the Interior and Kingdom Relations (2010), p. 19. 311 Cp. European Commission (2012), p. 110 ff. 312 Cp. United Nations (1971), p. 148 ff. 313 Cp. Ministry of the Interior and Kingdom Relations (2010), p. 19. 314 Cp. Eurostat (2012a), p. 199. 315 Cp. CECODHAS Housing Europe (2012), p. 38 ff. 316 Cp. Geohive (w.y.b), w. p. (date of demand: 10.07.2015). 317 Cp. Geohive (w.y.a), w. p. (date of demand: 10.07.2015). 318 Cp. HSBC Global Research (2012), p. 4 f. 319 Cp. CECODHAS Housing Europe (2012), p. 38 ff. 320 Cp. Ministry of the Interior and Kingdom Relations (2010), p. 90. 321 Cp. European Commission (2012), p. 358. 322 Cp. European Commission (2012), p. 358.
Arbeitspapiere der FOM, Nr. 57: Residential trade and industry
63
defines people dependent on financial support, this places the real estate sector
and the economy on a rather downward slope. The total housing costs in
purchasing power standards was 771.5 in 2009.323 This is by far the highest of
the analysed countries and limits the additional spending capacity of the
population. The construction cost index in 2005 equal to 100 % was at a balanced
level of 111.5.324 The unemployment rate of the working-age population was the
lowest of the evaluated states at 7.2 % in 2010.325 For 2060 it is expected to have
fallen to 6.1 %.326 20.0 % of the population is deemed at risk of poverty,327 which
is one of the lowest levels of the analysed states. The GDP rate in 2010 was
1.2 % per capita, but by 2050 is expected to have increased to 1.4 %.328 In 2010
the size of the economy was calculated at 2,058 billion USD, and is predicted to
have risen to 3,714 USD by 2050.329 Nevertheless, these mentioned economic
conditions (summarized in the following figure) point to a stable and increasing
tendency of Germany.
323 Cp. CECODHAS Housing Europe (2012), p. 38 ff. 324 Cp. CECODHAS Housing Europe (2012), p. 38 ff. 325 Cp. European Commission (2012), p. 85. 326 Cp. European Commission (2012), p. 85. 327 Cp. Eurostat (2012b), p. 272. 328 Cp. European Commission (2012), p. 301 ff. 329 Cp. HSBC Global Research (2012), p. 4.

Arbeitspapiere der FOM, Nr. 57: Residential trade and industry
64
Figure 44: Economic conditions in Germany
Source: based on European Commission (2012), p. 85, European Commission (2012), p. 301 ff.
Hungary (HU)
Hungary covers an area of 93,030 km2.330 In 1970 its population density per km2
was 111.0 people.331 In 1969 its urban cluster represented 44.4 % of the total
population and the remaining part of 55.6% is represented by the rural areas.332
In 2007 the average population rate per km2 was calculated to have fallen to
108.1 people.333 The population density per km2 fixed in the last base year 2006
was again at a balanced level of a high-density cluster with 24.0 %, an urban
cluster of 33.0 % and a rural cluster of 43.0 %.334 By 2050 the population per km2
is expected to have fallen to 96.0 people335 with a significant share of an urban
cluster of 82.1 %.336 This tendency demonstrates a high development towards
330 Cp. Ministry of the Interior and Kingdom Relations (2010), p. 19. 331 Cp. United Nations (1971), p. 110 ff. 332 Cp. United Nations (1971), p. 148 ff. 333 Cp. Ministry of the Interior and Kingdom Relations (2010), p. 19. 334 Cp. Eurostat (2012a), p. 199. 335 Cp. Geohive (w.y.b), w. p., (date of demand: 10.07.2015). 336 Cp. Geohive (w.y.a), w. p., (date of demand: 10.07.2015).
2010 2050/60
Unemployment rate(%, 15-64))
7,20% 6,10%
GDP per capita 1,20% 1,40%
Potential GDP (growthrate)
1,20% 0,80%
0%1%2%3%4%5%6%7%8%
Eco
no
mic
co
nd
itio
ns
Arbeitspapiere der FOM, Nr. 57: Residential trade and industry
65
more urban areas. The tenure level in 1970 demonstrated a high proportion of
owner-occupied housing with 62.9 % and private housing with 29.6 %.337 In 2008
the tenure status of owner-occupied housing shifted to a crucial level of 92.0 %.338
There have been important changes regarding economic conditions. The Per-
capita income was 5,833 USD in 2010 and is predicted to be 31,966 USD in
2050.339 The proportion of housing costs from disposable income is calculated
with a balanced quote of 23.2 % in 2009.340 The free market rent is analysed with
1,700 euros per year and a size of 51.0 m2 per habitation in 2009; the level of
rent in regulated markets was much lower at 400 euros per year and an average
size dwelling of 48 m2 in 2009.341 8.1 % of the population were described as being
dependent on others, equating to 805.0 thousand people.342 By 2050 this number
is expected to have increased to 1,002.0 thousand.343 This figure of 10.9 % is
significant for the economic situation due to a reduction in the spending power of
the inhabitants of Hungary.
The total housing costs in purchasing power standards were 244.60 euros in
2009.344 This lies in the middle of the researched states of the EU. The 2005
construction cost index equal to 100 % was relatively high in comparison to the
other countries and came to 123.1.345 The unemployment rate of the working-age
population was 11.3 % in 2010. By 2060 it is expected to have fallen to 7.3 %.346
29.6 % of the population was deemed at risk of poverty in 2009, which is relatively
high compared to the other countries analysed.347 The gross domestic product
rate in 2010 was negative at minus 1.5 % per capita but by 2050 is expected to
337 Cp. United Nations (1974), p. 56 ff. 338 Cp. CECODHAS Housing Europe (2012), p. 38 ff. 339 Cp. HSBC Global Research (2012), p. 4 f. 340 Cp. CECODHAS Housing Europe (2012), p. 38 ff. 341 Cp. Ministry of the Interior and Kingdom Relations (2010), p. 90. 342 Cp. European Commission (2012), p. 358. 343 Cp. European Commission (2012), p. 358. 344 Cp. CECODHAS Housing Europe (2012), p. 38 ff. 345 Cp. CECODHAS Housing Europe (2012), p. 38 ff. 346 Cp. European Commission (2012), p. 85. 347 Cp. Eurostat (2012b), p. 272.
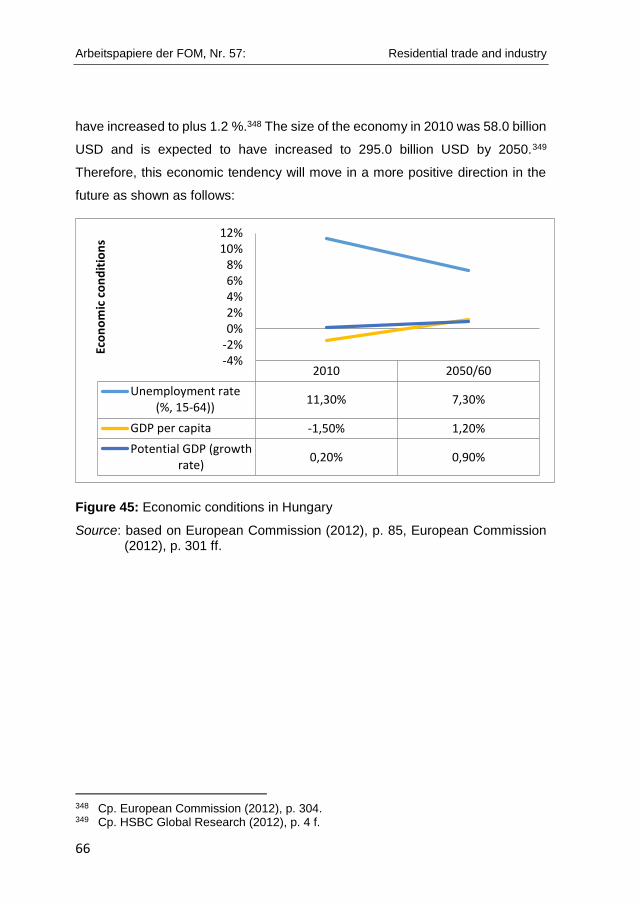
Arbeitspapiere der FOM, Nr. 57: Residential trade and industry
66
have increased to plus 1.2 %.348 The size of the economy in 2010 was 58.0 billion
USD and is expected to have increased to 295.0 billion USD by 2050.349
Therefore, this economic tendency will move in a more positive direction in the
future as shown as follows:
Figure 45: Economic conditions in Hungary
Source: based on European Commission (2012), p. 85, European Commission (2012), p. 301 ff.
348 Cp. European Commission (2012), p. 304. 349 Cp. HSBC Global Research (2012), p. 4 f.
2010 2050/60
Unemployment rate(%, 15-64))
11,30% 7,30%
GDP per capita -1,50% 1,20%
Potential GDP (growthrate)
0,20% 0,90%
-4%-2%0%2%4%6%8%
10%12%
Eco
no
mic
co
nd
itio
ns

Arbeitspapiere der FOM, Nr. 57: Residential trade and industry
67
Latvia (LV)
Latvia covers an area of 64,589 km2.350 In 1970 under the USSR regime the
population density per km2 was 11.0 people351 with an urban cluster of 56.3 % of
the total population; rural areas according to the available base year 1959
represented 43.7 % of the population.352 By 2007 the average population rate per
km2 had increased to 36.5 people.353 The population density per km2 in the last
base year 2006 included a balanced share of a high-density cluster of 35.0 %, an
urban cluster of 25.0 % and a rural cluster of 40.0 %.354 In 2050 the population
per km2 is again expected to have fallen to 26.0 people355, with the urban cluster
rising crucially to 78.1 % and the rural group falling to 21.9 %.356 Like the countries
analysed earlier this tendency again demonstrates a high development to urban
areas. In 2010 the high share of owner-occupied housing was calculated at
84.9 %, private housing at 14.7 % and a small amount of social housing at
0.4 %.357 The income per capita was calculated at 4,973 USD in 2010 and is
estimated to have reached a more balanced level of 27,143 USD by 2050.358 The
proportion of housing costs from disposable income was found to be the 3rd
lowest of the countries analysed at 18.0 % in 2009.359 6.2 % of the population
was calculated to be dependent people equating to 137.0 thousand.360 In 2050 it
is expected to have increased to 157.0 thousand361 or 8.7 %, which will be on a
balanced level in comparison to the other analysed countries. The total housing
costs in purchasing power standards had fallen to be among the middle of the
other ranked states with 186.2 in 2009.362 The 2005 construction cost index equal
350 Cp. Ministry of the Interior and Kingdom Relations (2010), p. 19. 351 Cp. United Nations (1971), p. 110 ff. 352 Cp. United Nations (1971), p. 148 ff. 353 Cp. Ministry of the Interior and Kingdom Relations (2010), p. 19. 354 Cp. Eurostat (2012a), p. 199. 355 Cp. Geohive (w.y.b), w. p., (date of demand: 10.07.2015). 356 Cp. Geohive (w.y.a), w. p., (date of demand: 10.07.2015). 357 Cp. CECODHAS Housing Europe (2012), p. 38 ff. 358 Cp. HSBC Global Research (2012), p. 4 f. 359 Cp. CECODHAS Housing Europe (2012), p. 38 ff. 360 Cp. European Commission (2012), p. 358. 361 Cp. European Commission (2012), p. 358. 362 Cp. CECODHAS Housing Europe (2012), p. 38 ff.

Arbeitspapiere der FOM, Nr. 57: Residential trade and industry
68
to 100 % was 152.5.363 This is the highest of the researched countries with the
result of higher prices in the new building sector. The unemployment rate of the
working-age population was the 2nd highest after Spain with 19.0 % in 2010; for
2060 it is expected to have fallen sharply to 7.3 %.364 The share of the population
at risk of poverty in 2009 was established as the 3rd highest with 37.4 %.365 The
GDP rate in 2010 was negative at minus 0.7 % per capita and will have increased
marginally by 2050 to plus 1.0 %.366 The size of the economy was fixed in 2010
at 11.0 billion USD and is predicted to be 52.0 billion USD for 2050.367 In
consequence the economy focuses on difficult conditions, but will exhibit a
tendency towards a more positive development in the future (see figure 46). The
average annual rent for rental dwellings of the free market was fixed in 2009 at
85,000 euros and an average dwelling size of 48 m2, while the rent of regulated
markets was much lower at 14,000 euros per year and 51 m2 the average size
for the rental dwellings,368 which reveals a strong difference between free and
regulated markets. The average price for an existing dwelling was 24,000 euros
in 2009,369 which is on a relatively low level in contrast to the rents of the free
market.
363 Cp. CECODHAS Housing Europe (2012), p. 38 ff. 364 Cp. European Commission (2012), p. 85. 365 Cp. Eurostat (2012b), p. 272. 366 Cp. European Commission (2012), p. 304. 367 Cp. HSBC Global Research (2012), p. 4. 368 Cp. Ministry of the Interior and Kingdom Relations (2010), p. 90. 369 Cp. Ministry of the Interior and Kingdom Relations (2010), p. 89.
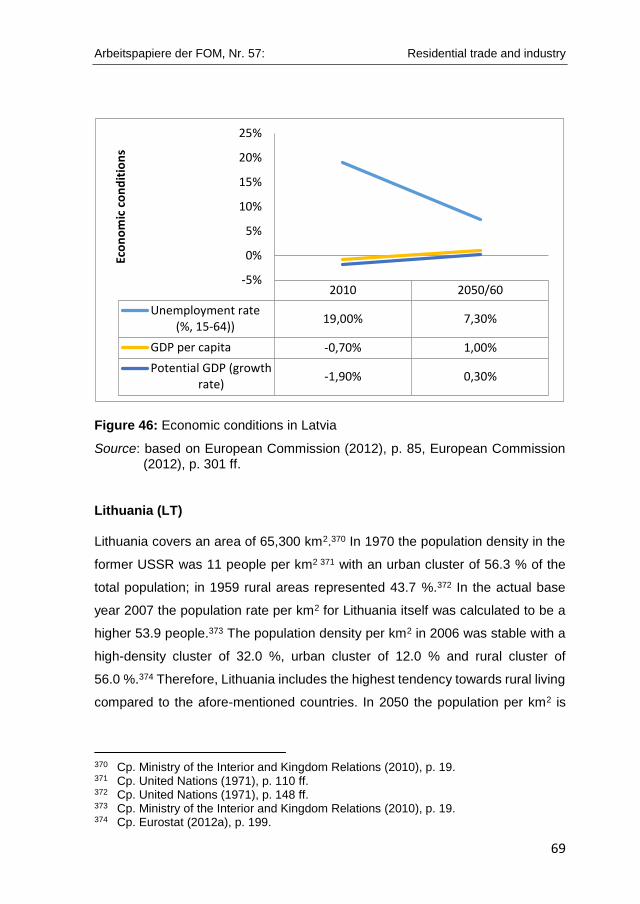
Arbeitspapiere der FOM, Nr. 57: Residential trade and industry
69
Figure 46: Economic conditions in Latvia
Source: based on European Commission (2012), p. 85, European Commission (2012), p. 301 ff.
Lithuania (LT)
Lithuania covers an area of 65,300 km2.370 In 1970 the population density in the
former USSR was 11 people per km2 371 with an urban cluster of 56.3 % of the
total population; in 1959 rural areas represented 43.7 %.372 In the actual base
year 2007 the population rate per km2 for Lithuania itself was calculated to be a
higher 53.9 people.373 The population density per km2 in 2006 was stable with a
high-density cluster of 32.0 %, urban cluster of 12.0 % and rural cluster of
56.0 %.374 Therefore, Lithuania includes the highest tendency towards rural living
compared to the afore-mentioned countries. In 2050 the population per km2 is
370 Cp. Ministry of the Interior and Kingdom Relations (2010), p. 19. 371 Cp. United Nations (1971), p. 110 ff. 372 Cp. United Nations (1971), p. 148 ff. 373 Cp. Ministry of the Interior and Kingdom Relations (2010), p. 19. 374 Cp. Eurostat (2012a), p. 199.
2010 2050/60
Unemployment rate(%, 15-64))
19,00% 7,30%
GDP per capita -0,70% 1,00%
Potential GDP (growthrate)
-1,90% 0,30%
-5%
0%
5%
10%
15%
20%
25%Ec
on
om
ic c
on
dit
ion
s
Arbeitspapiere der FOM, Nr. 57: Residential trade and industry
70
expected to have fallen to 39.0 people375, with an urban cluster of 78.7 % and
rural cluster of 21.3 % of the population,376 which points to an assimilated
formation in contrast to previous decades in this country. The tenure level in 2008
demonstrated a high rate of owner-occupied housing with 91.0 %, private housing
4.0 % and social housing 3.0 % with about 2.0 % being other housing
constellations.377
The income level of 2010 was low with a per-capita income of 5,154 USD which
will be increased to 20,955 USD by 2050 according to forecasts.378 The
proportion of housing costs coming out of disposable income was 15.9 % in
2009.379 This is one of the lowest shares of the evaluated countries in the EU 27,
which allows the possibility of growth for the real estate sector in the future. The
free market rent was available at 1,100 euros per year and a size of 61.0 m2 per
habitation in 2008; the average rent of the regulated market was around 10 % of
the free market rents, which equates to 100 euros per year with a dwelling size
of 44 m2.380 8.5 % of the population is deemed dependent on others equating to
280 thousand people.381 In 2050 this is expected to have increased to 327
thousand382 or 11.7 %, which is high. The total housing costs in purchasing power
standards were 168.2 in 2009.383 This is the 3rd lowest of the researched countries
and should have a positive influence on the real estate sector. The 2005
construction cost index equal to 100 % came to 116.1.384 Also this trend is stable
and ranks in the middle of the analysed countries. In 2010 the unemployment rate
of the working-age population was very high at 18.1 % compared to the other
states; for 2060 it is forecast to have fallen sharply to 7.3 %.385 The percentage
375 Cp. Geohive (w.y.b), w. p. (date of demand: 10.07.2015). 376 Cp. Geohive (w.y.a), w. p. (date of demand: 10.07.2015). 377 Cp. CECODHAS Housing Europe (2012), p. 38 ff. 378 Cp. HSBC Global Research (2012), p. 4 f. 379 Cp. CECODHAS Housing Europe (2012), p. 38 ff. 380 Cp. Ministry of the Interior and Kingdom Relations (2010), p. 90. 381 Cp. European Commission (2012), p. 358. 382 Cp. European Commission (2012), p. 358. 383 Cp. CECODHAS Housing Europe (2012), p. 38 ff. 384 Cp. CECODHAS Housing Europe (2012), p. 38 ff. 385 Cp. European Commission (2012), p. 85.
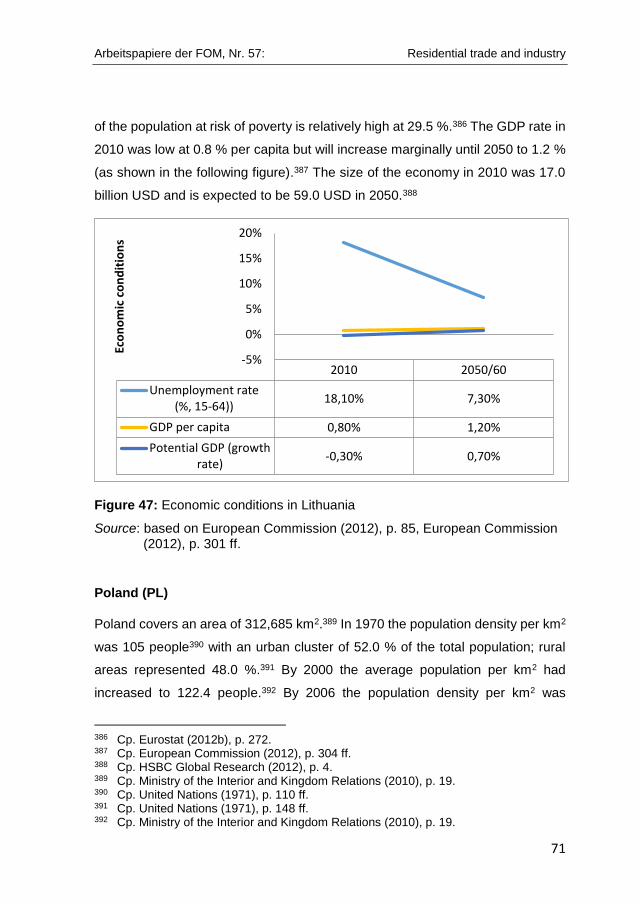
Arbeitspapiere der FOM, Nr. 57: Residential trade and industry
71
of the population at risk of poverty is relatively high at 29.5 %.386 The GDP rate in
2010 was low at 0.8 % per capita but will increase marginally until 2050 to 1.2 %
(as shown in the following figure).387 The size of the economy in 2010 was 17.0
billion USD and is expected to be 59.0 USD in 2050.388
Figure 47: Economic conditions in Lithuania
Source: based on European Commission (2012), p. 85, European Commission (2012), p. 301 ff.
Poland (PL)
Poland covers an area of 312,685 km2.389 In 1970 the population density per km2
was 105 people390 with an urban cluster of 52.0 % of the total population; rural
areas represented 48.0 %.391 By 2000 the average population per km2 had
increased to 122.4 people.392 By 2006 the population density per km2 was
386 Cp. Eurostat (2012b), p. 272. 387 Cp. European Commission (2012), p. 304 ff. 388 Cp. HSBC Global Research (2012), p. 4. 389 Cp. Ministry of the Interior and Kingdom Relations (2010), p. 19. 390 Cp. United Nations (1971), p. 110 ff. 391 Cp. United Nations (1971), p. 148 ff. 392 Cp. Ministry of the Interior and Kingdom Relations (2010), p. 19.
2010 2050/60
Unemployment rate(%, 15-64))
18,10% 7,30%
GDP per capita 0,80% 1,20%
Potential GDP (growthrate)
-0,30% 0,70%
-5%
0%
5%
10%
15%
20%
Eco
no
mic
co
nd
itio
ns
Arbeitspapiere der FOM, Nr. 57: Residential trade and industry
72
exhibiting a stable and balanced tendency towards urban living with a high-
density cluster of 28.0 %, an urban cluster of again 28.0 % and a rural cluster of
44.0%.393 The tenure standard in 2008 demonstrated a more balanced share in
comparison to the other analysed states with 62.4 % of owner-occupied housing,
8.0 % private rent, 10.0 % social rent and other habitations with 19.6 %.394 By
2050 the population per km2 is forecast to have fallen to a level similar to 1970
with 109.0 people395, but with an urban cluster of 73.6 % of the population.396 This
tendency towards less rural living is exhibited by a significant reduction to 40.0 %
in comparison to the actual base year 2006.
The proportion of housing costs taken from disposable income ranks in the middle
of the analysed states at 21.1 % in 2009.397 6.3 % of the population was deemed
dependent on others in 2010 equating to 2,424 thousand people.398 By 2050 it is
forecast to have grown to 9.7 % or 3,349 thousand.399 The total housing costs in
purchasing power standards were 250.1400 for the base year 2009 and, therefore,
one of the highest of the researched countries with the result of a reduction in the
spending power of inhabitants. Nevertheless, there is a relatively low construction
cost index with a basis of 2005 equal to 100 % is 115.8.401 Consequently new
buildings are more affordable in Poland than in other states of the EU. In 2010
the unemployment rate of the working-age population was comparatively low at
9.8 %.402 By 2060 it is expected to be 7.3 %403 with the result of a boost to
Poland’s employment market. In 2009 the percentage of the population at risk of
poverty at 27.8 %404 ranked it in the middle of the analysed countries. The GDP
393 Cp. Eurostat (2012a), p. 199. 394 Cp. CECODHAS Housing Europe (2012), p. 38 ff. 395 Cp. Geohive (w.y.b), w. p. (date of demand: 10.07.2015). 396 Cp. Geohive (w.y.a), w. p. (date of demand: 10.07.2015). 397 Cp. CECODHAS Housing Europe (2012), p. 38 ff. 398 Cp. European Commission (2012), p. 358. 399 Cp. European Commission (2012), p. 358. 400 Cp. CECODHAS Housing Europe (2012), p. 38 ff. 401 Cp. CECODHAS Housing Europe (2012), p. 38 ff. 402 Cp. European Commission (2012), p. 85. 403 Cp. European Commission (2012), p. 85. 404 Cp. Eurostat (2012b), p. 272.

Arbeitspapiere der FOM, Nr. 57: Residential trade and industry
73
rate was low at 1.9 % per capita in 2010 and will decrease until 2050 to an
estimated plus of 1.0 %.405 The potential GDP growth rate of 4.3 % in 2010 was
the highest basis, but will have fallen to 0.5 % by 2050 according to the
forecasts.406 These databases point to a negative level and development of the
economy of Poland in the future. Nevertheless, the size of the economy in 2010
was 250.0 billion USD and is expected to have risen to 786.0 USD by 2050407,
which is the 3rd highest of the researched EU states. Also the income level of
2010 will see a shift of per-capita income from 6,563 USD to 24,547 USD in
2050,408 which will support spending in the real estate sector. The economic
conditions are summarized in the following figure.
Figure 48: Economic conditions in Poland
Source: based on European Commission (2012), p. 85, European Commission (2012), p. 301 ff.
405 Cp. European Commission (2012), p. 304. 406 Cp. European Commission (2012), p. 301. 407 Cp. HSBC Global Research (2012), p. 4 f. 408 Cp. HSBC Global Research (2012), p. 4 f.
2010 2050/60
Unemployment rate(%, 15-64))
9,80% 7,30%
GDP per capita 1,90% 1,00%
Potential GDP (growthrate)
4,30% 0,50%
0%
2%
4%
6%
8%
10%
12%
Eco
no
mic
co
nd
itio
ns

Arbeitspapiere der FOM, Nr. 57: Residential trade and industry
74
Romania (RO)
Romania covers an area of 238,391 km2.409 In 1970 the population density per
km2 was low at 85.0 people410 with an urban cluster of 40.8 % of the total
population, with rural areas representing 59.2 % in the base year 1970.411 In 2007
the average population rate per km2 had risen to 93.7 people.412 The population
density per km2 included in the last base year 2006 showed a high-density cluster
of 30.0 %, an urban cluster of 21.0 % and again a balanced rural cluster of
49.0 %.413 By 2050 the population per km2 is again expected to fall to 75.0
people414 with a high urban cluster with 77.3 % and a minor rural one of 22.6 %.415
In total this demonstrates a very high tendency towards urban clusters. In 2008
the share of owner-occupied housing was high at 96.0 %, private housing was
0.7 %, social housing 2.3 %, and 1.0 % for other housing.416
Economic conditions will also change in Romania (see figure 49). The income
per capita was the 2nd lowest after Bulgaria and was calculated at 2,596 USD in
2010; for the future it is again estimated to exhibit comparatively low movement
before reaching 20,357 USD in 2050.417 The proportion of housing costs coming
from disposable income was 25.3 % in 2009.418 This is the 2nd highest after
Germany and retards the public’s buying power in the residential trade and
industry. 1,317.0 thousand people are deemed dependent on others.419 This is in
line with the normal standard of 6.2 % in comparison to the afore-mentioned
countries. By 2050 it is expected to have increased to 9.4 % equating to 1,728.0
thousand,420 again points to a stable formation. The total housing costs in
409 Cp. Ministry of the Interior and Kingdom Relations (2010), p. 19. 410 Cp. United Nations (1974), p. 110 ff. 411 Cp. United Nations (1971), p. 148 ff. 412 Cp. Ministry of the Interior and Kingdom Relations (2010), p. 19. 413 Cp. Eurostat (2012a), p. 199. 414 Cp. Geohive (w.y.b), w. p. (date of demand: 10.07.2015). 415 Cp. Geohive (w.y.a), w. p. (date of demand: 10.07.2015). 416 Cp. CECODHAS Housing Europe (2012), p. 38 ff. 417 Cp. HSBC Global Research (2012), p. 4 f. 418 Cp. CECODHAS Housing Europe (2012), p. 38 ff. 419 Cp. European Commission (2012), p. 358. 420 Cp. European Commission (2012), p. 358.
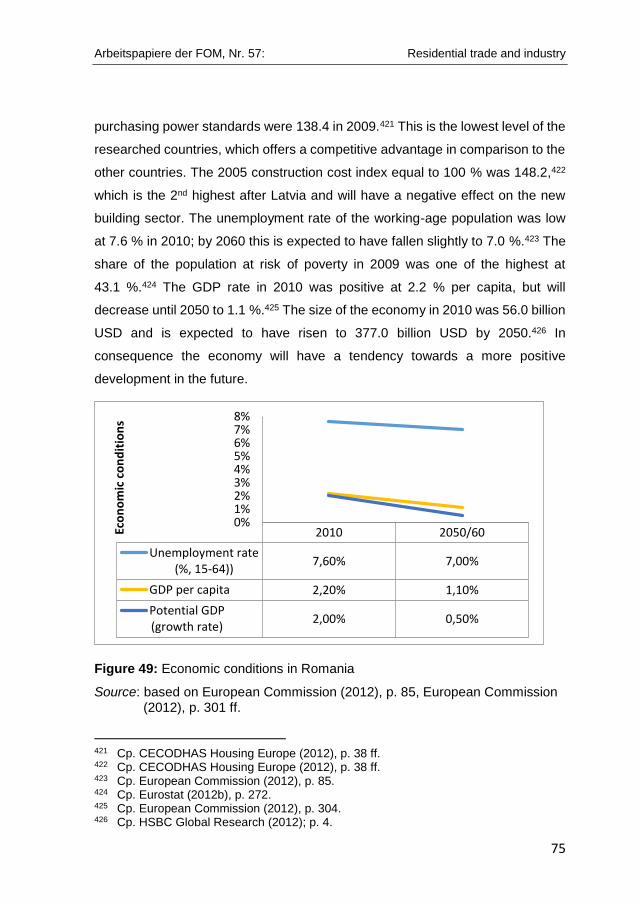
Arbeitspapiere der FOM, Nr. 57: Residential trade and industry
75
purchasing power standards were 138.4 in 2009.421 This is the lowest level of the
researched countries, which offers a competitive advantage in comparison to the
other countries. The 2005 construction cost index equal to 100 % was 148.2,422
which is the 2nd highest after Latvia and will have a negative effect on the new
building sector. The unemployment rate of the working-age population was low
at 7.6 % in 2010; by 2060 this is expected to have fallen slightly to 7.0 %.423 The
share of the population at risk of poverty in 2009 was one of the highest at
43.1 %.424 The GDP rate in 2010 was positive at 2.2 % per capita, but will
decrease until 2050 to 1.1 %.425 The size of the economy in 2010 was 56.0 billion
USD and is expected to have risen to 377.0 billion USD by 2050.426 In
consequence the economy will have a tendency towards a more positive
development in the future.
Figure 49: Economic conditions in Romania
Source: based on European Commission (2012), p. 85, European Commission (2012), p. 301 ff.
421 Cp. CECODHAS Housing Europe (2012), p. 38 ff. 422 Cp. CECODHAS Housing Europe (2012), p. 38 ff. 423 Cp. European Commission (2012), p. 85. 424 Cp. Eurostat (2012b), p. 272. 425 Cp. European Commission (2012), p. 304. 426 Cp. HSBC Global Research (2012); p. 4.
2010 2050/60
Unemployment rate(%, 15-64))
7,60% 7,00%
GDP per capita 2,20% 1,10%
Potential GDP(growth rate)
2,00% 0,50%
0%1%2%3%4%5%6%7%8%
Eco
no
mic
co
nd
itio
ns

Arbeitspapiere der FOM, Nr. 57: Residential trade and industry
76
Slovakia (SK)
Slovakia covers an area of 49,035 km2.427 In 1970 the population density in
Czechoslovakia per km2 was 113.0 people428 with an urban cluster of 47.6 % of
the total population; rural areas represented 52.4 %.429 In 2007 the average
population rate per km2 had fallen to 110.1.430 The population density per km2 in
the last base year 2006 showed a high-density cluster of 17.0 %, an urban cluster
of 35.0 % and a rural cluster of 48.0.431 This rural formation is more balanced and
stable in comparison to the other researched states in the EU. By 2050 the
population per km2 is estimated to have fallen to 102.0 people,432 but with a
growing urban cluster of 69.3 %.433 This demonstrates a high tendency towards
more urban areas. Nevertheless, in comparison to the afore-mentioned countries
it is at a relatively stable level. The tenure level in 1961 in Czechoslovakia
demonstrated something of a balance between owner-occupied housing at
50.4 % and private housing at 42.0 %.434 In 2008 the tenure status of owner-
occupied housing shifted to a high and significant formation of 92.0 %.435
The income per capita was the 3rd highest after Germany and Spain at 8,042 USD
in 2010 and is expected to have risen to 27,639 USD by 2050.436 The proportion
of housing costs taken from disposable income was calculated at 22.0 % in
2009437 and, therefore, ranks in the middle of the other analysed countries of the
EU. The size of a habitation in the free market was analysed with a high sum of
124.1 m2 on average; the average size of dwellings in regulated markets is in
comparison to the free market sizes at a low level of 59.8 m2 on average in
427 Cp. Ministry of the Interior and Kingdom Relations (2010), p. 19. 428 Cp. United Nations (1971), p. 110 ff. 429 Cp. United Nations (1971), p. 148 ff. 430 Cp. Ministry of the Interior and Kingdom Relations (2010), p. 19. 431 Cp. Eurostat (2012a), p. 199. 432 Cp. Geohive (w.y.b), w. p. (date of demand: 10.07.2015). 433 Cp. Geohive (w.y.a), w. p. (date of demand: 10.07.2015). 434 Cp. United Nations (1974), p. 56 ff. 435 Cp. CECODHAS Housing Europe (2012), p. 38 ff. 436 Cp. HSBC Global Research (2012), p. 4 f. 437 Cp. CECODHAS Housing Europe (2012), p. 38 ff.
Arbeitspapiere der FOM, Nr. 57: Residential trade and industry
77
2009.438 People dependent on others number a high share of 508.0 thousand439
or 9.4 % of the total population; in 2050 this is expected to have risen to 797.0
thousand440 which is a high level of 15.0 % and could illustrate decreasing
spending power of inhabitants in the real estate sector. The total housing costs
in purchasing power standards was 310.3 in 2009441, which is the 3rd highest
standard after Germany and Spain with an economic disadvantage in contrast to
other countries. The 2005 construction cost index equal to 100 % comes to
116.8.442 The unemployment rate of the working-age population amounted to
14.4 % in 2010; by 2060 it is estimated to have fallen to 7.3 %.443 In 2009 19.6 %
of the population was deemed at risk of poverty,444 which is the lowest among
and represents an advantage over the other afore-mentioned states. The GDP
rate in 2010 was about 3.0 % per capita, but will have fallen to 0.9 % by 2050
according to forecasts.445 In 2010 the size of the economy was 44.0 billion USD
and it is predicted to be 145.0 USD in 2050,446 which is a positive formation in
this economic field. The economic conditions are summarized in the following
figure.
438 Cp. Ministry of the Interior and Kingdom Relations (2010), p. 90. 439 Cp. European Commission (2012), p. 358. 440 Cp. European Commission (2012), p. 358. 441 Cp. CECODHAS Housing Europe (2012), p. 38 ff. 442 Cp. CECODHAS Housing Europe (2012), p. 38 ff. 443 Cp. European Commission (2012), p. 85. 444 Cp. Eurostat (2012b), p. 272. 445 Cp. European Commission (2012), p. 304. 446 Cp. HSBC Global Research (2012), p. 4.

Arbeitspapiere der FOM, Nr. 57: Residential trade and industry
78
Figure 50: Economic conditions in Slovakia
Source: based on European Commission (2012), p. 85, European Commission (2012), p. 301 ff.
Spain (ES)
Spain covers an area of 505,124 km2.447 In 1970 the population density per km2
was a low 66.0 people448 with an urban cluster of 42.9 % of the total population;
rural areas represented 57.1 %.449 In the actual base year 2000 the population
rate per km2 was calculated to have grown to 79.6.450 The population density per
km2 in 2006 revealed a high-density cluster of 43.0 %, urban cluster of 25.0 %
and rural cluster of 32 %451, which is balanced. The tenure level shifted from
45.9 % with owner-occupied status in 1950,452 to a high 85.0 % in the base year
447 Cp. Ministry of the Interior and Kingdom Relations (2010), p. 19. 448 Cp. United Nations (1971), p. 110 ff. 449 Cp. United Nations (1971), p. 148 ff. 450 Cp. Ministry of the Interior and Kingdom Relations (2010), p. 19. 451 Cp. Eurostat (2012a), p. 199. 452 Cp. United Nations (1974), p. 56 ff.
2010 2050/60
Unemployment rate(%, 15-64))
14,40% 7,30%
GDP per capita 3,00% 0,90%
Potential GDP(growth rate)
3,50% 0,60%
0%
2%
4%
6%
8%
10%
12%
14%
16%
Eco
no
mic
co
nd
itio
ns
Arbeitspapiere der FOM, Nr. 57: Residential trade and industry
79
2008.453 By 2050 the population per km2 is again expected to have risen to 96.0
people454 with an urban cluster of 86.5 % and a rural cluster of 13.5 % of the
population,455 which demonstrates a more unbalanced trend and a significant
shift towards urban living. Economic conditions are important for Spain. The 2010
income level was high with a per-capita income of 15,699.0 USD.456 This is
expected to have risen to 38,111.0 USD by 2050,457 which after Germany is the
2nd highest among the analysed countries. In 2009 the proportion of housing costs
taken from disposable income was relatively low at 18.6 %.458 The free market
rent is available at 5,100 euros per year and a size of 74.8 m2 per habitation, the
regulated market rent was 1,600 euros a year with a similar average size in
comparison to the free market level of 74.9 m2 in 2009.459 2,485 thousand people
were deemed dependent on others,460 which is relatively high. By 2050 this is
expected to have risen to 7.8 % or 4,093 thousand.461 The total housing costs in
purchasing power standards were 363.3, based on 2009462 and are the 2nd
highest after Germany and represents an economic disadvantage in the
residential trade and industry. The 2005 construction cost index equal to 100 %
was 122.3463 and ranks in the middle of the other researched countries. The
unemployment rate of the working-age population was the highest of the
evaluated states at 20.2 % in 2010; by 2060 it is expected to have fallen sharply
to 7.3 %.464 The proportion of the population at risk of poverty in 2009 was
23.4 %.465 The GDP-rate in 2010 was 0.0 % per capita, but by 2050 is expected
453 Cp. CECODHAS Housing Europe (2012), p. 38 ff. 454 Cp. Geohive (w.y.b), w. p. (date of demand: 10.07.2015). 455 Cp. Geohive (w.y.a), w. p. (date of demand: 10.07.2015). 456 Cp. HSBC Global Research (2012), p. 4 f. 457 Cp. HSBC Global Research (2012), p. 4 f. 458 Cp. CECODHAS Housing Europe (2012), p. 38 ff. 459 Cp. Ministry of the Interior and Kingdom Relations (2010), p. 90. 460 Cp. European Commission (2012), p. 358. 461 Cp. European Commission (2012), p. 358. 462 Cp. CECODHAS Housing Europe (2012), p. 38 ff. 463 Cp. CECODHAS Housing Europe (2012), p. 38 ff. 464 Cp. European Commission (2012), p. 85. 465 Cp. Eurostat (2012b), p. 272.

Arbeitspapiere der FOM, Nr. 57: Residential trade and industry
80
to have increased to 1.2 %.466 The high size of the economy in 2010 was 711
billion USD and is expected to be 1,954 billion USD in 2050.467 The economic
conditions are summarized in the following figure:
Figure 51: Economic conditions in Spain
Source: based on European Commission (2012), p. 85, European Commission (2012), p. 301 ff.
466 Cp. European Commission (2012), p. 304. 467 Cp. HSBC Global Research (2012), p. 4.
2010 2050/60
Unemployment rate(%, 15-64))
20,20% 7,30%
GDP per capita 0,00% 1,20%
Potential GDP (growthrate)
0,70% 1,20%
0%
5%
10%
15%
20%
25%
Eco
no
mic
co
nd
itio
ns
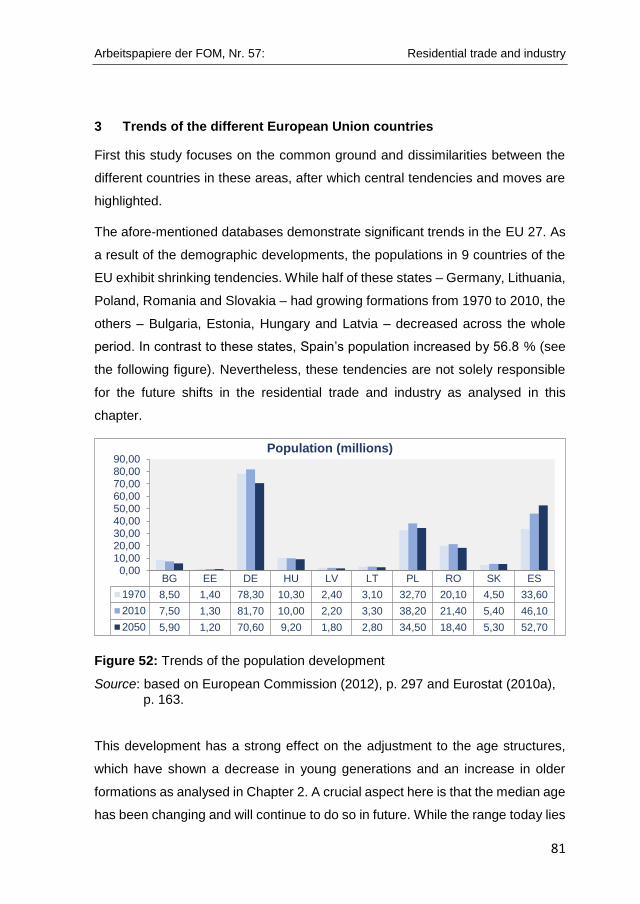
Arbeitspapiere der FOM, Nr. 57: Residential trade and industry
81
3 Trends of the different European Union countries
First this study focuses on the common ground and dissimilarities between the
different countries in these areas, after which central tendencies and moves are
highlighted.
The afore-mentioned databases demonstrate significant trends in the EU 27. As
a result of the demographic developments, the populations in 9 countries of the
EU exhibit shrinking tendencies. While half of these states – Germany, Lithuania,
Poland, Romania and Slovakia – had growing formations from 1970 to 2010, the
others – Bulgaria, Estonia, Hungary and Latvia – decreased across the whole
period. In contrast to these states, Spain’s population increased by 56.8 % (see
the following figure). Nevertheless, these tendencies are not solely responsible
for the future shifts in the residential trade and industry as analysed in this
chapter.
Figure 52: Trends of the population development
Source: based on European Commission (2012), p. 297 and Eurostat (2010a), p. 163.
This development has a strong effect on the adjustment to the age structures,
which have shown a decrease in young generations and an increase in older
formations as analysed in Chapter 2. A crucial aspect here is that the median age
has been changing and will continue to do so in future. While the range today lies
BG EE DE HU LV LT PL RO SK ES
1970 8,50 1,40 78,30 10,30 2,40 3,10 32,70 20,10 4,50 33,60
2010 7,50 1,30 81,70 10,00 2,20 3,30 38,20 21,40 5,40 46,10
2050 5,90 1,20 70,60 9,20 1,80 2,80 34,50 18,40 5,30 52,70
0,0010,0020,0030,0040,0050,0060,0070,0080,0090,00
Population (millions)

Arbeitspapiere der FOM, Nr. 57: Residential trade and industry
82
between 38.2 in Slovakia and 45.5 in Germany, the age level for 2050 will be
between 42.7 in Latvia and 51.5 in Germany, which represents the oldest
inhabitants currently and in the future. Consequently there will be movements in
the median ages with a maximum of around plus 10 years in the next 37 years
with the highest developments in Poland and Slovakia. The most balanced level
will be in Latvia with an increase of 1.2 years of the median age.468 These
tendencies of high median ages in future will change the demands of inhabitants
in reference to habitations, which will have to be constructed in a more senior-
compatible manner in future years as illustrated in the next figure.
Figure 53: Tendencies of the median age of the populations
Source: based on United Nations (2013), p. 70 ff.
Nevertheless, the tendencies in the residential trade and industry will shift mainly
in the reverse direction until 2030. With the exceptions of Germany, Latvia and
Spain, there is a growing development of households in the other countries469
468 Cp. United Nations (2013), p. 70 ff. 469 Cp. CECODHAS Housing Europe (2012), p. 38 ff. as well as United Nations (2001),
246.
BG EE DE HU LV LT PL RO SK ES
2013 43,00 40,90 45,50 40,60 41,50 39,30 38,80 39,40 38,20 41,40
2050 48,10 44,40 51,50 46,10 42,70 44,20 48,90 48,80 48,20 50,40
0,00
10,00
20,00
30,00
40,00
50,00
60,00Median age

Arbeitspapiere der FOM, Nr. 57: Residential trade and industry
83
and, therefore, an increasing tendency towards a higher demand for real estate
assets as shown in the following figure:
Figure 54: Development of the formation of the number of household
Source: based on CECODHAS Housing Europe (2012), p. 38 ff., United Nations (2001), p. 246.
As a consequence of the strong demographic movements and changing age
structures, household sizes are also changing, which is an important factor for
the real estate sector. While in the past decades there was a predominant share
of 3-and-more-person households, today there is a trend towards smaller 1- and
2-person households (see figure 55) ranging from 45.0 % in Romania to 73.0 %
in Germany470, 471 which represents an increased demand for such habitations
that will continue to grow in the future.
470 Cp. Ministry of the Interior and Kingdom Relations (2010), p. 30 and United Nations
(1974), p. 38 ff. 471 For Lithuania no data are available.
BG EE DE HU LV LT PL RO SK ES
2009 2,90 0,55 40,19 3,79 0,86 1,39 13,32 7,40 1,76 17,08
2030 3,24 0,61 38,82 3,95 0,84 1,53 14,36 8,29 2,40 12,71
-
5,00
10,00
15,00
20,00
25,00
30,00
35,00
40,00
45,00
Number of households (millions)
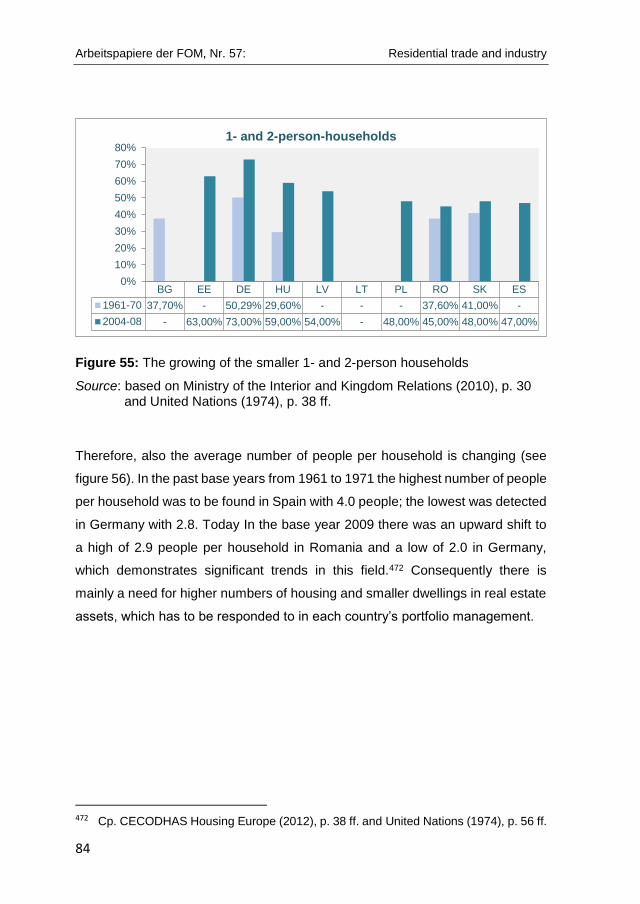
Arbeitspapiere der FOM, Nr. 57: Residential trade and industry
84
Figure 55: The growing of the smaller 1- and 2-person households
Source: based on Ministry of the Interior and Kingdom Relations (2010), p. 30 and United Nations (1974), p. 38 ff.
Therefore, also the average number of people per household is changing (see
figure 56). In the past base years from 1961 to 1971 the highest number of people
per household was to be found in Spain with 4.0 people; the lowest was detected
in Germany with 2.8. Today In the base year 2009 there was an upward shift to
a high of 2.9 people per household in Romania and a low of 2.0 in Germany,
which demonstrates significant trends in this field.472 Consequently there is
mainly a need for higher numbers of housing and smaller dwellings in real estate
assets, which has to be responded to in each country’s portfolio management.
472 Cp. CECODHAS Housing Europe (2012), p. 38 ff. and United Nations (1974), p. 56 ff.
BG EE DE HU LV LT PL RO SK ES
1961-70 37,70% - 50,29% 29,60% - - - 37,60% 41,00% -
2004-08 - 63,00% 73,00% 59,00% 54,00% - 48,00% 45,00% 48,00% 47,00%
0%
10%
20%
30%
40%
50%
60%
70%
80%1- and 2-person-households
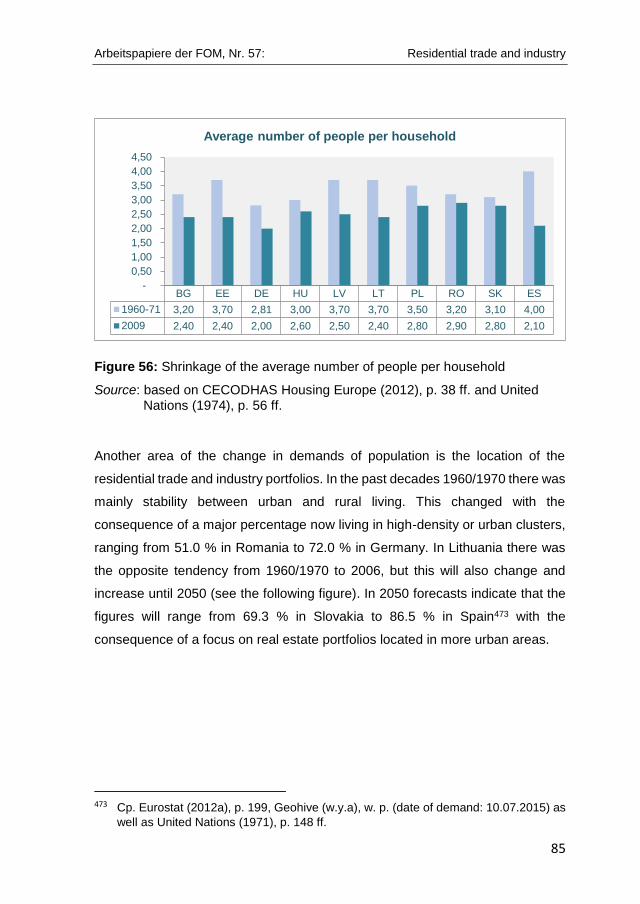
Arbeitspapiere der FOM, Nr. 57: Residential trade and industry
85
Figure 56: Shrinkage of the average number of people per household
Source: based on CECODHAS Housing Europe (2012), p. 38 ff. and United Nations (1974), p. 56 ff.
Another area of the change in demands of population is the location of the
residential trade and industry portfolios. In the past decades 1960/1970 there was
mainly stability between urban and rural living. This changed with the
consequence of a major percentage now living in high-density or urban clusters,
ranging from 51.0 % in Romania to 72.0 % in Germany. In Lithuania there was
the opposite tendency from 1960/1970 to 2006, but this will also change and
increase until 2050 (see the following figure). In 2050 forecasts indicate that the
figures will range from 69.3 % in Slovakia to 86.5 % in Spain473 with the
consequence of a focus on real estate portfolios located in more urban areas.
473 Cp. Eurostat (2012a), p. 199, Geohive (w.y.a), w. p. (date of demand: 10.07.2015) as
well as United Nations (1971), p. 148 ff.
BG EE DE HU LV LT PL RO SK ES
1960-71 3,20 3,70 2,81 3,00 3,70 3,70 3,50 3,20 3,10 4,00
2009 2,40 2,40 2,00 2,60 2,50 2,40 2,80 2,90 2,80 2,10
-
0,50
1,00
1,50
2,00
2,50
3,00
3,50
4,00
4,50
Average number of people per household

Arbeitspapiere der FOM, Nr. 57: Residential trade and industry
86
Figure 57: Movement to high-density and urban clusters
Source: based on Eurostat (2012a), p. 199, Geohive (w.y.a), w. p. (date of demand: 10.07.2015) as well as United Nations (1971), p. 148 ff.
The owner-occupied tenure also indicates a tendency towards a change in the
residential trade and industry (see figure 58).474 While the available databases
covering the past decades demonstrate a percentage of owner-occupied
habitations representing 45.9 % of the total in Spain and 71.0 % in Bulgaria, there
is currently a significant demand for own housing ranging from 42.0 % in
Germany to 96.0 % in Estonia and Romania. Germany is by far the lowest in this
area, followed by Poland with 62.4 %; nevertheless, the other researched
countries lie between 84.9 % and 96.0 %.475 Therefore, in most of these countries
apartment buildings play a minor role so that the tenures are responsible for the
realisation of adequate housing.
474 For some countries (see Figure 58) there are no additional data available. 475 Cp. CECODHAS Housing Europe (2012), p. 38 ff., cp. United Nations (1974), p. 56 ff.
BG EE DE HU LV LT PL RO SK ES
1970 50,60% 56,30% 43,30% 44,40% 56,30% 56,30% 52,00% 40,80% 47,60% 42,90%
2006 61,00% 61,00% 72,00% 57,00% 60,00% 44,00% 56,00% 51,00% 52,00% 68,00%
2050 83,41% 80,01% 83,81% 82,14% 78,08% 78,73% 73,62% 77,37% 69,32% 86,47%
0%
20%
40%
60%
80%
100%High density and urban clusters (% of population)
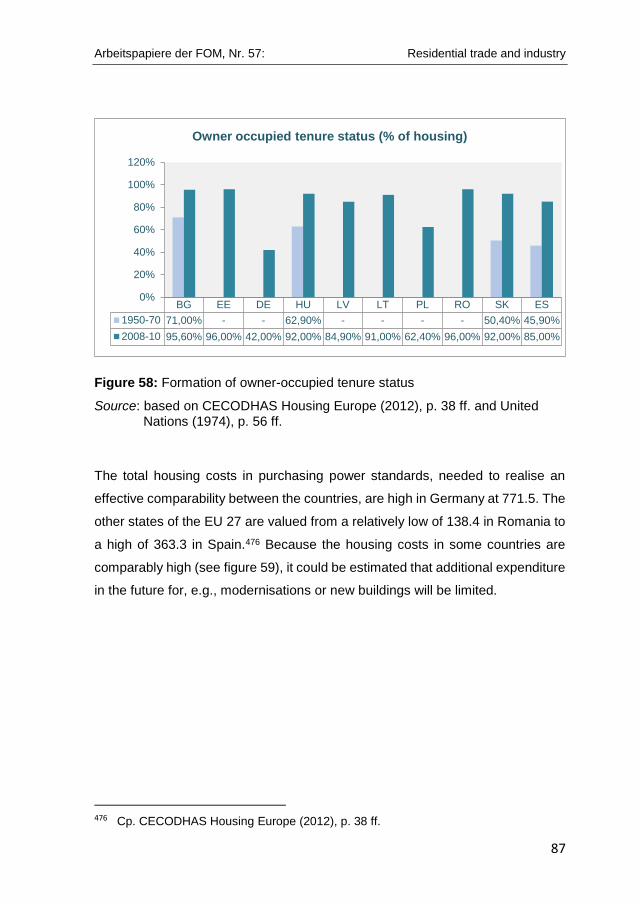
Arbeitspapiere der FOM, Nr. 57: Residential trade and industry
87
Figure 58: Formation of owner-occupied tenure status
Source: based on CECODHAS Housing Europe (2012), p. 38 ff. and United Nations (1974), p. 56 ff.
The total housing costs in purchasing power standards, needed to realise an
effective comparability between the countries, are high in Germany at 771.5. The
other states of the EU 27 are valued from a relatively low of 138.4 in Romania to
a high of 363.3 in Spain.476 Because the housing costs in some countries are
comparably high (see figure 59), it could be estimated that additional expenditure
in the future for, e.g., modernisations or new buildings will be limited.
476 Cp. CECODHAS Housing Europe (2012), p. 38 ff.
BG EE DE HU LV LT PL RO SK ES
1950-70 71,00% - - 62,90% - - - - 50,40% 45,90%
2008-10 95,60% 96,00% 42,00% 92,00% 84,90% 91,00% 62,40% 96,00% 92,00% 85,00%
0%
20%
40%
60%
80%
100%
120%
Owner occupied tenure status (% of housing)
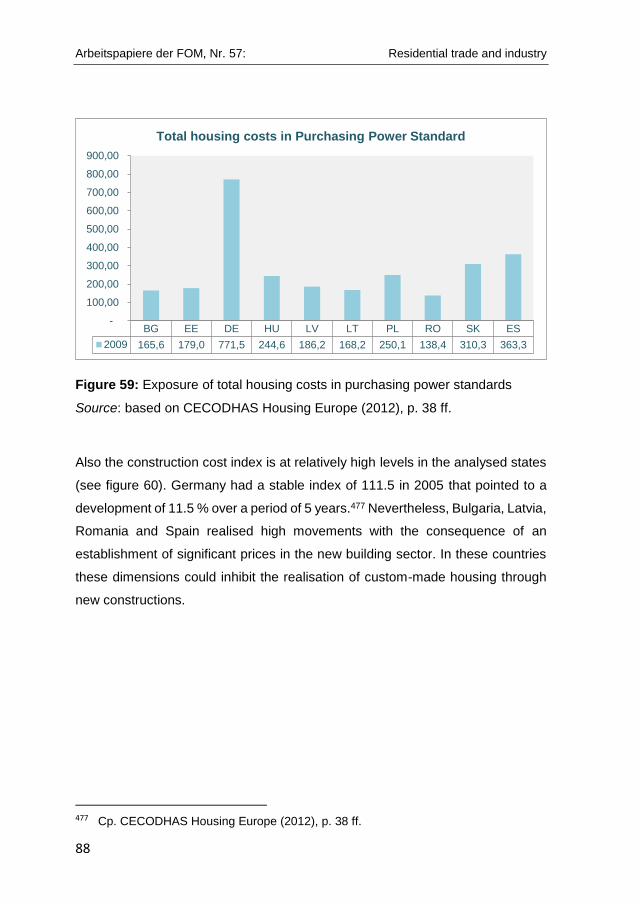
Arbeitspapiere der FOM, Nr. 57: Residential trade and industry
88
Figure 59: Exposure of total housing costs in purchasing power standards
Source: based on CECODHAS Housing Europe (2012), p. 38 ff.
Also the construction cost index is at relatively high levels in the analysed states
(see figure 60). Germany had a stable index of 111.5 in 2005 that pointed to a
development of 11.5 % over a period of 5 years.477 Nevertheless, Bulgaria, Latvia,
Romania and Spain realised high movements with the consequence of an
establishment of significant prices in the new building sector. In these countries
these dimensions could inhibit the realisation of custom-made housing through
new constructions.
477 Cp. CECODHAS Housing Europe (2012), p. 38 ff.
BG EE DE HU LV LT PL RO SK ES
2009 165,6 179,0 771,5 244,6 186,2 168,2 250,1 138,4 310,3 363,3
-
100,00
200,00
300,00
400,00
500,00
600,00
700,00
800,00
900,00
Total housing costs in Purchasing Power Standard
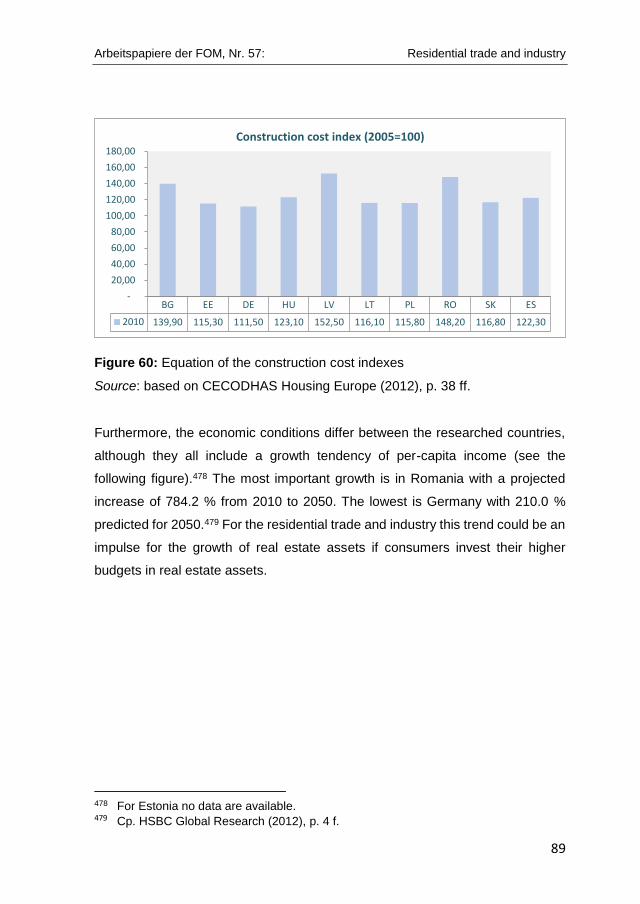
Arbeitspapiere der FOM, Nr. 57: Residential trade and industry
89
Figure 60: Equation of the construction cost indexes
Source: based on CECODHAS Housing Europe (2012), p. 38 ff.
Furthermore, the economic conditions differ between the researched countries,
although they all include a growth tendency of per-capita income (see the
following figure).478 The most important growth is in Romania with a projected
increase of 784.2 % from 2010 to 2050. The lowest is Germany with 210.0 %
predicted for 2050.479 For the residential trade and industry this trend could be an
impulse for the growth of real estate assets if consumers invest their higher
budgets in real estate assets.
478 For Estonia no data are available. 479 Cp. HSBC Global Research (2012), p. 4 f.
BG EE DE HU LV LT PL RO SK ES
2010 139,90 115,30 111,50 123,10 152,50 116,10 115,80 148,20 116,80 122,30
-
20,00
40,00
60,00
80,00
100,00
120,00
140,00
160,00
180,00
Construction cost index (2005=100)
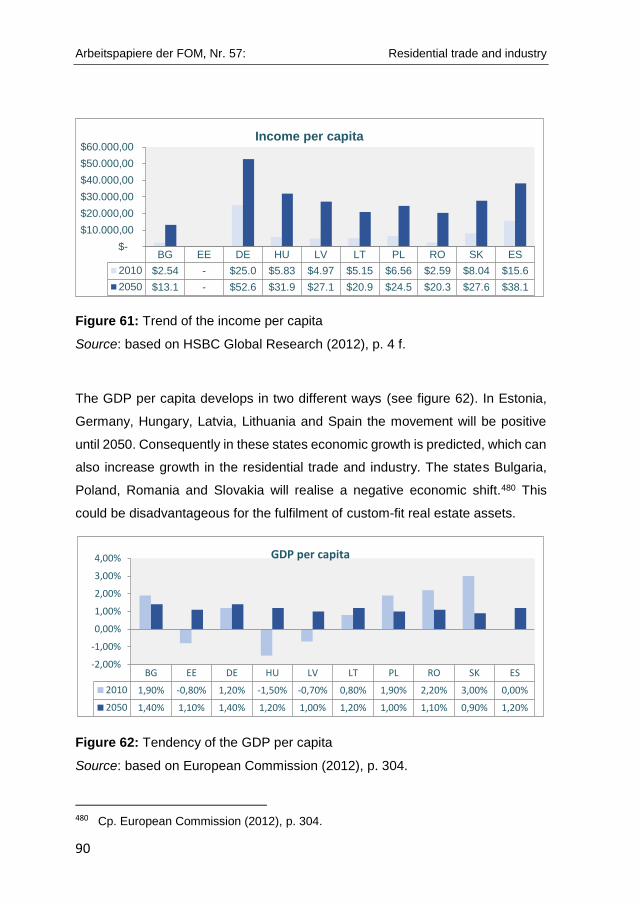
Arbeitspapiere der FOM, Nr. 57: Residential trade and industry
90
Figure 61: Trend of the income per capita
Source: based on HSBC Global Research (2012), p. 4 f.
The GDP per capita develops in two different ways (see figure 62). In Estonia,
Germany, Hungary, Latvia, Lithuania and Spain the movement will be positive
until 2050. Consequently in these states economic growth is predicted, which can
also increase growth in the residential trade and industry. The states Bulgaria,
Poland, Romania and Slovakia will realise a negative economic shift.480 This
could be disadvantageous for the fulfilment of custom-fit real estate assets.
Figure 62: Tendency of the GDP per capita
Source: based on European Commission (2012), p. 304.
480 Cp. European Commission (2012), p. 304.
BG EE DE HU LV LT PL RO SK ES
2010 $2.54 - $25.0 $5.83 $4.97 $5.15 $6.56 $2.59 $8.04 $15.6
2050 $13.1 - $52.6 $31.9 $27.1 $20.9 $24.5 $20.3 $27.6 $38.1
$-
$10.000,00
$20.000,00
$30.000,00
$40.000,00
$50.000,00
$60.000,00Income per capita
BG EE DE HU LV LT PL RO SK ES
2010 1,90% -0,80% 1,20% -1,50% -0,70% 0,80% 1,90% 2,20% 3,00% 0,00%
2050 1,40% 1,10% 1,40% 1,20% 1,00% 1,20% 1,00% 1,10% 0,90% 1,20%
-2,00%
-1,00%
0,00%
1,00%
2,00%
3,00%
4,00% GDP per capita

Arbeitspapiere der FOM, Nr. 57: Residential trade and industry
91
The percentage of the population at risk of poverty is a crucial area in the
countries (see figure 63). Slovakia has the lowest at 19.6 %; Bulgaria the highest
at 46.2 %, followed by Romania with 43.1%.481 Consequently the self-dependent
fund of consumer demand habitation assets will be a challenge in countries with
high levels in this economic area, which stands in contrast to the other positive
economic conditions mentioned above.
Source: based on Eurostat (2012b), p. 272.
Figure 63: Formation of the population at risk of poverty
In a nutshell it can be stated that there is a higher demand for residential trade
and industry assets in most of the analysed countries as a consequence of a shift
towards smaller household sizes in the EU. Consequently a focus on smaller
dwelling sizes is necessary.482 Additionally as a result of a strong increase of
older generations and the change of the median ages across the states, real
estate assets also have to respond to the needs of these growing generation
clusters and focus on a higher share of senior-compatible habitations. For the
claim of infrastructural surroundings as a conclusion of the shift to older
481 Cp. Eurostat (2012b), p. 272. 482 For some countries no additional data are available.
BG EE DE HU LV LT PL RO SK ES
2009 46,20% 23,40% 20,00% 29,60% 37,40% 29,50% 27,80% 43,10% 19,60% 23,40%
0,00%
5,00%
10,00%
15,00%
20,00%
25,00%
30,00%
35,00%
40,00%
45,00%
50,00%
Population at-risk-of-poverty (% of population)
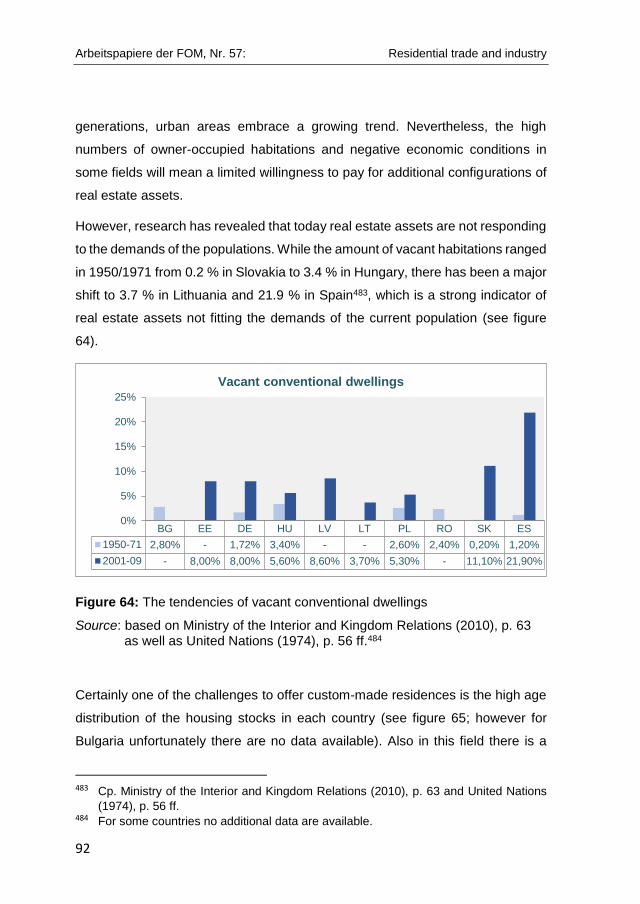
Arbeitspapiere der FOM, Nr. 57: Residential trade and industry
92
generations, urban areas embrace a growing trend. Nevertheless, the high
numbers of owner-occupied habitations and negative economic conditions in
some fields will mean a limited willingness to pay for additional configurations of
real estate assets.
However, research has revealed that today real estate assets are not responding
to the demands of the populations. While the amount of vacant habitations ranged
in 1950/1971 from 0.2 % in Slovakia to 3.4 % in Hungary, there has been a major
shift to 3.7 % in Lithuania and 21.9 % in Spain483, which is a strong indicator of
real estate assets not fitting the demands of the current population (see figure
64).
Figure 64: The tendencies of vacant conventional dwellings
Source: based on Ministry of the Interior and Kingdom Relations (2010), p. 63 as well as United Nations (1974), p. 56 ff.484
Certainly one of the challenges to offer custom-made residences is the high age
distribution of the housing stocks in each country (see figure 65; however for
Bulgaria unfortunately there are no data available). Also in this field there is a
483 Cp. Ministry of the Interior and Kingdom Relations (2010), p. 63 and United Nations
(1974), p. 56 ff. 484 For some countries no additional data are available.
BG EE DE HU LV LT PL RO SK ES
1950-71 2,80% - 1,72% 3,40% - - 2,60% 2,40% 0,20% 1,20%
2001-09 - 8,00% 8,00% 5,60% 8,60% 3,70% 5,30% - 11,10% 21,90%
0%
5%
10%
15%
20%
25%
Vacant conventional dwellings
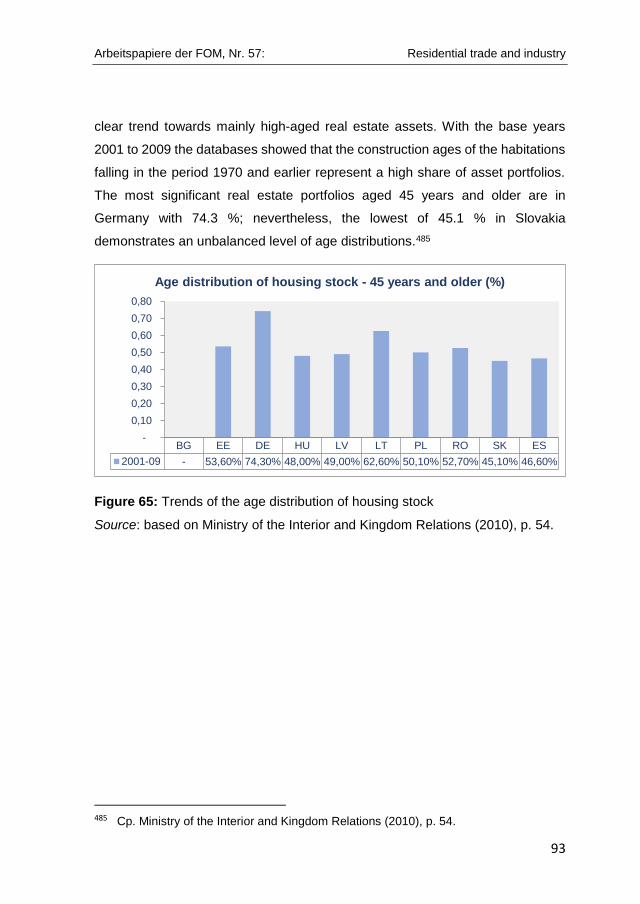
Arbeitspapiere der FOM, Nr. 57: Residential trade and industry
93
clear trend towards mainly high-aged real estate assets. With the base years
2001 to 2009 the databases showed that the construction ages of the habitations
falling in the period 1970 and earlier represent a high share of asset portfolios.
The most significant real estate portfolios aged 45 years and older are in
Germany with 74.3 %; nevertheless, the lowest of 45.1 % in Slovakia
demonstrates an unbalanced level of age distributions.485
Figure 65: Trends of the age distribution of housing stock
Source: based on Ministry of the Interior and Kingdom Relations (2010), p. 54.
485 Cp. Ministry of the Interior and Kingdom Relations (2010), p. 54.
BG EE DE HU LV LT PL RO SK ES
2001-09 - 53,60% 74,30% 48,00% 49,00% 62,60% 50,10% 52,70% 45,10% 46,60%
-
0,10
0,20
0,30
0,40
0,50
0,60
0,70
0,80
Age distribution of housing stock - 45 years and older (%)
Arbeitspapiere der FOM, Nr. 57: Residential trade and industry
95
4 Conclusion and outlook
As analysed in the previous chapters, there is a strong tendency towards deciding
demographic trends in the EU 27. On the one hand, consumers are mainly
demanding a higher number of smaller-sized dwellings as a result of changes in
the age clusters in the different countries. Because the highest increasing group
of inhabitants are the elderly, there is a necessity to realise more senior-
compatible dwellings. Furthermore, the demand to live in urban locations is
growing disproportionately. On the other hand, the current real estate market
offers high-aged buildings with an age of a minimum of 45 years that mostly hold
a tenure status. Although economic instability is evident in some areas, current
housing costs remain high and the price of newly constructed habitations is also
at an important level.
Hence, there is a strong shift in the demographic development of the countries in
the EU 27. Therefore, demands are changing and will do so in future. To stabilise
the real estate portfolios in these states, it is necessary to offer customised
residential trade and industry assets. Nevertheless, although countries comprise
analogical tendencies, it is crucial to establish real estate portfolios that conform
to the demographic, space, and environmental social economic characteristics of
each country. This additional study of real estate portfolio strategies in countries
with shrinking populations is a following research that will be published soon by
the authors.
Arbeitspapiere der FOM, Nr. 57: Residential trade and industry
97
LIST OF LITERATURE
Cecodhas Housing Europe (pub.) (2011): Housing Europe Review 2012 – The
nuts and bolts of European social housing systems. Editorial: Cecodhas
Housing Europe. Brussels, Belgium.
Cecodhas Housing Europe (pub.) (2012): Preparing the Future - Affordable
Housing and the Challenge of an Ageing Population in Europe – Success
Stories. European Year for Active Ageing and Solidarity between
Generations 2012. Editorial: Cecodhas Housing Europe. Brussels,
Belgium.
European Commission (pub.) (2012): The 2012 Ageing Report – Economic and
Budgetary projections for the 27 EU Member States (2010-2060). Editorial:
European Commission. Brussels, Belgium.
European Union (pub.) (w.y.a): EU member countries, under:
http://europa.eu/about-eu/countries/member-countries/index_en.htm, (Date
of demand: 15.07.2015).
European Union (pub.) (w.y.b): About the European Union, under:
http://europa.eu/about-eu/basic-information/about/index_en.htm, (Date of
demand: 15.07.2015).
European Union (pub.) (w.y.c): How the EU works. Brussels, Belgium, under:
http://europa.eu/about-eu/index_en.htm, (Date of demand: 20.07.2015).
Eurostat (pub.) (2010a): Europa in Zahlen - Eurostat Jahrbuch 2010. Editorial:
Eurostat. Brussels, Belgium.
Eurostat (pub.) (2010b): Income and living conditions in Europe. Editorial:
Eurostat. Brussels, Belgium.
Eurostat (pub.) (2011): Demography Report 2010 - Older, more numerous and
diverse Europeans. Editorial: Eurostat. Brussels, Belgium.
Eurostat (pub.) (2012a): Focus on territorial typologies. Editorial: Eurostat.
Brussels, Belgium.
Eurostat (pub.) (2012b): Europe in figures - Eurostat yearbook 2012. Editorial:
Eurostat. Brussels, Belgium.
Geohive (pub.) (w.y.a): Urban/ rural division of countries for 2010. Brussels,
Belgium, under: http://www.geohive.com/earth/pop_urban2.aspx, (Date of
demand: 10.07.2015).
Arbeitspapiere der FOM, Nr. 57: Residential trade and industry
98
Geohive (pub.) (w.y.b): Future Population Density. Brussels, Belgium, under:
http://www.geohive.com/earth/pop_density.aspx, (Date of demand:
10.07.2015).
HSBC Global Research (pub.) (2012): The World in 2050. Editorial: HSBC
Global Research. London, UK.
Kalusche, W. (2004): Technische Lebensdauer von Bauteilen und
wirtschaftliche Nutzungsdauer eines Gebäudes. Editorial:
Brandenburgische Technische Universität Cottbus. Cottbus, Germany.
Leal, J. (2007): Social and demographic change: Issues for housing provision
from a Spanish perspective, in: Cecodhas Social Housing (pub.): Welfare
Transformation and Demographic Change in Europe: Challenges for the
Social Housing Sector. Editorial: Cecodhas Social Housing. Brussels,
Belgium, pp. 22-35.
Ministry of the Interior and Kingdom Relations (pub.) (2010): Housing Statistics
in the European Union 2010. Editorial: Ministry of the Interior and Kingdom
Relations. Delft, Netherlands.
The American Heritage (pub.) (2013a): Dictionary of the English Language:
Bulgaria. Boston, USA, under: http://www.yourdictionary.com/bulgaria,
(Date of demand: 17.08.2015).
The American Heritage (pub.) (2013b): Dictionary of the English Language:
Estonia. Boston, USA, under: http://www.yourdictionary.com/estonia, (Date
of demand: 17.08.2015).
The American Heritage (pub.) (2013c): Dictionary of the English Language:
Germany. Boston, USA, under: http://www.yourdictionary.com/germany,
(Date of demand: 17.08.2015).
The American Heritage (pub.) (2013d): Dictionary of the English Language:
Hungary. Boston, USA, under: http://www.yourdictionary.com/hungary,
(Date of demand: 17.08.2015).
The American Heritage (pub.) (2013e): Dictionary of the English Language:
Latvia. Boston, USA, under: http://www.yourdictionary.com/latvia, (Date of
demand: 17.08.2015).
The American Heritage (pub.) (2013f): Dictionary of the English Language:
Lithuania. Boston, USA, under: http://www.yourdictionary.com/lithuania,
(Date of demand: 17.08.2015).
Arbeitspapiere der FOM, Nr. 57: Residential trade and industry
99
The American Heritage (pub.) (2013g): Dictionary of the English Language:
Poland. Boston, USA, under: http://www.yourdictionary.com/poland, (Date
of demand: 17.08.2015).
The American Heritage (pub.) (2013h): Dictionary of the English Language:
Romania. Boston, USA, under: http://www.yourdictionary.com/romania,
(Date of demand: 17.08.2015).
The American Heritage (pub.) (2013i): Dictionary of the English Language:
Slovakia. Boston, USA, under: http://www.yourdictionary.com/slovakia,
(Date of demand: 17.08.2015).
The American Heritage (pub.) (2013j): Dictionary of the English Language:
Spain. Boston, USA, under: http://www.yourdictionary.com/spain, (Date of
demand: 17.08.2015).
United Nations (pub.) (1971): Demographic Yearbook 1970. Editorial: United
Nations. New York, USA.
United Nations (pub.) (1974): Compendium of Housing Statistics 1971. Editorial:
United Nations. New York, USA.
United Nations (pub.) (2001): Compendium of Human Settlements Statistics 2001.
Editorial: United Nations. New York, USA.
United Nations (pub.) (2012): Compendium of Housing Statistics 2011. Editorial:
United Nations. New York, USA.
United Nations (pub.) (2013): World Population Prospects – The 2012 Revision
- Volume I: Comprehensive Tables. Editorial: United Nations. New York,
USA.
Arbeitspapiere der FOM, Nr. 57: Residential trade and industry
101
APPENDIX
Appendix 1 Databases demographic characteristics, past basic years ........... 102
Appendix 2 Databases demographic characteristics, actual basic years ........ 106
Appendix 3 Databases demographic characteristics, future basic years ......... 110
Appendix 4 Databases space characteristics, past basic years ...................... 115
Appendix 5 Databases space characteristics, actual basic years.................... 116
Appendix 6 Databases environmental social characteristics,
past basic years ............................................................................ 118
Appendix 7 Databases environmental social characteristics,
actual basic years ......................................................................... 123
Appendix 8 Databases environmental social characteristics,
future basic years .......................................................................... 130
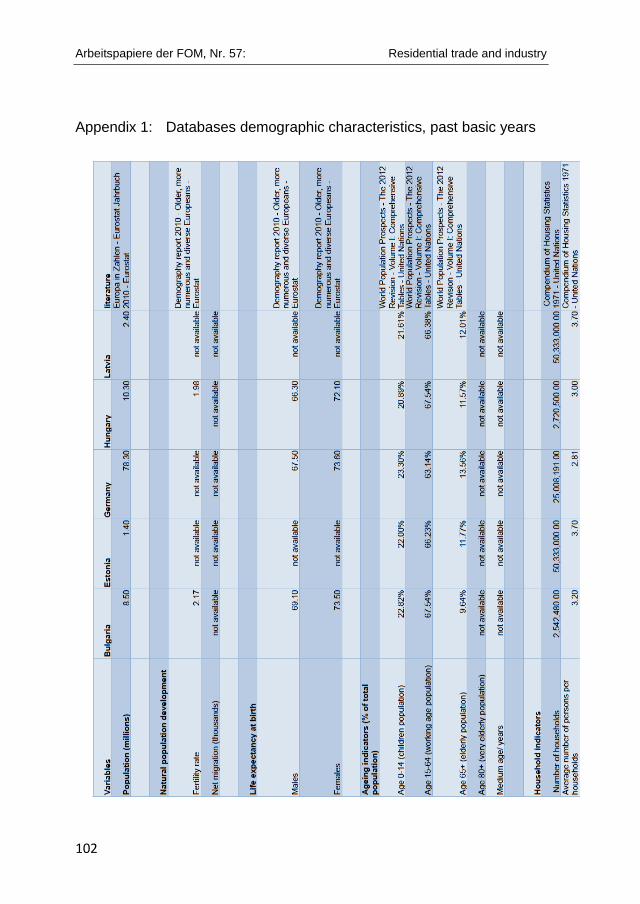
Arbeitspapiere der FOM, Nr. 57: Residential trade and industry
102
Appendix 1: Databases demographic characteristics, past basic years
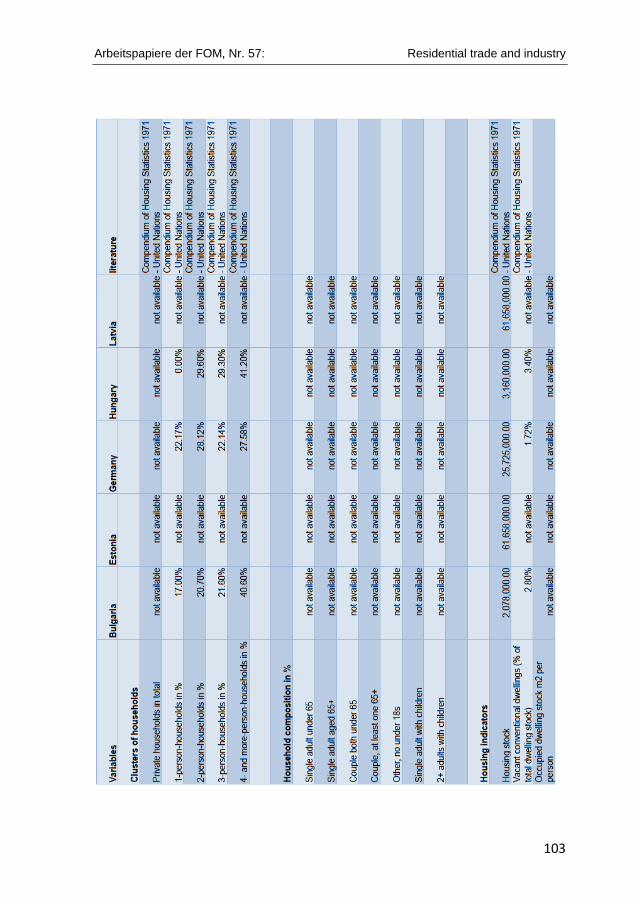
Arbeitspapiere der FOM, Nr. 57: Residential trade and industry
103

Arbeitspapiere der FOM, Nr. 57: Residential trade and industry
104

Arbeitspapiere der FOM, Nr. 57: Residential trade and industry
105
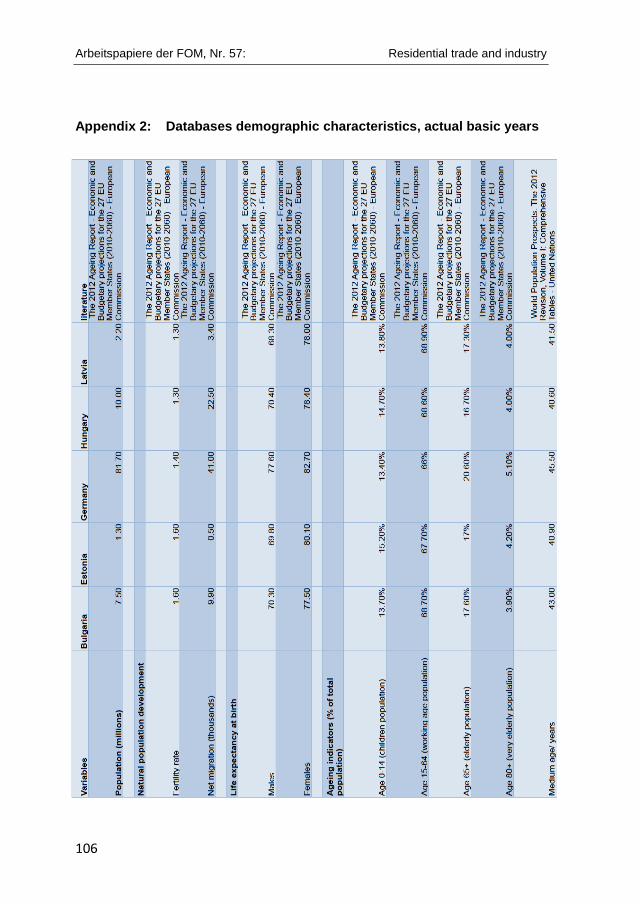
Arbeitspapiere der FOM, Nr. 57: Residential trade and industry
106
Appendix 2: Databases demographic characteristics, actual basic years

Arbeitspapiere der FOM, Nr. 57: Residential trade and industry
107
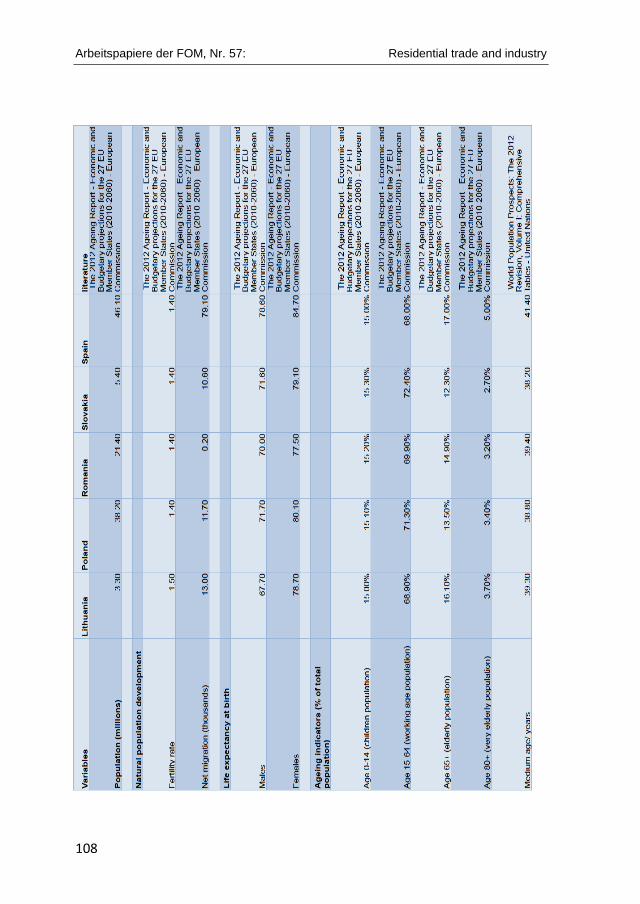
Arbeitspapiere der FOM, Nr. 57: Residential trade and industry
108
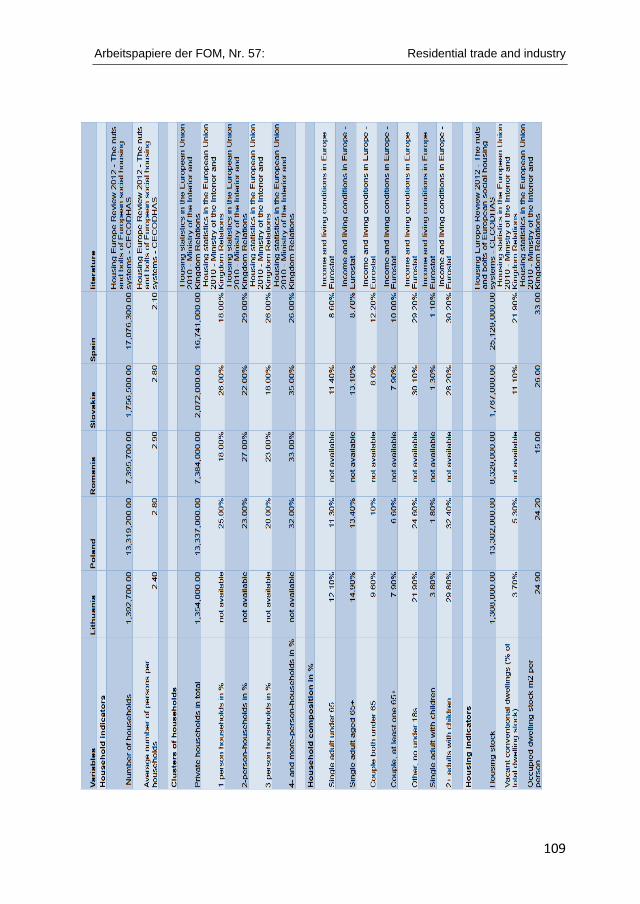
Arbeitspapiere der FOM, Nr. 57: Residential trade and industry
109
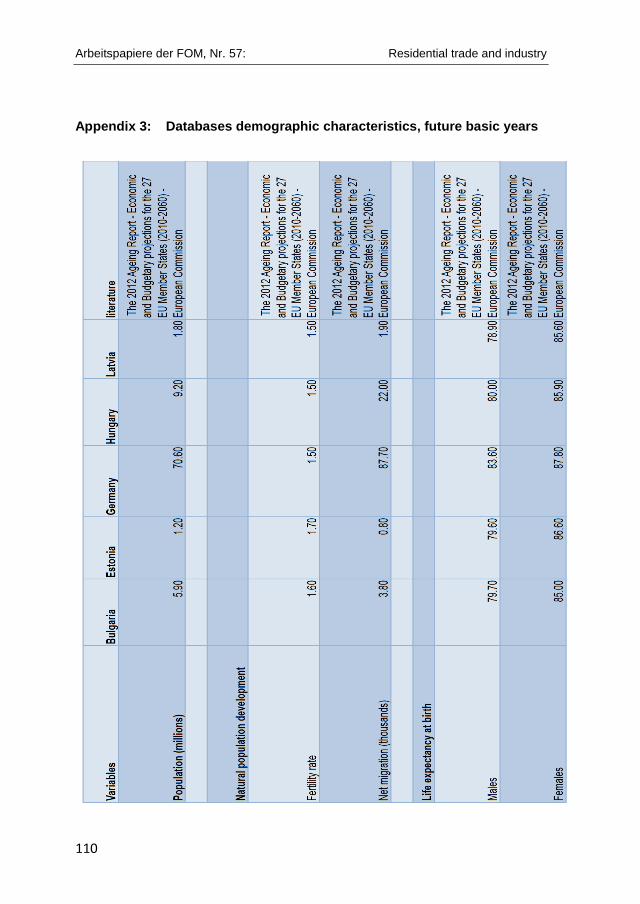
Arbeitspapiere der FOM, Nr. 57: Residential trade and industry
110
Appendix 3: Databases demographic characteristics, future basic years

Arbeitspapiere der FOM, Nr. 57: Residential trade and industry
111
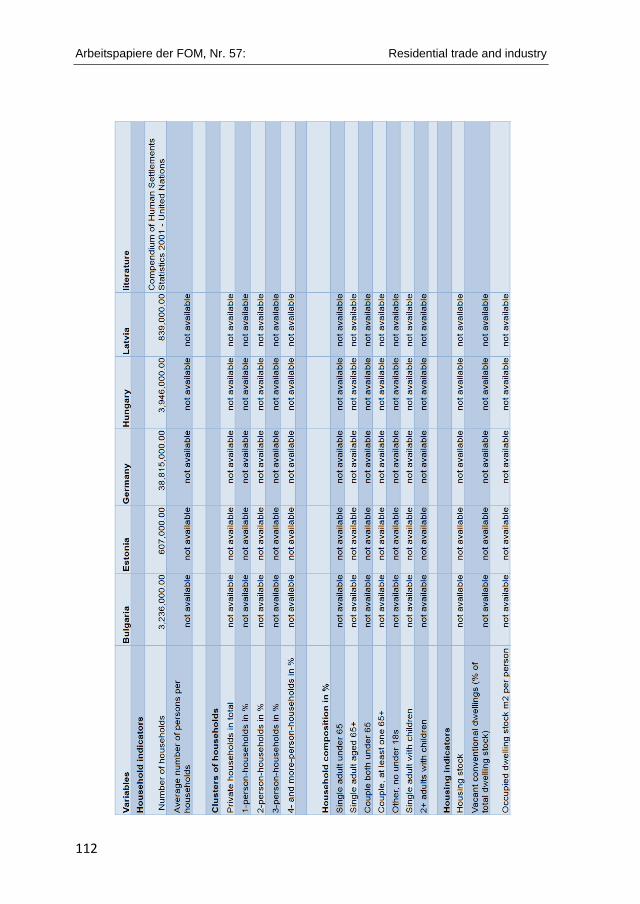
Arbeitspapiere der FOM, Nr. 57: Residential trade and industry
112
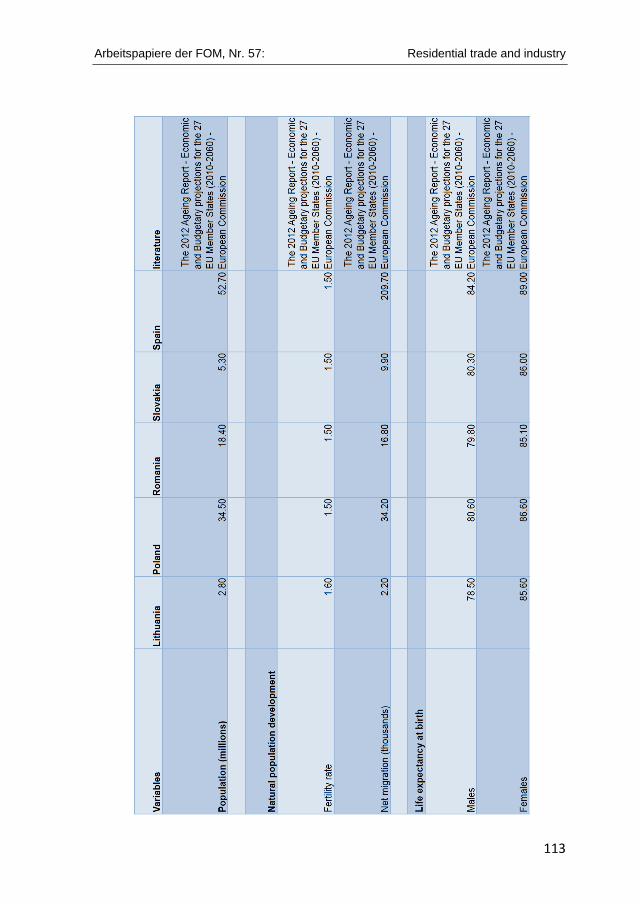
Arbeitspapiere der FOM, Nr. 57: Residential trade and industry
113

Arbeitspapiere der FOM, Nr. 57: Residential trade and industry
114

Arbeitspapiere der FOM, Nr. 57: Residential trade and industry
115
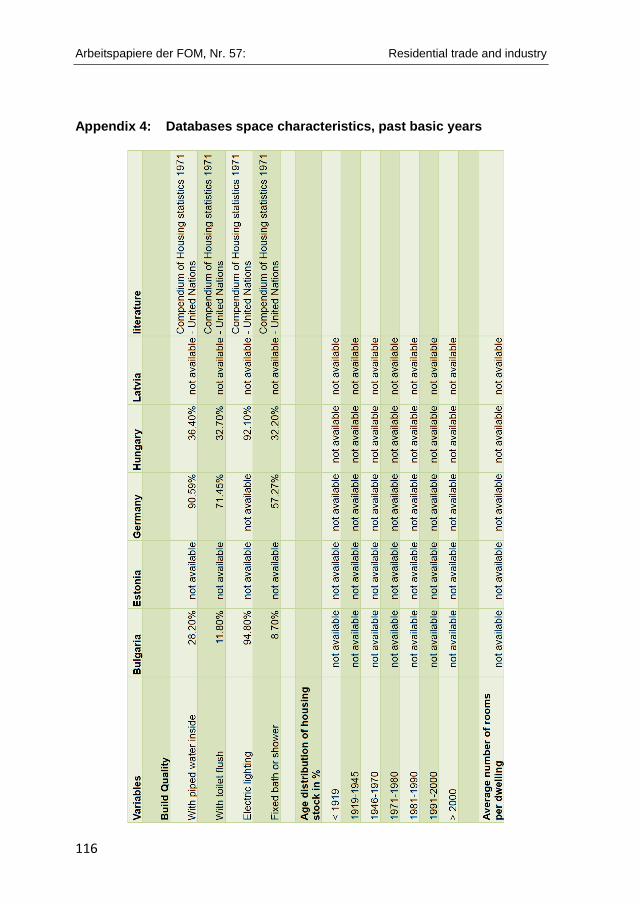
Arbeitspapiere der FOM, Nr. 57: Residential trade and industry
116
Appendix 4: Databases space characteristics, past basic years

Arbeitspapiere der FOM, Nr. 57: Residential trade and industry
117

Arbeitspapiere der FOM, Nr. 57: Residential trade and industry
118
Appendix 5 Databases space characteristics, actual basic years

Arbeitspapiere der FOM, Nr. 57: Residential trade and industry
119
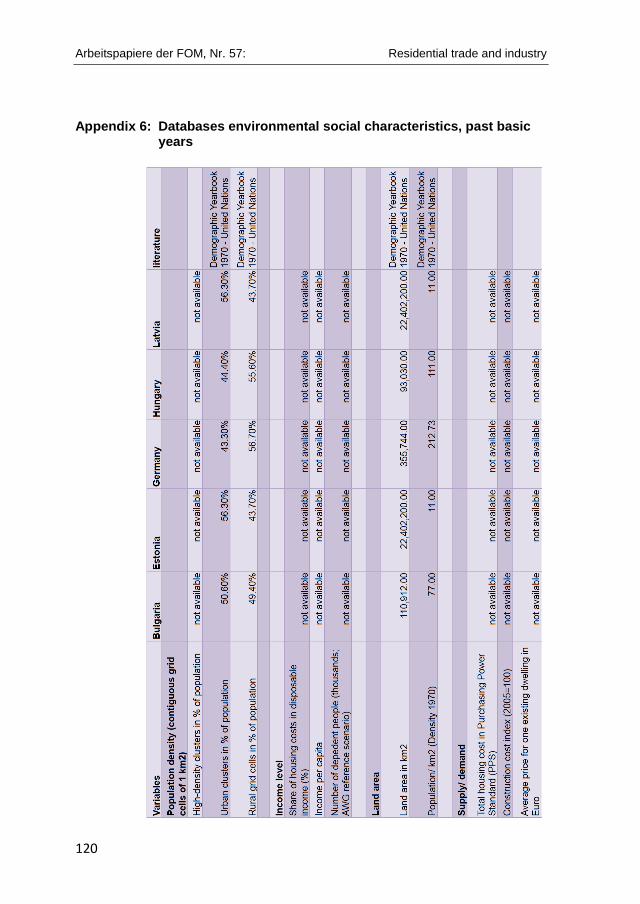
Arbeitspapiere der FOM, Nr. 57: Residential trade and industry
120
Appendix 6: Databases environmental social characteristics, past basic years
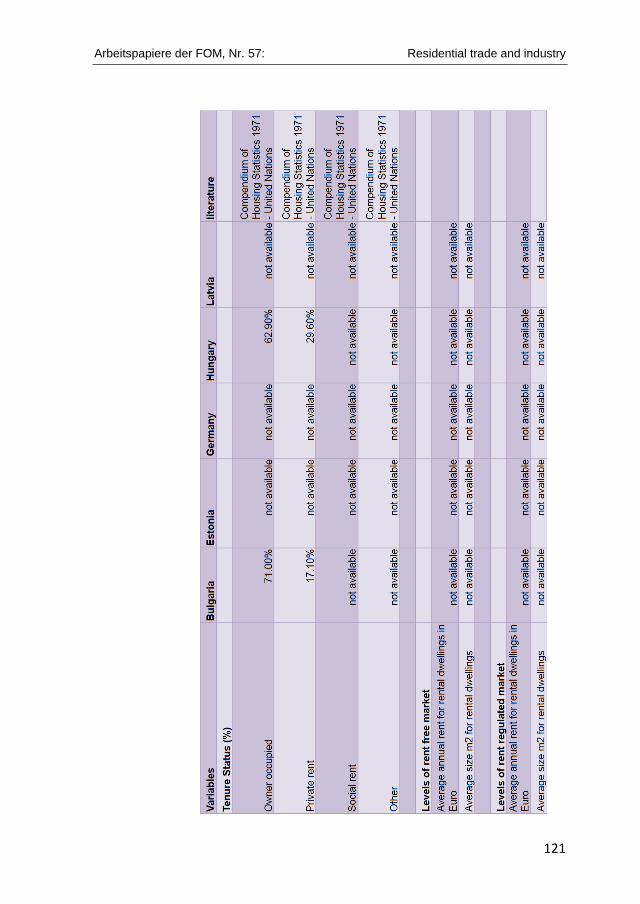
Arbeitspapiere der FOM, Nr. 57: Residential trade and industry
121
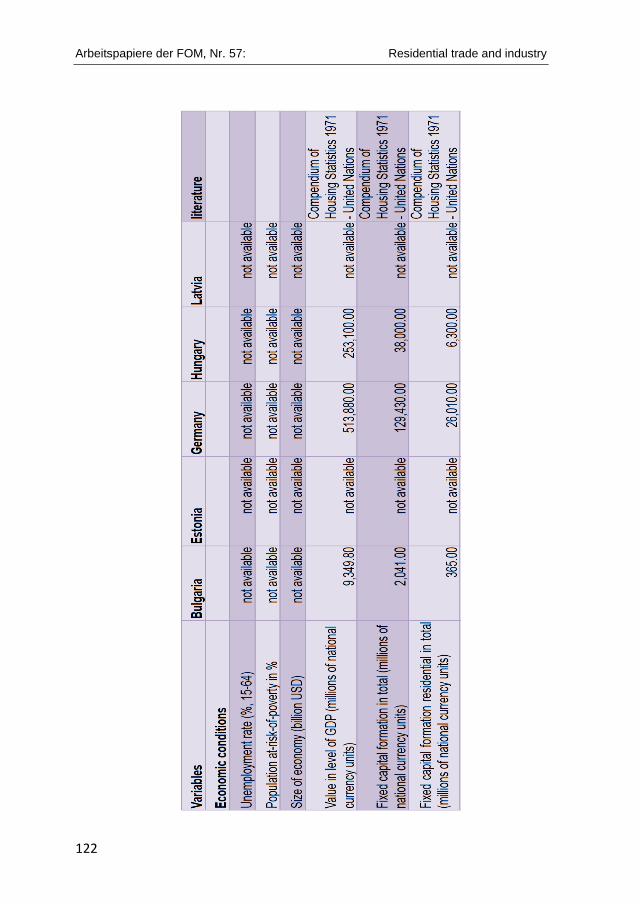
Arbeitspapiere der FOM, Nr. 57: Residential trade and industry
122

Arbeitspapiere der FOM, Nr. 57: Residential trade and industry
123
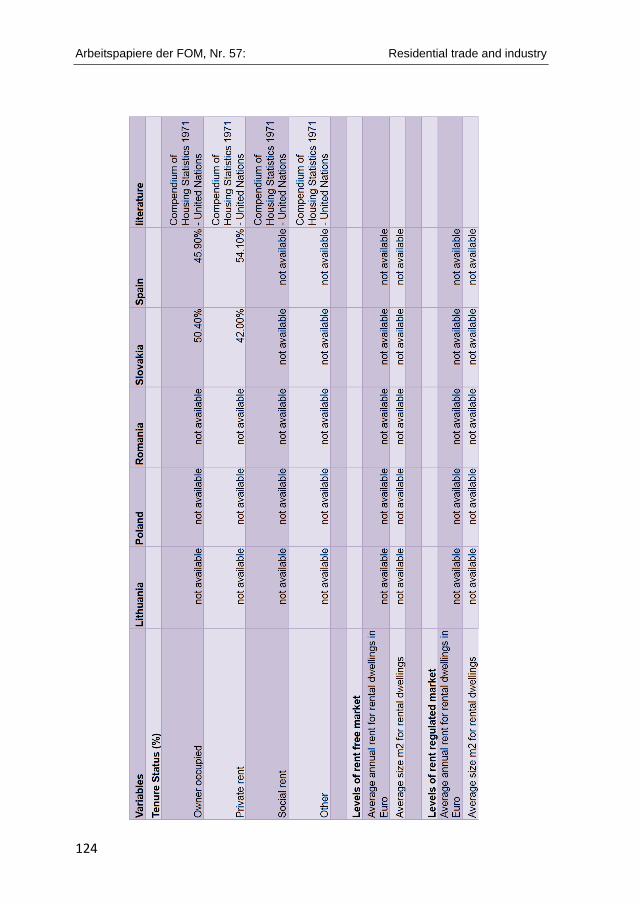
Arbeitspapiere der FOM, Nr. 57: Residential trade and industry
124

Arbeitspapiere der FOM, Nr. 57: Residential trade and industry
125
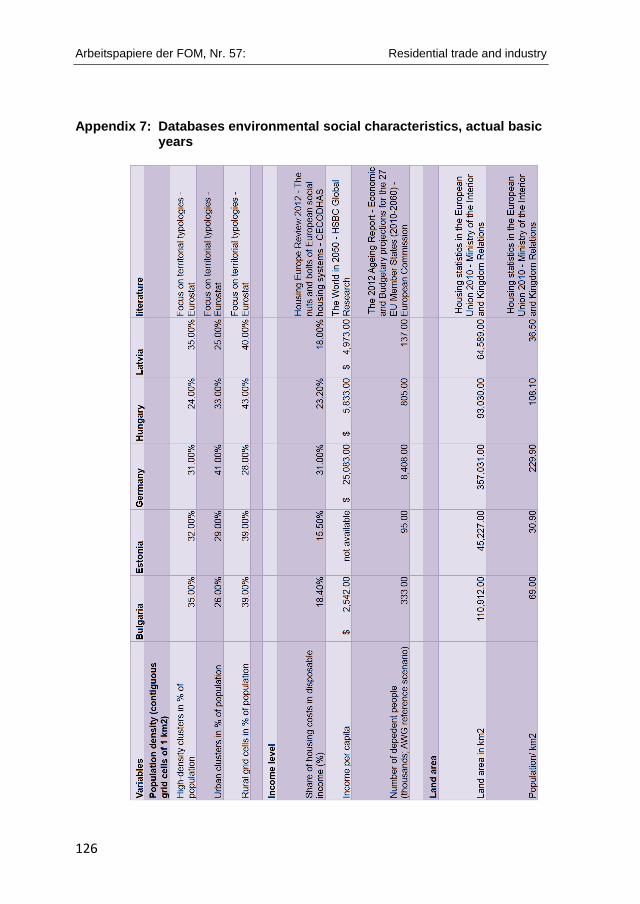
Arbeitspapiere der FOM, Nr. 57: Residential trade and industry
126
Appendix 7: Databases environmental social characteristics, actual basic years

Arbeitspapiere der FOM, Nr. 57: Residential trade and industry
127
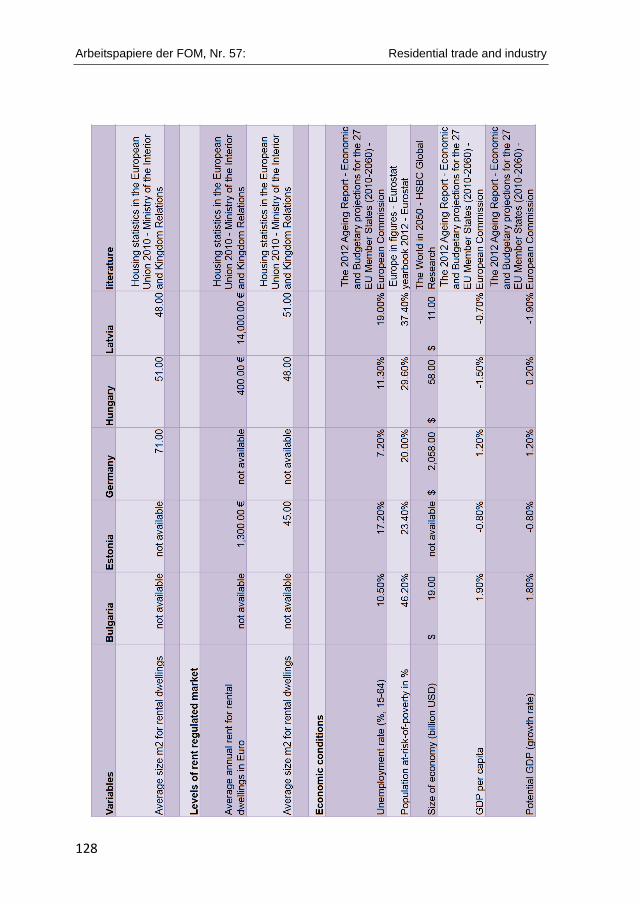
Arbeitspapiere der FOM, Nr. 57: Residential trade and industry
128

Arbeitspapiere der FOM, Nr. 57: Residential trade and industry
129
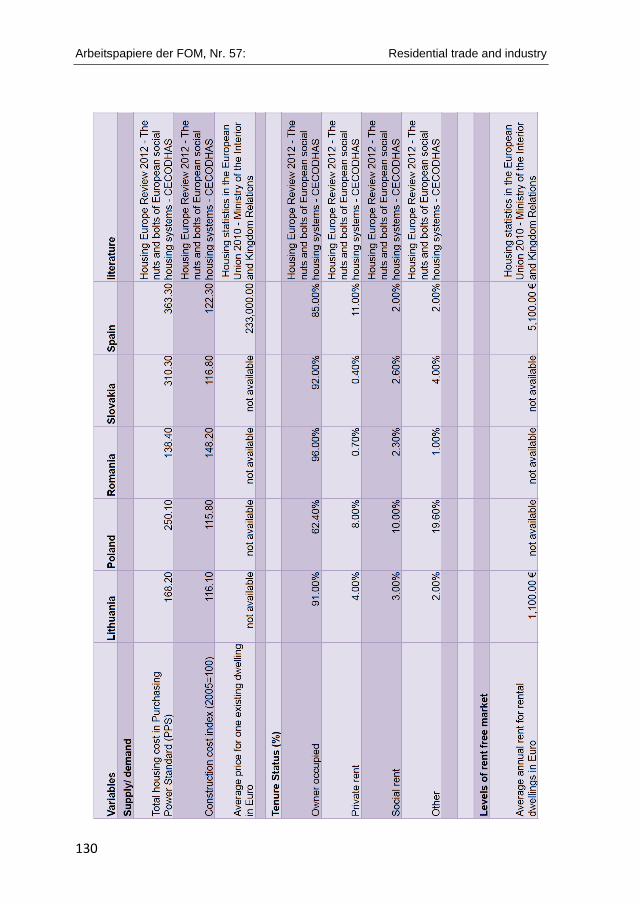
Arbeitspapiere der FOM, Nr. 57: Residential trade and industry
130
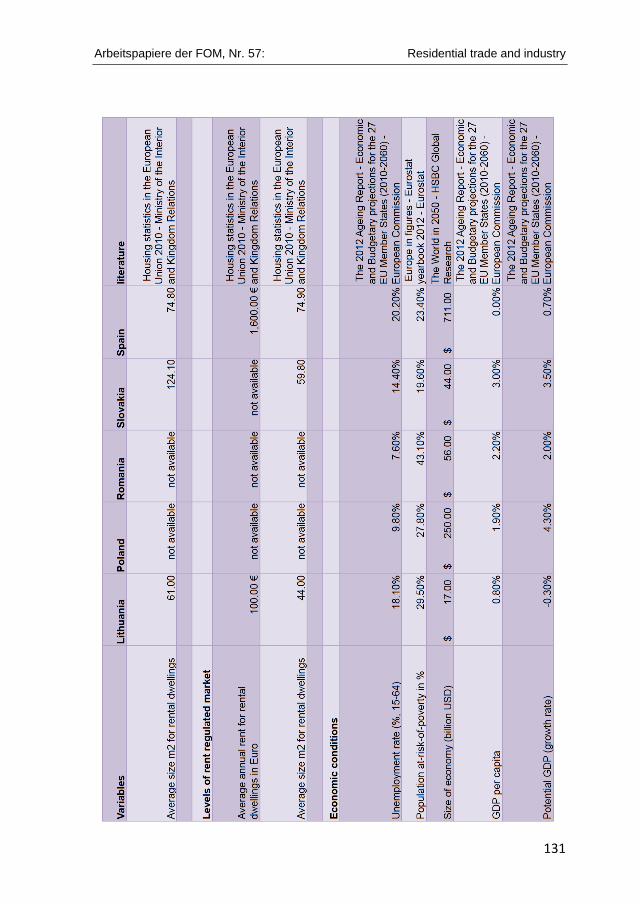
Arbeitspapiere der FOM, Nr. 57: Residential trade and industry
131

Arbeitspapiere der FOM, Nr. 57: Residential trade and industry
132
Appendix 8: Databases environmental social characteristics, future basic years
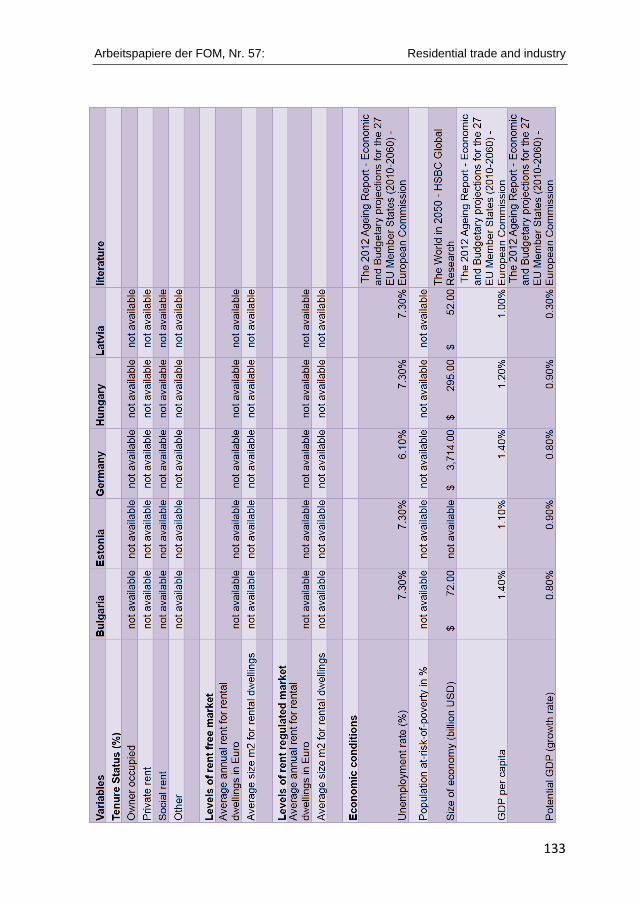
Arbeitspapiere der FOM, Nr. 57: Residential trade and industry
133
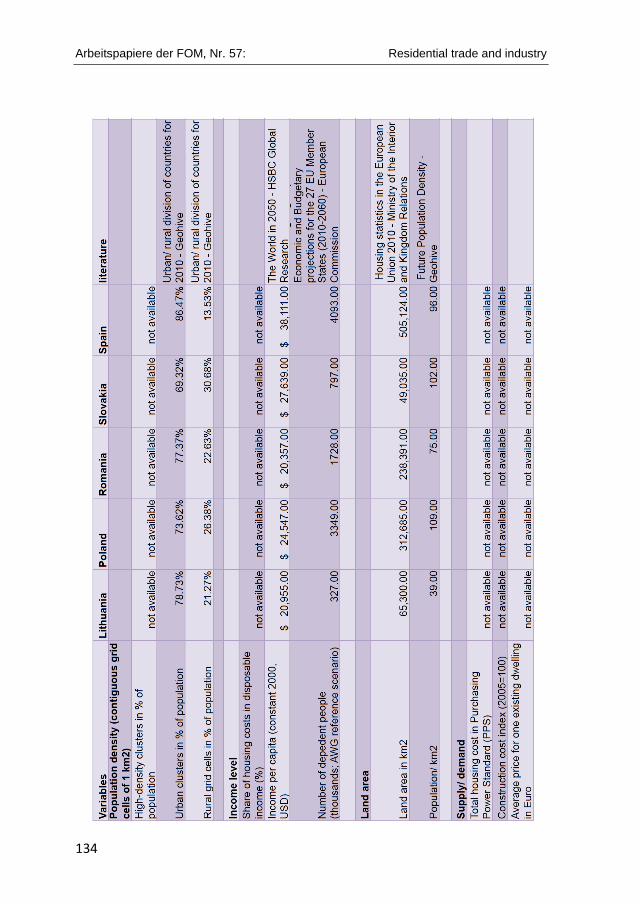
Arbeitspapiere der FOM, Nr. 57: Residential trade and industry
134
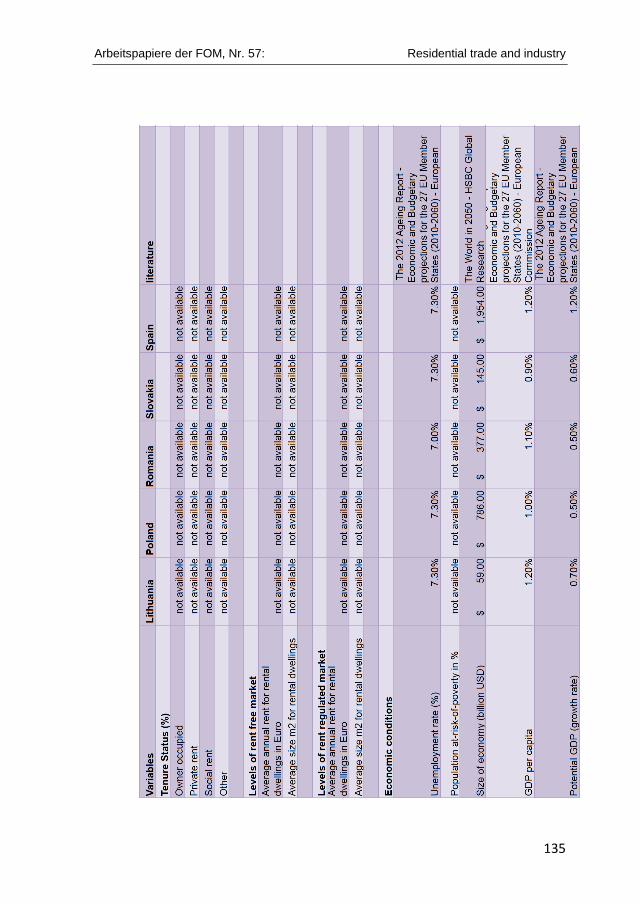
Arbeitspapiere der FOM, Nr. 57: Residential trade and industry
135

Folgende Bände sind bisher in dieser Reihe erschienen: Band 1 (2005) Hermeier, Burghard / Frère, Eric / Heuermann, Marina Ergebnisse und Effekte des Modellprojektes „Fit machen fürs Rating...“ ISSN 1865-5610 Band 2 (2006) Hermeier, Burghard / Platzköster, Charlotte Ergebnisse der ersten bundesweiten FOM-Marktstudie „Industrie-Dienstleistungen“ ISSN 1865-5610 Band 3 (2006) Kern, Uwe / Pankow, Michael Die Stärkung des traditionellen 3-stufigen Vertriebswegs im Sanitärmarkt durch den Einsatz neuer Medien ISSN 1865-5610 Band 4 (2006) Kürble, Peter Die unternehmensinterne Wertschöpfungskette bei Dienstleistungen am Beispiel der TV-Programmveranstalter ISSN 1865-5610 Band 5 (2007) Klumpp, Matthias Begriff und Konzept Berufswertigkeit ISSN 1865-5610 Band 6 (2007) Klumpp, Matthias / Jasper, Anke Efficient Consumer Response (ECR) in der Logistikpraxis des Handels ISSN 1865-5610 Band 7 (2007) Klumpp, Matthias / Koppers, Laura Kooperationsanforderungen im Supply Chain Management (SCM) ISSN 1865-5610

Band 8 (2008) Klumpp, Matthias Das deutsche System der Berufsbildung im europäischen und internationalen Qualifikationsrahmen ISSN 1865-5610 Band 9 (2008) Göke, Michael Homo oeconomicus im Hörsaal – Die Rationalität studentischer Nebengespräche in Lehrveranstaltungen ISSN 1865-5610 Band 10 (2008) Klumpp, Matthias / Rybnikova, Irma Internationaler Vergleich und Forschungsthesen zu Studienformen in Deutschland ISSN 1865-5610 Band 11 (2008) Kratzsch, Uwe Eine ökonomische Analyse einer Ausweitung des Arbeitnehmer-Entsendegesetzes ISSN 1865-5610 Band 12 (2009) Friedrich, Klaus Organisationsentwicklung – Lernprozesse im Unternehmen durch Mitarbeiterbefragungen ISSN 1865-5610 Band 13 (2009) Chaudhuri, Arun Die Outsourcing/Offshoring Option aus der Perspektive der Neuen Institutionenökonomie ISSN 1865-5610 Band 14 (2009) Seng, Anja / Fleddermann, Nicole / Klumpp, Matthias Der Bologna-Prozess Hintergründe – Zielsetzung – Anforderungen ISSN 1865-5610
Band 15 (2009) Jäschke, Thomas Qualitätssteigerung bei gleichzeitigen Einsparungen – Widerspruch oder Zukunft in der hausärztlichen Versorgung? ISSN 1865-5610 Band 16 (2010) Schütte, Michael Beiträge zur Gesundheitsökonomie ISSN 1865-5610 Band 17 (2010) Bode, Olaf H. / Brimmen, Frank / Redeker, Ute Die Einführung eines Mindestlohns in Deutschland – Eine Makroökonomische Analyse Introduction of a Minimum Wage in Germany – A Macroeconomic Analysis ISSN 1865-5610 Band 18 (2011) Nietsch, Cornelia / Weiffenbach, Hermann Wirtschaftsethik – Einflussfaktoren ethischen Verhaltens in Unternehmen ISSN 1865-5610 Band 19 (2011) Frère, Eric / Schyra, Andreas Ausgewählte steuerliche Einflussfaktoren der Unternehmensbewertung ISSN 1865-5610 Band 20 (2011) Schulenburg, Nils / Jesgarzewski, Tim Das Direktionsrecht des Arbeitgebers – Einsatzmöglichkeiten und Grenzen ISSN 1865-5610 Band 21 (2011) Fichtner-Rosada, Sabine Interaktive Hochschuldidaktik als Erfolgsfaktor im Studium für Berufstätige – Herausforderung und kompetenzorientierte Umsetzung ISSN 1865-5610

Band 22 (2011) Kern, Uwe / Negri, Michael, Whyte, Ligia Needs of the Internet Industry ISSN 1865-5610 Band 23 (2011) Schütte, Michael Management in ambulanten Sektor des Gesundheitswesens ISSN 1865-5610 Band 24 (2011) Holtfort, Thomas Intuition, Risikowahrnehmung und Investmententscheidungen – Behaviorale Einflussfaktoren auf das Risikoverhalten privater Anleger ISSN 1865-5610 Band 25 (2012) Heinemann, Stefan / Hüsgen, Thomas / Seemann, Volker Die Mindestliquiditätsquote – Konkrete Auswirkungen auf den Wertpapier-Eigenbestand der Sparkassen ISSN 1865-5610 Band 26 (2012) Hose, Christian / Lübke, Karsten / Nolte, Thomas / Obermeier, Thomas Rating und Risikomanagement – Chancen und Risiken der Architektur des Ratingprozesses für die Validität der Ratingergebnisse ISSN 1865-5610 Band 27 (2012) Serfas, Sebastian Illustrating the distortive impact of cognitive biases on knowledge generation, focusing on unconscious availability-induced distortions and SMEs ISSN 1865-5610 Band 28 (2012) Wollenweber, Leif-Erik Customer Relationship Management im Mittelstand ISSN 1865-5610
Band 29 (2012) Nentwig, Holger / Obermeier, Thomas / Scholl, Guido Ökonomische Fitness ISSN 1865-5610 Band 30 (2012) Büser, Tobias / Stein, Holger / von Königsmarck, Imke Führungspraxis und Motivation – Empirische 360-Grad-Analyse auf Grundlage des MoKoCha-Führungsmodells und des Team Management Systems (TMS) ISSN 1865-5610 Band 31 (2012) Schulenburg, Nils / Knauer, Stefan Altersgerechte Personalentwicklung – Bewertung von Instrumenten vor dem Hintergrund des demografischen Wandels ISSN 1865-5610 Band 32 (2013) Kinne, Peter Balanced Governance – Komplexitätsbewältigung durch ausgewogenes Managen im Spannungsfeld erfolgskritischer Polaritäten ISSN 1865-5610 Band 33 (2013) Holtfort, Thomas Beiträge zur Verhaltensökonomie: Einfluss von Priming-Effekten auf rationale vs. intuitive Entscheidungen bei komplexen Sachverhalten ISSN 1865-5610 Band 34: (2013) Mahood, Ed / Kameas, Achilles / Negri, Michael Labelisation and Certification of e-Jobs – Theoretical considerations and practical approaches to foster employability in a dynamic industry ISSN 1865-5610 Band 35 (2013) Gondek, Christian / Heinemann, Stefan An insight into Drivers of Customer Satisfaction – An empirical Study of a global automotive brand ISSN 1865-5610
Band 36 (2013) Rödder, Sascha / Schütte, Michael Medizinische Versorgungszentren – Chancen und Risiken der Implementierung im ambulanten Sektor des Gesundheitswesens ISSN 1865-5610 Band 37 (2013) Abele, Thomas / Ecke, Astrid Erfolgsfaktoren von Innovationen in reifen Märkten ISSN 1865-5610 Band 38 (2013) Vatanparast, Mir Farid Betriebswirtschaftliche Elemente im Social Entrepreneurship ISSN 1865-5610 Band 39 (2013) Seidel, Marcel Die Anwendung heuristischer Regeln – Eine Übersicht am Beispiel von Fusionen ISSN 1865-5610 Band 40 (2013) Coburger, Dieter Vertragsabschlüsse auf Internetplattformen – Rechtliche Risiken und Gestaltungsmöglichkeiten am Beispiel der Internetplattform eBay ISSN: 1865-5610 Band 41 (2013) Kraus, Hans Big Data − Einsatzfelder und Herausforderungen ISSN: 1865-5610 Band 42 (2013) Schmitz, Elmar Textsammlung zur deutsch-chinesischen Wissenschaftsdialog ISSN: 1865-5610

Band 43 (2014) Bruns, Kerstin Führungskraft und Frau – manchmal ein Teufelskreis ISSN 1865-5610 Band 44 (2014) Deeken, Michael Merkmale zukunftsfähiger Unternehmen – Erkenntnisse am Beispiel der Vermögensverwaltungsbranche ISSN 1865-5610 Band 45 (2014) Holzkämper. Hilko Reformoptionen der Pflegeversicherung – Eine ordnungstheoretische Analyse ISSN 1865-5610 Band 46 (2014) Kiefer, Markus Neue Potenziale für die Krisenkommunikation von Unternehmen – Social Media und die Kommunikation von großen Infrastrukturprojekten ISSN 1865-5610 Band 47 (2014) Hose, Christian / Lübke, Carsten / Nolte, Thomas / Obermeier, Thomas Nachhaltigkeit als betriebswirtschaftlicher Wettbewerbsfaktor – Eine Propensity Score Analyse Deutscher Aktiengesellschaften ISSN 1865-5610 Band 48 (2014) Chiwitt, Ulrich Ratingagenturen – Fluch oder Segen? Eine kritische Bestandsaufnahme ISSN 1865-5610 Band 49 (2014) Kipp, Volker Aktuelle Entwicklungen in der Finanzierung mittelständischer Unternehmen ISSN 1865-5610

Band 50 (2014) Nastansky, Andreas Systemisches Risiko und systemrelevante Finanzinstitute ISSN 1865-5610 Band 51 (2014) Schat, Hans-Dieter Direkte Beteiligung von Beschäftigten – Historische Entwicklung und aktuelle Umsetzung ISSN 1865-5610 Band 52 (2014) Sosa, Fabian Anwaltskanzleien und Exportversicherungen – Konfliktlösungen für internationale Handelsgeschäfte ISSN 1865-5610 Band 53 (2014) Hose, Christian / Lübke, Karsten / Nolte, Thomas / Obermeier, Thomas Einführung von Elektromobilität in Deutschland – Eine Bestandsaufnahme von Barrieren und Lösungsansätzen ISSN 1865-5610 Band 54 (2015) Klukas, Jörg Trend Empfehlungsmarketing in der Personalbeschaffung – Einordnung und empirische Analyse ISSN 1865-5610 Band 55 (2015) Wohlmann, Monika Finanzmarktintegration in Mittelosteuropa: Eine empirische Analyse der integrativen Wirkung des Euro ISSN 1865-5610 Band 56 (2015) Rudolph, Elke Crossmedia-Kommunikation, Komponenten, Planung, Implementierung und Prozesskontrolle- illustriert mit Beispielen aus der Entertainmentbranche ISSN 1865-5610

The authors
Prof. Dr. Roberto Cervelló-Royo
holds a PhD in Economics from the UPV - Universidad
Politécnica de Valencia (Spain) and a M.Sc. in Design
Engineering. He is Assistant Professor at the Economics
and Social Sciences Department, Universidad Politécnica
de Valencia. He has been a Research Fellow in the
Department of Real Estate and Planning, University of
Reading (UK).
He has been published in the Journal of the Operational
Research Society, the Journal of Cultural Heritage
Management and Sustainable Development, Expert
Systems with Applications (an international journal),
Mathematical and Computer Modelling (an international
journal), Spanish Journal of Agricultural Research, the
Journal of Intellectual Capital and The European Journal of
Economics, and Finance and Administrative Sciences,
among others.
His research interests include international and real estate
finances, regional and urban economics, sustainable urban
development, real estate and property, residential tourism,
cultural heritage management.
Prof. Dr. Francisco Guijarro Martínez
is a Lecturer of Finance at the Business Management
School of the UPV - Universidad Politécnica de Valencia
(Spain). He has published several refereed papers in the
European Journal of Operational Research, Journal of the
Operational Research Society, Annals of Operations
Research, Computers & Operations Research,
International Journal of Business Performance and Supply
Chain Modelling, Journal of Business Economics and
Management, Service Business, Expert Systems with
Applications, etc. His research interests focus on firm
valuation, portfolio management, trading rules
development and risk analysis.

Prof. Dr. Thomas Pfahler
studied Business Administration and Economics at the
University of Bayreuth and graduated in 1990 as Diplom-
Kaufmann (Master in Business Administration equivalent)
and Diplom-Volkswirt (Master in Economics). Before he
was awarded his doctorate in Economics he worked as an
assistant professor at the Chair of Economics II at the
University of Bayreuth, where he also gained his
habilitation in 1999.
Having been appointed senior lecturer in the same year he
accepted a professorship at the HAW - University of
Applied Sciences in Hamburg in 2004. There until today he
has been teaching Public Finance and Economics and
conducting research in the fields of institutional and
educational economics as well as human capital theory.
Furthermore, he is deputy chairman of the examination
board and a member of the research board of the Faculty
of Economy and Social Affairs.
Since 2006 he teaches Financial Management and
Economics at the FOM University of Applied Sciences in
Hamburg. With his students he develops conceptual
procedures to measure processes in the cost and activity
accounting with a focus on the following business areas:
analysing weaknesses, optimising the business process,
refining of controlling instruments, implementing an
organisational and personnel development process,
promoting the potentials of managers with the help of
orientation centres, supporting and accompanying spin-
offs and privatisations, creating general and municipal
marketing concepts. He has published numerous
monographs and articles in economic journals.

Corresponding author
Marion Preuss, MBA
holds a Bachelor of Business Administration and Master of Business Administration degree. At present she is working in an international doctoral program in cooperation between the UPV – Universidad Poli- técnica de Valencia (Spain) and the HAW – University of Applied Sciences, Hamburg (Germany).
She possesses a great deal of experience in the field of demographic development in the residential trade and industry – firstly from having gained wide-ranging practical management experience in the real estate sector. She also completed a real estate education and underwent additional advanced training, and has worked in the sector for 28 years. Her business involvements range from the operational level, such as administration and sales, to the strategic level in demographic development and financial management. Nowadays she is a Lecturer of Business Management at the FOM – University of Applied Sciences, Hamburg (Germany).
ISSN 1865-5610
KCC KompetenzCentrum für Corporate Social Responsibilityder FOM Hochschule für Oekonomie & Management
FOM – eine Hochschule, viele Möglichkeiten.
Die mit bundesweit über 32.700 Studierenden größte private Hochschule Deutschlands führt seit 1993 Studiengänge für Berufstätige durch, die einen staatlich und international anerkannten Hochschulabschluss (Bachelor/Master) erlangen wollen.
Die FOM ist der anwendungsorientierten Forschung verpflichtet und verfolgt das Ziel, adaptionsfähige Lösungen für betriebliche bzw. wirtschaftsnahe oder gesellschaftliche Problemstellungen zu generieren. Dabei spielt die Verzahnung von Forschung und Lehre eine große Rolle: Kongruent zu den Masterprogrammen sind Institute und KompetenzCentren gegründet worden. Sie geben der Hochschule ein fachliches Profil und eröffnen sowohl Wissen- schaftlerinnen und Wissenschaftlern als auch engagierten Studierenden die Gelegenheit, sich aktiv in den Forschungsdiskurs einzubringen.
Weitere Informationen finden Sie unter fom.de
FOM Hochschule
Unter dem Titel »FOM forscht« gewähren Hochschullehrende der FOM Einblick in ihre Projekte.Besuchen Sie den Blog unter fom-blog.de